

Abstract
Background
DNA methylation leaves a long-term signature of smoking exposure and is one potential mechanism by which tobacco exposure predisposes to adverse health outcomes, such as cancers, osteoporosis, lung, and cardiovascular disorders.
Methods and Results
To comprehensively determine the association between cigarette smoking and DNA methylation, we conducted a meta-analysis of genome-wide DNA methylation assessed using the Illumina BeadChip 450K array on 15,907 blood derived DNA samples from participants in 16 cohorts (including 2,433 current, 6,518 former, and 6,956 never smokers). Comparing current versus never smokers, 2,623 CpG sites (CpGs), annotated to 1,405 genes, were statistically significantly differentially methylated at Bonferroni threshold of p<1×10⁻⁷ (18,760 CpGs at False Discovery Rate (FDR)<0.05). Genes annotated to these CpGs were enriched for associations with several smoking-related traits in genome-wide studies including pulmonary function, cancers, inflammatory diseases and heart disease. Comparing former versus never smokers, 185 of the CpGs that differed between current and never smokers were significant p<1×10⁻⁷ (2,623 CpGs at FDR<0.05), indicating a pattern of persistent altered methylation, with attenuation, after smoking cessation. Transcriptomic integration identified effects on gene expression at many differentially methylated CpGs.
Conclusions
Cigarette smoking has a broad impact on genome-wide methylation that, at many loci, persists many years after smoking cessation. Many of the differentially methylated genes were novel genes with respect to biologic effects of smoking, and might represent therapeutic targets for prevention or treatment of tobacco-related diseases. Methylation at these sites could also serve as sensitive and stable biomarkers of lifetime exposure to tobacco smoke.
Keywords: epigenetics, smoking, biomarker, Genome Wide Association Study, meta-analysis, methylation
Introduction
Cigarette smoking is a major causal risk factor for various diseases including cancers, cardiovascular disease (CVD), chronic obstructive pulmonary disease (COPD)1, and osteoporosis1. Worldwide cessation campaigns and legislative actions have been accompanied by a reduction in the number of cigarette smokers and corresponding increases in the number of former smokers. In the US, there are more former smokers than current smokers1. Despite the decline in the prevalence of smoking in many countries, it remains the leading preventable cause of death in the world, accounting for nearly 6 million deaths each year2.
Even decades after cessation, cigarette smoking confers long-term risk of diseases including some cancers, chronic obstructive pulmonary disease, and stroke1. The mechanisms for these long-term effects are not well understood. DNA methylation changes have been proposed as one possible explanation.
DNA methylation appears to reflect exposure to a variety of lifestyle factors3, including cigarette smoking. Several studies have shown reproducible associations between tobacco smoking and altered DNA methylation at multiple cytosine-phosphate-guanine (CpG) sites4–15. Some DNA methylation sites associated with tobacco smoking have also localized to genes related to coronary heart disease5 and pulmonary disease16. Some studies have found different associated CpGs in smokers versus non-smokers8,11. Consortium-based meta-analyses have been extremely successful in identifying genetic variants associated with numerous phenotypes, but large-scale meta-analyses of genome-wide DNA methylation data have not yet been widely employed. It is likely that additional novel loci differentially methylated in response to cigarette smoking remain to be discovered by meta-analyzing data across larger sample sizes comprising multiple cohorts. Differentially methylated loci with respect to smoking may serve as biomarkers of lifetime smoking exposure. They may also shed light on the molecular mechanisms by which tobacco exposure predisposes to multiple diseases.
A recent systematic review13 analyzed published findings across 14 epigenome-wide association studies of smoking exposure across various DNA methylation platforms of varying degrees of coverage and varying phenotypic definitions. Among these were 12 studies (comprising 4,750 subjects) that used the more comprehensive Illumina Human Methylation BeadChip 450K array (Illumina 450K), which includes and greatly expands on the coverage of the earlier 27K platform. The review compares only statistically significant published results and is not a meta-analysis which can identify signals that do not reach statistical significance in individual studies 17.
In the current study, we meta-analyzed association results between DNA methylation and cigarette smoking in 15,907 individuals from 16 cohorts in the Cohorts for Heart and Aging Research in Genomic Epidemiology (CHARGE) consortium using a harmonized analysis. Methylation was measured on DNA extracted from blood samples using the Illumina Human Methylation BeadChip 450K array. In separate analyses, we compared current smokers and past smokers to non-smokers and characterized the persistence of smoking-related CpG methylation associations with the duration of smoking cessation among former smokers. We integrated information from genome-wide association studies (GWAS) and gene expression data to gain insight into potential functional relevance of our findings for human diseases. Finally we conducted analyses to identify pathways that may explain the molecular effects of cigarette exposure on tobacco-related diseases.
Materials and Methods
Study participants
This study comprised a total of 15,907 participants from 16 cohorts of the Cohorts for Heart and Aging Research in Genetic Epidemiology Consortium (Supplementary Table 1). The 16 participating cohorts are ARIC, FHS Offspring, KORA F4, GOLDN, LBC 1921, LBC 1936, NAS, Rotterdam, Inchianti, GTP, CHS European Ancestry (EA), CHS African Ancestry (AA), GENOA, EPIC Norfolk, EPIC, and MESA. Of these, 12,161 are of European Ancestry (EA) and 3,746 are of African Ancestry (AA). The study was approved by institutional review committees for each cohort and all participants provided written informed consent for genetic research.
DNA methylation sample and measurement
For most studies, methylation was measured on DNA extracted from whole blood, but some studies used CD4+ T cells or monocytes (Supplementary Table 1). In all studies, DNA was bisulfite-converted using the Zymo EZ DNA methylation kit and assayed for methylation using the Infinium HumanMethylation 450 BeadChip, which contains 485,512 CpG sites. Details of genomic DNA preparation, bisulfite conversion, and methylation assay for each cohort can be found in the online Supplementary Materials.
Raw methylated and total probe intensities were extracted using the Illumina Genome Studio methylation module. Preprocessing of the methylated signal (M) and unmethylated signal (U) was conducted using various software tools, primarily DASEN of wateRmelon18 and BMIQ19, both of which are R packages. The methylation beta (β) values were defined as β = M/(M+U). Each cohort followed its own quality control protocols, removing poor quality or outlier samples and excluding low quality CpG sites (with detection p-value>0.01). Each cohort evaluated batch effects and controlled for them in the analysis. Details of these processes can be found in the online Supplementary Materials.
Smoking phenotype definition
Self-reported cigarette smoking status was divided into three categories. Current smokers were defined as those who have smoked at least one cigarette a day within 12 months prior to the blood draw, former smokers were defined as those who had ever smoked at least one cigarette a day, but had stopped at least 12 months prior to the blood draw, and never smokers reported never having smoked. Pack years was calculated based on self-report as the average number of cigarettes per day smoked divided by 20 multiplied by the number of years of smoking, with zero assigned to never smokers. A few cohorts recorded the number of years since each former smoker had stopped smoking.
Cohort specific analyses and meta-analysis
Each cohort analyzed its data using at least two linear mixed effect models. Each model was run separately for each CpG site. Model 1 is as follows:
| (1) |
where blood count comprises the fractions of CD4+ T-cells, CD8+ T-cells, NK cells, monocyte, and eosinophils either measured or estimated using the Houseman et al. method20. The blood count adjustment was performed only in cohorts with whole blood and leukocyte samples. Familial relationship was also accounted for in the model when applicable (e.g., for FHS, see Supplementary Material for details). Acknowledging that each cohort may be influenced by a unique set of technical factors, we allow each cohort to choose its cohort-specific technical covariates. Model 2 added to model 1 body mass index (BMI) because it is associated with methylation at some loci, making it a potential confounder21. Only three cohorts participated in model 2 analysis: FHS, KORA, and NAS. Model 3 substituted smoking phenotypes for pack years. Only three cohorts participated in model 3 analysis: FHS, Rotterdam, and Inchianti. The pack year analysis was performed only on two subsets: current vs. never smokers and former vs. never smokers. Combining all three categories would require accurate records of time of quitting, which among the three cohorts was available for only FHS. To investigate cell type differences, we removed blood counts from Model 1 and called it Model 4. Only three cohorts participated in this analysis: FHS, KORA, and NAS. All models were run with the lme4 package22 in R23, except for FHS (See Supplementary Materials for details).
Meta-analysis was performed to combine the results from all cohorts. Due to the variability of available CpG sites after quality control steps, we excluded CpG sites that were available in fewer than three cohorts. The remaining 485,381 CpG sites were then meta-analyzed with a random-effects model using the following formula:
| (2) |
where Ei is the observed effect of study i, µ is the main smoking effect, si is the between-study error for study i, and ei is the within-study error for study i, with both si and ei are assumed to be normally distributed. The model is fitted using the restricted maximum likelihood (REML) criterion in R’s metafor24 package. Multiple-testing adjustment on the resulting p-values was performed using the False Discovery Rate (FDR) method of Benjamini and Hochberg25. In addition, we also report results using the Bonferroni-corrected threshold of 1 × 10⁻⁷ (≈ 0.05/485,381).
The regression coefficient β (from meta-analysis) is interpretable as the difference in mean methylation between current and never smokers. We multiplied these by 100 to represent the percentage methylation difference where methylation ranges from 0–100%.
Literature review to identify genes previously associated with smoking and methylation
We used the same literature search strategy published previously26. A broad query of NCBI’s PubMed literature database using medical subject heading (MeSH) terms (“((((DNA Methylation[Mesh]) OR methylation)) AND ((Smoking[Mesh]) OR smoking))”) yielded 775 results when initially performed on January 8, 2015 and 789 studies when repeated to update the results on March 1, 2015. Results were reviewed by abstract to determine whether studies met inclusion criteria: 1) performed in healthy human populations, 2) agnostically examined >1,000 CpG sites at a time, 3) only cigarette exposure was considered, and 4) with public reporting of P-values and gene annotations. A total of 25 publications met inclusion criteria, listed in the fourth supplementary table of Joubert et al.26. CpG level results (P-values and gene annotations) for sites showing genome-wide statistically significant associations (FDR<0.05) were extracted and resulted in 1,185 genes previously associated with adult or maternal smoking. All CpGs annotated to these 1,185 genes were marked as “previously found.”
Gene set enrichment analysis (GSEA)
Gene-Set Enrichment Analysis (GSEA)27 was performed in the website (http://software.broadinstitute.org/gsea/msigdb/annotate.jsp) on significant findings to determine putative functions of the CpG sites. We selected gene ontology (GO) biological process (C5-BP) and collected all categories with FDR<0.05 (up to 100 categories).
Enrichment analysis for localization to different genomic features
Enrichment analysis on genomic features were performed using the annotation file supplied by the Illumina (version 1.2, downloaded from manufacturer’s website, http://support.illumina.com/array/array_kits/infinium_humanmethylation450_beadchip_kit/downloads.html), which contains information of CpG location relative to gene (i.e., body, first exon, 3’ UTR, 5’UTR, within 200 base pairs of Transcriptional Start Site [TSS200], and TSS1500), the relation of CpG site to a CpG island (i.e., island, northern shelf, northern shore, southern shelf, and southern shore), whether the CpG site is known to be in differentially methylated regions, and whether the CpG site is known to be an enhancer or a DNAse I Hypersensitive Site (DHS). Enrichment analysis was performed using one-sided Fisher’s exact set for each feature, using R’s fisher.test.
Genome-wide association study (GWAS) analysis
We intersected our results with SNPs having genome-wide association study (GWAS) p-values≤5 × 10⁻⁸ in the NHGRI GWAS catalog (accessed November 2, 2015)28. The catalog contained 9,777 SNPs annotated to 7,075 genes associated with 865 phenotypes at p≤5×10⁻⁸. To determine the genes, we looked up each significant CpG on the annotation file supplied by Illumina. Enrichment analysis was performed on a per gene basis using one-sided Fisher’s exact test.
For bone mineral phenotype enrichment, we included all SNPs containing terms “bone mineral density” or “osteoporosis”. For cardiovascular disease (CVD), we included all SNPs containing terms “cardiovascular disease”, “stroke”, “coronary disease”, “cardiomyopathy”, or “myocardial infarction”. For CVD risk factors, we included all SNPs containing terms “blood pressure”, “cholesterol”, “diabetes”, “obesity”, or “hypertension”. For overall cancer enrichment, we included all SNPs containing terms “cancer”, “carcinoma”, or “lymphoma”, while removing those pertaining to cancer treatment effects. For overall pulmonary phenotype enrichment, we included all SNPs containing terms “pulmonary disease”, “pulmonary function”, “emphysema”, “asthma”, or “airflow obstruction”.
Analysis of persistence of methylation signals with time since quitting smoking among former smokers
We examined whether smoking methylation associations were attenuated over time in the FHS cohort, which had ascertained longitudinal smoking status of over 35 years. The analysis was performed on seven dichotomous variables, indicating cessation of smoking for 5, 10, 15, 20, 25, and 30 years versus never smokers. For example, for five year cessation variable, those who quit smoking five years or more are marked as ones, while never smokers are marked as zeroes and current smokers are excluded. For this analysis, we used the pedigreemm package29 with the same set of covariates as in the primary analysis. Sites with p<0.002 across all seven variables were deemed to be statistically significant compared to never-smoker levels.
Methylation by expression (MxE) analysis
To determine transcriptomic association of each significant CpG site, we interrogated such CpG sites in the FHS gene-level methylation by expression (MxE) database, at genome-wide false discovery rate (FDR)<0.05. The MxE database was constructed from 2,262 individuals from the FHS Offspring cohort attending examination cycle eight (2005–2008) with both whole blood DNA methylation and transcriptomic data based on the Affymetrix Human Exon Array ST 1.0. Enrichment analysis was performed using a one-sided Fisher’s exact test. We defined that the methylation CpG site and the corresponding transcript are associated in cis if the location of the CpG site is within 500 kilobases of the transcript’s start location.
Analysis of ethnic discrepancy between African Ancestry (AA) and European Ancestry (EA) cohorts
Meta-analysis of the current versus never smoker results of EA cohorts (FHS, KORA, GOLDN, LBC 1921, LBC 1936, NAS, Rotterdam, Inchianti, EPIC, EPIC Norfolk, MESA, CHS-EA) was performed separately from those of AA cohorts (ARIC, GTP, GENOA, CHS-AA).
Analysis of samples types for DNA extraction
Meta-analysis was performed on the results from cohorts with whole blood/buffy coat samples (FHS, KORA, LBC 1921, LBC 1936, NAS, Rotterdam, Inchianti, GTP, CHS-EA, CHS-AA, ARIC, GENOA, EPIC, and EPIC-Norfolk). CD4+ samples in GOLDN and CD14+ samples in MESA, because they comprise single cohorts, are not meta-analyzed. Correlations of results across different cell types were performed on CpG sites with FDR<0.05 in at least one cell type.
Results
Table 1 displays the characteristics of participants in the meta-analysis. The proportion of participants reporting current smoking ranged from 4% to 33% across the different study populations. The characteristics of the participants within each cohort are provided in Supplementary Table 1.
Table 1.
Participant characteristics
| Characteristics | Current Smokers N=2,433 |
Former Smokers N=6,518 |
Never Smokers N=6,956 |
|---|---|---|---|
| Sex (% Male) | 46.3% | 55.6% | 31.7% |
| Age (years)* | 57.7 ± 7.7 | 64.8 ± 8.2 | 61.2 ± 9.7 |
| BMI (kg/m2)* | 27.3 ± 5.4 | 28.7 ± 5.0 | 28.6 ± 5.3 |
weighted mean ± pooled standard deviation across cohorts
Current versus Never Smokers
In the meta-analysis of current cigarette smokers (N=2,433) versus never smokers (N=6,956), 2,623 CpGs annotated to 1,405 genes met Bonferroni significance after correction for 485,381 tests (P<1×10⁻⁷). Based on genome-wide false discovery rate (FDR)<0.05, 18,760 CpG sites (CpGs) annotated to 7,201 genes were differentially methylated. There was a moderate inflation factor30 λ of 1.32 (Supplementary Figure 1), which is consistent with a large number of sites being impacted by smoking. Our results lend support many previously reported loci7,8,11,13, including CpGs annotated to AHRR, RARA, F2RL3, and LRRN3 (Supplementary Table 2). Not surprisingly, cg05575921 annotated to AHRR, the top CpG identified in most prior studies of smoking, was highly significant in our meta-analysis (P=4.6×10⁻²⁶; ranked 36, Supplementary Table 2) and also had the largest effect size (−18% difference in methylation) which is comparable to effect sizes in previous studies18. Of the 18,760 significant CpGs at FDR<0.05, 16,673 (annotated to 6,720 genes) have not been previously reported to be associated with cigarette smoking – these include 1,500 of the 2,623 CpGs that met Bonferroni significance. The 25 CpGs with lowest p-values for both overall and novel findings are shown in Table 2. Supplementary Table 2 provides the complete list of all CpGs that were significantly differentially methylated (FDR<0.05) in analysis of current versus never smokers. Adding body mass index (BMI) into the model did not appreciably alter the results (Supplementary Figure 2).
Table 2.
Most statistically significant CpG sites that were associated with current vs. never smoker status
| Probe ID | Chr | Location | Gene Symbol* | Coef† | S.E. | P | FDR |
|---|---|---|---|---|---|---|---|
| 25 most significant CpG sites | |||||||
| cg16145216 | 1 | 42,385,662 | HIVEP3 | 0.0298 | 0.0020 | 6.7 × 10−48 | 3.3 × 10−42 |
| cg19406367 | 1 | 66,999,929 | SGIP1 | 0.0175 | 0.0013 | 7 × 10−44 | 1.7 × 10−38 |
| cg05603985 | 1 | 2,161,049 | SKI | −0.0122 | 0.0009 | 1.8 × 10−43 | 2.8 × 10−38 |
| cg14099685 | 11 | 47,546,068 | CUGBP1 | −0.0124 | 0.0009 | 1.5 × 10−42 | 1.8 × 10−37 |
| cg12513616 | 5 | 177,370,977 | −0.0262 | 0.0020 | 6.1 × 10−41 | 5.9 × 10−36 | |
| cg03792876‡ | 16 | 73,243 | −0.0182 | 0.0014 | 7.2 × 10−38 | 5.9 × 10⁻³³ | |
| cg01097768 | 5 | 378,854 | AHRR | −0.0166 | 0.0013 | 6.8 × 10⁻³⁵ | 4.7 × 10⁻³⁰ |
| cg26856289 | 1 | 24,307,516 | SFRS13A | −0.0163 | 0.0013 | 8.6 × 10⁻³⁵ | 5.2 × 10⁻³⁰ |
| cg07954423 | 9 | 130,741,881 | FAM102A | −0.0134 | 0.0011 | 1.2 × 10⁻³⁴ | 6.3 × 10⁻³⁰ |
| cg01940273 | 2 | 233,284,934 | −0.0815 | 0.0067 | 2 × 10⁻³⁴ | 9.8 × 10⁻³⁰ | |
| cg01083131 | 16 | 67,877,413 | THAP11;CENPT | −0.0155 | 0.0013 | 3.7 × 10⁻³⁴ | 1.6 × 10⁻²⁹ |
| cg01017464 | 18 | 47,018,095 | SNORD58A; SNORD58B; RPL17 | −0.0172 | 0.0014 | 1.9 × 10⁻³³ | 7.6 × 10⁻²⁹ |
| cg06121808 | 2 | 113,404,678 | SLC20A1 | −0.0143 | 0.0012 | 2.1 × 10⁻³² | 7.9 × 10⁻²⁸ |
| cg10062919 | 17 | 38,503,802 | RARA | −0.0128 | 0.0011 | 9.2 × 10⁻³² | 3.2 × 10⁻²⁷ |
| cg20066188 | 22 | 37,678,791 | CYTH4 | −0.0252 | 0.0022 | 1.6 × 10⁻³¹ | 5.2 × 10⁻²⁷ |
| cg04551776 | 5 | 393,366 | AHRR | −0.0244 | 0.0021 | 5.8 × 10⁻³¹ | 1.8 × 10⁻²⁶ |
| cg11152412 | 15 | 74,927,688 | EDC3 | −0.0077 | 0.0007 | 1.8 × 10⁻³⁰ | 5 × 10⁻²⁶ |
| cg00073090 | 19 | 1,265,879 | −0.0196 | 0.0017 | 4.2 × 10⁻³⁰ | 1.1 × 10⁻²⁵ | |
| cg11902777 | 5 | 368,843 | AHRR | −0.0201 | 0.0018 | 9.1 × 10⁻³⁰ | 2.3 × 10⁻²⁵ |
| cg25212453 | 17 | 1,509,953 | SLC43A2 | −0.0101 | 0.0009 | 1.4 × 10⁻²⁹ | 3.5 × 10⁻²⁵ |
| cg04956244 | 17 | 38,511,592 | RARA | 0.0122 | 0.0011 | 1.5 × 10⁻²⁹ | 3.5 × 10⁻²⁵ |
| cg13951797 | 16 | 2,204,381 | TRAF7 | −0.0153 | 0.0014 | 1.6 × 10⁻²⁹ | 3.5 × 10⁻²⁵ |
| cg11028075 | 10 | 97,200,911 | SORBS1 | 0.0175 | 0.0016 | 1.7 × 10⁻²⁹ | 3.6 × 10⁻²⁵ |
| cg11700584† | 14 | 50,088,544 | RPL36AL;MGAT2 | −0.0151 | 0.0013 | 3.4 × 10⁻²⁹ | 6.8 × 10⁻²⁵ |
| cg11263997 | 11 | 70,257,280 | CTTN | 0.0050 | 0.0005 | 4.3 × 10⁻²⁹ | 8.4 × 10⁻²⁵ |
| 25 most significant novel CpG sites | |||||||
| cg11700584 | 14 | 50,088,544 | RPL36AL; MGAT2 | −0.0151 | 0.0013 | 3.4 × 10⁻²⁹ | 6.8 × 10⁻²⁵ |
| cg22417733 | 6 | 153,303,409 | FBXO5 | −0.0171 | 0.0015 | 1.5 × 10⁻²⁸ | 2.7 × 10⁻²⁴ |
| cg08118908 | 16 | 15,787,920 | NDE1 | 0.0053 | 0.0005 | 5.4 × 10⁻²⁶ | 7.1 × 10⁻²² |
| cg14003265 | 9 | 139,796,499 | TRAF2 | −0.0106 | 0.0010 | 3.2 × 10⁻²⁵ | 3.7 × 10⁻²¹ |
| cg02556393 | 3 | 168,866,705 | MECOM | −0.0162 | 0.0016 | 2.8 × 10⁻²⁴ | 2.6 × 10⁻²⁰ |
| cg01218206 | 11 | 116,933,977 | SIK3 | −0.0150 | 0.0015 | 3.1 × 10⁻²³ | 2.5 × 10⁻¹⁹ |
| cg04987734 | 14 | 103,415,873 | CDC42BPB | 0.0149 | 0.0015 | 9.0 × 10⁻²³ | 6.8 × 10⁻¹⁹ |
| cg27118035 | 16 | 31,891,978 | ZNF267 | 0.0136 | 0.0014 | 2.4 × 10⁻²² | 1.7 × 10⁻¹⁸ |
| cg18450254 | 3 | 64,200,005 | PRICKLE2 | 0.0120 | 0.0013 | 2.3 × 10⁻²¹ | 1.3 × 10⁻¹⁷ |
| cg06753787 | 2 | 220,074,208 | ZFAND2B | 0.0063 | 0.0007 | 3.2 × 10⁻²¹ | 1.8 × 10⁻¹⁷ |
| cg18158306 | 12 | 133,135,032 | FBRSL1 | 0.0102 | 0.0011 | 6.2 × 10⁻²¹ | 3.2 × 10⁻¹⁷ |
| cg19093370 | 17 | 17,110,180 | PLD6 | 0.0198 | 0.0021 | 8.7 × 10⁻²¹ | 4.4 × 10⁻¹⁷ |
| cg09182189 | 1 | 1,709,203 | NADK | −0.0104 | 0.0011 | 2.0 × 10⁻²⁰ | 9.2 × 10⁻¹⁷ |
| cg18369990 | 2 | 112,941,244 | FBLN7 | 0.0116 | 0.0013 | 2.3 × 10⁻²⁰ | 1.1 × 10⁻¹⁶ |
| cg24578857 | 17 | 17,110,207 | PLD6 | 0.0200 | 0.0022 | 3.1 × 10⁻²⁰ | 1.4 × 10⁻¹⁶ |
| cg20408402 | 10 | 72,362,452 | PRF1 | 0.0085 | 0.0009 | 7.6 × 10⁻²⁰ | 3.1 × 10⁻¹⁶ |
| cg04673446 | 22 | 39,879,951 | MGAT3 | 0.0060 | 0.0007 | 2.0 × 10⁻¹⁹ | 8.0 × 10⁻¹⁶ |
| cg06803614 | 1 | 40,133,581 | NT5C1A | −0.0088 | 0.0010 | 2.1 × 10⁻¹⁹ | 8.3 × 10⁻¹⁶ |
| cg16274678 | 1 | 154,127,952 | TPM3; NUP210L | −0.0152 | 0.0017 | 2.9 × 10⁻¹⁹ | 1.1 × 10⁻¹⁵ |
| cg07286341 | 5 | 176,923,805 | PDLIM7 | −0.0077 | 0.0009 | 3.4 × 10⁻¹⁹ | 1.3 × 10⁻¹⁵ |
| cg20674424 | 3 | 186,503,527 | MIR1248; EIF4A2; SNORA81 | −0.0091 | 0.0010 | 4.2 × 10⁻¹⁹ | 1.5 × 10⁻¹⁵ |
| cg02279625 | 15 | 78,384,520 | SH2D7 | 0.0105 | 0.0012 | 4.8 × 10⁻¹⁹ | 1.7 × 10⁻¹⁵ |
| cg03485667 | 16 | 75,143,200 | ZNRF1 | −0.0168 | 0.0019 | 5.0 × 10⁻¹⁹ | 1.8 × 10⁻¹⁵ |
| cg03531211 | 6 | 32,920,102 | HLA-DMA | −0.0108 | 0.0012 | 7.5 × 10⁻¹⁹ | 2.5 × 10⁻¹⁵ |
| cg09940677 | 14 | 103,415,458 | CDC42BPB | 0.0081 | 0.0009 | 1.0 × 10⁻¹⁸ | 3.2 × 10⁻¹⁵ |
CpG sites without gene names are intergenic. These are all included in all the analyses.
Coef stands for regression coefficients
Not previously discovered by other studies
Methylation can be either reduced or increased at CpG sites in response to smoking. For the 53.2% of FDR significant CpGs with increased methylation in response to current smoking the mean percentage difference in methylation between current and never smokers was 0.5%(SD=0.37%, range 0.06–7.3%). For 46.8% of CpGs with decreased methylation in response to current smoking the mean percentage difference was 0.65% (SD=0.56, range 0.04–18%) The volcano plot can be found in Supplementary Figure 3.
We did not observe correlation between the number of significant CpGs and either the size of the gene or the number of exons or the coverage of the methylation platform. We performed a formal enrichment test for each of the 7,201 genes in regards to the length of the gene or number of exons and found only three for which associations were observed (AHRR, PRRT1, and TNF). However, given the robust findings for a specific CpG in AHRR in multiple studies in the literature4,7,9 as well as our own, and its key role in the AHR pathway which is crucial in the response to polyaromatic hydrocarbons, such as are produced by smoking31, it seems very unlikely that the AHRR findings are false positives. Likewise there is strong support in the literature for PRRT132 and TNF33. The enrichment results for methylation platform coverage also yielded the same three genes.
In a subset of three cohorts (1,827 subjects), we investigated the association of the number of pack-years smoked with the 18,760 CpGs that were differentially methylated (FDR<0.05) between current versus never smokers. Significant dose responses were observed for 11,267 CpGs (60.1%) at FDR<0.05 (Supplementary Table 3).
To investigate the pathways implicated by these genes, we performed a gene-set enrichment analysis34 on the annotated genes. The results suggested that cigarette smoking is associated with potential changes in numerous vital molecular processes, such as signal transduction (FDR=2.8 × 10−79), protein metabolic processes (FDR=1.2 × 10−43), and transcription pathways (FDR=8.4 × 10⁻³¹). The complete list of 99 enriched molecular processes can be found in Supplementary Table 4.
Former versus Never Smokers
Meta-analysis of former (N=6,518) versus never smokers (N=6,956) restricted to the 18,760 CpG sites that were differentially methylated in current versus never smokers identified 2,568 CpGs annotated to 1,326 genes at FDR<0.05 (Supplementary Table 5). There were 185 CpGs (annotated to 149 genes) that also met Bonferroni correction (P< 0.05/18760 ≈ 2.67×10⁻⁶). There was no evidence of inflation30 (λ=0.98) (Supplementary Figure 4). We also confirmed previously reported findings for CpGs annotated to AHRR, RARA, and LRRN37,8,11,13. Effect sizes of these CpGs were all weaker than in the analysis of current versus never smokers [61.2% ±15.3% weaker] for the 2,568 CpGs that remained significantly differentially methylated in former vs. never smokers compared with current vs. never smokers. Results for the top 25 CpGs are displayed in Table 3. Adding BMI to the model did not appreciably alter the results (Supplementary Figure 5). A volcano plot can be found in Supplementary Figure 6. In a subset of three cohorts (3,349 subjects), analyses using pack-years confirmed a significant dose response for 1,804 of the 2,568 CpGs (70%) annotated to 942 genes at FDR<0.05 (Supplementary Table 6).
Table 3.
Twenty-five most statistically significant CpG sites that were associated with former vs. never smoker status
| Probe ID | Chr | Location | Gene Symbol* |
Coef† | S.E. | P | FDR |
|---|---|---|---|---|---|---|---|
| cg01940273 | 2 | 233,284,934 | −0.0234 | 0.0013 | 9.6 × 10−73 | 1.8 × 10−68 | |
| cg25189904 | 1 | 68,299,493 | GNG12 | −0.0283 | 0.0021 | 3.5 × 10−40 | 3.3 × 10−36 |
| cg12803068 | 7 | 45,002,919 | MYO1G | 0.0191 | 0.0017 | 9.3 × 10⁻³¹ | 5.8 × 10⁻²⁷ |
| cg19572487 | 17 | 38,476,024 | RARA | −0.0159 | 0.0014 | 2.2 × 10⁻³⁰ | 1.0 × 10⁻²⁶ |
| cg11554391 | 5 | 321,320 | AHRR | −0.0091 | 0.0008 | 1.0 × 10⁻²⁸ | 3.9 × 10⁻²⁵ |
| cg05951221 | 2 | 233,284,402 | −0.0396 | 0.0036 | 1.1 × 10⁻²⁷ | 3.2 × 10⁻²⁴ | |
| cg23771366 | 11 | 86,510,998 | PRSS23 | −0.0167 | 0.0015 | 1.2 × 10⁻²⁷ | 3.2 × 10⁻²⁴ |
| cg26764244 | 1 | 68,299,511 | GNG12 | −0.0119 | 0.0011 | 2.3 × 10⁻²⁷ | 5.4 × 10⁻²⁴ |
| cg05575921 | 5 | 373,378 | AHRR | −0.0406 | 0.0038 | 8.2 × 10⁻²⁷ | 1.7 × 10⁻²³ |
| cg11660018 | 11 | 86,510,915 | PRSS23 | −0.0157 | 0.0015 | 4.3 × 10⁻²⁶ | 8.1 × 10⁻²³ |
| cg21566642 | 2 | 233,284,661 | −0.0434 | 0.0041 | 1.0 × 10⁻²⁵ | 1.7 × 10⁻²² | |
| cg11902777 | 5 | 368,843 | AHRR | −0.0063 | 0.0006 | 2.8 × 10⁻²⁵ | 4.3 × 10⁻²² |
| cg26850624 | 5 | 429,559 | AHRR | 0.0118 | 0.0011 | 3.1 × 10⁻²⁵ | 4.4 × 10⁻²² |
| cg03636183 | 19 | 17,000,585 | F2RL3 | −0.0267 | 0.0026 | 8.9 × 10⁻²⁵ | 1.2 × 10⁻²¹ |
| cg15693572 | 3 | 22,412,385 | 0.0190 | 0.0019 | 1.5 × 10⁻²³ | 1.9 × 10⁻²⁰ | |
| cg17924476 | 5 | 323,794 | AHRR | 0.0148 | 0.0016 | 4.0 × 10⁻²⁰ | 4.7 × 10⁻¹⁷ |
| cg12513616 | 5 | 177,370,977 | −0.0072 | 0.0008 | 2.4 × 10⁻¹⁹ | 2.7 × 10⁻¹⁶ | |
| cg07339236 | 20 | 50,312,490 | ATP9A | −0.0062 | 0.0007 | 1.4 × 10⁻¹⁸ | 1.4 × 10⁻¹⁵ |
| cg06126421 | 6 | 30,720,080 | −0.0365 | 0.0042 | 3.0 × 10⁻¹⁸ | 3.0 × 10⁻¹⁵ | |
| cg14624207 | 11 | 68,142,198 | LRP5 | −0.0070 | 0.0008 | 5.0 × 10⁻¹⁸ | 4.7 × 10⁻¹⁵ |
| cg00706683 | 2 | 233,251,030 | ECEL1P2 | 0.0101 | 0.0012 | 1.4 × 10⁻¹⁷ | 1.2 × 10⁻¹⁴ |
| cg23351584 | 11 | 86,512,100 | PRSS23 | −0.0048 | 0.0006 | 7.0 × 10⁻¹⁷ | 6.0 × 10⁻¹⁴ |
| cg02583484 | 12 | 54,677,008 | HNRNPA1 | −0.0062 | 0.0008 | 1.0 × 10⁻¹⁵ | 8.5 × 10⁻¹³ |
| cg05302489 | 6 | 31,760,426 | VARS | 0.0079 | 0.0010 | 2.5 × 10⁻¹⁵ | 2.0 × 10⁻¹² |
| cg01442064 | 4 | 5,713,450 | EVC | −0.0055 | 0.0007 | 3.3 × 10⁻¹⁵ | 2.4 × 10⁻¹² |
CpG sites without gene names are intergenic. These are all included in all the analyses.
Coef stands for regression coefficients
The gene-set enrichment analysis27 in the former versus never smoker analyses on all 1,326 genes revealed enrichment for genes associated with protein metabolic processes (FDR=1.1 × 10⁻²³), RNA metabolic processes (FDR=1.4 × 10⁻¹⁷), and transcription pathways (FDR=3.9 × 10⁻¹⁸) (Supplementary Table 7). The gene-set enrichment analysis on the 942 genes for which the 1,804 CpGs exhibited dose responses with pack-years also revealed similar pathways to those summarized in Supplementary Table 7, except with weaker enrichment FDR values.
In 2,648 Framingham Heart Study participants with up to 30 years of prospectively collected smoking data, we examined the 2,568 CpGs that were differentially methylated in meta-analysis of former versus never smokers and explored their associations with time since smoking cessation. Methylation levels of most CpGs returned toward that of never-smokers within five years of smoking cessation. However, 36 CpGs annotated to 19 genes, including TIAM2, PRRT1, AHRR, F2RL3, GNG12, LRRN3, APBA2, MACROD2, and PRSS23 did not return to never-smoker levels even after 30 years of smoking cessation (Figure 1, Table 4).
Figure 1.
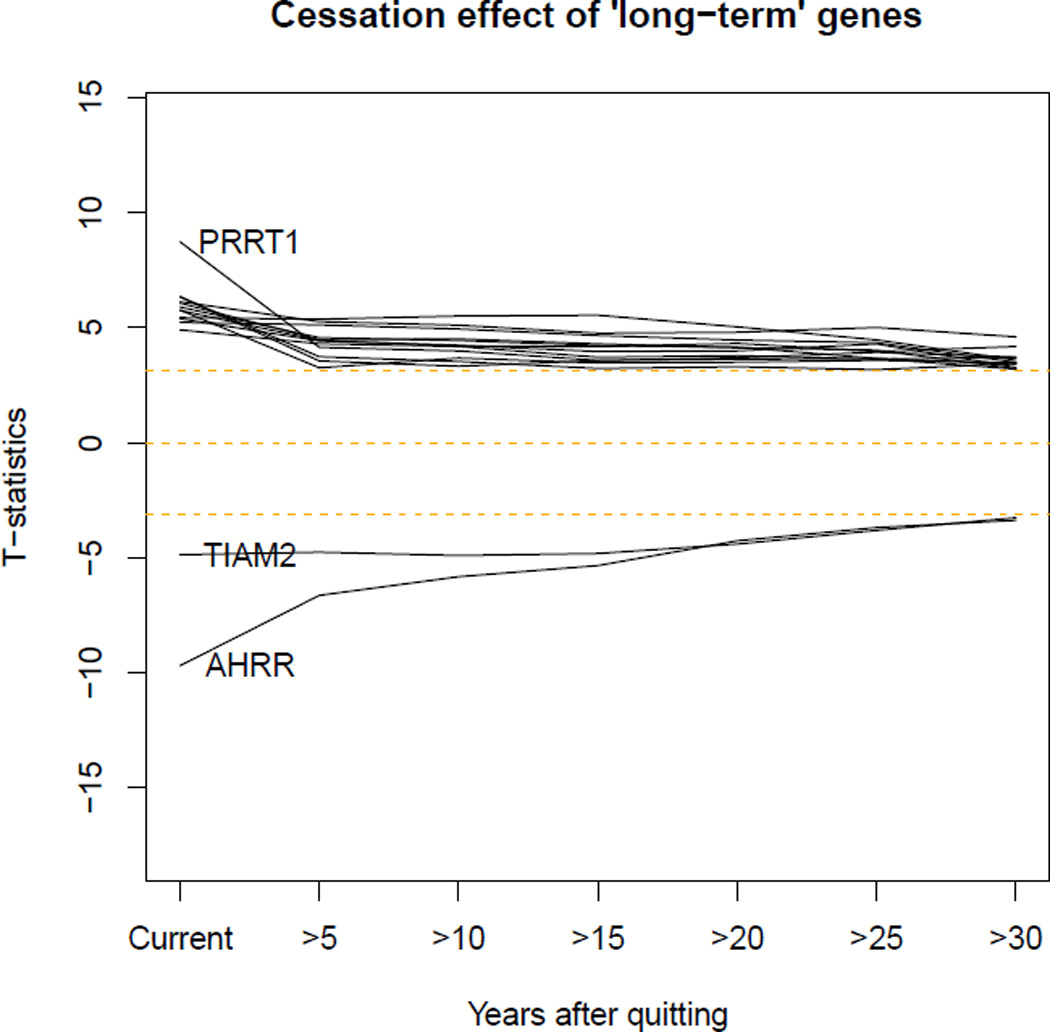
Trajectories of CpG sites that did not return to never-smoker levels within 30 years after cessation.
Table 4.
The top 36 most statistically significant CpG sites that did not return to never-smoker levels 30 years after smoking cessation in the Framingham Heart Study (N=2,648)
| Probe ID | Chr | Location | Gene Symbol | P |
|---|---|---|---|---|
| cg05951221 | 2 | 233284402 | 3.2 × 10⁻¹⁵ | |
| cg06644428 | 2 | 233284112 | 1.2 × 10⁻¹⁴ | |
| cg05575921 | 5 | 373378 | AHRR | 6.5 × 10⁻¹⁴ |
| cg21566642 | 2 | 233284661 | 8.6 × 10⁻¹⁰ | |
| cg03636183 | 19 | 17000585 | F2RL3 | 5.7 × 10⁻⁷ |
| cg06126421 | 6 | 30720080 | 1.3 × 10⁻⁶ | |
| cg01940273 | 2 | 233284934 | 1.9 × 10⁻⁶ | |
| cg23771366 | 11 | 86510998 | PRSS23 | 3.1 × 10⁻⁶ |
| cg17272563 | 6 | 32116548 | PRRT1 | 4.4 × 10⁻⁶ |
| cg23916896 | 5 | 368804 | AHRR | 1.3 × 10⁻⁵ |
| cg11660018 | 11 | 86510915 | PRSS23 | 1.3 × 10⁻⁵ |
| cg08118908 | 16 | 15787920 | NDE1 | 3.0 × 10⁻⁵ |
| cg13937905 | 12 | 53612551 | RARG | 1.5 × 10⁻⁴ |
| cg24172324 | 2 | 232258363 | 1.7 × 10⁻⁴ | |
| cg10780313 | 6 | 33501379 | 2.0 × 10⁻⁴ | |
| cg14027333 | 6 | 32116317 | PRRT1 | 2.1 × 10⁻⁴ |
| cg11245297 | 19 | 8117898 | CCL25 | 2.1 × 10⁻⁴ |
| cg01692968 | 9 | 108005349 | 3.1 × 10⁻⁴ | |
| cg00706683 | 2 | 233251030 | ECEL1P2 | 3.4 × 10⁻⁴ |
| cg25317941 | 2 | 233351153 | ECEL1 | 4.0 × 10⁻⁴ |
| cg25189904 | 1 | 68299493 | GNG12 | 4.0 × 10⁻⁴ |
| cg14179389 | 1 | 92947961 | GFI1 | 4.7 × 10⁻⁴ |
| cg13641317 | 3 | 127255552 | 4.9 × 10⁻⁴ | |
| cg19847577 | 15 | 29213748 | APBA2 | 5.1 × 10⁻⁴ |
| cg14239618 | 7 | 110281356 | 5.8 × 10⁻⁴ | |
| cg25955180 | 6 | 32116538 | PRRT1 | 6.3 × 10⁻⁴ |
| cg00774149 | 3 | 52255721 | TLR9 | 6.4 × 10⁻⁴ |
| cg21351392 | 6 | 161607487 | AGPAT4 | 7.1 × 10⁻⁴ |
| cg11902777 | 5 | 368843 | AHRR | 7.6 × 10⁻⁴ |
| cg07251887 | 17 | 73641809 | LOC100130933; RECQL5 | 7.7 × 10⁻⁴ |
| cg19382157 | 7 | 2124566 | MAD1L1 | 8.9 × 10⁻⁴ |
| cg19925780 | 1 | 101509557 | 1.1 × 10⁻³ | |
| cg03679544 | 6 | 155537972 | TIAM2 | 1.1 × 10⁻³ |
| cg08559712 | 20 | 16030674 | MACROD2 | 1.3 × 10⁻³ |
| cg09837977 | 7 | 110731201 | LRRN3; IMMP2L | 1.3 × 10⁻³ |
| cg00931843 | 6 | 155442993 | TIAM2 | 1.4 × 10⁻³ |
CpG sites without gene names are intergenic. These are all included in all the analyses.
The EPIC studies included cancer cases plus non-cancer controls analyzed together, adjusting for cancer status. The other studies were population-based samples not selected for disease status. To evaluate residual confounding by cancer status after adjustment, we repeated the meta-analysis without the EPIC studies. The effect estimates were highly correlated: Pearson ρ = 0.99 for current versus never smoking and 0.98 for former smoking versus never.
Enrichment analysis for genes identified in GWAS of smoking related phenotypes
To identify potential relevance of the differentially methylated genes to smoking-related phenotypes, we determined whether these genes had been associated with smoking-related phenotypes in the NHGRI-EBI GWAS Catalog28 (accessed November 2, 2015). The catalog contained 9,777 SNPs annotated to 7,075 genes associated with 865 phenotypes at p≤5×10⁻⁸. Of the 7,201 genes (mapped by 18,760 CpG sites) significantly differentially methylated in current versus never smokers, we found overlap with 1,791 genes (4,187 CpGs are mapped to these) associated in GWAS with 700 phenotypes (enrichment p=2.4 × 10−52). We identified smoking-related traits using the 2014 US Surgeon General’s (USSG) report1. Enrichment results for a selection of smoking-related phenotypes including coronary heart disease (CHD) and its risk factors, various cancers, inflammatory diseases, osteoporosis, and pulmonary traits, are available in Table 5. We also performed the same enrichment analysis on the 2,568 CpGs associated with former versus never smoking status. We identified enrichment for CHD, pulmonary traits, and some cancers (Table 5). More detailed results are available in Supplementary Tables 8 and 9. Differentially methylated genes in relation to smoking status that are associated in GWAS with CHD or CHD risk factors are available in Supplementary Table 10. We also performed enrichment analyses on phenotypes that have no clear relationships to smoking, such as male pattern baldness (p=0.0888), myopia (p=0.1070), thyroid cancer (p=0.2406), and testicular germ cell tumor (p=0.3602) and did not find significant enrichment.
Table 5.
Enrichment of CpGs for genome-wide association study (GWAS) phenotypes that are regarded as causally related to cigarette smoking1
| GWAS Phenotype | Enrichment p-value |
|---|---|
| Current vs. never smoking | |
| Coronary heart disease (CHD) and Stroke | 0.0028 |
| Ischemic stroke | 0.0095 |
| CHD risk factors | 1.2 × 10⁻¹² |
| Blood pressure / hypertension | 8.1 × 10⁻⁶ |
| Diastolic blood pressure | 6.1 × 10⁻⁵ |
| Systolic blood pressure | 0.0008 |
| Hypertension | 0.0150 |
| Lipids | 2.9 × 10⁻⁵ |
| High density lipoprotein (HDL) | 0.0009 |
| Type 2 diabetes | 0.0106 |
| Rheumatoid arthritis (RA) | 2.9 × 10⁻⁵ |
| Bone mineral density (BMD) and osteoporosis | 0.0467 |
| All pulmonary traits | 2.8 × 10⁻⁶ |
| All chronic obstructive pulmonary disease (COPD) | 0.0295 |
| Moderate to severe COPD | 0.0156 |
| Pulmonary function | 0.0044 |
| Crohn’s Disease | 9.5 × 10⁻⁷ |
| Primary biliary cirrhosis | 3.4 × 10⁻⁶ |
| Inflammation bowel disease | 3.5 × 10⁻⁵ |
| Ulcerative colitis | 9.8 × 10⁻⁵ |
| All cancer | 8.0 × 10⁻¹⁵ |
| Lung adenocarcinoma | 0.0015 |
| Colorectal cancer | 0.0014 |
| Former vs. never smoking | |
| CHD risk factors | 7.6 × 10⁻⁵ |
| Blood pressure / hypertension | 5.8 × 10⁻⁵ |
| Diastolic blood pressure | 0.0021 |
| Systolic blood pressure | 0.0002 |
| Hypertension | 0.0023 |
| Rheumatoid arthritis (RA) | 6.3 × 10⁻⁵ |
| All pulmonary traits | 0.0217 |
| Inflammation bowel disease | 5.2 × 10⁻⁶ |
| Crohn’s Disease | 0.0064 |
| All cancer | 7.8 × 10⁻⁶ |
Enrichment analysis for genomic features
We examined the differentially methylated CpGs with respect to localization to different genomic regions including CpG islands, gene bodies, known differentially methylated regions, and sites identified as likely to be functionally important in the ENCODE project such as DNAse1 hypersensitivity sites and enhancers (refer to the Methods section for details). We performed this analysis separately for the CpGs related to current smoking and past smoking (Supplementary Table 11). Trends were similar for the two sets of CpGs, although the power to identify enrichment was much greater for the larger set of 18,760 CpGs related to current smoking. There was no enrichment for CpG islands. In contrast, significant enrichment was observed for island shores, gene bodies, DNAse1 hypersensitivity sites, and enhancers.
Transcriptomic integration
Of the 18,760 statistically significant CpG sites associated with current smoking in the meta-analysis, 1,430 were significantly associated in cis with the expression of 924 genes at FDR<0.05 (enrichment p=3.6 × 10−215, Supplementary Table 12) using whole blood samples from 2,262 Framingham Heart Study participants. Of these, 424 CpGs associated with the expression of 285 genes were replicated at FDR<0.0001 in 1,264 CD14+ samples from the Multi-Ethnic Study of Atherosclerosis (MESA)35. These genes are associated with pathways similar to those described earlier (Supplementary Table 13).
Comparison between African ancestry and European ancestry
Meta-analysis of the current versus never smokers in 11 cohorts with participants of European ancestry (N=6,750 subjects) yielded 10,977 CpGs annotated to 4,940 genes at FDR<0.05. Meta-analysis the results of the smaller dataset of four cohorts with African ancestry participants (N=2,639) yielded 3,945 CpGs annotated to 2,088 genes at FDR<0.05. The effect estimates of the CpGs significant in at least one ancestry (12,927 CpGs) were highly correlated in the combined group of individuals of either ancestry (Spearman ρ=0.89). The results by ancestry are shown in Supplementary Table 14.
We performed the same ancestry-stratified analysis on former versus never smokers (Supplementary Table 15). Meta-analysis of the results of European ancestry participants yielded 2,045 CpG sites annotated to 1,081 genes at FDR<0.05. Meta-analysis of the results of African ancestry participants yielded 329 CpG sites annotated to 178 genes at FDR<0.05. The effect estimates of the union of CpGs significant in at least one ancestry (2,234 CpGs) were correlated in the combined group of individuals of either ancestry (Spearman ρ=0.75). Of note, one of CpG sites showing differential methylation in ancestry, cg00706683, mapped to gene ECEL1P2, did not return to never-smoker levels 30 years after smoking cessation (Table 4).
To more directly compare results by ethnicity removing the effect of better statistical power in the larger European ancestry sample size, we performed a meta-analysis on subset of European ancestry cohorts: the Framingham Heart Study, Rotterdam Study, and KORA, such that the total number of smokers, the major determinant of power, would match that of African ancestry cohorts. In this subset, similar correlations of the effect estimates were observed as in the complete analyses suggesting that the differences in number of statistically significant CpGs are indeed due to better power in the European ancestry cohorts (Spearman ρ=0.87 and 0.79 for current versus never smokers and former versus never smokers, respectively).
Cell type adjustment
We adjusted our main analyses for white blood cell fractions, in studies based on either whole blood or leukocytes from the buffy coat of whole blood, either measured or using a published method20. Reassuringly, results before and after cell type adjustment were highly comparable. The correlation of regression coefficients before and after adjustment is 0.85 for the current vs. never smoker analysis (Supplementary Figure 7). Similarly for the analysis of former versus never smokers the effect estimates were highly correlated before and after adjustment (ρ=0.93; Supplementary Figure 8). In addition, in two cohorts we had results from specific cell fractions - CD4+ cells in GOLDN and CD14+ cells in MESA. The correlation of results between buffy coat and CD4+ or CD14+ for former versus never smokers are generally high (ρ > 0.74; Supplementary Table 16).
Methylation profile across CpG sites
We assessed methylation profile in FHS cohort as a representative cohort in the study. The profile of all 485,381 analyzed CpG sites can be found in Supplementary Figure 9. The profile across 18,760 CpG sites significantly associated with current vs. never smoking status can be found in Supplementary Figure 10. These plots indicate that most CpG sites with less dynamic range are largely not statistically significant in our results.
Discussion
We performed a genome-wide meta-analysis analysis of blood-derived DNA methylation in 15,907 individuals across 16 cohorts and identified broad epigenome-wide impact of cigarette smoking, with 18,760 statistically significant CpGs (FDR<0.05) annotated to over 7,000 genes, or roughly a third of known human genes. These genes in turn affect multiple molecular mechanisms and are implicated in smoking-related phenotypes and diseases. In addition to confirming previous findings from smaller studies, we detected over 16,000 novel differentially methylated CpGs in response to cigarette smoking. Many of these genes have not been previously implicated in the biologic effects of tobacco exposure. The large number of genes implicated in this well powered meta-analysis might on first glance raise concerns about false positives. However, on further consideration, given the widespread impact of smoking on disease outcomes across many organ systems and across the lifespan1, the identification of a large number of genes at genome wide significance is not surprising. In addition, our findings are robust and consistent across all 16 cohorts (Supplementary Tables 2 and 5) because we accounted for inter-study variability by using random effect meta-analyses, which is conservative when heterogeneity is present36. The implicated genes are mainly involved in molecular machineries, such as transcription and translation. Furthermore, differential methylation of a subset of CpGs persisted, often for decades, following smoking cessation.
We found that genes differentially methylated in relation to smoking are enriched for variants associated in GWAS with smoking–related diseases1 including, osteoporosis, colorectal cancers, chronic obstructive pulmonary disease, pulmonary function, cardiovascular disease (CVD) and rheumatoid arthritis. We find it noteworthy that there is enrichment of smoking-associated CpGs for genes associated with rheumatoid arthritis because DNA methylation is one of the proposed molecular mechanisms underlying this disease 37. It is also interesting that the most significant association of smoking with methylation was for the gene HIVEP3 (a.k.a. Schnurri3), the mammalian homolog of the Drosophila zinc finger adapter protein Shn38. This gene regulates bone formation, an important determinant to osteoporosis, which was one of the enriched GWAS phenotypes.
When we examined time since smoking cessation, we found that the majority of the differentially methylated CpG sites observed in analysis of current versus never smokers returned to the level of never-smokers within five years of smoking cessation. This is consistent with the fact that risks of many smoking-related diseases revert to nonsmoking levels within this period of time. Our results also indicate that cigarette smoking induces long-lasting alterations in DNA methylation at some CpGs. While speculative, it is possible that persistent methylation changes at some loci might contribute to risks of some conditions that remain elevated after smoking cessation.
In all but two of our 14 cohorts DNA was extracted from the entire circulating leukocyte population. Thus there is the possibility of confounding by the effects of smoking on differential cell counts. We attempted to adjust for cell type and found that results were generally little changed by the adjustment.
Our significant results are highly enriched for CpG sites associated with the expression of nearby genes (i.e., in cis) even though a single measurement of gene expression in blood is probably subject to considerably more within-subject variability than DNA methylation,39 limiting our ability to find correlations. Differential DNA methylation at many of the CpGs we identified in relation to smoking status may have a functional impact on nearby gene expression. Our analysis of genomic regions further supports the potential functional impact of our findings on gene expression. We demonstrated enrichment for sites with greater functional impact such as island shores, gene bodies, DNAse1 hypersensitivity sites, and enhancers, whereas we found no enrichment for CpG islands. These results reinforce previous findings showing that island shores, enhancers, and DHS sites are more dynamic (i.e., susceptible to methylation changes) than CpG islands40, which may be more resistant to abrupt changes in DNA methylation in response to environmental exposures41. Thus our results suggest that many of the smoking-associated CpG sites may have regulatory effects.
While identification of changes in methylation patterns may suggest mechanisms by which exposure to tobacco smoke exerts its effects on several disease processes, DNA methylation profiles can also serve as biomarkers of exposure to tobacco smoke. Cotinine is a biomarker only of recent smoking; DNA methylation signals have the potential to serve as robust biomarkers of past smoking history9,42. Indeed, several studies have identified several of such markers5,42,43. The large number of persistently modified CpGs may be useful to develop even more robust biomarkers to objectively quantify long-term cigarette smoking exposure for prediction of risk for health outcomes in settings where smoking history is not available or is incomplete as well as to validate self-reported never smoker status. Further, our analyses of both former and current smokers show dose-dependent effects at a number of CpGs (Supplementary Tables 3 and 7). Methylation based biomarkers could be informative for investigating dose response relationships with disease endpoints. This is useful because smokers often underreport the amount of smoking, both current and historical.
It is possible that smoking related conditions or correlated exposures may contribute to some of the methylation signatures identified. However, our studies are nearly all population based studies composed of predominantly healthy individuals, not selected for smoking related disease. Given the number, strength and robustness to replication of findings for smoking across the literature and among our diverse cohorts from various countries the likelihood that these are confounded by other exposures or conditions related to smoking is greatly reduced.
There several potential limitations to our study. First, the cross-sectional design limits our ability to study the time course of smoking effects. In addition, we analyzed methylation in DNA samples from blood, which is readily accessible. Although we demonstrated that blood derived DNA reveals a strong and robust signature of cigarette smoking exposure, studies in target tissues for smoking-related diseases (e.g., heart and lung) would be of additional interest. In addition, our analyses could not distinguish smoking’s direct effects from its indirect effects due to smoking-induced changes in cell metabolism, organ function, inflammation, or injury that could in turn influence methylation. However, this is the largest examination to date of the effects of smoking on DNA methylation with 16 studies from different countries contributing.
In conclusion we identify an order of magnitude more sites differentially methylated in relation to smoking across the genome than have been previously seen. Many of these signals persist long after smoking cessation providing potential biomarkers of past smoking history. These findings may provide new insights into molecular mechanisms underlying the protean effects of smoking on human health and disease.
Supplementary Material
Acknowledgments
We would like to thank Bonnie R. Joubert, PhD and Frank Day, PhD of the National Institute of Environmental Health Sciences (RTP, NC) and Jianping Jin, PhD of Westat (Durham, NC) for expert computational assistance. Additional Acknowledgements can be found in the supplementary materials.
Funding Sources: Infrastructure for the CHARGE Consortium is provided by the National Heart, Lung, and Blood Institute grant R01HL105756. This work was supported in part by the Intramural Research Program of the NIH; National Institute of Environmental Health Sciences and the National Heart Lung and Blood Institute.
Footnotes
Disclosure: B. M. P. serves on Data Safety Monitoring Board (DSMB) of a clinical trial of a device funded by the manufacturer (Zoll LifeCor) and on the Steering Committee of the Yale Open Data Access Project funded by Johnson & Johnson. C.E.E. is currently employed by Astra Zeneca, although the work was completed prior to the employment. All other authors declare no conflicts of interest.
References
- 1.National Center for Chronic Disease Prevention and Health Promotion (US) Office on Smoking and Health. The Health Consequences of Smoking—50 Years of Progress: A Report of the Surgeon General. Atlanta (GA): Centers for Disease Control and Prevention (US); 2014. [PubMed] [Google Scholar]
- 2.World Health Organization. WHO global report on trends in prevalence of tobacco smoking. 2015
- 3.Szarc vel Szic K, Declerck K, Vidaković M, Vanden Berghe W. From inflammaging to healthy aging by dietary lifestyle choices: is epigenetics the key to personalized nutrition? Clin Epigenetics. 2015;7:33. doi: 10.1186/s13148-015-0068-2. [DOI] [PMC free article] [PubMed] [Google Scholar]
- 4.Breitling LP, Yang R, Korn B, Burwinkel B, Brenner H. Tobacco-smoking-related differential DNA methylation: 27K discovery and replication. Am J Hum Genet. 2011;88:450–457. doi: 10.1016/j.ajhg.2011.03.003. [DOI] [PMC free article] [PubMed] [Google Scholar]
- 5.Breitling LP, Salzmann K, Rothenbacher D, Burwinkel B, Brenner H. Smoking, F2RL3 methylation, and prognosis in stable coronary heart disease. Eur Heart J. 2012;33:2841–2848. doi: 10.1093/eurheartj/ehs091. [DOI] [PubMed] [Google Scholar]
- 6.Wan ES, Qiu W, Baccarelli A, Carey VJ, Bacherman H, Rennard SI, et al. Cigarette smoking behaviors and time since quitting are associated with differential DNA methylation across the human genome. Hum Mol Genet. 2012;21:3073–3082. doi: 10.1093/hmg/dds135. [DOI] [PMC free article] [PubMed] [Google Scholar]
- 7.Wan ES, Qiu W, Carey VJ, Morrow J, Bacherman H, Foreman MG, et al. Smoking Associated Site Specific Differential Methylation in Buccal Mucosa in the COPDGene Study. Am J Respir Cell Mol Biol. 2014;53:246–254. doi: 10.1165/rcmb.2014-0103OC. [DOI] [PMC free article] [PubMed] [Google Scholar]
- 8.Zeilinger S, Kühnel B, Klopp N, Baurecht H, Kleinschmidt A, Gieger C, et al. Tobacco smoking leads to extensive genome-wide changes in DNA methylation. PLoS ONE. 2013;8:e63812. doi: 10.1371/journal.pone.0063812. [DOI] [PMC free article] [PubMed] [Google Scholar]
- 9.Shenker NS, Ueland PM, Polidoro S, van Veldhoven K, Ricceri F, Brown R, et al. DNA Methylation as a Long-term Biomarker of Exposure to Tobacco Smoke. Epidemiology. 2013;24:712–716. doi: 10.1097/EDE.0b013e31829d5cb3. [DOI] [PubMed] [Google Scholar]
- 10.Shenker NS, Polidoro S, van Veldhoven K, Sacerdote C, Ricceri F, Birrell MA, et al. Epigenome-wide association study in the European Prospective Investigation into Cancer and Nutrition (EPIC-Turin) identifies novel genetic loci associated with smoking. Hum Mol Genet. 2013;22:843–851. doi: 10.1093/hmg/dds488. [DOI] [PubMed] [Google Scholar]
- 11.Guida F, Sandanger TM, Castagné R, Campanella G, Polidoro S, Palli D, et al. Dynamics of Smoking-Induced Genome-Wide Methylation Changes with Time Since Smoking Cessation. Hum Mol Genet. 2015;24:2349–2359. doi: 10.1093/hmg/ddu751. [DOI] [PMC free article] [PubMed] [Google Scholar]
- 12.Qiu W, Wan E, Morrow J, Cho MH, Crapo JD, Silverman EK, et al. The impact of genetic variation and cigarette smoke on DNA methylation in current and former smokers from the COPDGene study. Epigenetics. 2015;10:1064–1073. doi: 10.1080/15592294.2015.1106672. [DOI] [PMC free article] [PubMed] [Google Scholar]
- 13.Gao X, Jia M, Zhang Y, Breitling LP, Brenner H. DNA methylation changes of whole blood cells in response to active smoking exposure in adults: a systematic review of DNA methylation studies. Clin Epigenetics. 2015;7:113. doi: 10.1186/s13148-015-0148-3. [DOI] [PMC free article] [PubMed] [Google Scholar]
- 14.Shah S, Bonder MJ, Marioni RE, Zhu Z, McRae AF, Zhernakova A, et al. Improving Phenotypic Prediction by Combining Genetic and Epigenetic Associations. Am J Hum Genet. 2015;97:75–85. doi: 10.1016/j.ajhg.2015.05.014. [DOI] [PMC free article] [PubMed] [Google Scholar]
- 15.Beane J, Sebastiani P, Liu G, Brody JS, Lenburg ME, Spira A. Reversible and permanent effects of tobacco smoke exposure on airway epithelial gene expression. Genome Biol. 2007;8:R201. doi: 10.1186/gb-2007-8-9-r201. [DOI] [PMC free article] [PubMed] [Google Scholar]
- 16.Wauters E, Janssens W, Vansteenkiste J, Decaluwé H, Heulens N, Thienpont B, et al. DNA methylation profiling of non-small cell lung cancer reveals a COPD-driven immune-related signature. Thorax. 2015;70:1113–1122. doi: 10.1136/thoraxjnl-2015-207288. [DOI] [PubMed] [Google Scholar]
- 17.Garg AX, Hackam D, Tonelli M. Systematic Review and Meta-analysis: When One Study Is Just not Enough. Clin J Am Soc Nephrol. 2008;3:253–260. doi: 10.2215/CJN.01430307. [DOI] [PubMed] [Google Scholar]
- 18.Pidsley RY, Wong CC, Volta M, Lunnon K, Mill J, Schalkwyk LC. A data-driven approach to preprocessing Illumina 450K methylation array data. BMC Genomics. 2013;14:293. doi: 10.1186/1471-2164-14-293. [DOI] [PMC free article] [PubMed] [Google Scholar]
- 19.Teschendorff AE, Marabita F, Lechner M, Bartlett T, Tegner J, Gomez-Cabrero D, et al. A beta-mixture quantile normalization method for correcting probe design bias in Illumina Infinium 450 k DNA methylation data. Bioinformatics. 2013;29:189–196. doi: 10.1093/bioinformatics/bts680. [DOI] [PMC free article] [PubMed] [Google Scholar]
- 20.Houseman EA, Accomando WP, Koestler DC, Christensen BC, Marsit CJ, Nelson HH, et al. DNA methylation arrays as surrogate measures of cell mixture distribution. BMC Bioinformatics. 2012;13:86. doi: 10.1186/1471-2105-13-86. [DOI] [PMC free article] [PubMed] [Google Scholar]
- 21.Dick KJ, Nelson CP, Tsaprouni L, Sandling JK, Aïssi D, Wahl S, et al. DNA methylation and body-mass index: a genome-wide analysis. Lancet. 2014;383:1990–1998. doi: 10.1016/S0140-6736(13)62674-4. [DOI] [PubMed] [Google Scholar]
- 22.Bates D, Mächler M, Bolker B, Walker S. Fitting Linear Mixed-Effects Models Using lme4. J Stat Softw. 2015;67:1–48. [Google Scholar]
- 23.R Development Core Team. R: A Language and Environment for Statistical Computing. Austria: Vienna; 2010. [Google Scholar]
- 24.Viechtbauer W. Conducting Meta-Analyses in R with the metafor Package. J Stat Softw. 2010;36:1–48. [Google Scholar]
- 25.Benjamini Y, Hochberg Y. Controlling the false discovery rate: a practical and powerful approach to multiple testing. JSSRB. 1995;57:289–300. [Google Scholar]
- 26.Joubert BR, Felix JF, Yousefi P, Bakulski KM, Just AC, Breton C, et al. DNA Methylation in Newborns and Maternal Smoking in Pregnancy: Genome-wide Consortium Meta-analysis. Am J Hum Genet. 2016;98:680–696. doi: 10.1016/j.ajhg.2016.02.019. [DOI] [PMC free article] [PubMed] [Google Scholar]
- 27.Su AI, Wiltshire T, Batalov S, Lapp H, Ching KA, Block D, et al. A gene atlas of the mouse and human protein-encoding transcriptomes. Proc Natl Acad Sci USA. 2004;101:6062–6067. doi: 10.1073/pnas.0400782101. [DOI] [PMC free article] [PubMed] [Google Scholar]
- 28.Hindorff LA, Sethupathy P, Junkins HA, Ramos EM, Mehta JP, Collins FS, et al. Potential etiologic and functional implications of genome-wide association loci for human diseases and traits. Proc Natl Acad Sci USA. 2009;106:9362–9367. doi: 10.1073/pnas.0903103106. [DOI] [PMC free article] [PubMed] [Google Scholar]
- 29.Vazquez AI, Bates DM, Rosa GJM, Gianola D, Weigel KA. Technical note: an R package for fitting generalized linear mixed models in animal breeding. J Anim Sci. 2010;88:497–504. doi: 10.2527/jas.2009-1952. [DOI] [PubMed] [Google Scholar]
- 30.Devlin B, Roeder K. Genomic control for association studies. Biometrics. 1999;55:997–1004. doi: 10.1111/j.0006-341x.1999.00997.x. [DOI] [PubMed] [Google Scholar]
- 31.Martey CA, Baglole CJ, Gasiewicz TA, Sime PJ, Phipps RP. The aryl hydrocarbon receptor is a regulator of cigarette smoke induction of the cyclooxygenase and prostaglandin pathways in human lung fibroblasts. Am J Physiol Lung Cell Mol Physiol. 2005;289:L391–L399. doi: 10.1152/ajplung.00062.2005. [DOI] [PubMed] [Google Scholar]
- 32.Teschendorff AE, Yang Z, Wong A, Pipinikas CP, Jiao Y, Jones A, et al. Correlation of Smoking-Associated DNA Methylation Changes in Buccal Cells With DNA Methylation Changes in Epithelial Cancer. JAMA Oncol. 2015;1:476–485. doi: 10.1001/jamaoncol.2015.1053. [DOI] [PubMed] [Google Scholar]
- 33.Campesi I, Carru C, Zinellu A, Occhioni S, Sanna M, Palermo M, et al. Regular cigarette smoking influences the transsulfuration pathway, endothelial function, and inflammation biomarkers in a sex-gender specific manner in healthy young humans. Am J Transl Res. 2013;5:497–509. [PMC free article] [PubMed] [Google Scholar]
- 34.Subramanian A, Tamayo P, Mootha VK, Mukherjee S, Ebert BL, Gillette MA, et al. Gene set enrichment analysis: a knowledge-based approach for interpreting genome-wide expression profiles. Proc Natl Acad Sci USA. 2005;102:15545–15550. doi: 10.1073/pnas.0506580102. [DOI] [PMC free article] [PubMed] [Google Scholar]
- 35.Liu Y, Ding J, Reynolds LM, Lohman K, Register TC, De La Fuente A, et al. Methylomics of gene expression in human monocytes. Hum Mol Genet. 2013;22:5065–5074. doi: 10.1093/hmg/ddt356. [DOI] [PMC free article] [PubMed] [Google Scholar]
- 36.Han B, Eskin E. Random-effects model aimed at discovering associations in meta-analysis of genome-wide association studies. Am J Hum Genet. 2011;88:586–598. doi: 10.1016/j.ajhg.2011.04.014. [DOI] [PMC free article] [PubMed] [Google Scholar]
- 37.Liu Y, Aryee MJ, Padyukov L, Fallin MD, Hesselberg E, Runarsson A, et al. Epigenome-wide association data implicate DNA methylation as an intermediary of genetic risk in rheumatoid arthritis. Nat Biotechnol. 2013;31:142–147. doi: 10.1038/nbt.2487. [DOI] [PMC free article] [PubMed] [Google Scholar]
- 38.Jones DC, Wein MN, Oukka M, Hofstaetter JG, Glimcher MJ, Glimcher LH. Regulation of adult bone mass by the zinc finger adapter protein Schnurri-3. Science. 2006;312:1223–1227. doi: 10.1126/science.1126313. [DOI] [PubMed] [Google Scholar]
- 39.Suderman M, Pappas JP, Borghol N, Buxton JL, McArdle WL, Ring SM, et al. Lymphoblastoid cell lines reveal associations of adult DNA methylation with childhood and current adversity that are distinct from whole blood associations. Int J Epidemiol. 2015;44:1331–40. doi: 10.1093/ije/dyv168. [DOI] [PubMed] [Google Scholar]
- 40.Ziller MJ, Gu H, Müller F, Donaghey J, Tsai LT-Y, Kohlbacher O, et al. Charting a dynamic DNA methylation landscape of the human genome. Nature. 2013;500:477–481. doi: 10.1038/nature12433. [DOI] [PMC free article] [PubMed] [Google Scholar]
- 41.Ivanova E, Chen J-H, Segonds-Pichon A, Ozanne SE, Kelsey G. DNA methylation at differentially methylated regions of imprinted genes is resistant to developmental programming by maternal nutrition. Epigenetics. 2012;7:1200–1210. doi: 10.4161/epi.22141. [DOI] [PMC free article] [PubMed] [Google Scholar]
- 42.Zhang Y, Schöttker B, Florath I, Stock C, Butterbach K, Holleczek B, et al. Smoking-Associated DNA Methylation Biomarkers and Their Predictive Value for All-Cause and Cardiovascular Mortality. Environ Health Perspect. 2015;124:67–74. doi: 10.1289/ehp.1409020. [DOI] [PMC free article] [PubMed] [Google Scholar]
- 43.Zhang Y, Yang R, Burwinkel B, Breitling LP, Brenner H. F2RL3 Methylation as a Biomarker of Current and Lifetime Smoking Exposures. Environ Health Perspect. 2013;122:131–137. doi: 10.1289/ehp.1306937. [DOI] [PMC free article] [PubMed] [Google Scholar]
Associated Data
This section collects any data citations, data availability statements, or supplementary materials included in this article.