

Abstract
Purpose
To identify RNA missplicing events in human corneal endothelial tissue isolated from Fuchs' endothelial corneal dystrophy (FECD).
Methods
Total RNA was isolated and sequenced from corneal endothelial tissue obtained during keratoplasty from 12 patients with FECD and 4 patients undergoing keratoplasty or enucleation for other indications. The length of the trinucleotide repeat (TNR) CTG in the transcription factor 4 (TCF4) gene was determined using leukocyte-derived DNA analyzed by a combination of Southern blotting and Genescan analysis. Commercial statistical software was used to quantify expression of alternatively spliced genes. Validation of selected alternative splicing events was performed by using RT-PCR. Gene sets identified were analyzed for overrepresentation using Web-based analysis system.
Results
Corneal endothelial tissue from FECD patients containing a CTG TNR expansion sequence in the TCF4 gene revealed widespread changes in mRNA splicing, including a novel splicing event involving FGFR2. Differential splicing of NUMA1, PPFIBP1, MBNL1, and MBNL2 transcripts were identified in all FECD samples containing a TNR expansion. The differentially spliced genes were enriched for products that localize to the cell cortex and bind cytoskeletal and cell adhesion proteins.
Conclusions
Corneal endothelium from FECD patients harbors a unique signature of mis-splicing events due to CTG TNR expansion in the TCF4 gene, consistent with the hypothesis that RNA toxicity contributes to the pathogenesis of FECD. Changes to the endothelial barrier function, a known event in the development of FECD, was identified as a key biological process influenced by the missplicing events.
Keywords: Fuchs' dystrophy, FECD, myotonic dystrophy, TCF4, trinucleotide repeat
Fuchs' endothelial corneal dystrophy (FECD) is a common, familial, bilateral and progressive disease and the most common indication for corneal transplantation in the United States.1 Recent studies have linked FECD with an expanded intronic repeat, CTG, in the transcription factor 4 (TCF4) gene in most patients in Caucasian cohorts and a smaller proportion in non-Caucasian cohorts.2–6
FECD tissue harbors focal intranuclear accumulations of the CUG repeat pre-mRNA, termed RNA foci.2 These RNA foci colocalize with and sequester nuclear proteins, most notably splicing factors of the muscleblind (MBNL) family, similar to that previously identified in myotonic dystrophy type 1 (DM1), an analogous noncoding CTG repeat expansion disease. In DM1, the gain-of-function toxic RNA and sequestration of MBNL1 lead to widespread changes in RNA splicing that contribute to disease pathogenesis.7 A pilot study from our group identified several differential splicing events in the corneal endothelium (CE) that echoed observations seen in DM1. Although this study was performed in a small group (n = 8) of samples,2 findings highlighted the need to perform a more thorough analysis of differential splicing in FECD.
In principle, there are several mechanisms by which a noncoding trinucleotide repeat (TNR) expansion in TCF4 could lead to the development of FECD, including a direct effect on TCF4 expression, production of toxic repeat-associated non-ATG (RAN) translation products and changes in RNA splicing. Based on knowledge from our pilot study that TNR expansion in the CE leads to sequestration of MBNL1 in RNA foci and observable changes in mRNA splicing, we set out to confirm and validate a larger sample set to identify a core set of splicing events in human CE that could be directly associated with FECD through CTG TNR expansion in the TCF4 gene. Development of this genetic signature will be useful for identifying biochemical pathways that may contribute to the pathogenesis of the disease. Knowing the genetic signature of a disease can lead to identification of molecular targets and pathways that may be the focus of future medical therapy. Additionally, this information can lead to diagnostic testing and validation of in vitro and in vivo models of disease.
Methods
Isolation of Corneal Tissue
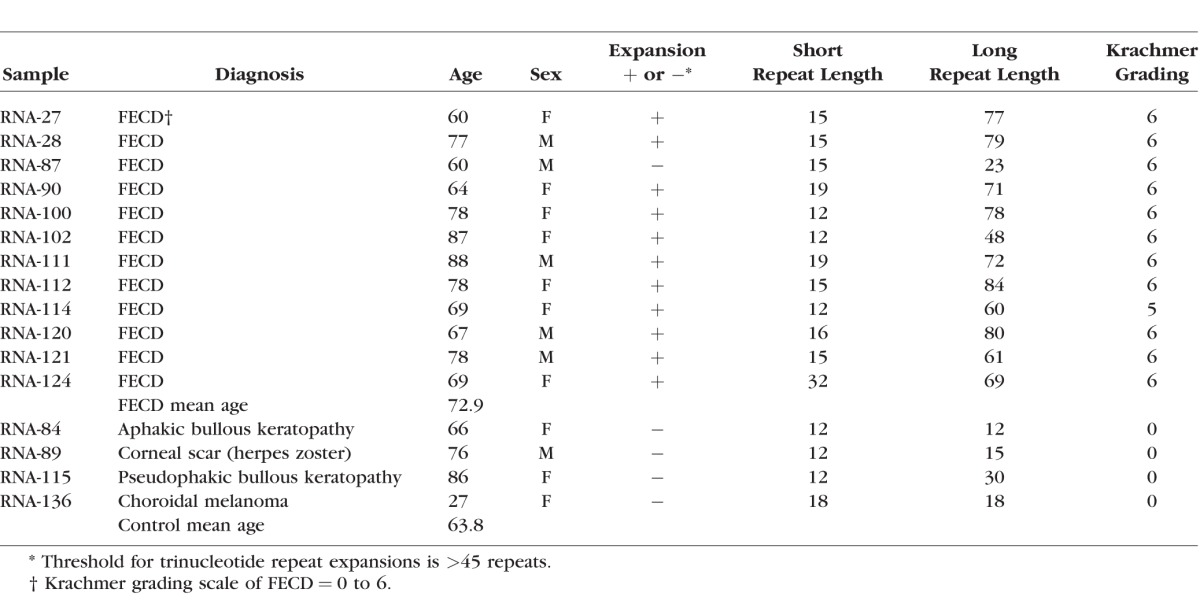
Patients with advanced FECD (modified Krachmer grade 5 or 6)8,9 requiring corneal transplantation and control participants without guttae (grade 0) were enrolled in a Mayo Clinic Institutional Review Board-approved hereditary eye disease study. FECD grade was established by slit lamp biomicroscopy using specular reflection techniques by one of the authors (KHB, LJM, or SVP). In control participants, the absence of guttae was also confirmed in the contralateral eye. Patients enrolled in the study agreed to a blood draw and use of their approximately 8-mm-diameter central CE/Descemet membrane specimen obtained at endothelial keratoplasty for FECD. DNA was isolated from peripheral blood leukocytes, and RNA was isolated from CE/Descemet membrane specimens following storage in RNAlater ICE (Thermo Fisher Scientific, Waltham, MA, USA). Endothelial tissue from control subjects was obtained at the time of keratoplasty for non-FECD disease or from eyes with normal anterior segments at the time of enucleation. This research was conducted in accordance with the Declaration of Helsinki.
RNA Isolation and Sequencing
Total RNA was isolated independently from 16 tissue samples (12 FECD and 4 controls) by homogenization in QIAzol lysis reagent, chloroform extraction and RNeasy Mini QIAcube kit (Qiagen, Valencia, CA, USA). RNA libraries were prepared for each tissue sample, using the TruSeq RNA sample Prep kit version 2 (Illumina, San Diego, CA, USA). All samples had RNA integrity number (RIN) values of ≥6.0. For TruSeq stranded total RNAseq, ribosomal transcripts were depleted from total RNA, using Ribo-Zero Gold RNA removal kit followed by replacement of deoxythymidine triphosphate (dTTP) with deoxyuridine triphosphate (dUTP) during reverse transcription in the second strand synthesis, using TruSeq stranded total library preparation kit. The resulting libraries were minimally amplified to enrich for fragments using adapters on both ends and then quantified for sequencing at three samples/lane by using a HiSeq4000 (Illumina) sequencer.
Library preparation and sequencing conditions for the pilot set of data were described previously.2 For that set of samples, poly(A) mRNA was isolated before library preparation using oligo(dT) magnetic beads.
Analysis of Differentially Spliced Genes
Whole transcriptomic sequencing data from each tissue sample was analyzed using a comprehensive computational program called the Mayo Analysis Pipeline for RNA Sequencing (MAP-RSeq) (Mayo Clinic, Rochester, MN, USA) to align, assess, and deliver multiple genomic features. MAP-RSeq uses a variety of freely available bioinformatics tools along with in-house developed methods to obtain in-depth quality control data, transcriptome read alignment, abundance of gene expression, exon expression, and other transcriptomic features.10 The binary alignment map files from MAP-RSeq were analyzed using mixture of isoforms (MISO) software (Massachusetts Institute of Technology, Cambridge, MA, USA) that quantitates the expression level of alternatively spliced genes between groups.11 For pairwise comparisons, MISO calculates Bayesian probabilities that there is a genuine difference in the splicing of a given exon between two samples. To establish a differential gene database, we used stringent filtering criteria within MISO (Fig. 1) to perform genome-wide pairwise comparisons among 11 FECD samples with TNR expansions and 4 controls (44 total comparisons) using “reads to support” isoform 1 (inclusive exon) >2; “reads to support” isoform 2 (exclusive exon) >2; sum of inclusive and exclusive reads of 25; percentage of spliced in (PSI) changes >0.2; and Bayes factor >50 as the user-defined criteria for the comparisons. For PSI, MISO calculates a value for every differential splicing event, providing a range from 0 to 1, with 0 being completely excluded and 1 being uniformly included in the splicing products.11 Visualization of alternatively spliced genes was generated using sashimi plots from the integrated genomics viewer.12 The single FECD sample without repeat expansion was not included in this pairwise comparison. The differential gene database was compared with a similar database generated from a pilot study of 8 CE specimens from a study group consisting of 4 FECD patients with CTG TNR expansions in the TCF4 gene, 1 FECD patient without a CTG TNR expansion, and 3 control patients, which allowed twelve pairwise comparisons between FECD with TNR expansion and controls.13
Figure 1.

Filtering strategy for RNASeq candidate events generated by MISO. Initial lists of candidate differential splicing events were produced by MISO using stringent criteria (see Methods). These lists were filtered to retain only those events which occurred in more than half of the pairwise comparisons between FECD samples and controls, yielding a combined total of 101 events from the two data sets. Twenty-four validated events present in both data sets are detailed in Table 2. The full set of 101 events is provided in Supplementary Table S2.
Validation of Differential Splicing Events by RT-PCR
Preparation of cDNA by reverse transcription (RT-PCR) and analysis by agarose gel electrophoresis was described previously.2 Specific primers for each validation assay and PCR conditions are provided in Supplementary Table S1.
DNA Isolation and TNR Characterization
TCF4 TNR length was determined as described previously.14 Briefly, leukocyte-derived DNA was extracted using AutoGen FlexiGene (Qiagen) and resuspended in 1× Tris-EDTA (TE) buffer for a final concentration of 250 ng/μL. TNR repeats from each sample were amplified by PCR, using an i-cycler (Bio-Rad, Hercules, CA, USA) by placing 100 ng of genomic DNA with 10 pmol of oligonucleotide primers specific for TCF4 (5-TCF-Fuchs': 5′-CAGATGAGTTTGGTGTAAGATG-3; and 3-TCF-Fuchs' 1: 5′-ACAAGCAGAAAGGGGGCTGCAA-3′) in the presence of Platinum PCR Super Mix High Fidelity (Invitrogen, Carlsbad, CA, USA). The PCR program consisted of 100 ng of genomic DNA and 10 pmol of each primer in 50 μL of Hot Start (Invitrogen) at 95°C for 6 minute for 1 cycle, then 95°C for 1 minute for 1 cycle, then 62°C for 1 minute, followed by 68°C for 3 minute for 35 cycles, and then 68°C for 1 cycle for 7 minute, followed by a 4°C hold.
For short tandem repeat analysis, a 5′FAM primer (5-FAM-TCF-Fuchs': 5′-CAGATGAGTTTGGTGTAAGATG-3′) was used in place of 5-TCF-Fuchs', and PCR was performed as described above. After PCR amplification, 2 μL of DNA was mixed with 12 μL of diluted Map Marker 1000 (Bio Ventures, Inc., Murfreesboro, TN, USA). Gene Scan was carried out using 3730XL DNA analyzer (ABI, Foster City, CA, USA).
Pathway Analysis Using Panther system
Gene sets identified by filtering MISO results were analyzed for overrepresentation of genes in specific Panther system (in the public domain, http://www.pantherdb.org/) families and pathways, using the default settings of the Panther Web portal.15 Specifically, Panther system overrepresentation test (release date 7/15/2016), annotation version, Gene Ontology (GO) database (released 08/22/2016; in the public domain, http://www.geneontology.org), and Homo sapiens reference lists were used. Bonferroni correction for multiple comparison testing was performed to determine significance (P < 0.05).
Results
The demographic and clinical characteristics of the subjects recruited for this validation study are presented in Table 1. Leukocyte TNR lengths for 11 of the 12 FECD patients ranged from 12 to 32 repeats for the normal allele and 48 to 84 repeats for the expanded allele. One FECD patient had repeat sizes of 15 and 23 repeats which were in the normal range.14 Control subjects had TNR sizes for both alleles ranging from 12 to 30 repeats which is within the normal range.
Table 1.
Demographic, Clinical and CTG Trinucleotide Repeat Length for Study Participants
Qualitative Changes in CE Gene Expression in FECD
Sixty-one differential splicing events in 58 genes were identified in more than half of the 44 pairwise comparisons (11 FECD compared to 4 controls) from this validation sample set (Fig. 1; Supplementary Table S2). Twenty-four of these events had previously met the same filtering criteria in the pilot study,2 validating a broad signature of differential splicing events in FECD associated with CTG TNR expansion in the TCF4 gene. The details of these validated common differential splicing events are presented in Table 2.
Table 2.
Summary of Differential Gene Splicing Events Present in At Least 50% of Both Pilot and Pairwise Comparisons

Differential Splicing of NUMA1 and PPFIBP1
Differential splicing of NUMA1 and PPFIBP1 was identified in every FECD sample compared with normal in both the original pilot and the current validation study (Table 2). For both the NUMA1 and the PPFIBP1 events, the median PSI values for the FECD samples were much lower than for the controls, indicating preferential exclusion of the target exons in FECD. These patterns are shown in Figures 2A and 3A, which present “sashimi plot” views of the sequence data.11 Primers that spanned the relevant splice junctions were used for RT-PCR validation of the MISO-calculated differential splicing events for NUMA1 and PPFIBP1 (Figs. 2B, 3B). Note that the pattern of products in Figures 2B and 3B, lanes 1–3 (controls) favors the larger product, whereas the pattern of products in Figures 2B and 3B, lanes 5 to 7 (FECD with TNR expansion) favors the smaller splice product, in agreement with the PSI calculations from MISO. Interestingly, the same missplicing events in both NUMA1 and PPFIBP1 were also identified in muscle cells from a mouse model of DM1 (Table 2). Also of interest, NUMA1 and PPFIBP splicing products produced in the CE from a FECD patient that did not have a TNR expansion (Figs. 2B, 3B, lane 8) resembles that of controls (Figs. 2B, 3B, lanes 1–3) rather than that of FECD samples from patients that have repeat expansions (Figs. 2B, 3B, lanes 5–7).
Figure 2.

Differential splicing of NUMA1 transcripts in the CE. (A) Sashimi plot showing the number of reads spanning individual splice junctions next to lines connecting the exons involved. Alternative Ensembl transcript structures are shown at the bottom of the figure in blue. (B) RT-PCR using primers that flank selected exons was used to assess exon inclusion from NUMA1 in corneal endothelial RNA samples from controls (lanes 1–3) and FECD patients (lanes 5–8). The repeat expansion status of each sample is shown (+, >45 repeats; ≤45 repeats). Lane 4 contains DNA size markers.
Figure 3.

Differential splicing of PPFIBP1 transcripts in the CE. Sashimi plot showing the number of reads spanning individual splice junctions are shown next to lines connecting the exons involved. Alternative Ensembl transcript structures are shown at the bottom of the figure in blue. (B) RT-PCR using primers that flank selected exons was used to assess exon inclusion from PPFIBP1 in corneal endothelial RNA samples from controls (lanes 1–3) and FECD patients (lanes 5–8). The repeat expansion status of each sample is shown (+, >45 repeats; ≤45 repeats). Lane 4 contains DNA size markers.
Differential Splicing of MBNL1 and MBNL2
Differential splicing of MBNL1 and MBNL2 is a well-characterized consequence of TNR expansion in DM116–18 and is routinely found in FECD as well.2 In addition to NUMA1 and PPFIBP1, MBNL1 and MBNL2 transcripts were also detected as differentially spliced in all 44 comparisons in the validation data set (Table 2). Experimental RT-PCR validation of the MBNL1 splicing changes in FECD was presented previously.2 Validation of the differential splicing of MBNL2 transcripts is shown in Figure 4A. As noted for NUMA1 and PPFIBP1, the pattern of RT-PCR products in FECD patients with TNR expansion (Fig. 4A, lanes 5–7) is markedly different than the products from control CE specimens (Fig. 4A, lanes 1–3) and from an FECD patient without a TNR expansion (Fig. 4A, lane 8). The main MBNL2 product from FECD patients with a TNR expansion was 544 bp, in contrast to control samples and the FECD sample without expansion, which had several products, all less than 500 bp.
Figure 4.

Differential splicing of MBNL2 transcripts in the CE. (A) RT-PCR using primers that flank selected exons was used to assess exon inclusion from MBNL2 in corneal endothelial RNA samples from controls (lanes 1–3) and FECD patients (lanes 5–8). The repeat expansion status of each sample is shown (+, >45 repeats; ≤45 repeats). Lane 4 contains DNA size markers. (B) The structure of three splice products from the MBNL2 gene is shown. Exons of the MBNL2 gene are shown as rectangles, and the length of the exon sequence included in each product is given. The location of the RT-PCR primers is shown by the arrows. The structure of the three products shown in bold (544 bp, 490bp, and 395 bp) was verified by Sanger sequencing. (C) The predicted protein sequence of the carboxyl terminus of two of the MBNL2 splice variants (544 and 395 bp RT-PCR variants) is shown, with regions that are common to both products in grey.
The pattern of RT-PCR products from MBNL2 was complex, so we sought further verification of the identity of the three major bands. Sanger sequencing of the 544-, 490-, and 395-bp bands confirmed they were from MBNL2 and also identified the presence of a 54-bp insert in the 544 band which was absent from the 490- and 395-bp products (Fig. 4A). When the 544 band sequence was compared to the 395 band sequence, the 544 band contained not only the 54-bp insert but also included a 95-bp insert near the 3′ end (Fig. 4B). Comparison of the amino acid sequences showed that the 544-bp segment had an additional 18 amino acids (aa) in frame with the comparable region in the 395-bp sequence, but the inclusion of the 95-bp insert at the 3′ end of 544 changed the reading frame and the aa sequence of the C terminus of the protein (Fig. 4C).
Differential Splicing of VEGFA
One of the interesting differential splicing events listed in Table 2 is the splicing of VEGFA (Fig. 5). The largest product from the VEGFA gene produced in the CE is 658 bp in length and includes 7 exons. This product was confirmed by sequencing to encode VEGF165 (ENST00000523950.5, refers to the human protein-coding splice variant) and is the preferential splicing pattern in the CE from patients with TNR expansions (Fig. 5B, lanes 5–7). This isoform does contain the C-terminal heparin binding domain, which helps to anchor the protein in the extracellular matrix and promotes bioavailability.19,20 In control samples (Fig. 5B, lanes 1–3) and in an FECD sample from a patient that did not have a TNR expansion (Fig. 5B, lane 8), the product that lacks the 132-bp exon 7 is the preferential splicing pattern. This removes 44 amino acids from the VEGFA protein and creates the isoform VEGF121 that lacks the heparin binding domain encoded by exons 6 and 7 (Fig. 5B). Sanger sequencing confirmed that this product is identical to ENST00000372077.8 and codes for VEGF121 after removal of the 26 amino acid signal peptide (Fig. 5C).
Figure 5.

Differential splicing of VEGFA transcripts in the CE. (A) Sashimi plot showing the number of reads spanning individual splice junctions next to lines connecting the exons involved. Alternative Ensembl transcript structures are shown at the bottom of the figure in blue. (B) RT-PCR using primers that flank selected exons was used to assess exon inclusion from VEGFA in corneal endothelial RNA samples from controls (lanes 1–3) and FECD patients (lanes 5–8). The repeat expansion status of each sample is shown (+, >45 repeats; − ≤45 repeats). Lane 4 contains DNA size markers. (C) The structure of two splice products from the VEGFA gene is shown. Exons of the VEGFA gene are shown as rectangles, and the length of the exon sequence included in each product is given. The location of the RT-PCR primers is shown by the arrows. The structure of the two products shown in bold (658 bp and 526 bp) was verified by Sanger sequencing.
A Novel Splicing Event in FGFR2
MISO requires a list of known splice junctions to interrogate. Thus, novel splicing events that may occur in a particular tissue or disease state were not included in the analysis. In assessing the transcripts produced from the FGFR2 gene, a novel product was identified that used a unique 5′ splice junction in the eighth exon. PCR assay of this region confirmed the smaller product (Fig. 6A). Sequencing of the RT-PCR product from an FECD sample confirmed the use of a canonical GT 5′ splice site for this isoform, removing 51 bp from the 3′ end of exon 8 (Fig 6B). This novel splice event removed 17 amino acids from this receptor (Fig 6C). The use of this 5′ splice junction is more common in CE from FECD samples than in controls, and it is also seen to a lesser extent in the FECD sample from a patient that did not have a repeat expansion
Figure 6.

Novel splicing event in FGFR2 transcripts in the CE (A) RT-PCR using primers that flank selected exons was used to assess exon inclusion from FGFR2 in corneal endothelial RNA samples from controls (lanes 1–3) and FECD patients (lanes 5–8). The repeat expansion status of each sample is shown (+, >45 repeats; ≤45 repeats). Lane 4 contains DNA size markers. (B) Sequence traces from the isolated upper (Reference) and lower (Alternative splice form) bands from Figure 6A are shown. The regions that flank the novel splice junction are boxed in red. (C) The predicted protein sequence of the novel FGFR2 isoform is shown. The region that is spliced out in the smaller isoform is shown in red.
Overrepresentation Analysis of Differential Splicing
Using Panther overrepresentation analysis,15 assessment of the FECD signature differential splicing gene list within the GO Molecular Function category showed an enrichment for genes involved in cytoskeletal protein binding (Table 3). This enrichment is statistically significant (P value, 1.9 × 10⁻⁵) even after Bonferroni correction for multiple comparisons. Additionally, a 14.2-fold overrepresentation of genes encoding products that bind cell adhesion molecules was also identified (P value 1 × 10⁻³). Notably, both of these categories were also overrepresented in the entire group of 101 genes identified in the combined data from the pilot and validation sets (Supplementary Table S2). In that larger group, there was a 7.4-fold enrichment for cell adhesion molecule binding proteins (P value 5.4 × 10⁻⁶) and a 4.2-fold enrichment for cytoskeletal binding proteins (Supplementary Table S3).
Table 3.
Web-based Panther System Biochemical Pathway Analysis of the Top 24 Differential Splicing Events
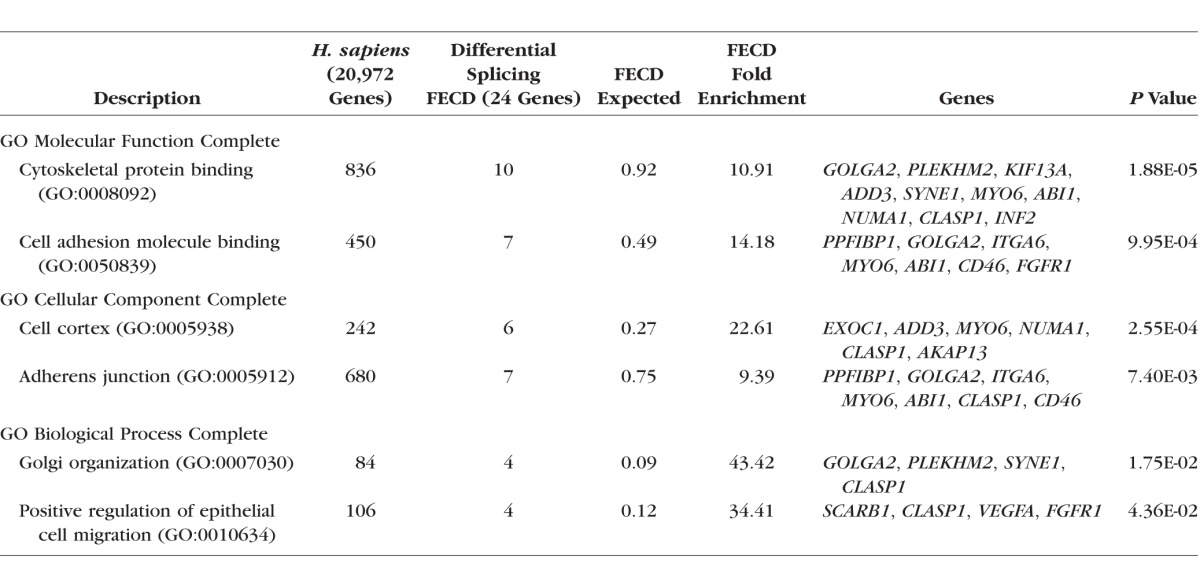
Within the GO Cellular component category, the genes listed in Table 2 are significantly enriched for products found in the cell cortex (Table 3; P value 2.6 × 10⁻⁴) and adherens junctions (P value 7.4 × 10⁻³). These enrichments are also noted in the full list of 101 genes (P value 2.2 × 10⁻³ and 9.1 × 10⁻⁵, respectively) (Supplementary Tables S2 and S3).
Finally, within the GO Biological Process category, the gene list from Table 2 was enriched for Golgi organization (P value 1.7 × 10⁻²) and positive regulation of epithelial cell migration (P value 4.4 × 10⁻²) (Table 3). Neither of these enrichments was statistically significant in the full set of 101 genes (Supplementary Table S2). However, the larger gene set did have a notable enrichment for positive regulation of GTPase activity (P value 1.4 × 10⁻³) (Supplementary Table S3).
Discussion
Several groups have confirmed a strong association between CTG TNR expansions in the TCF4 gene and FECD.3,4 We have also detected the colocalization of the splicing factor MBNL1 with transcribed CUG sequences in RNA foci in the nuclei of CE cells from patients with CTG TNR expansions in the TCF4 gene.2 These observations closely parallel those found in affected muscle tissue from patients with DM1. In DM1, more than a decade of research has established that sequestration of MBNL1 in RNA foci of the effected muscle cells leads to widespread changes in RNA splicing.16,21–23 In the present study, we identified a signature of missplicing events for FECD CE harboring CTG repeat expansion in TCF4. Among the list of 101 missplicing events identified in both the pilot and the validation studies, 24 missplicing events (in 23 different genes) survived a higher level of screening by being present in at least 50% of comparisons in two independent data sets prepared with different library preparation techniques. Striking overlap occurred between these 24 genes and those implicated in DM1. Our results confirm that there are widespread changes in pre-mRNA splicing in the CE from FECD patients who have TNR expansions.
The pathogenesis of DM1 is believed to be due to a CTG TNR expansion in the dystrophia myotonica protein kinase (DMPK) gene that causes RNA toxicity due to the sequestration of MBNL1 in RNA foci, leading to changes in RNA splicing. It is notable that at least 16 of the 24 genes listed in Table 2 are also differentially spliced in a mouse model of DM1.18 Given the differences in species and tissue, this is a remarkable degree of concordance and is consistent with the possibility of overlapping pathogenic mechanisms between FECD and DM1. Another two events (in SOS1 and NFIX) have also been noted in studies of patients with DM1.24 Thus, at least 18 of 24 (75%) of the top splicing changes noted in FECD have also been linked to those in DM1, emphasizing the similarities between these two CTG TNR expansion diseases and suggesting a common pathogenesis, albeit in different tissues.
Within the validation set of samples discussed here, differential splicing of the transcripts of MBNL1, MBNL2, NUMA1, and PPFIBP1 was detected in every FECD sample compared to controls, and differential splicing events were also noted in 43 of 44 comparisons for SYNE1 and ADD3. The inclusion of MBNL1 and MBNL2 in this list is expected, given their affinity for CUG-rich sequences, which are abundant in the transcripts from the expanded repeats and their known roles in mRNA splicing. It is interesting that the other four genes are also related to cellular events that have been linked to FECD. Both SYNE1 and NUMA1 produce nuclear proteins implicated in apoptosis25,26; PPFIBP1 is thought to regulate the disassembly of focal adhesions, and adducins (including the ADD3 gene product) are important in the stabilization of endothelial junctions.27–29 Nesprin-1 (the product of the SYNE1 gene) has also been implicated in the regulation of cell adhesions.30
Overall, the finding that more than 60% (14 of 23) of the most robust differential splicing events occur in genes coding for proteins that are involved in cytoskeletal protein binding or cell adhesion is in agreement with previous proteomic studies of FECD. Quantitative proteomic analysis of CE/Descemet's membrane from FECD patients led Poulsen et al.31 to conclude that proteins associated with cell anchoring and extracellular matrix organization were altered in FECD. Our results suggest that some of the proteins that regulate the extracellular matrix and cytoskeleton in the CE might be qualitatively different as well, by virtue of widespread differential splicing events. The possible contribution of these changes to the pathogenesis of FECD will require further work, but the promising results in treating FECD with Rho kinase (ROCK) inhibitors, which target ROCKs and influence cellular events involved with the cytoskeleton, cell adhesion and proliferation, suggests possible avenues for future experiments.32 In that regard, it is notable that, within the larger set of differential splicing events presented in Supplementary Tables S2 and S3, the focus on cell adhesion and cytoskeletal protein binding is extended and over a 7-fold enrichment for proteins that bind to GTPases emerges.
The change in the splicing pattern of VEGFA in patients with a TNR expansion is also of interest. Our results indicate that TNR expansion favors splicing that yields VEGF165. Previous work comparing the effect of VEGF165 versus that of VEGF121 on the barrier function of retinal vascular endothelial cells in culture suggests that VEGF165 is more disruptive to barrier function than VEGF121 through an effect on the tight junction protein claudin-1,33 which is expressed in CE.34 The TNR-associated increase in VEGF165 in the CE could therefore impair the barrier function of the CE, which has been shown to be an early defect leading to FECD.35
The true functional significance of the novel splice form of FGFR2 that we have characterized is currently unknown. The consequence of the differential splicing is the exclusion of 17 amino acids in the extracellular third immunoglobulin (Ig)-like domain. The first 3 of the 17 amino acids that are lost in this isoform (G345, N346, and S347) have been shown to interact with FGF2.36 It is known that other alternative splicing events in this Ig-like domain do affect ligand specificity.37,38 Thus, it is reasonable to hypothesize that the function of the receptor could be changed by this splicing event.
The additional significance of this FGFR2 event is that it emphasizes the fact that the list of differential splicing events identified by MISO and presented here is not exhaustive. The software for identifying differential splicing events is not perfect, and other biologically significant splicing alterations in FECD likely exist.
We recognize that the studies presented here are based on a limited sample size (total of 15 FECD RNA samples from patients with TNR expansions and 7 independent controls) and that the RNA expression of the control samples may also be influenced by their diverse underlying diseases. The identification of splicing changes within MBNL1, MBNL2, NUMA1, and PPFIBP1, which were identified in all 44 comparisons between FECD with expansion and control samples plus the 12 comparisons performed in the pilot group, minimizes this concern. However, it will be important to experimentally validate the effect of these splicing changes on the structure and function of individual proteins before the true consequences of these splicing changes for FECD can be known. Although the presence of widespread splicing abnormalities do not confer proof that missplicing is the primary or sole mechanism of disease in FECD, the parallels with well-established pathogenesis of DM1 suggest that splicing changes secondary to sequestration of MBNL1 and MBNL2 are likely to be important in FECD as well.
Shared missplicing events in DM1 and FECD should bring into question the possibility of shared phenotypic features. Gattey et al.39 described 4 patients from 3 families with DM1 who had ocular findings of FECD. Repeat length in the TCF4 gene was not measured. A separate study of 52 patients with myotonic dystrophy (unspecified whether type 1 or 2) found that corneal thickness was greater than normal in DM, but no other endothelial abnormalities were noted.40 Garcia Filho et al.41 were unable to confirm a difference in corneal thickness in 12 DM1 subjects, but corneal endothelial parameters were not measured. Although it has not been systematically studied, the presence of neuromuscular disease in patients with FECD has not been reported, and this holds true in our own clinical experience. While larger sampling with thorough methodology is needed to confirm an association such as that described by Gattey et al.,39 one must remember that the repeat expansion diseases described to date are tissue-specific, with distinct clinical phenotypes despite similar genetic bases. For example, both DM1 and spinocerebellar ataxia type 8 occur as a result of CTG expansion in the noncoding portion of their respective genes, yet the diseases are clinically distinct and involve different parts of the nervous system. Genes, including those harboring repeat expansions, exhibit tissue-specific differential expression. Additionally, mosaicism is common in repeat-associated diseases, with much longer repeat lengths present in certain tissues, such as the nervous system. Genes with expansion may also use different promoters in different tissues, resulting in varied expression of the repeat sequence. The TCF4 gene has 48 different isoforms produced from 9 different promoters, with only some of the variants having the repeat expansion sequence. Nevertheless, there are clearly many variables involved in determining the tissue specific pathogenicity of repeat expansion sequences, so shared clinical features between FECD and other repeat expansion diseases is not necessarily expected.
The linkage of the differential splicing changes reported here to TNR expansions is emphasized by the absence of mis-splicing in this gene set in the FECD sample from a patient that lacked a TNR expansion. Because we do not yet have splicing data for a meaningful number of FECD patients that lack repeat expansions, these findings must be viewed cautiously. Still, these results do emphasize the reality that there are divergent genetic variants that lead to FECD, and no unifying pathogenic mechanism has been identified. Nevertheless, the current mechanism involving missplicing of the candidate genes seems to hold true for FECD patients with TNR expansions. It may be noted that up to 80% of FECD patients (depending on ethnicity) exhibit TNR expansions.14 Therefore changes in gene function through alternate splicing induced by TNR expansion can be a valid pathogenic mechanism in most FECD patients. Furthermore, the overrepresentation of cytoskeletal and cell adhesion molecule-binding proteins in the differentially spliced “signature” group is further proof that RNA splicing changes could contribute to the pathogenesis of FECD in the subset of patients with TNR expansions.
Supplementary Material
Acknowledgments
Supported by US National Institutes of Health/National Eye Institute Grants EY 25071 and EY 26490; Research to Prevent Blindness, Inc. (Unrestricted Department of Ophthalmology grant and SVP as Olga Keith Wiess Special Scholar); Mayo Clinic Robert R. Waller Career Development Award, Rochester, MN, USA; Mayo Clinic Center for Individualized Medicine, Rochester, MN, USA; and Mayo Foundation, Rochester, MN, USA.
Disclosure: E.D. Wieben, None; R.A. Aleff, None; X. Tang, None; M.L. Butz, None; K.R. Kalari, None; E.W. Highsmith, None; J. Jen, None; G. Vasmatzis, None; S.V. Patel, None; L.J. Maguire, None; K.H Baratz, None; M.P. Fautsch, None
References
- 1. Eye Bank Association of America. Eye banking statistical report. Washington, DC: Eye Bank Association of America; 2015: 50 Available at http://restoresight.org/what-we-do/publications/statistical-report/. [Google Scholar]
- 2. Du J,, Aleff RA,, Soragni E,, et al. RNA toxicity and missplicing in the common eye disease fuchs endothelial corneal dystrophy. J Biol Chem. 2015; 290: 5979–5990. [DOI] [PMC free article] [PubMed] [Google Scholar]
- 3. Vasanth S,, Eghrari AO,, Gapsis BC,, et al. Expansion of CTG18.1 trinucleotide repeat in TCF4 is a potent driver of fuchs' corneal dystrophy. Invest Ophthalmol Vis Sci. 2015; 56: 4531–4536. [DOI] [PMC free article] [PubMed] [Google Scholar]
- 4. Mootha VV,, Gong X,, Ku HC,, Xing C. Association and familial segregation of CTG18.1 trinucleotide repeat expansion of TCF4 gene in Fuchs' endothelial corneal dystrophy. Invest Ophthalmol Vis Sci. 2014; 55: 33–42. [DOI] [PMC free article] [PubMed] [Google Scholar]
- 5. Nanda GG,, Padhy B,, Samal S,, Das S,, Alone DP. Genetic association of TCF4 intronic polymorphisms, CTG18.1 and rs17089887, with Fuchs' endothelial corneal dystrophy in an Indian population. Invest Ophthalmol Vis Sci. 2014; 55: 7674–7680. [DOI] [PubMed] [Google Scholar]
- 6. Nakano M,, Okumura N,, Nakagawa H,, et al. Trinucleotide repeat expansion in the TCF4 gene in Fuchs' endothelial corneal dystrophy in Japanese. Invest Ophthalmol Vis Sci. 2015; 56: 4865–4869. [DOI] [PubMed] [Google Scholar]
- 7. Kanadia RN,, Johnstone KA,, Mankodi A,, et al. A muscleblind knockout model for myotonic dystrophy. Science. 2003; 302: 1978–1980. [DOI] [PubMed] [Google Scholar]
- 8. Louttit MD,, Kopplin LJ,, Igo RP, Jr,, et al. A multicenter study to map genes for Fuchs endothelial corneal dystrophy: baseline characteristics and heritability. Cornea 2012; 31: 26–35. [DOI] [PMC free article] [PubMed] [Google Scholar]
- 9. Repp DJ,, Hodge DO,, Baratz KH,, McLaren JW,, Patel SV. Fuchs' endothelial corneal dystrophy: subjective grading versus objective grading based on the central-to-peripheral thickness ratio. Ophthalmology. 2013; 120: 687–694. [DOI] [PMC free article] [PubMed] [Google Scholar]
- 10. Kalari KR,, Nair AA,, Bhavsar JD,, et al. MAP-RSeq: Mayo analysis pipeline for RNA sequencing. BMC Bioinformatics. 2014; 15: 224. [DOI] [PMC free article] [PubMed] [Google Scholar]
- 11. Katz Y,, Wang ET,, Airoldi EM,, Burge CB. Analysis and design of RNA sequencing experiments for identifying isoform regulation. Nat Methods. 2010; 7: 1009–1015. [DOI] [PMC free article] [PubMed] [Google Scholar]
- 12. Robinson JT,, Thorvaldsdottir H,, Winckler W,, et al. Integrative genomics viewer. Nat Biotechnol. 2011; 29: 24–26. [DOI] [PMC free article] [PubMed] [Google Scholar]
- 13. Du J,, Campau E,, Soragni E,, Jespersen C,, Gottesfeld JM. Length-dependent CTG.CAG triplet-repeat expansion in myotonic dystrophy patient-derived induced pluripotent stem cells. Hum Mol Genet. 2013; 22: 5276–5287. [DOI] [PMC free article] [PubMed] [Google Scholar]
- 14. Wieben ED,, Aleff RA,, Tosakulwong N,, et al. A common trinucleotide repeat expansion within the transcription factor 4 (TCF4, E2-2) gene predicts Fuchs corneal dystrophy. PLoS One. 2012; 7: e49083. [DOI] [PMC free article] [PubMed] [Google Scholar]
- 15. Mi H,, Poudel S,, Muruganujan A,, Casagrande JT,, Thomas PD. PANTHER version 10: expanded protein families and functions, and analysis tools. Nucleic Acids Res. 2016; 44: D336–342. [DOI] [PMC free article] [PubMed] [Google Scholar]
- 16. Mankodi A,, Urbinati CR,, Yuan QP,, et al. Muscleblind localizes to nuclear foci of aberrant RNA in myotonic dystrophy types 1 and 2. Hum Mol Genet. 2001; 10: 2165–2170. [DOI] [PubMed] [Google Scholar]
- 17. Goodwin M,, Mohan A,, Batra R,, et al. MBNL sequestration by toxic RNAs and RNA misprocessing in the myotonic dystrophy brain. Cell Rep. 2015; 12: 1159–1168. [DOI] [PMC free article] [PubMed] [Google Scholar]
- 18. Wang ET,, Cody NA,, Jog S,, et al. Transcriptome-wide regulation of pre-mRNA splicing and mRNA localization by muscleblind proteins. Cell. 2012; 150: 710–724. [DOI] [PMC free article] [PubMed] [Google Scholar]
- 19. Neufeld G,, Cohen T,, Gengrinovitch S,, Poltorak Z. Vascular endothelial growth factor (VEGF) and its receptors. FASEB J. 1999; 13: 9–22. [PubMed] [Google Scholar]
- 20. Ferrara N,, Gerber HP,, LeCouter J. The biology of VEGF and its receptors. Nat Med. 2003; 9: 669–676. [DOI] [PubMed] [Google Scholar]
- 21. Chamberlain CM,, Ranum LP. Mouse model of muscleblind-like 1 overexpression: skeletal muscle effects and therapeutic promise. Hum Mol Genet. 2012; 21: 4645–4654. [DOI] [PMC free article] [PubMed] [Google Scholar]
- 22. Jiang H,, Mankodi A,, Swanson MS,, Moxley RT,, Thornton CA. Myotonic dystrophy type 1 is associated with nuclear foci of mutant RNA, sequestration of muscleblind proteins and deregulated alternative splicing in neurons. Hum Mol Genet. 2004; 13: 3079–3088. [DOI] [PubMed] [Google Scholar]
- 23. Philips AV,, Timchenko LT,, Cooper TA. Disruption of splicing regulated by a CUG-binding protein in myotonic dystrophy. Science. 1998; 280: 737–741. [DOI] [PubMed] [Google Scholar]
- 24. Nakamori M,, Sobczak K,, Puwanant A,, et al. Splicing biomarkers of disease severity in myotonic dystrophy. Ann Neurol. 2013; 74: 862–872. [DOI] [PMC free article] [PubMed] [Google Scholar]
- 25. Kivinen K,, Taimen P,, Kallajoki M. Silencing of nuclear mitotic apparatus protein (NuMA) accelerates the apoptotic disintegration of the nucleus. Apoptosis. 2010; 15: 936–945. [DOI] [PubMed] [Google Scholar]
- 26. Yang W,, Zheng H,, Wang Y,, Lian F,, Hu Z,, Xue S. Nesprin-1 plays an important role in the proliferation and apoptosis of mesenchymal stem cells. Int J Mol Med. 2013; 32: 805–812. [DOI] [PubMed] [Google Scholar]
- 27. Kugelmann D,, Waschke J,, Radeva MY. Adducin is involved in endothelial barrier stabilization. PLoS One. 2015; 10: e0126213. [DOI] [PMC free article] [PubMed] [Google Scholar]
- 28. Wei Z,, Zheng S,, Spangler SA,, Yu C,, Hoogenraad CC,, Zhang M. Liprin-mediated large signaling complex organization revealed by the liprin-alpha/CASK and liprin-alpha/liprin-beta complex structures. Mol Cell. 2011; 43: 586–598. [DOI] [PubMed] [Google Scholar]
- 29. Naydenov NG,, Ivanov AI. Adducins regulate remodeling of apical junctions in human epithelial cells. Mol Biol Cell. 2010; 21: 3506–3517. [DOI] [PMC free article] [PubMed] [Google Scholar]
- 30. Chancellor TJ,, Lee J,, Thodeti CK,, Lele T. Actomyosin tension exerted on the nucleus through nesprin-1 connections influences endothelial cell adhesion, migration, and cyclic strain-induced reorientation. Biophys J. 2010; 99: 115–123. [DOI] [PMC free article] [PubMed] [Google Scholar]
- 31. Poulsen ET,, Dyrlund TF,, Runager K,, et al. Proteomics of Fuchs' endothelial corneal dystrophy support that the extracellular matrix of Descemet's membrane is disordered. J Proteome Res. 2014; 13: 4659–4667. [DOI] [PMC free article] [PubMed] [Google Scholar]
- 32. Koizumi N,, Okumura N,, Ueno M,, Kinoshita S. New therapeutic modality for corneal endothelial disease using Rho-associated kinase inhibitor eye drops. Cornea 2014; 33 (suppl 11): 25–31. [DOI] [PubMed] [Google Scholar]
- 33. Deissler HL,, Deissler H,, Lang GK,, Lang GE. VEGF but not PlGF disturbs the barrier of retinal endothelial cells. Exp Eye Res. 2013; 115: 162–171. [DOI] [PubMed] [Google Scholar]
- 34. Inagaki E,, Hatou S,, Yoshida S,, Miyashita H,, Tsubota K,, Shimmura S. Expression and distribution of claudin subtypes in human corneal endothelium. Invest Ophthalmol Vis Sci. 2013; 54: 7258–7265. [DOI] [PubMed] [Google Scholar]
- 35. Burns RR,, Bourne WM,, Brubaker RF. Endothelial function in patients with cornea guttata. Invest Ophthalmol Vis Sci. 1981; 20: 77–85. [PubMed] [Google Scholar]
- 36. Plotnikov AN,, Hubbard SR,, Schlessinger J,, Mohammadi M. Crystal structures of two FGF-FGFR complexes reveal the determinants of ligand-receptor specificity. Cell. 2000; 101: 413–424. [DOI] [PubMed] [Google Scholar]
- 37. Dell KR,, Williams LT. A novel form of fibroblast growth factor receptor 2. Alternative splicing of the third immunoglobulin-like domain confers ligand binding specificity. J Biol Chem. 1992; 267: 21225–21229. [PubMed] [Google Scholar]
- 38. Miki T,, Bottaro DP,, Fleming TP,, et al. Determination of ligand-binding specificity by alternative splicing: two distinct growth factor receptors encoded by a single gene. Proc Natl Acad Sci U S A. 1992; 89: 246–250. [DOI] [PMC free article] [PubMed] [Google Scholar]
- 39. Gattey D,, Zhu AY,, Stagner A,, Terry MA,, Jun AS. Fuchs endothelial corneal dystrophy in patients with myotonic dystrophy: a case series. Cornea. 2013; 33: 96–98. [DOI] [PMC free article] [PubMed] [Google Scholar]
- 40. Rosa N,, Lanza M,, Borrelli M,, et al. Corneal thickness and endothelial cell characteristics in patients with myotonic dystrophy. Ophthalmology 2010; 117: 223–225. [DOI] [PubMed] [Google Scholar]
- 41. Garcia Filho CAA,, Prata TS,, Sousa AKS,, Doi LM,, Melo LASJ. Intraocular pressure, corneal thickness, and corneal hysteresis in Steinert's myotonic dystrophy. Arquivos Brasileiros de Oftalmologis. 2011; 74: 161–162. [DOI] [PubMed] [Google Scholar]
Associated Data
This section collects any data citations, data availability statements, or supplementary materials included in this article.