

Abstract
The endoplasmic reticulum–mitochondria encounter structure (ERMES) is a protein complex that plays a tethering role in physically connecting ER and mitochondria membranes. The ERMES complex is composed of Mdm12, Mmm1, and Mdm34, which have a SMP domain in common, and Mdm10. Here, we report the crystal structure of S. cerevisiae Mdm12. The Mdm12 forms a dimeric SMP structure through domain swapping of the β1‐strand comprising residues 1–7. Biochemical experiments reveal a phospholipid‐binding site located along a hydrophobic channel of the Mdm12 structure and that Mdm12 might have a binding preference for glycerophospholipids harboring a positively charged head group. Strikingly, both full‐length Mdm12 and Mdm12 truncated to exclude the disordered region (residues 74–114) display the same organization in the asymmetric unit, although they crystallize as a tetramer and hexamer, respectively. Taken together, these studies provide a novel understanding of the overall organization of SMP domains in the ERMES complex, indicating that Mdm12 interacts with Mdm34 through head‐to‐head contact, and with Mmm1 through tail‐to‐tail contact of SMP domains.
Keywords: crystal structure, ERMES complex, Mdm12, phospholipid binding, SMP domain
Subject Categories: Membrane & Intracellular Transport
Introduction
Eukaryotic cells are composed of membrane‐bound subcellular compartments that play distinct and essential roles for cell survival. The compartments not only work independently, but also they actively cooperate to achieve their ultimate roles. Apart from communication among subcompartments achieved through vesicular trafficking, direct contact sites of subcompartment membranes have been discovered through electron microscopy (EM) 1, 2, 3. Such membrane contact sites (MCSs) are involved in essential processes for cell survival, such as subcellular communications, ion homeostasis, metabolic pathways, and lipid biosynthesis 1, 2, 3, 4, 5.
Among several MCSs, ER–mitochondria direct contact sites have been extensively studied in terms of physical tethering of two membranes and their physiological relevancies, such as lipid trafficking and Ca2+ exchange 6, 7, 8, 9. The endoplasmic reticulum–mitochondria encounter structure (ERMES) components were first identified as molecular tethering factors in the formation of ER–mitochondrial junctions using synthetic biology screens in S. cerevisiae 10. The ERMES complex consists of four proteins with different subcellular localizations. Mdm12 (mitochondrial distribution and morphology protein 12) is a soluble protein present in the cytosol, while Mmm1 (maintenance of mitochondrial morphology protein 1) and Mdm34/Mdm10 are integral membrane proteins that are anchored in the ER and mitochondrial outer membranes, respectively. Additionally, Gem1 (GTPase EF‐hand protein of mitochondrial 1), a Ca2+‐binding Miro GTPase, associates with ERMES and regulates the number, size, and functions of these complexes in yeast 11, 12. In addition to its primary role in maintaining a close proximity (10–30 nm) between two membranes independently of fusion or fission, the ERMES complex also has been known to function in lipid trafficking to cooperatively synthesize phosphatidylcholine (PC) from phosphatidylserine (PS) in ER and mitochondria junctions 10, 13, 14, 15. However, there is a conflicting report that ERMES and Gem1 do not directly affect PS trafficking 16. Recently, a couple of redundant pathways for lipid trafficking involved in the maintenance of mitochondrial lipid homeostasis have been reported. For example, the EMC (ER–membrane protein complex) located in the ER tethers a phosphatidylethanolamine (PE) to mitochondria by interacting with a TOM (translocase of the outer membrane) 17. The vCLAMP (vacuole and mitochondria patch) is another alternative pathway for transferring lipids to the mitochondria 18, 19. Composite defects in these pathways result in severe disruption of mitochondrial lipid homeostasis. In addition to lipid trafficking, the Mdm12–Mmm1 complex plays an important role in β‐barrel assembly of mitochondrial outer membrane proteins, and in the maintenance of mitochondrial morphology and mtDNA 6, 20. Furthermore, the ERMES complex has been repeatedly implicated in essential activities for cell survival such as mitophagy, inheritance, mtDNA inheritance, and mitochondrial dynamics 12, 21, 22, 23, 24, 25.
Primary structure analyses of ERMES components reveal that Mdm12, Mmm1, and Mdm34 share a synaptotagmin‐like mitochondrial‐lipid‐binding protein (SMP) domain, although their sequences are not closely related to each other 13. In particular, full‐length Mdm12 contains SMP domains across its entire sequence, while SMP domains in Mmm1 and Mdm34 account for half of the C‐terminus and N‐terminus, respectively. The remaining halves of the Mmm1 and Mdm34 protein sequences are predicted to be unstructured and not conserved among species, and the C‐terminus of Mdm34 is known to be anchored into the outer mitochondrial membrane 26. Structural studies demonstrated that the SMP domain adopts a dimer configuration rather than existing solely as a monomer 27, 28, 29. The association of SMP domains might act as the driving force in the assembly of ERMES components and maintain intact membrane proximity. Biochemistry experiments combined with a negative‐staining EM structure revealed that Mdm12–Mmm1 forms a hetero‐tetramer through the direct association of SMP domains, generating an arch‐shaped structure with dimensions of ~210 × 45 × 35 Å 30. However, despite its importance in ER–mitochondria contact, no high‐resolution structures of the ERMES complex are available. Therefore, the molecular details of how the SMP domains in the ERMES complex are organized to tether two organelles, and how ERMES recognizes certain lipids and facilitates their trafficking, remain unknown.
In this study, we determined the crystal structures of full‐length Mdm12 and ΔMdm12 (Δ74–114) and elucidated the molecular details of the contact regions for self‐association of SMP domains and of lipid coordination in Mdm12. Furthermore, we suggest that two interfaces between SMP domains, head‐to‐head and tail‐to‐tail, provide a mechanistic understanding of the assembly and organization of the ERMES tetrameric complex at a molecular level.
Results
The oligomeric state of full‐length Mdm12 and Mmm1
We prepared the Mdm12 protein from S. cerevisiae by expression in E. coli bacterial cells. Interestingly, the S. cerevisiae Mdm12 migrated differently on size‐exclusion columns, depending on the presence or absence of N‐terminus hexa‐histidine (His6) tag plus TEV cleavage site (ENLYFQS) for full‐length Mdm12 proteins. Full‐length Mdm12 without His6 eluted from the column at a volume corresponding to approximately the mass of the Mdm12 dimer. On the other hand, His6–Mdm12 eluted from the column at a mass corresponding to the Mdm12 monomer (Fig 1A and B). The TEV cleavage site existing between His6 tag and Mdm12 was not vulnerable to proteases, suggesting that the N‐terminus including the TEV cleavage site of Mdm12 was somehow masked by the protein itself. To further investigate the oligomeric state of Mdm12 and measure the molecular weights in solution, we conducted analytical ultracentrifugation with native Mdm12 and His6‐Mdm12 proteins. Consistent with gel‐filtration chromatography, Mdm12 and His6‐Mdm12 were measured as 58.3 kDa (dimer) and 34.5 kDa (monomer), respectively (Figs 1C and EV1). From this observation, we propose that the N‐terminus of Mdm12 could be critically involved in self‐association and that the extra amino acid sequences consisting of the His6 tag and TEV cleavage sequence might disturb the dimerization of the protein.
Figure 1. Mdm12 and Mmm1 organization.
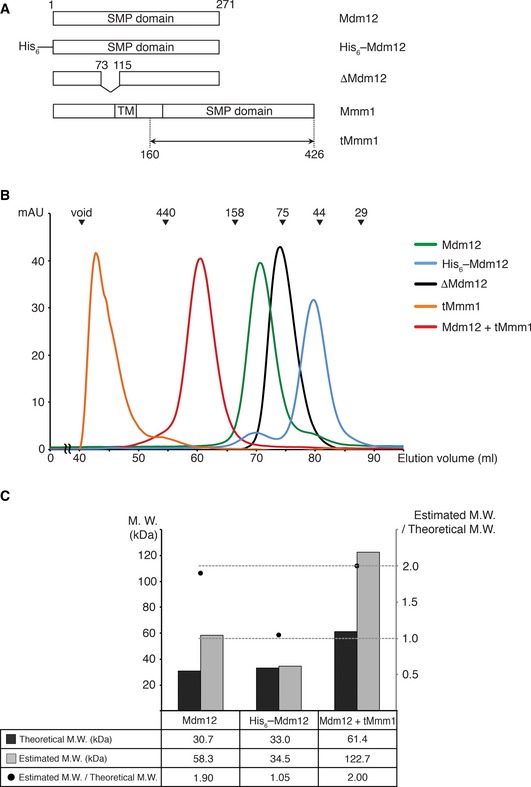
- Schematic diagrams showing the domain structures of Mdm12 and Mmm1 used in this study.
- Size‐exclusion chromatography (SEC) experiments of Mdm12, tMmm1, and the Mdm12–tMmm1 complex comparing the molecular size of these proteins in solution. The proteins indicated were injected into a Superdex 200 column (GE Healthcare) with a buffer containing 25 mM Tris–HCl (pH 7.5), 150 mM NaCl, and 5 mM DTT. The standard molecular masses for the SEC experiments (top) are shown for relative molecular weight comparison (blue dextran, void; ferritin, 440 kDa; aldolase, 158 kDa; conalbumin, 75 kDa; ovalbumin, 44 kDa; and carbonic anhydrase, 29 kDa).
- Graph indicating the molecular weights of Mdm12, His6–Mdm12, and the Mdm12–tMmm1 complex in solution as measured by analytical ultracentrifugation.
Figure EV1. Analytical ultracentrifugation experiments.
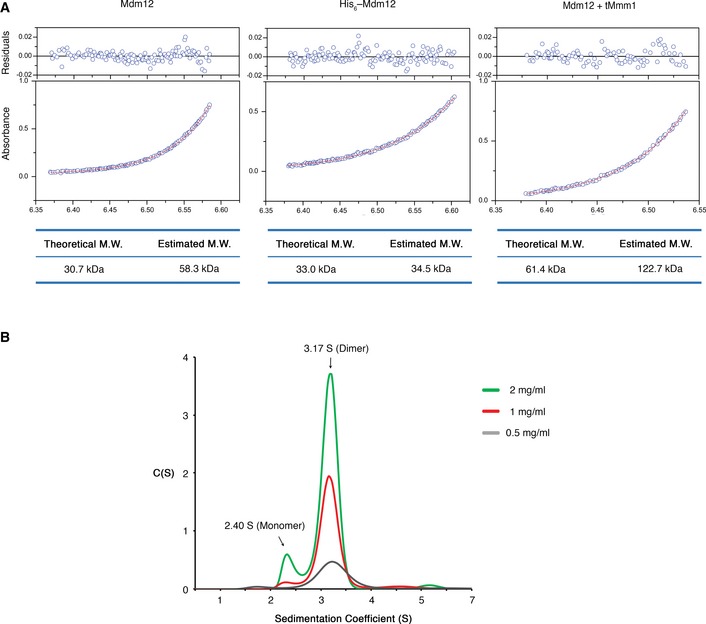
- Sedimentation equilibrium fitting results following analytical ultracentrifugation of wild‐type Mdm12 (left), N‐terminus hexahistidine‐tagged Mdm12 (His6–Mdm12, middle), and the Mdm12–Mmm1 complex (right). The lower panel depicts the fitted overlay (red line) to the experimental data (blue circles). The upper panel depicts the residuals.
- Sedimentation velocity analytical ultracentrifugation profiles of wild‐type Mdm12. Self‐oligomerization of wild‐type Mdm12 was analyzed at various concentrations (0.5, 1, and 2 mg/ml) at 20,124 g. Peak sedimentation coefficient values of 2.40 S and 3.17 S correspond to monomer and dimer, respectively.
Mmm1 from S. cerevisiae was eluted in the void volume fraction during gel‐filtration column chromatography, indicating that by itself Mmm1 is aggregated in solution (Fig 1B). However, when we co‐expressed Mmm1 with Mdm12 in BL21 (DE3) bacterial cells, the complex displayed a monodisperse profile on the gel‐filtration column, with an estimated molecular weight of around 200 kDa, suggesting that the Mdm12–Mmm1 complex exists as a hetero‐tetramer in solution. This result was confirmed by analytical ultracentrifugation (Fig 1C, M.W. 122.7 kDa) and is consistent with previous data 30.
Crystal structure determination for S. cerevisiae Mdm12
Full‐length Mdm12 proteins from S. cerevisiae were crystallized under various conditions. The best crystals grew in a P21212 space group and diffracted to 3.1 Å resolution at a synchrotron source. The initial electron density map was calculated to 3.5 Å resolution from Se‐Met‐derivatized crystals using a single‐wavelength anomalous diffraction (SAD) experiment, and the structure was phase extended and refined to 3.1 Å resolution with native crystal with R work/R free values of 21.2/26.5%. Statistics for data collection and refinement are presented in Table 1.
Table 1.
Data collection and refinement statistics
| Mdm12 native | Mdm12 Se‐SAD | ΔMdm12 native | |
|---|---|---|---|
| Dataset | |||
| PDB accession # | 5GYD | 5GYK | |
| X‐ray source | Beamline 5C, PAL | Beamline 5C, PAL | Beamline 5C, PAL |
| Temperature (K) | 100 | 100 | 100 |
| Space group | P21212 | P21212 | P212121 |
| Cell parameters a, b, c (Å) | 142.592, 219.073, 73.097 | 142.592, 219.017, 73.268 | 109.239, 148.243, 212.394 |
| Data processing | |||
| Wavelength (Å) | 0.97933 | 0.97928 | 0.97957 |
| Resolution (Å) | 35.0–3.10 (3.15–3.10) | 50.0‐3.50 (3.55–3.50) | 50.0‐3.60 (3.66–3.60) |
| R merge (%)a | 11.0 (84.5) | 14.3 (65.8) | 14.2 (67.9) |
| CC1/2 | 0.995 (0.626) | 0.994 (0.841) | 0.995 (0.648) |
| I/σ | 19.9 (2.22) | 20.6 (3.98) | 11.1 (2.21) |
| Completeness (%) | 99.6 (100.0) | 99.8 (100.0) | 99.7 (100.0) |
| Redundancy | 5.3 (5.3) | 6.4 (6.6) | 3.6 (3.7) |
| Measured reflections | 221,431 | 190,622 | 146,540 |
| Unique reflections | 41,953 | 29,933 | 40,722 |
| Refinement statistics | |||
| Data range (Å) | 35.0–3.10 | 50.0–3.60 | |
| Reflections | 41909 | 40625 | |
| Non‐hydrogen atoms | 7409 | 10865 | |
| R.m.s. ∆ bonds (Å)b | 0.009 | 0.007 | |
| R.m.s. ∆ angles (°)b | 1.490 | 1.369 | |
| R‐factor (%)c | 21.2 | 22.5 | |
| R free (%)c , d | 26.5 | 26.7 | |
| Ramachandran plot, residues in | |||
| Most favored regions (%) | 91.9 | 88.3 | |
| Additional allowed regions (%) | 7.6 | 10.2 | |
| Generously allowed regions (%) | 0.5 | 1.5 | |
| Disallowed regions (%) | 0 | 0 | |
Highest resolution shell is shown in parenthesis.
R merge = 100 × ∑h∑i | I i(h) − <I(h)> |/∑h<I(h)>, where I i(h) is the i th measurement and <I(h)> is the weighted mean of all measurements of I(h) for Miller indices h.
Root‐mean‐squared deviation (r.m.s. ∆) from target geometries.
R‐factor = 100 × ∑|FP – FP(calc)|/∑ FP.
R free was calculated with 5% of the data.
Overall structure of Mdm12
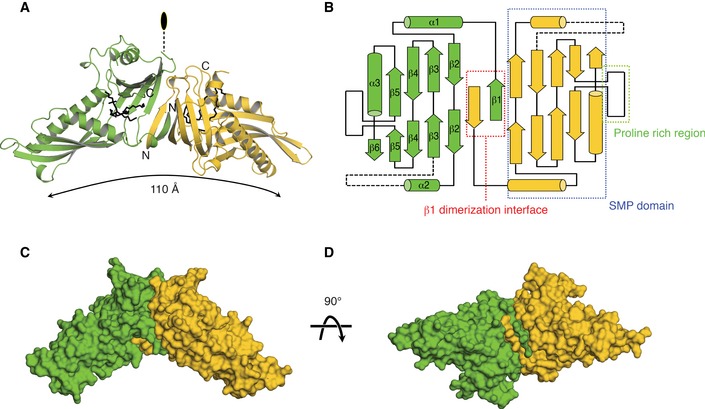
The molecular models of Mdm12 are presented in Fig 2A–D. As observed by size‐exclusion chromatography, the full‐length Mdm12 forms dimers in the crystals with the asymmetric unit containing two Mdm12 dimers (four Mdm12 monomers in total) related to twofold symmetry. The four Mdm12 molecules are almost identical with a RMSD of < 0.3 Å. The crystal structure reveals that the Mdm12 dimer adopts an elongated tubular structure with dimensions of 40 Å × 60 Å × 110 Å (Fig 2A). The Mdm12 monomer consists of three structural elements: (i) β1‐dimerization center; (ii) β‐barrel with incomplete and highly twisted β‐strands and three α‐helices, which are comparably organized as shown in most synaptotagmin (SMP) domain‐containing proteins 27, 28, 29; and (iii) proline rich region, which protrudes from the SMP domain from the middle of the last strand of the β‐barrel (Figs 2B and EV2). The truncated cone‐shaped structure of the Mdm12 monomer forms an extensive hydrophobic channel through the elongated cavity, which was reported to provide a binding channel for particular fatty acids (discussed below) in previous studies 27, 28, 29. Two Mdm12 molecules are arranged in a twofold symmetry and associate with each other through domain swapping of the N‐terminus β‐strand (β1) comprising residues 1–7 as detailed below. Overall, the Mdm12 dimer structure resembles that of members of the TULIP family such as E‐SYT2 (extended synaptotagmin 2, RMSD: 5.71), CETP (cholesteryl ester transfer protein, RMSD: 4.47), and BPI (bactericidal/permeability‐increasing protein, RMSD: 4.26) despite the absence of any significant sequence similarity among them 27, 28, 29. Notably, BPI and CETP exist as monomers containing two separate SMP domains that show no significant sequence conservation between them.
Figure 2. Overall structure of Mdm12.
-
ARibbon diagram of the yeast Mdm12 dimer. The crystal structure of full‐length Mdm12 was determined by SAD and refined with native data to 3.1 Å resolution. Lipids bound to Mdm12 are drawn with black stick models.
-
BSchematic diagram indicating the secondary structure elements and their organization in Mdm12. Three structural elements of Mdm12 are highlighted in different colored boxes.
-
C, DSurface representations of the Mdm12 dimer are shown in different orientations.
Figure EV2. Sequence conservation of Mdm12.
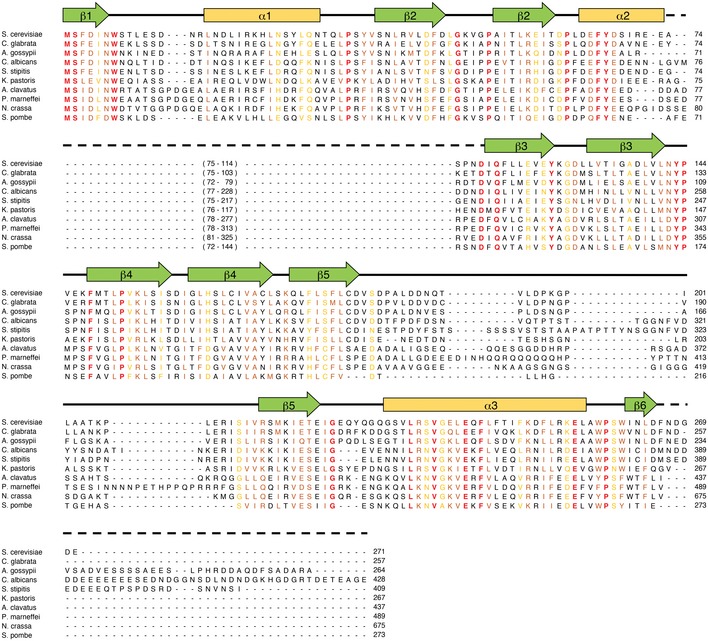
Sequence alignment of Mdm12 orthologs in fungi. The secondary structure elements are indicated above the sequences with helices, strands, loops, and disordered regions represented by arrows, cylinders, solid lines, and dashed lines, respectively. The absolutely conserved and highly similar sequences are highlighted in red and yellow, respectively.
No electron density was observed for residues 74–114 of Mdm12, suggesting that this region might be highly flexible. Furthermore, these residues are not conserved in several Mdm12 orthologs. We obtained another orthorhombic crystal from the construct excluding the disordered region (Δ74–114, referred to as ΔMdm12 hereafter) in full‐length Mdm12. The crystals of ΔMdm12 grew in a P212121 space group and diffracted to 3.6 Å resolution. The structure of ΔMdm12 was solved by molecular replacement using the full‐length Mdm12 structure as the search model and refined to 3.6 Å resolution. ΔMdm12 also crystallized as a dimer, and the structures and twofold arrangement of Mdm12 and ΔMdm12 are almost identical with a RMSD of 0.5 Å.
The highly conserved β1‐strand of Mdm12 forms the dimeric interface for self‐association
The N‐terminus of Mdm12 is highly conserved among Mdm12 orthologs (Fig 3A). In the Mdm12 dimer, residues 1–7 from one monomer fold into a β‐strand that inserts itself between β1 and β2 from the second monomer, running antiparallel with β1 and parallel with β2 in the twofold center of the Mdm12 dimer. They are systematically associated with each other by forming a hydrogen bond network among main chains of the protein between β1 (residues 4–7) and β2 (residues 53–56) from counter molecules, and two β1 (residues 1–6) strands from two molecules (Fig 3A). The buried surface area caused by the dimerization of Mdm12 is around 1,400 Å2. E‐SYT2 makes a twofold dimerization interface between two separate SMP domains using a highly conserved helix (residues 167–180) located at the beginning of each SMP domain (Fig 3C). The dimeric interface of Mdm12 closely resembles the twofold‐like interface of CETP and BPI involving two SMP domains, an interface consisting of the central β‐sheets comprising six antiparallel β‐strands (Fig 3C). However, it is a distinctive feature of Mdm12 that the dimer is formed through domain swapping of the central β‐strand located between the two SMP domains.
Figure 3. Dimer interface of Mdm12.
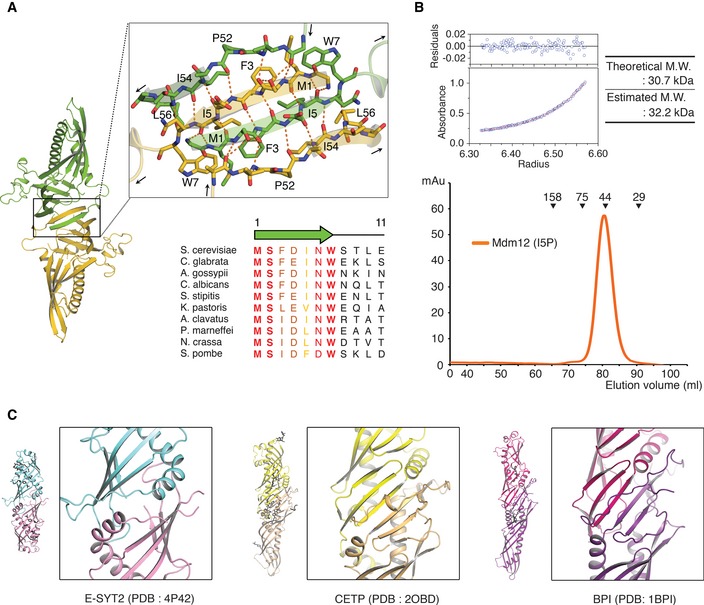
- Ribbon diagram showing the twofold dimerization interface of Mdm12. Oxygen and nitrogen atoms are shown in red and blue, respectively. The orange dotted lines indicate intermolecular hydrogen bonds between two protomers of Mdm12. The sequence alignment of yeast Mdm12 orthologs is shown to highlight the sequence conservation in the N‐terminus β1‐strand. Ten orthologs are aligned from residues 1–11. Absolute and highly conserved residues are indicated in red and orange, respectively.
- The molecular weight of the Mdm12 (I5P) mutant was measured by size‐exclusion chromatography (below) and ultracentrifugation (top) as in Fig 1B and C.
- Ribbon diagram showing the structures of the SMP domain in E‐SYT2, CETP, and BPI for the comparison of dimeric interfaces among SMP domains. Note that CETP and BPI are not dimers but monomers containing two tandem SMP domains.
To further investigate whether the role of the β1‐strand in the dimerization of Mdm12 as observed in the crystal structure also applied to Mdm12 in solution, we generated a point mutant (I5P) aimed at disrupting the β1‐strand structure. In the dimer, the main chain of I5 forms H‐bonds with the main chain of M1 from the second Mdm12 molecule, and its side chain makes van der Waals interactions with the hydrophobic side chains of M1, F3, W7, and I54 in the second molecule. As expected, both gel‐filtration and analytical ultracentrifugation experiments revealed that the I5P mutant could not form a homo‐dimer (Fig 3B), supporting the critical involvement of the highly conserved β1‐strand in Mdm12 homo‐dimerization in solution.
The SMP domain of Mdm12 binds phospholipid
Initial electron density maps clearly displayed a lipid‐like molecule inside the hydrophobic channel of the Mdm12 monomer (Fig 4A and B). We were unable to identify the bound phospholipid using only electron density maps because of (i) the mid‐range resolution (~3.1 Å) of this structure and (ii) the disordered electron density corresponding to the head group of phospholipid. However, it was previously reported that the recombinant Mdm12 proteins expressed in bacteria bind PE (~80%) and PG (~15%) species 30. Therefore, we inferred that the diacyl glycerophospholipid bound to Mdm12 might be a PE or PG. To identify the phospholipids present in the Mdm12 structure, we performed denaturing quantitative APCI‐MS using purified Mdm12 expressed in E. coli. The major phospholipid bound to Mdm12 was observed to have an m/z of 704.5 (Fig EV3B), which identified the molecule as PE, consistent with a previous lipidomic analysis in which PE (33:1) with an m/z of 704.5 was the predominant phospholipid co‐purified with Mdm12 expressed in bacteria 30. We built a PE (1,2‐dioleoyl‐sn‐glycero‐3‐phosphoethanolamine) into the diacyl‐like ligand density (Fig 4A), and the lipid‐bound Mdm12 structure was well refined with native diffraction data. Ligand positioning is almost identical among three Mdm12 molecules within the asymmetric unit, except in one Mdm12 molecule, where the hydrocarbon chain of lipid is displaced and the head region is disordered (Fig EV3A). This displacement might be the result of crystal packing because the hydrophobic cavity of this molecule was slightly shrunk through the formation of close contacts with the symmetry‐related molecules in the crystal.
Figure 4. Mdm12 binds lipid through the SMP domain.

- Simulated annealing omit map (Fo‐Fc, contoured at 1.5σ) showing the molecule bound to Mdm12 (left). The final model for the bound PE is shown as in stick representation. The electron density (2Fo‐Fc) calculated in the final model is shown with the stick model of PE in the right (3.1 Å resolution, contoured at 0.8σ).
- Surface representation of the Mdm12 dimer. Hydrophobic amino acids lining the Mdm12 channel are indicated by a blue mesh. Lipids built in Mdm12 are in space‐filling representation.
- Ribbon diagram showing lipid coordination by Mdm12. Mdm12 residues and lipid fatty acids are colored in green and yellow, respectively.
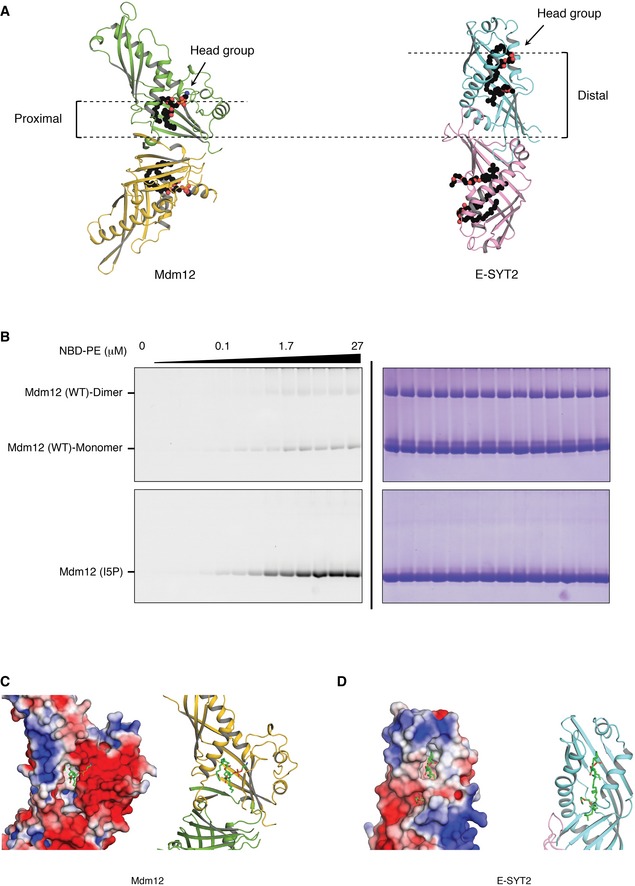
- Mdm12 binds NBD‐PE. Wild‐type and monomeric (I5P mutant) Mdm12 were incubated with NBD‐PE and separated from free NBD‐PE in native PAGE. Coomassie staining (left) and fluorescent (right) detection indicates that Mdm12 directly interacts with NBD‐PE in vitro.
- Quantitative data showing binding affinities for NBD‐PE by Mdm12. The binding affinities of Mdm12 (monomer/dimer shown in native PAGE and I5P mutant) for NBD‐PE was measured with a NBD‐PE concentration‐dependent manner. All experiments were carried out three times, and the means ± SD are given.
- Mdm12 mutants (L256W, I262W, and L256W/I262W double mutants) were incubated with NBD‐PE and subjected to native PAGE. Because wild‐type Mdm12 separates as both monomer and dimer on native PAGE, the purely monomeric form (I5P) of Mdm12 was used as the wild type for clarity. The graph in the right indicates the quantities measured in the experiments. The bar shows the relative amounts of the band ratio (fluorescence/Coomassie). Values represent the means and SD from three independent experiments.
Source data are available online for this figure.
Figure EV3. Structural comparison of lipids bound to Mdm12 in the crystallographic asymmetric unit and lipids identified from APCI‐MS analysis.
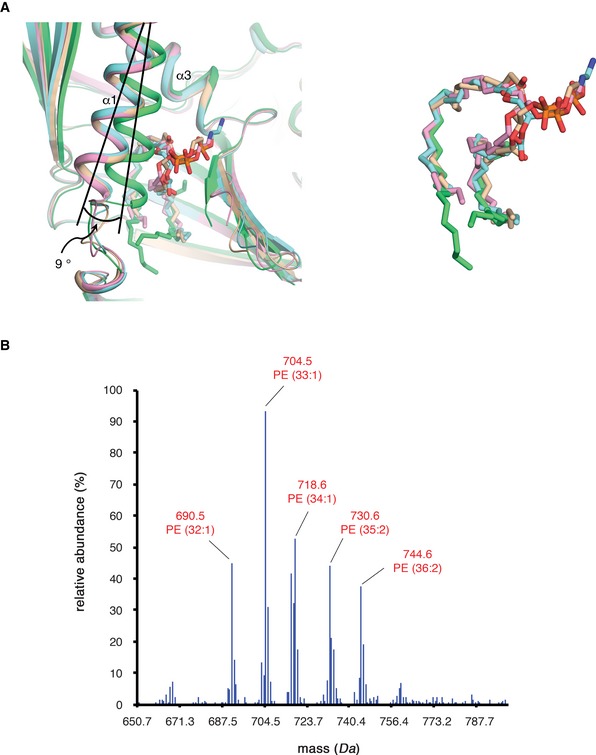
- Ribbon diagram showing the overlay of the lipids bound to the SMP domains of the four Mdm12 molecules in the asymmetric unit. Four Mdm12 molecules and the hydrocarbon chains of bound lipids are identically colored in pink, green, cyan, and yellow. Oxygen and nitrogen atoms in lipids are colored in red and blue, respectively. The α1‐helices and bound lipids in the three Mdm12 molecules (pink, cyan, yellow) precisely align with each other. However, the α1‐axis of one Mdm12 (green) molecule is tilted around 9 degrees owing to crystal packing. The displaced α1‐helix induces a break in coordination of the lipid hydrocarbon chain, and the head group of the lipid is disordered in the structure. Right figure shows only the lipids bound to Mdm12 for clarity.
- Quantitative profiling of phospholipids bound to Mdm12 purified from E. coil using APCI‐MS (see Materials and Methods section for details). The most abundant species bound to Mdm12 had a mass of 704.5 Da and was identified as PE (33:1), consistent with a previous report 30.
Based on our crystal structure, the head group of phospholipid is exposed into the solvent and makes no direct contacts with neighboring residues of Mdm12, indicating that Mdm12 might have no clear selectivity for specific phospholipids. However, the fatty acyl chain of PE was tightly coordinated by the hydrophobic side chains of neighboring amino acids including I20, F45, L47, L177, F179, F251, L256, I262, and L264 (Fig 4C). We tested the ability of phospholipids to bind directly to the SMP domain of Mdm12 in vitro. We used the fluorescently labeled PE (7‐nitro‐benz‐2‐oxa‐1,3‐diazol‐4‐yl‐1,2‐dipalmitoyl‐sn‐glycero‐3‐phosphoethanolamine, referred to as NBD‐PE) and full‐length Mdm12 purified from E. coli to measure their binding, as previously described 29, 30. Mdm12 proteins incubated with NBD‐PE were run onto native PAGE to remove unbound NBD‐PE, and NBD‐PE‐bound Mdm12 was quantified with fluorescence detection. Figure 4D and E shows that Mdm12 binds NBD‐PE in a concentration‐dependent manner. Unexpectedly, while around half of the full‐length Mdm12 appeared as a dimer (46% of total Mdm12), the other half ran as a monomer (54%) in the native PAGE, as compared with Mdm12 (I5P) that migrated only as a monomer. The monomer and dimer distribution of Mdm12 observed in native PAGE was not correlated with NBD‐PE incorporation (Figs 4D and EV4B). More surprisingly, monomeric Mdm12 had a higher affinity for NBD‐PE than did dimeric Mdm12. Interestingly, the I5P mutant showed the highest affinity for NBD‐PE, suggesting that the N‐terminal β1‐strand of Mdm12 might be involved in regulating lipid trafficking, including access. Indeed, the structure shows the lipid‐binding region, including the head group, to be very close to the dimerization interface. The dimerization of Mdm12 could thus sterically occlude lipid access, and the perturbation of the β1‐strand by mutation therefore increased the affinity for NBD‐PE (Fig EV4).
Figure EV4. Mdm12 preferentially binds phospholipids with a positively charged head group at the dimerization interface.
-
AFigure highlights that the lipid‐binding site of Mdm12 is proximal to the dimerization interface. Views are along the twofold rotation axis. The bound lipids are shown as spheres. The hydrocarbon, oxygen, and nitrogen are colored in black, red, and blue, respectively. Lipids bound to Mdm12 are located in close proximity to the dimerization interface, in contrast to E‐SYT2 where there is a clear separation between the two sites. As the dimerization interface of Mdm12 would be similar to the Mdm12–Mdm34 interface (see the text), the proximal position of lipids could be advantageous in facilitating the translocation of lipids between the two proteins.
-
BBinding affinities of Mdm12 (monomer/dimer [top] and the I5P mutant [bottom]) for NBD‐PE. Coomassie‐stained (right) and fluorescently labeled (left) native PAGE gels are shown.
-
C, DSurface charge distribution around the lipid‐binding regions in Mdm12 and E‐SYT2. Ribbon diagrams (right) show their orientations. Surface charges were calculated as in Fig 5A.
Next, to validate the lipid coordination shown in our Mdm12 structure, we generated a construct harboring mutations in L256 and I262, both mutated to tryptophan residues. Our rationale was that the bulky side chain of tryptophan introduced by these mutations would occupy the hydrophobic cavity and generate a steric hindrance for lipid interaction. Compared with wild‐type Mdm12 (I5P), the affinities of I262W and the L256W/I262W double mutants for NBD‐PE were reduced by twofold and fourfold, respectively (Fig 4F). In this experiment, the Mdm12 (I5P) mutant was used as a reference to compare the effects of I262W and L256W/I262W because it migrated as a monomer during native PAGE.
Mdm12 has a clear preference for positively charged phospholipids
We further investigated the structure to determine whether Mdm12 might have a preference for certain phospholipids under native conditions. Interestingly, the surface for Mdm12 in which the phospholipid head group is placed represents a negative charge according to analysis of the surface electrical potential 31 (Fig 5A). The negative electric potential comes from mainly the C‐term dipole end of helix 3, the main chain carbonyl oxygen of the loop comprising residues 250–255, and negatively charged side chains from E65, E73, E255, and D265. An investigation using the ConSurf 32 server revealed that these residues of Mdm12 are highly conserved among different species. We propose that Mdm12 might have a higher affinity for phospholipids with positive charges, such as PC or PE, than for negatively charged lipids. This hypothesis is supported by previous biochemical studies, which show that Mdm12 has a higher affinity for PC and PE than for PA and PS 30. To measure quantitatively and kinetically the natural lipid‐binding ability of Mdm12, we carried out lipid replacement experiments as previously described 29, 30. NBD‐PE‐preloaded Mdm12 (GST‐tagged at the C‐terminus) was incubated with a series of phospholipids in a dose‐dependent manner, and the amount of NBD‐PE replaced by non‐labeled phospholipids was estimated by measuring the decrease in fluorescence. Figure 5B shows that PC and PG have the highest affinity for Mdm12 among the phospholipids tested, consistent with a previous report in which PC was confirmed as a bona fide ligand of Mdm12 purified from yeast in vitro 30. Interestingly, acidic phospholipids such as PA and PS were unable to replace NBD‐PE, even when present at a high concentration (~0.25 mM). To investigate the involvement of negatively charged amino acids in phospholipid selection, we engineered the E255R mutant of Mdm12 and measured its binding affinity for PC. Interestingly, the binding affinity of the E255R mutant for PC was reduced by ~1.4‐fold compared with the wild‐type protein, which supports our suggestion that the negatively charged surface of Mdm12 underpins its preference for positively charged phospholipids (Fig 5B).
Figure 5. Glycerophospholipid selectivity of Mdm12.
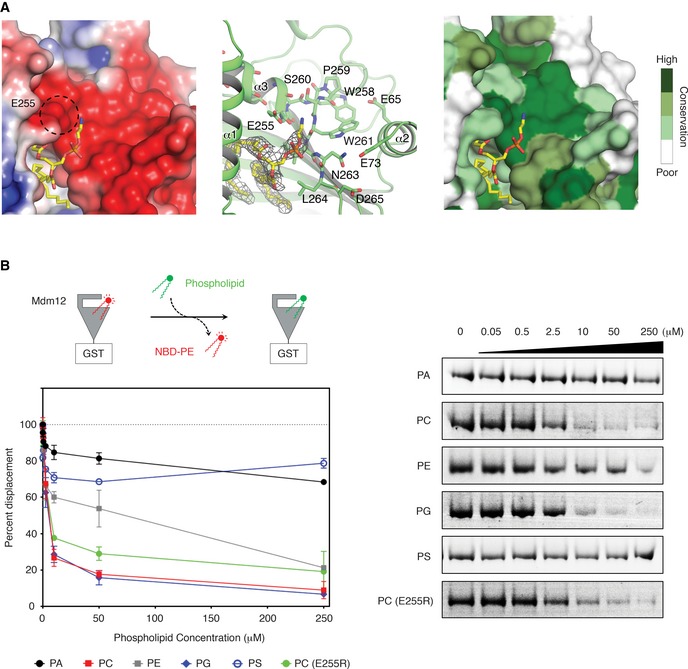
- Structural views suggesting that Mdm12 might have a preference for certain phospholipids. The surface representation of Mdm12 positioned around the binding site for the head group of PE is shown with charge distribution (left) and the sequence conservation (right) in the same orientation. Surface electrostatics and sequence conservation were calculated using an APBS program 31 with the nonlinear Poisson–Boltzmann equation and contoured at ± 3 kT/e, and ConSurf website (consurf.tau.ac.il) 32 with 34 different yeast orthologs, respectively. The ribbon diagram shown in the middle indicates the overall orientation of Mdm12.
- Lipid displacement experiments to identity the natural ligands of Mdm12 in vitro (see Materials and Methods section for details). NBD‐PE‐preloaded Mdm12‐GST was mixed with a series of glycerophospholipids at different concentrations, and displacement of NBD‐PE by non‐labeled ligand was estimated from the decrease in fluorescence. Means ± SD are shown (n = 3 independently performed experiments).
Source data are available online for this figure.
In E‐SYT2, no apparent weighted surface charge for the hydrophilic head group of lipid is apparent (Fig EV4C), which is consistent with data demonstrating that E‐SYT2 has no preference for specific phospholipids. However, while E‐SYT2 might recruit other proteins for their lipid selectivity 29, no additional proteins have yet been suggested to provide lipid selectivity in the ERMES complex. Taken together, we propose that Mdm12 might have a preference for binding of positively charged phospholipids through its negatively charged surface.
Putative architecture of Mdm12–Mmm1 complex
In the crystal asymmetric unit, there are four Mdm12 molecules (Fig 6A). In addition to the N‐terminus dimerization interface (referred to as “head”), two Mdm12 dimers make another twofold rotation arrangement through the highly conserved C‐terminal helices (referred to as “tail”), resulting in an extended arch‐shaped structure with a 200 Å long dimension. Here, two Mdm12 dimers self‐associate through a tail‐to‐tail junction, burying a surface accessible area of around 765.8 Å2 (Fig 6C). We initially considered that the tail‐to‐tail junction of the SMP domain shown in the Mdm12 structure might represent a crystal contact, not a biological one, based on previous biochemical experiments demonstrating that Mdm12 forms a homo‐dimer in solution. The structure of ΔMdm12 lacking residues 74–114 has the same arrangements of the molecules in the asymmetric unit, although ΔMdm12 crystals are differently packed from wild‐type Mdm12 (Fig 6B). Crystals of ΔMdm12 contain six ΔMdm12 molecules in the asymmetric unit, and three ΔMdm12 dimers are organized through a tail‐to‐tail junction in a similar fashion to wild‐type Mdm12. Previous biochemical data show that Mdm12 interacts with Mmm1 in a 1:1 ratio stoichiometry, and four molecules are depicted in an elongated organization as a series of Mdm12‐(Mmm1)2‐Mdm12 30. We propose a new model in which Mmm1 forms a homo‐dimer through a head‐to‐head interaction of each SMP domain in the center, and a hetero‐dimer with Mdm12 through a tail‐to‐tail interaction of their respective SMP domains. Consistent with the hypothesis, the size‐exclusion chromatography experiment of Mmm1–Mdm12 (Δ1–10) revealed that the N‐terminus‐truncated Mdm12 retained its ability to interact with Mmm1, suggesting that the N‐terminus of Mdm12 is not involved in the interaction with Mmm1 (Fig 6D). Based on these results, we suggest that the tail‐to‐tail contact of two SMP domains from the Mdm12 tetramer and ΔMdm12 hexamer, as shown in the two crystal structures, might provide a novel structural binding interface from two SMP domains between Mmm1 and Mdm12.
Figure 6. The Mdm12/ΔMdm12 molecules in the asymmetric unit provide an insight into the organization of the Mdm12–Mmm1 binary complex.
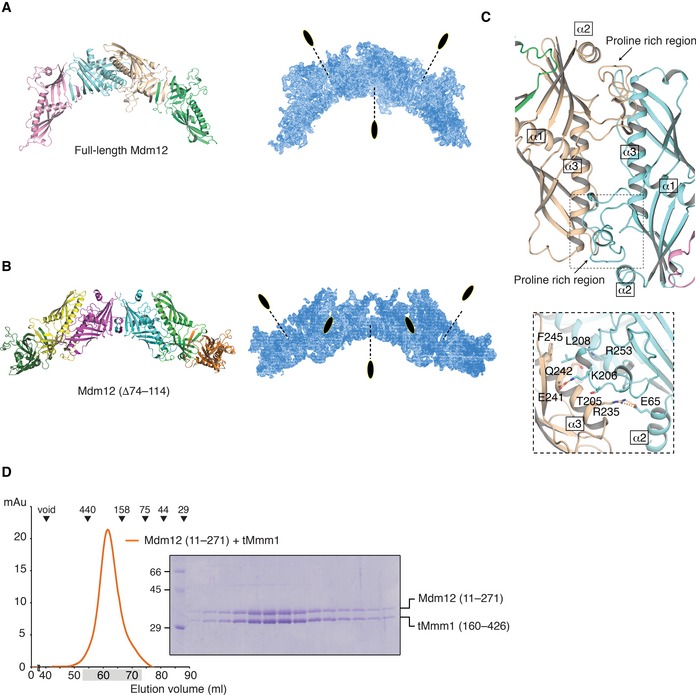
- Overall structure (left) and electron density (right) of Mdm12 in the asymmetric unit. Four molecules (two Mdm12 dimers) are organized with twofold rotation symmetry. The twofold axes are indicated with a black dotted line.
- Overall structure (left) and electron density (right) of ΔMdm12 in the asymmetric unit. Six ΔMdm12 molecules (three Mdm12 dimers) are arranged with twofold rotation symmetry as shown above.
- Ribbon diagram showing a twofold interface (tail‐to‐tail) in two crystal structures (see text for details).
- Size‐exclusion chromatography revealing that the N‐terminus‐truncated version of Mdm12 (residues 11–271) retains the ability to interact with Mmm1. The experiment was performed as in Fig 1B. Eluted fractions indicated by shading were subjected to SDS–PAGE followed by Coomassie Blue staining.
Source data are available online for this figure.
Discussion
In this study, we have elucidated the crystal structure of Mdm12 and the organization of SMP domains from self‐associated molecules in crystal asymmetric unit. To ensure the correct organization of ERMES components and eventually the facilitation of direct contact between the two organelles, the interactions among the SMP domains of the different ERMES components are of critical importance. A potential model for the formation of the Mdm12–Mmm1–Mdm34 ternary complex is represented in Fig 7A and C. Similar to most SMP domains, Mmm1 forms a homo‐dimer through the head region of its SMP domain, while the tail region of Mmm1 forms a hetero‐dimer with Mdm12 through the highly conserved tail region of its SMP domain. Since both the biochemical data and EM structure showed that Mdm12–Mmm1 forms a hetero‐tetramer rather than a hetero‐hexamer, accommodating the organization of the Mdm12–Mmm1 complex in our model would first require the dissociation of the Mdm12 homo‐dimer. The results of native PAGE described above showed that Mdm12 alone exists in a dynamic monomer/dimer equilibrium, and the crystal structure revealed that Mdm12 self‐associates through its N‐terminus. Given that the interaction of Mdm12 with Mmm1 occurs through tail‐to‐tail contact of their respective SMP domains, the exposed head region of the Mdm12 monomer would then be free to associate with the SMP domain of Mdm34, which is one of the core components in the ERMES complex. Interestingly, the N‐terminal sequences of Mdm34 (residues 1–7, sequence “MSFRFNE”) are highly conserved among other species and are precisely aligned with those in Mdm12 (MSFDINW) (Fig 7B), suggesting that (i) the N‐terminus (residues 1–7) of Mdm34 might fold into a β‐strand, and (ii) the Mdm34 might form a complex with Mdm12 using this β‐strand through head‐to‐head contact as seen in the Mdm12 dimer. To test whether the β1‐strand of Mdm12 is involved in the interaction with the Mdm34 SMP domain, the full‐length or the N‐terminus‐truncated Mdm12 was incubated with the SMP domain of Mdm34 (residues 1–188) fused with MBP and analyzed using a MBP pull‐down assay. Full‐length Mdm12 interacted with the Mdm34 SMP domain, while the truncated Mdm12 did not (Fig EV5A). We also demonstrated a direct interaction between Mdm12 and the N‐terminal fragment of Mdm34 comprising residues 1–22 tagged with GST by co‐expressing the two proteins and a GST pull‐down assay (Fig EV5A). The I5P homologous mutant of Mdm34 (residues 1–22, F5P) lost its ability to interact with Mdm12. The data support our proposed model that the interaction between Mdm12 and Mdm34 would be very similar to that seen in the Mdm12 dimer interface, namely the domain‐swapped structure of β1‐strands from two SMP domains.
Figure 7. Putative architecture of the Mdm12–Mmm1–Mdm34 ternary complex.
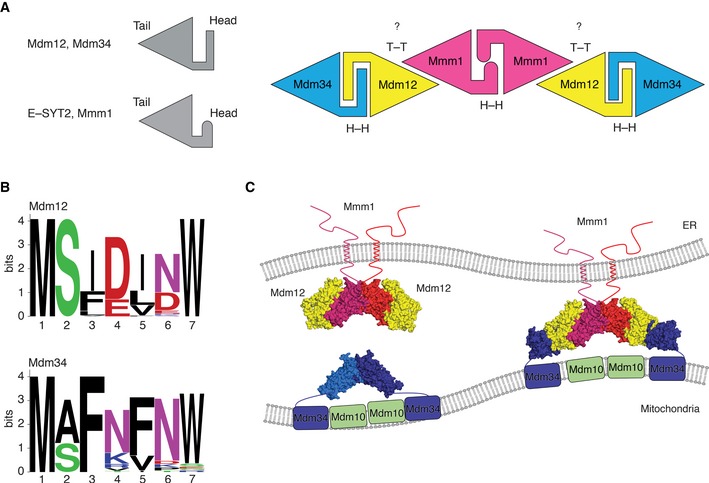
- Schematic representation of the SMP domains of Mdm12 and E‐SYT2 showing different head structures depending on the presence of helix or strand. Based on our structural and biochemical data, we modeled Mdm12–Mmm1–Mdm34 ternary complex according to the organization of their respective SMP domains using head or tail regions. Two major contact regions among SMP domains are highlighted: H‐H (head‐to‐head) and T‐T (tail‐to‐tail) contacts.
- Sequence alignment between Mdm12 and Mdm34 along the N‐terminal region (residues 1–7) critical for self‐association or hetero‐interaction. Each of the Mdm12 and Mdm34 sequences is displayed as a WebLogo 38 representation to highlight sequence conservation. The sequences for Mdm12 and Mdm34 were analyzed using 34 and 60 orthologs, respectively.
- Schematic diagram showing the putative organization of the Mdm12 (yellow)–Mmm1 (red)–Mdm34 (blue)–Mdm10 (green) tetramer. Mmm1 forms a homo‐dimer with a head‐to‐head contact in the center, capped on each end by a Mdm12 monomer through a tail‐to‐tail contact. Mdm12 associates with Mdm34 through a head‐to‐head contact. The hexameric SMP model was derived from the structure of six ΔMdm12 molecules within the asymmetric unit.
Source data are available online for this figure.
Figure EV5. The Mdm12–Mdm34 interaction might be mediated through the N‐terminus and the N‐terminus of the SMP domain in Mmm1 might resemble that in E‐SYT2.
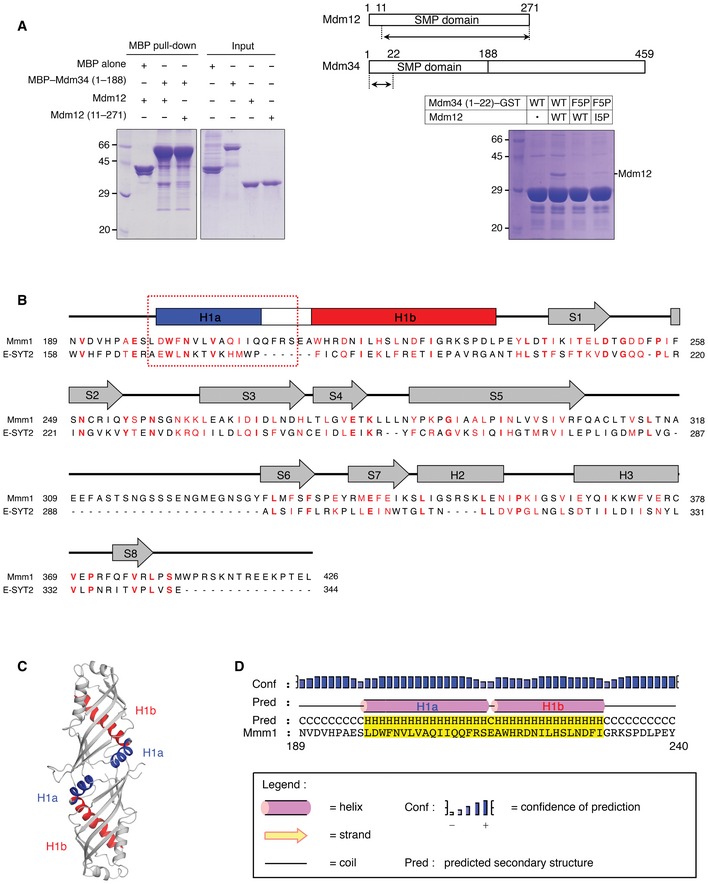
- MBP pull‐down experiment (left) showing that the SMP domain of Mdm34 interacts with full‐length Mdm12 but not with N‐terminus‐truncated Mdm12 (residues 11–271). GST pull‐down experiment (right) indicates that the N‐terminal fragment (residues 1–22) of Mdm34 can interact with the Mdm12. The constructs used in the experiments are shown above.
- Sequence alignment of SMP domains in Mmm1 and E‐SYT2. The relatively conserved sequences are highlighted in red. The secondary structure elements are indicated above the sequences with helices and strands as arrows and cylinders, respectively, based on the crystal structure of E‐SYT2 29. The N‐terminus of Mmm1 that is predicted to form an α‐helix (H1a) and make a twofold interface for Mmm1 self‐association is indicated by a red square 39. The sequences corresponding to H1a are highly conserved in E‐SYT2 and Mmm1.
- Ribbon diagram of SMP domain of E‐SYT2 highlighting the twofold interface. The color scheme is the same as in (A).
- Secondary structure prediction of the N‐terminus of Mmm1 comprising residues 189–240. Explanations of the different symbols are given in the box.
A previous structural study identified a unique contact site comprising an α‐helix in the SMP domain of E‐SYT2 that was required for its homo‐oligomerization 29. From our crystal structures and biochemical experiments, we propose two novel interfaces (head‐to‐head and tail‐to‐tail) for contact among SMP domains in ERMES components (Fig 7A and C). Mdm12 in particular, a soluble component, acts as a bridge to physically connect two membrane‐anchored components, Mmm1 in the ER and Mdm34 in mitochondria, by providing both head‐ and tail‐interacting surfaces through its SMP domain. The observed self‐association of Mdm12 was unexpected; however, it is necessary to further test how the self‐association of Mdm12 could be related to biological functions such as lipid trafficking. We observed that the self‐oligomerization of Mdm12 is dynamic between monomers and dimers from the native PAGE of full‐length Mdm12, and the Mdm12 monomer has even higher affinity for NBD‐PE than the Mdm12 dimer (Fig 4D and E). In the same vein, it is necessary to examine whether the self‐association of Mdm12 might have a negative effect on the lipid trafficking or the organization of the ERMES tetramer complex by inhibiting the interaction with Mdm34.
The structure of the Mdm12 dimer interface and the pairwise sequence alignment between Mdm12 and Mdm34 in N‐terminus residues 1–7 reveals that the Mdm12–Mdm34 interaction would be mediated by the crossover of their N‐terminus β‐strand as shown in the Mdm12 dimer interface. The highly conserved N‐terminus sequences of Mdm34 would have the ability to form homo‐ and hetero‐complexes with Mdm12. The dimeric conformation of Mdm34 has been already verified by size‐exclusion chromatography with Mdm34 SMP (residues 1–188), and the GST‐ or GFP‐fused SMP domain of Mdm34 30. The interactions occurring through the flexible β‐strand among the Mdm12 dimer, Mdm34 dimer, and Mdm12–Mdm34 complex appear to be relatively weak, a characteristic that could be associated with the dynamics for the assembly and disassembly of membrane contact mediated by the ERMES complex. The dynamics of the SMP domain also might be important in lipid trafficking, as shown with the Mdm12 monomer that has a higher affinity for lipids than the Mdm12 dimer. Likewise, the association between Mdm12 and Mdm34 might be implicated in lipid trafficking. We observed that the glycerophospholipid‐binding site is located very close to the dimerization interface of Mdm12, a distinctive feature for lipid binding by the SMP domain shared by other TULIP family proteins including E‐SYT2 (Fig EV4A). The proximity of the lipid interaction and dimerization sites in Mdm12 could enable a direct and more efficient transfer of lipids from Mdm12 to Mdm34. Our structure thus provides indirect evidence for lipid translocation from Mdm12 to Mdm34 or in the reverse direction. We also observed that self‐association of Mdm12 inhibits lipid access and incorporation, maybe because new lipids cannot be introduced into the ERMES complex when it is intact, assembled, and transferring lipids. Gem1 has been characterized as a regulator of ERMES activity 11. The weak interactions and dynamics of ERMES components might contribute to the regulation of membrane contact and lipid trafficking by this small GTPase. Further studies will be required to test this hypothesis.
The self‐association of Mmm1 could be mediated by a helix, as in the case of the E‐SYT2 SMP domain (Figs 3C and EV5C). The sequences of Mmm1 encoding the first helix in the SMP domain (residues 198–210) are well aligned with those of E‐SYT2 and are predicted to fold into an α‐helix, suggesting that Mmm1 might form a homo‐dimer through this helical interface (Fig EV5B–D). Given that the SMP domains in Mmm1 and E‐SYT2 are located in the middle of the protein primary sequences, and that the association of Mdm12–Mmm1 is stronger than that of Mdm12–Mdm34, control of the assembly of the ERMES complex would likely occur through regulation of the Mdm12–Mdm34 complex, which involves the N‐terminus β‐strands of the two proteins. Future work will be required to address this biological hypothesis. A high‐resolution structure of the ERMES tetramer complex including Mdm10 would be required to elucidate in molecular detail how the tetramer cooperatively and efficiently facilitates direct contact with the membrane and lipid exchange. In the absence of such a structure, our study provides a first understanding of the molecular mechanisms involved in the recognition of lipids by Mdm12 as well as of the dynamics and organization of the ERMES complex in its entirety.
Materials and Methods
Cloning and protein production
The DNA fragments encoding full‐length Mdm12, truncated Mmm1 (residues 160–426), and Mdm34 (residues 1–188) were amplified by PCR using S. cerevisiae genomic DNA as a template, and cloned into pET28b‐SMT3 vector with BamHI/SalI restriction sites, pCDF‐Duet vector with NdeI/XhoI sites, and pMBP‐Parallel1 fusion vector with EcoRI/SalI sites, respectively. For production of Mdm12 proteins, the plasmids were transformed into E. coli strain BL21 (DE3) cells, and proteins were expressed by induction with 0.4 mM IPTG at 18°C for 18 h after cell density reached an A600 of 0.5–0.6. The harvested cells were lysed in 25 mM sodium phosphate (pH 7.8), 400 mM sodium chloride, 4 mM β‐mercaptoethanol, 1 mM phenylmethylsulfonyl fluoride (PMSF) at 4°C. Mdm12 was purified by Ni2+‐immobilized affinity chromatography (IMAC) followed by ULP1 cleavage of the SMT3 tag overnight during dialysis against 25 mM Tris–HCl (pH 7.5), 100 mM NaCl, 5 mM β‐mercaptoethanol at 4°C. The non‐cleaved Mdm12 were removed by another round of Ni2+‐IMAC, and the Mdm12 collected from the flow‐through was concentrated and applied onto a Superdex 200 column (GE Healthcare) equilibrated with buffer A containing 25 mM Tris–HCl (pH 7.5), 150 mM NaCl, 5 mM dithiothreitol. For selenomethionine‐derivatized protein, the Mdm12 plasmid was transformed and expressed in B834 (DE3) grown in M9 minimal media plus selenomethionine. Prior to crystallization experiments, the proteins were concentrated by ultrafiltration to 10 mg/ml and flash frozen in liquid nitrogen for storage. For the Mdm12–tMmm1 complex, two plasmids containing pCDF‐Duet with Mdm12 (no‐tag) and pET28b‐SMT3‐tMmm1 were transformed into BL21 (DE3) and expressed and purified as above. All mutants including point mutants and deletion mutant (5′‐E73‐GGSGG (extra sequences)‐S115‐3′, for ΔMdm12) were generated by PCR‐based methods, and the mutations were confirmed by sequencing.
Crystallization and SAD structure determination
Native and Se‐Met‐derivatized crystals of Mdm12 of maximum diffraction quality were grown in different crystallization conditions. Native crystals were grown in a well solution containing 2.9 M sodium formate, 100 mM ADA (pH 7.5), 5 mM DTT at 4°C by hanging‐drop vapor diffusion. Crystals were cryoprotected by soaking them in a well solution plus 30% glycerol. Diffraction data at 3.1 Å resolution were collected at the Pohang synchrotron at 100 K and processed with HKL2000 33. Se‐Met‐derivatized crystals were grown in a crystallization buffer consisting of 12% polyethylene glycol (PEG) 3350, 100 mM bis tris propane (BTP) pH 6.5, and 200 mM magnesium sulfate at room temperature. Crystals were cryoprotected by soaking them into a well solution plus 30% ethylene glycol, and 3.5 Å resolution Se‐SAD data were collected at the same synchrotron beamline and processed as above. Phase determination with the SAD dataset was carried out using Phenix, and excellent electron density was produced with a figure‐of‐merit of 0.4 34. The final model was refined to R/R free values of 0.212/0.265 with native data via successive rounds of model building and refinement using Coot and Phenix 34, 35. The final model includes four molecules of Mdm12 without any disallowed geometry. The following residues were not modeled owing to disordered electron density: residues 74–113 and 268–271 in the first copy, residues 73–113 and 267–271 in the second copy, residues 74–112 and 268–271 in the third copy, and residues 74–117 and 266–271 in the fourth copy.
ΔMdm12 was crystallized using the hanging‐drop method by mixing 1 μl of 15 mg/ml ΔMdm12 proteins with 1 μl of crystallization buffer comprising 1.2 M ammonium sulfate, 100 mM Tris–HCl (pH 8.5), 100 mM lithium sulfate at room temperature. A complete dataset was collected to a resolution of 3.6 Å at the same beamline and processed with HKL2000 as above. Using the Mdm12 structure as a search model, a molecular replacement solution was determined using Phaser 36. Refinement and model building were performed with Phenix and Coot, respectively. The final model contains six Mdm12 (Δ74–114) molecules in the asymmetric unit without any disallowed geometry. The following residues were not modeled owing to the presence of disordered electron density: residues 268–271 in the first copy, residues 73 and 265–271 in the second copy, residues 73 and 268–271 in the third copy, residues 268–271 in the fourth copy, residues 267–271 in the fifth copy, and residues 266–271 in the sixth copy. The coordinates and structure factors have been deposited in the Protein Data Bank under accession codes 5GYD (native Mdm12) and 5GYK (ΔMdm12).
Size‐exclusion chromatography
To measure the relative molecular weights and oligomerization in solution, Mdm12 with or without His‐tag, tMmm1, Mdm12–tMmm1 complex were prepared in buffer A at 4°C. Proteins were applied to a Superdex 200 16/60 column (GE Healthcare).
Lipid‐binding assays and lipid displacement experiments
For the lipid‐binding assay, 1 μl of 10 mg/ml wild‐type and mutant (I5P, I5P/L256W, I5P/I262W, and I5P/L256W/I262W) Mdm12 proteins was mixed with 1 μl of 1 mg/ml 16:0 NBD‐PE (1,2‐dipalmitoyl‐sn‐glycero‐3‐phosphoethanolamine‐N‐[7‐nitro‐2‐1,3‐benzoxadiazol‐4‐yl], purchased from Avanti Polar Lipids) in a total reaction volume of 20 μl of buffer A for 2 h on ice. After reaction, the products were diluted with the sample buffer consisting of 25 mM Tris–HCl (pH 6.8), 20% glycerol, and 0.01% Bromophenol blue, and subjected to 12% native PAGE. The reaction products were detected with fluorescence (ImageQuant LAS 4000, GE Healthcare) followed by Coomassie Blue staining. Signal intensities were quantified with ImageJ software, and statistical analysis of the results was performed using Excel 2015.
For lipid displacement experiments, the C‐terminal GST‐tagged Mdm12 (Mdm12‐GST) was incubated with a twofold molar excess of NBD‐PE for 2 h on ice with 0.3 mM N,N‐dimethyldodecylamine N‐oxide (LDAO, Sigma‐Aldrich). To remove excess unbound NBD‐PE, Mdm12‐GST was mixed with glutathione sepharose 4B (GE Healthcare) beads and washed three times with buffer A supplemented with 0.3 mM LDAO. NBD‐PE bound to Mdm12‐GST was eluted with buffer A containing 10 mM reduced glutathione and concentrated to a final concentration of 0.5 mg/ml. Mdm12‐GST (20 μl) preloaded with NBD‐PE was mixed with 1 μl of phospholipids dissolved in methanol. Reactions were incubated for 2 h on ice and analyzed by native PAGE as described above. All phospholipids were purchased from Avanti Polar Lipids: PA (1,2‐dioleoyl‐sn‐glycero‐3‐phosphate; DOPA), PC (1,2‐dioleoyl‐sn‐glycero‐3‐phosphocholine; DOPC), PE (1,2‐dioleoyl‐sn‐glycero‐3‐phosphoethanolamine; DOPE), PG (1,2‐dioleoyl‐sn‐glycero‐3‐phospho‐(1′‐rac‐glycerol); DOPG), and PS (1,2‐dioleoyl‐sn‐glycero‐3‐phospho‐L‐serine; DOPS).
Pull‐down experiments
For the pull‐down experiment shown in Fig EV5A, 200 μg of MBP‐tagged Mdm34 (residues 1–188) purified from E. coli was mixed with 5 μl of beads of amylose resin (NEB) in a total reaction volume of 500 μl. The beads were washed three times with buffer A. Purified wild‐type or mutant Mdm12 (300 μg) was added to the beads and incubated for 2 h at 4°C. The beads were washed again three times with buffer A, and the proteins were analyzed by 12% SDS–PAGE followed by Coomassie Blue staining.
The Mdm34 fragment (residues 1–22, wt or mutants)‐GST fusion proteins were co‐expressed with full‐length Mdm12. Proteins were incubated with 5 μl of a 50% (v/v) slurry of glutathione sepharose 4B beads (GE Healthcare) for 60 min at 4°C. Beads were washed twice with buffer A. Proteins were eluted with SDS sample buffer and analyzed by SDS–PAGE.
Analytical ultracentrifugation
The molecular masses of Mdm12, His6–Mdm12, Mdm12 (I5P), and the Mdm12–tMmm1 complex were analyzed by equilibrium methods using a Beckman An‐60 Ti rotor in a Beckman Optima XL‐A analytical ultracentrifuge at 15°C. Proteins at a concentration of 10–20 μM were prepared in buffer B comprising 25 mM Tris–HCl (pH 7.5), 200 mM NaCl, and 5 mM β‐mercaptoethanol. The buffer density, viscosity, and sample partial specific volumes were calculated using SEDNTERP (http://sednterp.unh.edu) 37. Data were evaluated using a nonlinear least‐squares curve‐fitting algorithm (XL‐A data analysis software). The measurements were fit to a single species model using the Origin 6.03 software (Beckman Coulter, Inc.). Sedimentation velocity experiments were performed at 15°C and 20,124 g using two‐channel 12‐mm path length aluminum centerpieces loaded with 400 μl of sample and 420 μl of buffer B. Separate experiments were conducted with various concentrations of Mdm12 (0.5, 1, and 2 mg/ml). Scans were collected in 10‐min intervals using continuous scan mode with a radial spacing of 0.003 cm. Data were analyzed using the continuous c(s) distribution in the SEDFIT program for fitting the frictional ratio, meniscus, and time‐invariant noise.
APCI‐MS
Purified Mdm12 was desalted using a HiTrap desalting column (GE healthcare) equilibrated with ultrapure grade water. Desalted Mdm12 (50 μl) was mixed with 950 μl of acetonitrile and incubated with vigorous vortexing for 1 h at room temperature. All analyses were performed with a Bruker HCT ion‐trap mass spectrometer (Bruker Daltonics, Bremen, Germany) equipped with an atmospheric pressure chemical ionization (APCI) source. For direct infusion, samples were infused with a syringe pump (KD Scientific) at a flow rate of 240 μl/h. The APCI source was operated in positive mode with a drying gas (N2) flow of 5 l/min, nebulizer pressure of 30 psi, drying gas temperature of 250°C, vaporizer temperature of 400°C, capillary voltage of 4.5 kV, and corona current of 4,000 nA. The scanning mass to charge range was 430–1,000 m/z, with a scanning speed of 26,000 m/z per s. To control the instrument, a Compass 1.3 for HCT/esquire (EsquireControl Version 6.2) was employed, and an ESI Compass 1.3 for HCT/esquire (DataAnalysis Version 4.0) was used for data evaluation (both obtained from Bruker Daltonics).
Author contributions
CL, HJ, and JP designed the experiments and analyzed the data. HJ and JP performed the experiments. CL, HJ, and JP prepared the manuscript.
Conflict of interest
The authors declare that they have no conflict of interest.
Supporting information
Expanded View Figures PDF
Review Process File
Source Data for Figure 4
Source Data for Figure 5
Source Data for Figure 6
Source Data for Figure 7
Acknowledgements
We thank Prof. Youngsoo Jun at GIST for invaluable discussion, and Dr. Yeon‐Gil Kim at beamline 5C of the PAL for assistance with synchrotron facilities. This work was supported by grants Basic Science Research Program (NRF‐2015R1D1A1A01058016), Cell Logistics Research Center (2016R1A5A1007318), and the Global Ph.D. Fellowship Program (NRF‐2014H1A2A1020322 to H.J.) from the Korea National Research Foundation. This research was also supported by a grant from the Korea Health Technology R&D Project through the Korea Health Industry Development Institute (KHIDI), funded by the Ministry of Health & Welfare, Republic of Korea (HI12C1744), a TJ Park Science Fellowship from the POSCO TJ Park Foundation, and the IBS‐R022‐D1.
EMBO Reports (2016) 17: 1857–1871
References
- 1. Robertson JD (1960) The molecular structure and contact relationships of cell membranes. Prog Biophys Mol Biol 10: 343 [PubMed] [Google Scholar]
- 2. Mannella CA, Buttle K, Rath BK, Marko M (1998) Electron microscopic tomography of rat‐liver mitochondria and their interactions with the endoplasmic reticulum. BioFactors 8: 225–228 [DOI] [PubMed] [Google Scholar]
- 3. Csordás G, Renken C, Várnai P, Walter L, Weaver D, Buttle KF, Balla T, Mannella CA, Hajnóczky G (2006) Structural and functional features and significance of the physical linkage between ER and mitochondria. J Cell Biol 174: 915–921 [DOI] [PMC free article] [PubMed] [Google Scholar]
- 4. Elbaz Y, Schuldiner M (2011) Staying in touch: the molecular era of organelle contact sites. Trends Biochem Sci 36: 616–623 [DOI] [PubMed] [Google Scholar]
- 5. Helle SC, Kanfer G, Kolar K, Lang A, Michel AH, Kornmann B (2013) Organization and function of membrane contact sites. Biochim Biophys Acta 1833: 2526–2541 [DOI] [PubMed] [Google Scholar]
- 6. Kornmann B, Walter P (2010) ERMES‐mediated ER‐mitochondria contacts: molecular hubs for the regulation of mitochondrial biology. J Cell Sci 123: 1389–1393 [DOI] [PMC free article] [PubMed] [Google Scholar]
- 7. Lang A, Peter ATJ, Kornmann B (2015) ER–mitochondria contact sites in yeast: beyond the myths of ERMES. Curr Opin Cell Biol 35: 7–12 [DOI] [PubMed] [Google Scholar]
- 8. Rowland AA, Voeltz GK (2012) Endoplasmic reticulum–mitochondria contacts: function of the junction. Nat Rev Mol Cell Biol 13: 607–625 [DOI] [PMC free article] [PubMed] [Google Scholar]
- 9. Kornmann B (2013) The molecular hug between the ER and the mitochondria. Curr Opin Cell Biol 25: 443–448 [DOI] [PubMed] [Google Scholar]
- 10. Kornmann B, Currie E, Collins SR, Schuldiner M, Nunnari J, Weissman JS, Walter P (2009) An ER‐mitochondria tethering complex revealed by a synthetic biology screen. Science 325: 477–481 [DOI] [PMC free article] [PubMed] [Google Scholar]
- 11. Kornmann B, Osman C, Walter P (2011) The conserved GTPase Gem1 regulates endoplasmic reticulum–mitochondria connections. Proc Natl Acad Sci USA 108: 14151–14156 [DOI] [PMC free article] [PubMed] [Google Scholar]
- 12. Murley A, Lackner LL, Osman C, West M, Voeltz GK, Walter P, Nunnari J (2013) ER‐associated mitochondrial division links the distribution of mitochondria and mitochondrial DNA in yeast. eLife 2: e00422 [DOI] [PMC free article] [PubMed] [Google Scholar]
- 13. Kopec KO, Alva V, Lupas AN (2010) Homology of SMP domains to the TULIP superfamily of lipid‐binding proteins provides a structural basis for lipid exchange between ER and mitochondria. Bioinformatics 26: 1927–1931 [DOI] [PMC free article] [PubMed] [Google Scholar]
- 14. Toulmay A, Prinz WA (2012) A conserved membrane‐binding domain targets proteins to organelle contact sites. J Cell Sci 125: 49–58 [DOI] [PMC free article] [PubMed] [Google Scholar]
- 15. Lahiri S, Toulmay A, Prinz WA (2015) Membrane contact sites, gateways for lipid homeostasis. Curr Opin Cell Biol 33: 82–87 [DOI] [PMC free article] [PubMed] [Google Scholar]
- 16. Nguyen TT, Lewandowska A, Choi JY, Markgraf DF, Junker M, Bilgin M, Ejsing CS, Voelker DR, Rapoport TA, Shaw JM (2012) Gem1 and ERMES do not directly affect phosphatidylserine transport from ER to mitochondria or mitochondrial inheritance. Traffic 13: 880–890 [DOI] [PMC free article] [PubMed] [Google Scholar]
- 17. Lahiri S, Chao JT, Tavassoli S, Wong AK, Choudhary V, Young BP, Loewen CJ, Prinz WA (2014) A conserved endoplasmic reticulum membrane protein complex (EMC) facilitates phospholipid transfer from the ER to mitochondria. PLoS Biol 12: e1001969 [DOI] [PMC free article] [PubMed] [Google Scholar]
- 18. Hönscher C, Mari M, Auffarth K, Bohnert M, Griffith J, Geerts W, van der Laan M, Cabrera M, Reggiori F, Ungermann C (2014) Cellular metabolism regulates contact sites between vacuoles and mitochondria. Dev Cell 30: 86–94 [DOI] [PubMed] [Google Scholar]
- 19. Elbaz‐Alon Y, Rosenfeld‐Gur E, Shinder V, Futerman AH, Geiger T, Schuldiner M (2014) A dynamic interface between vacuoles and mitochondria in yeast. Dev Cell 30: 95–102 [DOI] [PubMed] [Google Scholar]
- 20. Meisinger C, Pfannschmidt S, Rissler M, Milenkovic D, Becker T, Stojanovski D, Youngman MJ, Jensen RE, Chacinska A, Guiard B (2007) The morphology proteins Mdm12/Mmm1 function in the major β‐barrel assembly pathway of mitochondria. EMBO J 26: 2229–2239 [DOI] [PMC free article] [PubMed] [Google Scholar]
- 21. Böckler S, Westermann B (2014) Mitochondrial ER contacts are crucial for mitophagy in yeast. Dev Cell 28: 450–458 [DOI] [PubMed] [Google Scholar]
- 22. Friedman JR, Lackner LL, West M, DiBenedetto JR, Nunnari J, Voeltz GK (2011) ER tubules mark sites of mitochondrial division. Science 334: 358–362 [DOI] [PMC free article] [PubMed] [Google Scholar]
- 23. Hobbs AEA, Srinivasan M, McCaffery JM, Jensen RE (2001) Mmm1p, a mitochondrial outer membrane protein, is connected to mitochondrial DNA (mtDNA) nucleoids and required for mtDNA stability. J Cell Biol 152: 401–410 [DOI] [PMC free article] [PubMed] [Google Scholar]
- 24. Meeusen S, Nunnari J (2003) Evidence for a two membrane–spanning autonomous mitochondrial DNA replisome. J Cell Biol 163: 503–510 [DOI] [PMC free article] [PubMed] [Google Scholar]
- 25. Frederick RL, McCaffery JM, Cunningham KW, Okamoto K, Shaw JM (2004) Yeast Miro GTPase, Gem1p, regulates mitochondrial morphology via a novel pathway. J Cell Biol 167: 87–98 [DOI] [PMC free article] [PubMed] [Google Scholar]
- 26. Youngman MJ, Hobbs AEA, Burgess SM, Srinivasan M, Jensen RE (2004) Mmm2p, a mitochondrial outer membrane protein required for yeast mitochondrial shape and maintenance of mtDNA nucleoids. J Cell Biol 164: 677–688 [DOI] [PMC free article] [PubMed] [Google Scholar]
- 27. Beamer LJ, Carroll SF, Eisenberg D (1997) Crystal structure of human BPI and two bound phospholipids at 2.4 angstrom resolution. Science 276: 1861–1864 [DOI] [PubMed] [Google Scholar]
- 28. Qiu X, Mistry A, Ammirati MJ, Chrunyk BA, Clark RW, Cong Y, Culp JS, Danley DE, Freeman TB, Geoghegan KF (2007) Crystal structure of cholesteryl ester transfer protein reveals a long tunnel and four bound lipid molecules. Nat Struct Mol Biol 14: 106–113 [DOI] [PubMed] [Google Scholar]
- 29. Schauder CM, Wu X, Saheki Y, Narayanaswamy P, Torta F, Wenk MR, De Camilli P, Reinisch KM (2014) Structure of a lipid‐bound Extended‐Synaptotagmin indicates a role in lipid transfer. Nature 510: 552 [DOI] [PMC free article] [PubMed] [Google Scholar]
- 30. AhYoung AP, Jiang J, Zhang J, Khoi Dang X, Loo JA, Zhou ZH, Egea PF (2015) Conserved SMP domains of the ERMES complex bind phospholipids and mediate tether assembly. Proc Natl Acad Sci USA 112: E3179–E3188 [DOI] [PMC free article] [PubMed] [Google Scholar]
- 31. Baker NA, Sept D, Joseph S, Holst MJ, McCammon JA (2001) Electrostatics of nanosystems: application to microtubules and the ribosome. Proc Natl Acad Sci USA 98: 10037–10041 [DOI] [PMC free article] [PubMed] [Google Scholar]
- 32. Ashkenazy H, Erez E, Martz E, Pupko T, Ben‐Tal N (2010) ConSurf 2010: calculating evolutionary conservation in sequence and structure of proteins and nucleic acids. Nucleic Acids Res 38: W529–W533 [DOI] [PMC free article] [PubMed] [Google Scholar]
- 33. Otwinowski Z, Minor W (1997) [20] Processing of X‐ray diffraction data collected in oscillation mode In Methods in enzymology, Carter CW., Jr (ed) pp 307–326. New York: Academic Press; [DOI] [PubMed] [Google Scholar]
- 34. Adams PD, Afonine PV, Bunkoczi G, Chen VB, Davis IW, Echols N, Headd JJ, Hung LW, Kapral GJ, Grosse‐Kunstleve RW et al (2010) PHENIX: a comprehensive Python‐based system for macromolecular structure solution. Acta Crystallogr D Biol Crystallogr 66: 213–221 [DOI] [PMC free article] [PubMed] [Google Scholar]
- 35. Emsley P, Lohkamp B, Scott WG, Cowtan K (2010) Features and development of Coot. Acta Crystallogr D Biol Crystallogr 66: 486–501 [DOI] [PMC free article] [PubMed] [Google Scholar]
- 36. McCoy AJ, Grosse‐Kunstleve RW, Adams PD, Winn MD, Storoni LC, Read RJ (2007) Phaser crystallographic software. J Appl Crystallogr 40: 658–674 [DOI] [PMC free article] [PubMed] [Google Scholar]
- 37. Harding SE, Horton JC (1992) Analytical ultracentrifugation in biochemistry and polymer science. Cambridge: Royal Society of Chemistry; [Google Scholar]
- 38. Crooks GE, Hon G, Chandonia J‐M, Brenner SE (2004) WebLogo: a sequence logo generator. Genome Res 14: 1188–1190 [DOI] [PMC free article] [PubMed] [Google Scholar]
- 39. Jones DT (1999) Protein secondary structure prediction based on position‐specific scoring matrices. J Mol Biol 292: 195–202 [DOI] [PubMed] [Google Scholar]
Associated Data
This section collects any data citations, data availability statements, or supplementary materials included in this article.
Supplementary Materials
Expanded View Figures PDF
Review Process File
Source Data for Figure 4
Source Data for Figure 5
Source Data for Figure 6
Source Data for Figure 7