Abstract
Mesoscopic fluorescence molecular tomography (MFMT) is new imaging modality aiming at 3-D imaging of molecular probes in a few millimeter thick biological samples with high-spatial resolution. In this paper, we develop a compressive sensing-based reconstruction method with l1-norm regularization for MFMT with the goal of improving spatial resolution and stability of the optical inverse problem. Three-dimensional numerical simulations of anatomically accurate microvasculature and real data obtained from phantom experiments are employed to evaluate the merits of the proposed method. Experimental results show that the proposed method can achieve 80 μm spatial resolution for a biological sample of 3 mm thickness and more accurate quantifications of concentrations and locations for the fluorophore distribution than those of the conventional methods.
Index Terms: Bioprinting, compressive sensing (CS), fluorescence imaging, image reconstruction, laminar optical tomography (LOT), l1-norm regularization, mesoscopic fluorescence molecular tomography (MFMT), molecular imaging, Monte Carlo (MC)
I. Introduction
Mesoscopic fluorescence molecular tomography (MFMT), also known as laminar optical tomography (LOT), has been developed to perform depth-resolved functional and molecular imaging at the spatial junction between microscopic and macroscopic imaging. This novel optical imaging modality that operates in the mesoscopic regime combines the advantages of diffuse optical tomography (DOT) image reconstruction and a microscopy-based setup to allow noncontact imaging of large areas. MFMT (or LOT) is a subsurface imaging technique that relies on an optical inverse problem to generate depth-resolved 3-D images of highly scattering tissues at depths of several millimeters and with high sensitivity [1]–[3]. Although MFMT can achieve reconstructions with higher resolution compared to DOT, it still faces the same challenges as DOT, such as, recovering the depth and size of the biomarkers with accuracy. In MFMT, the number of measurements available is often much smaller than the number of unknown 3-D image elements, which may result in the nonuniqueness of the solution. Moreover, the inverse solution may be more unstable when higher resolution performances are sought (high frequencies in the image space). As in all ill-conditioned diffusion-based inverse problem, the noise in the measurements data may induce large artifacts in the reconstructed image. Furthermore, it becomes harder to obtain accurate reconstructions of fluorophore biodistribution at deeper locations due to exponential decay of light intensities with depth and limited volume probed in reflectance geometry [4].
Recently, the emerging field of compressive sensing (CS) has shown that sparse signals, which have a small number of nonzero entries, can be recovered from far fewer samples or measurements than those required by the traditional Shannon–Nyquist sampling theorem. The CS theory has been generalized to recover sparse signals in general bases from limited number of measurement data. The CS framework has been utilized to solve the inverse problems of optical tomography [5]. For fluorescence tomographic imaging, it has been reported that sparse fluorophore concentration can be reconstructed by solving an l1-norm constraint optimization problem. Alternative optimization methods proposed in [6] and [7] are shown to offer improved performance relative to l1-norm. It is demonstrated in these contributions that more accurate signal reconstruction can be achieved by solving an l1-norm-based minimization problem.
However, reconstruction algorithms selection is highly problem dependent. To our knowledge, CS-based reconstruction methods have not yet been applied to optical tomography in the mesoscopic regime. In this paper, we propose a CS-based reconstruction method to solve the optical inverse problem in MFMT. In such applications, the fluorophore distribution is often concentrated within a small spatial region, where the fluorophore concentrations have large amplitudes, whereas in the background region, the fluorophore concentrations are nonexistent or close to zero. In this case, the objective function is extremely sparse in the imaging domain, and, hence, very amenable to CS methods. Herein, the proposed method introduces an l1-norm regularization to constrain the solution to a sparsity subspace, suppressing the background noise, and expressing the true distributions of fluorophore concentrations, allowing for an accurate and stable image formation process. We apply this CS-based reconstruction approach to an in silico vascular bed phantom and real multimodal experimental data. In the following section, we describe our MFMT imaging system and image reconstruction algorithm. In the third section, we report our realistic numerical simulation results and physical phantom experiments with microCT coregistration. In the last section, we discuss relevant issues and conclude this paper.
II. Method
A. Imaging Platform
Herein, we employed an MFMT imaging system that has been reported in detail in [3] and used to image bioprinted tissues [8] and to retrieve the 3-D distribution of a photosensitizer in skin cancer prior to PDT treatment [9]. Briefly, the system is an ultrafast multiwavelength MFMT platform using raster scanning of a laser beam and descanned detection of the optical signals by seven offset detectors. The system acquires data over a maximum imaging area of 8 mm × 5.5 mm at 7.5 Hz (<150 ms/frame) in reflectance geometry. The laser beam is raster scanned using a resonant galvo mirror for ultrafast acquisitions. The fluorescence backscattered signal is imaged on a 4 × 8 avalanche photodiode detector array (S8550, Hamamatsu) from which seven elements are employed. The detectors are evenly linearly distributed from 800 to 3900 μm away from the source. The total number of measurements acquired is dependent on the imaged area and is 107 520 measurements (15 360 different positions ×7 detectors measurements for each source position) for the maximum imaging area.
B. Monte Carlo (MC)-Based Inverse Problem
To implement image reconstruction of fluorophore distribution, a numerical model is required to simulate photon propagation in the biological sample. The diffusion approximation (DA) with Robin-type boundary condition [10] is the most widely used as a photon propagation model because of its high computational efficiency. However, it is well established that it only works well in weakly absorbing and highly scattering media and breaks down at near sources and across boundaries. So, the DA model is not suitable to simulate photon propagation in the mesoscopic regime. The MC is the gold standard to simulate light propagation in turbid media as it can accurately simulate photon propagation without the aforementioned limitations of the DA. With the development of a high performance computing technique, MC simulation in a graphics processing unit (GPU) environment can be 1000 times faster than those performed on a single standard central processing unit (CPU) [11], [12], enabling the use of MC techniques for DOT on a personal computer [13], [14]. Herein, a GPU-based MC code has been employed to compute the forward problem using an adjoint formulation for computational efficiency (a few minutes) [15]. This code is also employed to generate the in silico phantom experiments. In all computations herein, 106 photons were employed for good statistical sampling of the volume imaged at all optodes spacing. To simulate fluorescence light emission in diffuse medium using MC, we follow the formulation described in detail in [13]. We provide briefly the main salient points of this formulation later.
The 3-D distribution of the fluorophore’s effective quantum yield η(r) can be obtained by solving an integral equation relating the fluorescence signals at time t and η(r):
| (1) |
where UF (rs, rd, t) is the fluorescence detected by a detector located at rd at t resulting from an excitation at the source rs at t0 = 0, the integration domain Ω is defined as the entire imaging volume, and W (rs, rd, r, t), referred to as the weight function or Jacobian, describes how sensitive a change in η(r) will result in a change in UF (rs, rd, t). There are a few MC-based methods to calculate W. Herein, we employed the forward-adjoint MC method to produce Jacobians [15] for computational efficiency. In the method, W is computed by convolving the Green’s functions and the lifetime decay of fluorophore:
| (2) |
where Gx and Gm are the time-dependent Green’s functions calculated by MC simulations at excitation and emission wavelength, respectively [10], and τ is the lifetime of the fluorophore. As customary done in FMT and MFMT, the optical properties at the excitation and emission wavelengths are considered similar herein. Moreover, as our datasets are time independent, the formulation of (2) is integrated over time to match our data type. The system of linear equations representing the measurements detected at different positions and time can then be solved to obtain η(r).
In practices, (2) should be discretized to perform numerical computation. First, the ROI Ω is discretized into voxels (or tetrahedrons). The size of cubic element is related to the spatial resolution of image reconstruction. Each element ei is a potential source of fluorescence, which is linearly related to the fluorophore’s effective quantum yield η(r). By tracing excitation and fluorescence photon propagation in the sample using MC, we can compute a system matrix A (also called sensitivity matrix or Jacobian) to describe the relation between the fluorophore effective quantum yield in every 3-D image element (e1, e2, …, en) and measurement data. The linear equation system describing the relationship between measured photon numbers for each optode combination and the fluorophore bio-distribution is then
| (3) |
where Y is a vector of the photon fluence rate with noise v measured at each detector element for each scanning position, X a vector of unknown fluorophore concentration at each voxel element, and A is the Jacobian. The task of MFMT consists in reconstructing the unknown fluorophore parameter distribution X based on the linear equation system (3) from the measured data Y.
A is generated for a chosen measurement setup following the formulation provided in [16]. Herein, all parameters, such as assigned optical parameters, the position and separation of light source and detectors, source radius, width of the detector spot detection, mimic our current LOT optical system [3] applied to vascular bioprinted tissue imaging [8]. For our in silico experiments, based on simulated local distribution of fluorophores, we can generate measurement data Y via MC simulations. Noise can be added post hoc to the generated measurements to replicate specific acquisition settings. Herein, we employ a white Gaussian noise and define the signal-to-noise ratio (SNR) as follows:
| (4) |
where s1, s2, …, sm and n1, n2, …, nm are the entries of measurements matrix and additional noise, respectively. m is the number of measurements.
C. CS-Based Reconstruction
The key concept behind CS-based reconstructions is to exploit the prior knowledge that a large number of the unknown coefficients are close to or equal to zero (sparse and compressible). In optical molecular imaging applications, fluorophore probes are often engineered to specifically target cells/receptors of a preferred type and accumulate locally, forming a focal distribution of fluorophore concentrations. Hence, in such applications in which the image space is populated by relatively few significant pixels with nonzero values in image space, the CS-framework provides enhanced reconstruction performances [17], [18]. Besides sparsity in the image space, it is required that the CS matrix fulfils the incoherence property and that the reconstruction be performed via a solver that enhances sparsity, such as the l1-norm. To demonstrate the incoherence property of our problem, we employed the same methodology as described in [17].
If the transform point spread function is a natural tool to measure incoherence [19], it is hard to judge the incoherence when most of the inner products are tiny. Here, we employed the cumulative coherence function (CCF) to evaluate coherence between the transformation matrix T and Jacobian matrix A:
| (5) |
where m denotes the order of the CCF and Ω is the set of all possible subsets of m columns selected from the Jacobian. Furthermore, k ranges over a specific subset of Ω at a given order and j defines columns of the transformation matrix for all possible subsets. It has been shown that a slowly increasing CCF versus order m signifies incoherence [17]. The CCF of the CS matrix (AT) of the Jacobian and transformation basis (Fourier basis) was calculated for an order of up to 16. The slowly increasing trend of CCF curve, shown in Fig. 1, confirms the incoherence property of the CS matrix AT [17].
Fig. 1.
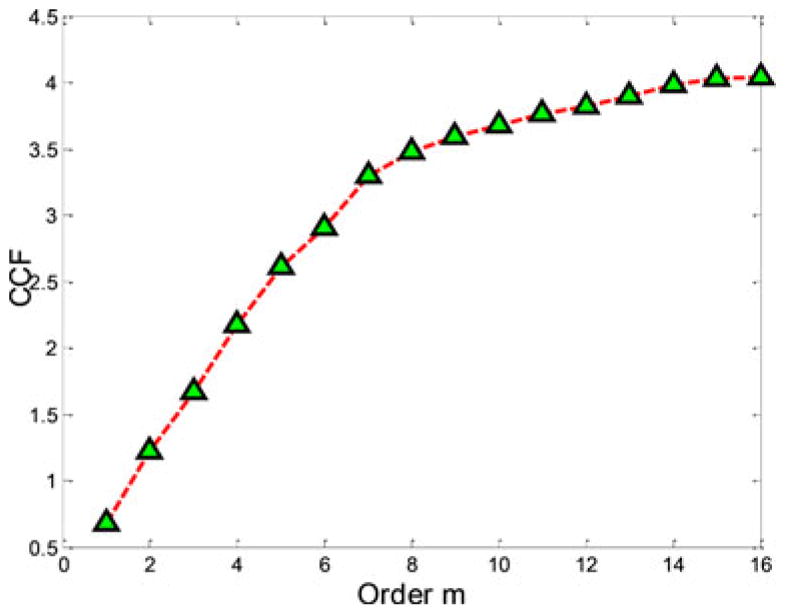
CCF between Jacobian (A) and the discrete Fourier transform (T) for several orders (m = 1 – 16).
For the reconstruction of sparse objective function, CS techniques can achieve high-quality image reconstruction from far fewer measurements than that required by Nyquist sampling. As one type of CS-based reconstruction strategy, the l0-norm regularization can ensure sparsest image reconstruction. The restricted isometry property can guarantee the equivalence of the solutions from the l1 and l0 minimization procedures. However, the l0-minimization is an NP (non-deterministic polynomial)-hard problem that is almost impossible to solve. Thankfully, the l1 norm, which is a quantitative index to measure the sparsity of a signal, is a convex function which approximates the l0 norm well [20]–[24]. Hence, we can formulate the inverse problem as the following linearly constrained minimization:
| (6) |
where the variable is X ∈ Rn, A ∈ Rm×n, and Y ∈ Rm, and m and n are the number of measurements and unknowns, respectively. λ is a regularization parameter with the l1-norm solution giving preference to a sparse spatial distribution. The l1-regularized problem (6) can be transformed to a convex quadratic program, with linear inequality constraints,
| (7) |
where the variable u ∈ Rn.
The objective function of optimization (6) is convex but not differentiable. This problem can be transformed to an unconstraint optimization using interior-point methods. The preconditioned conjugate gradients (CG) algorithm is used to compute the search direction for the truncated Newton iterations to solve this optimization problem [25].
D. Objective Quantitative Performance Measure
In this investigation, besides subjective assessment of the performances of the CS approach based on visual inspection, we also employed a quantitative metric for objective evaluation. We first evaluated the mean square error (MSE) between the real fluorophore yield and the reconstructed image over the entire image domain [4]–[6]. Let Xtrue = {xitrue |i = 1, 2, …, k} and Xrecon = {xirecon|i = 1, 2, …, k} be the original and reconstruction signal, respectively. The proposed quality index is defined as follows:
| (8) |
The dynamic range of SMSE is [0, +∞). The best value 0 is achieved if and only if Xtrue = Xrecon for all i = 1, 2, …, k, and k is the total number of voxels in fluorophore concentrations. Hence, a smaller SMSE reflects higher reconstruction fidelity.
E. Experimental Models
In silico models were designed to assess the performances of the proposed method in terms of spatial resolution, depth-dependent performances, and robustness to noise. First, a simple regular model representing a bioprinted vascular tree with main trunk and two off-shoots was employed. The different diameters of the vascular tree components are 400, 300, and 200 μm, as shown in Fig. 2. The fluorophore concentrations are assumed to be homogeneous over the vessel as shown in Fig. 2(a)–(b) with effective quantum yield equal to 1. The simulated imaging domain is a 2 mm × 5 mm surface area with a depth (Fig. 2(c)). We assume a homogeneous scattering coefficient ( ) and endogenous absorption coefficient (μa = 0.02 cm−1) over the domain. The Henyey–Greenstein phase function was used for all computation herein with g = 0.9. These parameters replicate the optical properties of the collagen scaffold employed in our bioprinting application at collagen density of ~3 mg/mL [3].
Fig. 2.
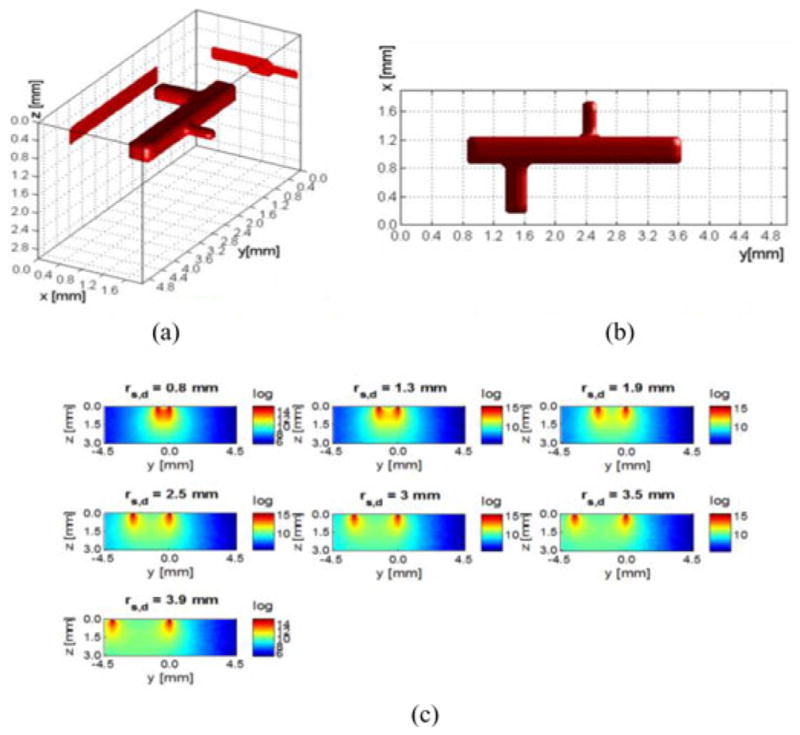
Vascular tree model. (a) Three-dimensional visualization with maximum projection on the bounding planes. (b) XY view. The dimensions of three components of the vascular tree are 0.4 mm × 2.8 mm × 0.4 mm, 0.7 mm × 0.3 mm × 0.3 mm, and 0.5 mm × 0.2 mm × 0.2 mm, respectively, for the main tree, bigger off shoot, and smaller off shoot. (c) yz-slices of the sensitivity matrix; seven detectors are placed along y-axis on the volume surface.
The vascular tree was placed at six different depths, 0.5, 1.0, 1.5, 2.0, 2.5, and 3.0 mm, to test the impact of depth on reconstruction fidelity. We discretized the imaging domain according to the desired resolution. For example, we discretized the imaging domain into 10 × 25 × 15 voxels when considering a 200 μm discretization, leading to a Jacobian of size 1750 (250 source positions, seven detectors) by 3750. To investigate higher resolutions, we simulated also 100 and 80 μm discretizations. Examples of typical measurements for the 7000 source positions and for individual detectors are provided in Fig. 3.
Fig. 3.
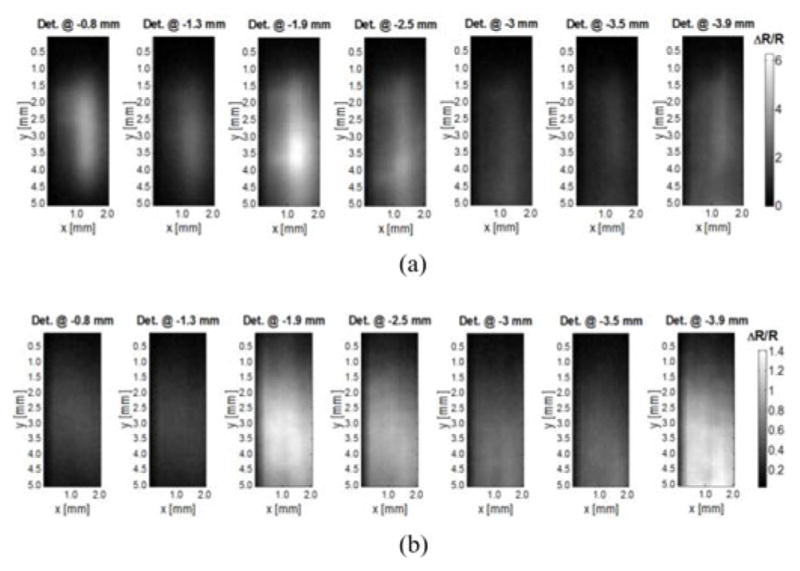
Synthetic measurements for the vascular model of Fig. 2. Each pixel corresponds to a source position for a specific detector offset with the vascular model embedded at depth of (a) 0.5 mm and of (b) 3 mm (SNR of 60). The colorbar represents the spatial contrast distribution acquired by each individual detector (ΔR) normalized to the overall dynamical range of measurements (R).
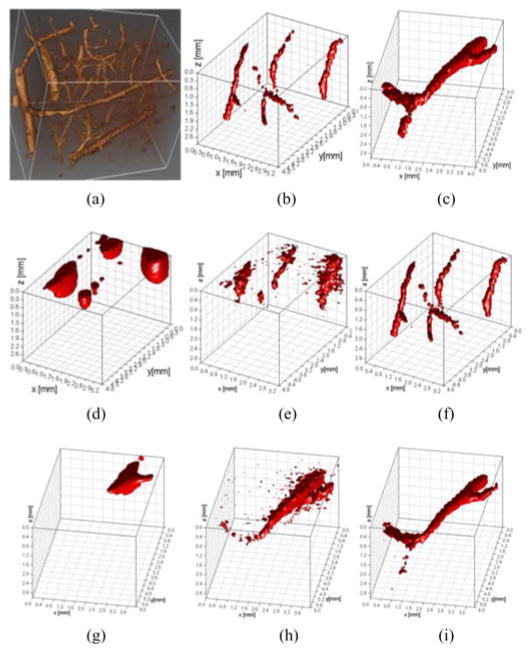
Then, two vasculature networks modeled after in vivo data obtained via two-photon microscopy were employed to simulate more realistic configuration of complex vascular networks in 3-D. To simulate an anatomically accurate vascular bed, we rescaled and cropped part of a microvessel network obtained from two-photon microscopy of a rat somatosensory cortex obtained from [26], as shown in Fig. 7(a). The segmented vessels were simulated to be labeled with fluorophore as reported in [8]. The fluorophore concentrations are assumed to be homogeneous over the vessel as shown in Fig. 7(b) and (c). The size of the image domain and discretization was identical to the previous in silico models.
Fig. 7.
Reconstruction results for complex vasculature by three regularization methods. (a) Raw data were represented in 3-D. (b) and (c) Raw data were segmented for two different sets of vascular channels, T1 and T2. (d)–(f) Segmented vessel, T1, was reconstructed by CG, LSQR, and CS, respectively. (g)–(i) Segmented vessel, T2, reconstructed by CG, LSQR, and CS, respectively (no noise added in the vascular network model).
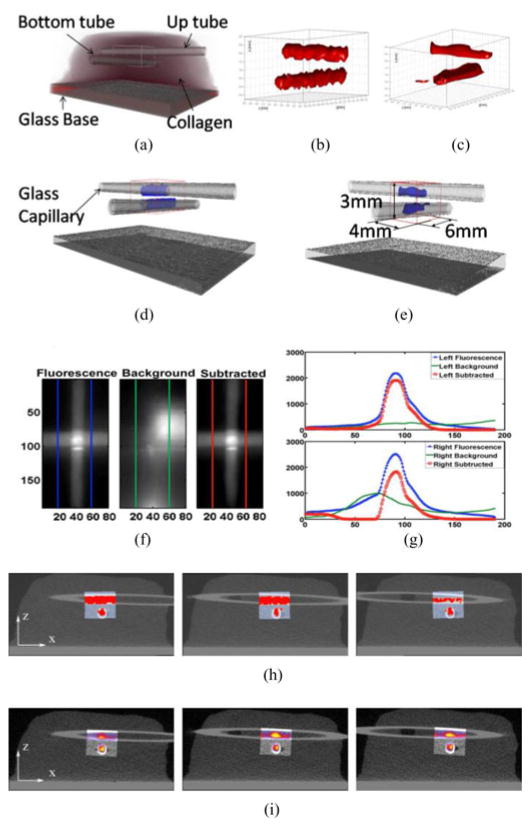
Finally, the CS method is employed to reconstruct real phantom data and compared to a high-resolution anatomical imaging modality, in this case, microCT (Scanco Medical Viva CT40). Two sealed glass capillaries (douter = 1 mm, dinner = 0.61 mm) containing 5 μM of NIR-664-iodoacetamide (λex = 664 nm, λem = 689 nm; Sigma-Aldrich) in methanol were positioned in a 3-mm-thick collagen (9 mg/mL; μa = 0.08 cm−1; ) scaffold at two different depths in an orthogonal fashion. The phantom was imaged over a 5.5 mm × 8 mm area using our MFMT system (15 360 source positions-7 detectors measurements at each source position: 107 520 total measurements). Under microCT, the collagen phantom with glass capillaries was visualized with a field of view of 32.8 mm2 at 16 μm voxel size.
In all cases, both visual results and SMSE indexes are given to evaluate the performance of the proposed inverse methodology in different scenarios. For the purpose of comparison, we also give the reconstruction results by commonly used iterative regularization methods, least square QR factorization (LSQR) and CG. In order to get optimal results for l1-norm, LSQR and CG methods, we employ the L-curve method to find the iterative number and regularization parameter when residual norm tends to a least value [7].
III. Result
A. MC Computation and Reconstructions
All computations were carried out to generate the Jacobians and synthetic measurements were performed under less than 5 min in a desktop computer (CPU: Intel Core i7-3820 Quad-Core 3.60 GHz 10 MB Intel Smart Cache, GPU: NVIDIA Kepler K20M). Similarly, reconstructions were performed in a less than 5 min on the aforementioned computer. For instance, reconstructions based on the CS method for a 2 mm × 5 mm × 3 mm volume with 80 μm voxel size were completed in 285 s (4 min 45 s).
B. Different Depths of Fluorophore Concentrations
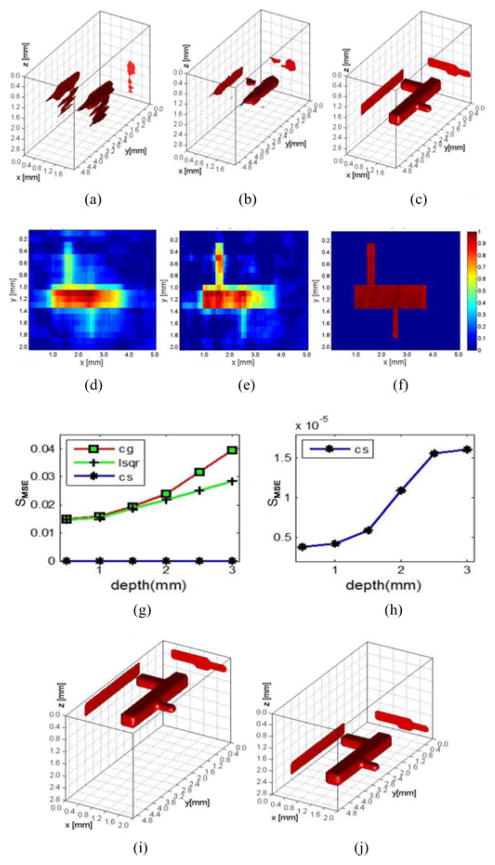
Fig. 4(g) shows the calculated SMSE from reconstructions performed using the three inverse methods at six different depth locations (from 0.5 to 3 mm with interval 0.5 mm). The CS method far outperforms its counterparts at every depth investigated (four order in magnitude between SMSE values). For instance, a visual comparison between reconstructions based on the different inversion algorithms employed and for a 2 mm depth location is proposed in Fig. 4(a)–(f). The reconstructed image obtained via CS provides an accurate anatomical description of the simulated vascular tree whereas both CG and LSQR do not recover the three components of the vascular tree distinctly.
Fig. 4.
Reconstruction results at different depths. (a)–(c) Reconstruction results were presented for CG, LSQR, and CS at depth of 2 mm. (d)–(f) Cross section of (a)–(c); colorbars represent the quantum efficiency (η(r)). (g) Reconstruction results of three methods at six different depths. (h) Reconstruction results of CS at six different depths. (i) and (j) Three-dimensional rendering of the reconstructions for CS at 0.5 and 2.8 mm, respectively (voxel size of 100 μm and no noise added in the measurements).
Moreover, the retrieved quantum yield distribution is far more homogeneous with accurate values in the small components of the vascular tree when using the CS method conversely to the two common inverse solvers. As for the CS method, its reconstruction performance also deteriorates with the depth increasing, shown as in Fig. 4(h). However, the reconstruction quality degrades at a slower rate for CS-based reconstructions than the other two methods when depth increases; see Fig. 4(i) and (j).
C. Reconstruction at Different Discretization Levels
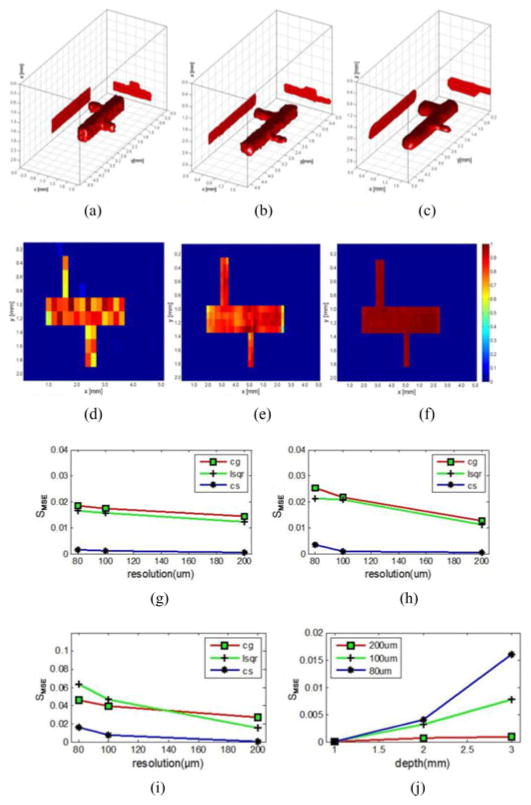
The effect of discretization on performances of CS-based reconstruction for MFMT was investigated by discretizing the imaging domain at three different resolutions: 200, 100, and 80 μm. We tested these three kinds of discretization resolutions for three different depth locations of the vascular tree: 1, 2, and 3 mm deep. Fig. 5(a)–(f) depicts the reconstructions results of CS with different resolutions at the depth of 2 mm (200, 100, and 80 μm, respectively). Fig. 5(g)–(i) shows the SMSE indexes at different depths for these three different imaging domains (1, 2, and 3 mm, respectively) and the three inversion methods employed. Fig. 5(j) reports the reconstruction quality versus depth for the CS method at the 3 voxel resolutions. In all cases, accurate reconstructions were obtained with reconstructions at 80 μm providing the most homogenous effective quantum yield estimation within the vascular tree.
Fig. 5.
Reconstruction performance for 3 voxel sizes at three different depths: (a)–(c) CS reconstruction results at depth of 2 mm with voxel sizes of 200, 100, and 80 μm, respectively. (d)–(f) Cross section of (a)–(c). Colorbars represent the quantum efficiency (η(r)). (g)–(i) CG, LSQR, and CS reconstruction results of three different resolutions at depth of 1, 2, and 3 mm with different discretization levels. (j) Reconstruction result of CS with 3 voxel sizes.
D. Reconstruction of Different Levels of Noise
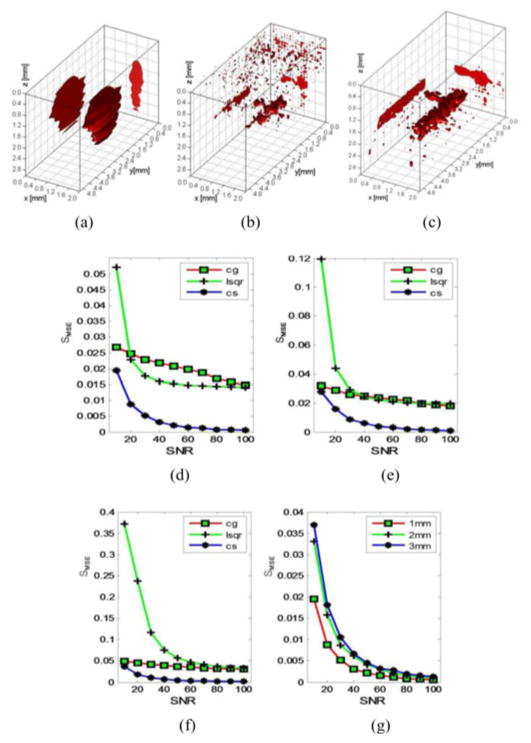
Ten different levels of Gaussian-distributed electronic noise were added to the synthetic measurements, with SNR ranging from 100 to 10 (evenly spaced), to evaluate the robustness of the proposed reconstruction method. Fig. 6 shows the SMSE versus SNR for all the ten different levels of noise and at three different depth locations. The SMSE of CS methods becomes significantly larger when SNR decreases below 40, which indicates that reconstruction performance of the method is also sensitive to noise. Though, despite this decrease in reconstruction quality as the SNR decreases, CS still outperforms CG and LSQR methods for all the levels of noise simulated herein. Moreover, with the depth increasing, the reconstruction quality of CG and LSQR becomes worse drastically.
Fig. 6.
Reconstruction performance for ten levels of additional noise at three different depths. (a)–(c) Reconstruction results of three methods at depth of 1 mm with SNR of 40. (d)–(f) SMSE of the three methods reconstruction results at depth of 1, 2, and 3 mm with ten levels of noise. (g) SMSE of CS reconstruction results at depth of 1, 2, and 3 mm with ten levels of noise.
E. Synthetic Model
To mimic more closely real applications, a complex vascular network was simulated based on the segmentation of the real volumetric data depicted in Fig. 7(a). Two vascular beds were simulated, vascular beds with complex 3-D and depth distributions [see Fig. 7(b) and (c)]. Fig. 7(d)–(i) displays the reconstructed images of the vasculature using the different inversion techniques mentioned previously with a discretization of 100 μm. As can be seen from Fig. 7(d) and (g), the results of CG tend to be heavily surface weighted whereas LSQR provides more accurate reconstructions but is able to reconstruct only the lager segment of the vascular bed and failed to recover the most complex distributions, as shown in Fig. 7(e) and (h). Conversely, the CS reconstructions provide accurate rendering of the simulated networks, as shown in Fig. 7(f) and (i). In both cases, the structures of the vascular beds were retrieved with high fidelity at all depths.
F. Vascular Structure Mimicking in a Collagen Scaffold and Validation
The reconstructions employing experimental data are provided in Fig. 8. The experimental data were acquired from a collagen sample, which hosted two orthogonal capillaries. The dye filled capillaries place beneath the surface and ~1 mm apart in depth. Prior to reconstruction, background data were subtracted from fluorescence data similarly to the procedure described in [27]. Examples of fluorescence, background, and subtracted data are provided in Fig. 8(f) and (g). The contrast-to-noise ratio was estimated to be >1000, owing to very small noise standard deviation (~5). Two reconstruction methods, CG [8] and l1-norm, were used to solve the optical inverse problem using the subtracted dataset and reconstructions are provided in Fig. 8(c) and (b), respectively. Fig. 8(d), (e), (h), and (i) demonstrates the overlaid image of CS and CG reconstructions with microCT. The slices were taken along the y-axis. In both cases, the two capillaries were individually reconstructed at their exact locations. However, the CS-based approach provided more accurate results with better shape over the whole length of the capillaries and more homogenous fluorescence distribution conversely to CG. Also, we defined a coregistration ratio (the number of voxel inside or outside tube reconstructed divided by the total number of voxel in tube) to assess the reconstruction performance of CS for experimental data by counting the total number of voxels in the optical reconstructions that are located inside and outside of the ground-truth location of each tube as estimated by microCT. The values of these coregistration ratios are provided in Table I. The CS method provides better volumetric registration than CG for both tubes with an agreement at least up to 92% between CS-based optical reconstruction and microCT versus only 76% in the best case scenario for CG (see Table I and Fig. 8).
Fig. 8.
Experimental validation of CS reconstruction results in a collagen scaffold compared with microCT and CG methods. (a) Ground truth for localizations of glass wall of two capillaries in the collagen scaffold obtained from a microCT scanner. (b) and (c) Reconstruction results of CS and CG, respectively. (d) and (e) Merged 3-D images of (b) and (c) with (a). (f) Raw data and line profile for fluorescence (blue), background (green), and subtracted (red) data, respectively. (g) Line profiles from two sets of data: left and right profiles. Upper figure shows the left profile for fluorescence (blue square), background (solid green), and subtraction (red circle). Lower figure follows the same convention for right region. (h) and (i) Overlaid reconstruction of CS and CG merged with microCT, respectively, at three different slices along y-axis.
TABLE I.
Quantitative Comparison Between CS and CG Reconstruction Results
| Coregistration ratio | CS for upper tube | CG for upper tube | CS for bottom tube | CG for bottom tube |
|---|---|---|---|---|
| MircoCT (ground truth) | 98% | 98% | 98% | 98% |
| Inside voxels | 94% | 76% | 92% | 71% |
| Outside voxels | 16% | 22% | 19% | 30% |
IV. Discussion
Herein, we have investigated the performances of CS-based reconstruction versus commonly employed methods (CG and LSQR) when performing mesoscopic fluorescence tomography. In all cases investigated, both in silico and experimental, the CS-based reconstruction outperformed their counterparts both in terms of retrieving the structure of the inclusions with high fidelity but also in recovering quantitatively the biodistribution of the relative quantum yield. The CS approach demonstrated higher resolution performances (as expected), more accurate quantification (homogeneity), and more robust against noise. These results suggest that CS-based reconstruction techniques are very suitable for fluorescence tomographic imaging in the mesoscopic regime as the image domain is generally sparse. As long as optimal regularization parameters are established via techniques such as the L-curve, the l1-norm is a robust technique that can be implemented easily without much penalty in terms of computation time. Applied to imaging of sparse fluorescence signal, resolution to the scale of the element of volume (voxel) can be attained. This is very significant for numerous applications that require imaging deep thick tissue at a high resolution. However, as one refines the discretization of the image space, the size of the inverse problem becomes the most challenging part due to the sheer size of the matrices/vectors to be manipulated. Massively parallel implementation or matrix reduction based on CS techniques can be employed to solve this issue. This will be investigated in subsequent studies to attempt to identify what the optimal resolution attainable for MFMT is. Note that such resolution is system dependent. In our current implementation, we collect data from only seven detectors. We are currently integrating a new detection module that will allow acquiring 64 × 64 measurements at each source position. Increasing the spatial density of the measurements is also expected to contribute to better reconstructions performances.
V. Conclusion
In this paper, based on the sparsity of the fluorophore distribution in the image domain, we have proposed image reconstruction methods with CS framework to solve the MFMT inverse problem. The proposed method was compared with the conventional method, such as CG and LSQR methods by a synthetic model of microvessel network in different voxel sizes (200, 100, and 80 μm). Simulations and experimental results demonstrate that the CS-based method yields higher fidelity reconstructions of vascular bed with better resolution and improved image reconstruction stability for MFMT. We plan to employ this technique to assess the maturation process of printed vasculature in tissue constructs [8] as well as in vivo imaging during PDT treatments [9].
Acknowledgments
This work was supported in part by National Science Foundation under Grant CBET-1263455, International Cooperation Program for Excellent Lectures of 2011 by SDPED, Project of Shandong Province Higher Educational Science and Technology Program under Grants J13LN06, Postdoctoral Science Foundation of Shandong Province under Grant 201203016, and National Natural Science Foundation of China under Grants 61173173 and 61272430.
Contributor Information
Fugang Yang, Shandong Institute of Business and Technology, Yantai 264005, China, and is also with the Department of Biomedical Engineering, Rensselaer Polytechnic Institute, Troy, NY 12180 USA.
Mehmet S. Ozturk, Department of Biomedical Engineering, Rensselaer Polytechnic Institute, Troy, NY 12180, USA
Lingling Zhao, Department of Biomedical Engineering, Rensselaer Polytechnic Institute, Troy, NY 12180, USA.
Wenxiang Cong, Department of Biomedical Engineering, Rensselaer Polytechnic Institute, Troy, NY 12180, USA.
Ge Wang, Department of Biomedical Engineering, Rensselaer Polytechnic Institute, Troy, NY 12180, USA.
Xavier Intes, Department of Biomedical Engineering, Rensselaer Polytechnic Institute, Troy, NY 12180 USA.
References
- 1.Hillman EMC, Boas DA, Dale AM, Dunn AK. Laminar optical tomography: Demonstration of millimeter-scale depth-resolved imaging in turbid media. Opt Lett. 2004 Jul;29(14):1650–1652. doi: 10.1364/ol.29.001650. [DOI] [PubMed] [Google Scholar]
- 2.Yuan S, Li Q, Jiang J, Cable A, Chen Y. Three-dimensional coregistered optical coherence tomography and line-scanning fluorescence laminar optical tomography. Opt Lett. 2009 Jun;34(11):1615–1617. doi: 10.1364/ol.34.001615. [DOI] [PubMed] [Google Scholar]
- 3.Zhao L, Lee VK, Yoo SS, Dai G, Intes X. The integration of 3-D cell printing and mesoscopic fluorescence molecular tomography of vascular constructs within thick hydrogel scaffolds. Biomaterials. 2012 Jul;33(21):5325–5332. doi: 10.1016/j.biomaterials.2012.04.004. [DOI] [PMC free article] [PubMed] [Google Scholar]
- 4.Lee O, Kim JM, Bresler Y, Ye JC. Compressive diffuse optical tomography: Noniterative exact reconstruction using joint sparsity. IEEE Trans Med Imag. 2011 May;30(5):1129–1142. doi: 10.1109/TMI.2011.2125983. [DOI] [PubMed] [Google Scholar]
- 5.Ye JC, Lee SY, Bresler Y. Exact reconstruction formula for diffuse optical tomography using simultaneous sparse representation. Proc. 5th IEEE Int. Symp. Biomed. Imag; Paris, France. 2008; pp. 1621–1624. [Google Scholar]
- 6.Chartrand R. Exact reconstruction of sparse signals via nonconvex minimization. IEEE Signal Process Lett. 2007 Oct;14(10):707–710. [Google Scholar]
- 7.Chartrand R. Iteratively reweighted algorithms for compressive sensing. presented at the IEEE International Conference on Acoustics, Speech, and Signal Processing; Las Vegas, NV, USA. 2008; pp. 1–4. [Google Scholar]
- 8.Ozturk M, Zhao L, Lee V, Dai G, Intes X. Mesoscopic fluorescence molecular tomography of reporter genes in bio printed thick tissue. J Biomed Opt. 2013;18(10):100501–100503. doi: 10.1117/1.JBO.18.10.100501. [DOI] [PMC free article] [PubMed] [Google Scholar]
- 9.Ozturk MS, Rohrbach D, Sunar U, Intes X. Mesoscopic fluorescence tomography of photosensitizer (HPPH) 3D biodistribution skin cancer for PDT with. Acad Radiol. 2014;21(2):271–280. doi: 10.1016/j.acra.2013.11.009. [DOI] [PubMed] [Google Scholar]
- 10.Arridge SR. Optical tomography in medical imaging. Inverse Problems. 1999;15:41–93. [Google Scholar]
- 11.Fang Q, Boas DA. Monte Carlo simulation of photon migration in 3D turbid media accelerated by graphics processing units. Opt Exp. 2009;17(22):20178–20190. doi: 10.1364/OE.17.020178. [DOI] [PMC free article] [PubMed] [Google Scholar]
- 12.Alerstam E, Svensson T, Engels SA. Parallel computing with graphics processing units for high-speed Monte Carlo simulation of photon migration. J Biomed Opt. 2008;13(6):0605041–0605043. doi: 10.1117/1.3041496. [DOI] [PubMed] [Google Scholar]
- 13.Chen J, Venugopal V, Intes X. Monte Carlo based method for fluorescence tomographic imaging with lifetime multiplexing using time gates. Biomed Opt Exp. 2011;2(4):871–886. doi: 10.1364/BOE.2.000871. [DOI] [PMC free article] [PubMed] [Google Scholar]
- 14.Chen J, Fang Q, Intes X. Mesh-based Monte Carlo method in time-domain wide-field fluorescence molecular tomography. J Biomed Opt. 2012;17(10):106009–106012. doi: 10.1117/1.JBO.17.10.106009. [DOI] [PMC free article] [PubMed] [Google Scholar]
- 15.Chen J, Intes X. Comparison of Monte Carlo methods for fluorescence molecular tomography-computational efficiency. Med Phys. 2011 Oct;38(10):5788–5798. doi: 10.1118/1.3641827. [DOI] [PMC free article] [PubMed] [Google Scholar]
- 16.Chen J, Intes X. Time-gated perturbation Monte Carlo for whole body functional imaging in small animals. Opt Exp. 2009 Oct;17(22):19566–19579. doi: 10.1364/OE.17.019566. [DOI] [PMC free article] [PubMed] [Google Scholar]
- 17.Suzen M, Giannoula A, Durduran T. Compressed sensing in diffuse optical tomography. Opt Exp. 2010 Jul;18:23676–23690. doi: 10.1364/OE.18.023676. [DOI] [PubMed] [Google Scholar]
- 18.Lee O, Kim JM, Bresler Y, Ye JC. Compressive diffuse optical tomography: Noniterative exact reconstruction using joint sparsity. IEEE Trans Med Imag. 2011 Mar;30(5):1129–1142. doi: 10.1109/TMI.2011.2125983. [DOI] [PubMed] [Google Scholar]
- 19.Lustig M, Donoho D, Pauly JM. Sparse MRI: The application of compressed sensing for rapid MR imaging. Magn Reson Med. 2007 Oct;58:1182–1195. doi: 10.1002/mrm.21391. [DOI] [PubMed] [Google Scholar]
- 20.Boÿll P, Zibulevsky M. Underdetermined blind source separation using sparse representations. Signal Process. 2001 Jun;81:2353–2362. [Google Scholar]
- 21.Zibulevsky M, Zeevi YY. Extraction of a source from multichannel data using sparse decomposition. Neurocomputing. 2002 Dec;49(1–4):163–173. [Google Scholar]
- 22.Ossadtchi A, Kadambe S. Over-complete blind source separation by applying sparse decomposition and information theoretic based probabilistic approach. presented at the IEEE International Conference on Acoustics, Speech, and Signal Processing Proceedings; Salt Lake City, UT, USA. 2001; pp. 2801–2804. [Google Scholar]
- 23.Chen SS, Donoho DL, Saunders MA. Atomic decomposition by basis pursuit. SIAM J Sci Comput. 1998 Jan;20(1):33–61. [Google Scholar]
- 24.Silva C, Maltez JC, Trindade E, Arriaga A, Ducla-Soares E. Evaluation of L1 and L2 minimum norm performances on EEG localizations. Clin Neurophysiol. 2004 Jul;115(7):1657–1668. doi: 10.1016/j.clinph.2004.02.009. [DOI] [PubMed] [Google Scholar]
- 25.Kin SJ, Koh K, Lustig M, Boyd S, Gorinevsky D. An interior-point method for large-scale l1-regularized least squares. IEEE J Sel Topics Signal Process. 2007 Dec;1(4):606–617. [Google Scholar]
- 26.Fang Q, Sakadzić S, Ruvinskaya L, Devor A, Dale AM, Boas DA. Oxygen advection and diffusion in a three- dimensional vascular anatomical network. Opt Exp. 2008 Oct;16(22):17530–17541. doi: 10.1364/oe.16.17530. [DOI] [PMC free article] [PubMed] [Google Scholar]
- 27.Yuan B, Burgess SA, Iranmahboob A, Bouchard MB, Lehrer N, Bordier C, Hillman EMC. A system for high-resolution depth-resolved optical imaging of fluorescence and absorption contrast. Rev Sci Instrum. 2009;80(4):43706–43711. doi: 10.1063/1.3117204. [DOI] [PMC free article] [PubMed] [Google Scholar]


