

Abstract
Understanding cellular life requires a comprehensive knowledge of the essential cellular functions, the components involved, and their interactions. Minimized genomes are an important tool to gain this knowledge. We have constructed strains of the model bacterium, Bacillus subtilis, whose genomes have been reduced by ∼36%. These strains are fully viable, and their growth rates in complex medium are comparable to those of wild type strains. An in-depth multi-omics analysis of the genome reduced strains revealed how the deletions affect the transcription regulatory network of the cell, translation resource allocation, and metabolism. A comparison of gene counts and resource allocation demonstrates drastic differences in the two parameters, with 50% of the genes using as little as 10% of translation capacity, whereas the 6% essential genes require 57% of the translation resources. Taken together, the results are a valuable resource on gene dispensability in B. subtilis, and they suggest the roads to further genome reduction to approach the final aim of a minimal cell in which all functions are understood.
The understanding of how a living cell operates is a key issue in life science. To study and fully understand all fundamental processes of a living cell, it is crucial to reduce its complexity by constructing genome-minimized organisms. Genome reduction is also pursued to obtain simplified cell factories for producing value-added compounds (Trinh et al. 2008; Komatsu et al. 2010).
Two strategies are used to generate genome-reduced organisms: the bottom-up and the top-down approaches (Lam et al. 2012; Juhas et al. 2014). Whereas the former approach is used to synthesize a minimal cell from essential genes, the latter approach is applied to streamline existing genomes by deleting nonessential genomic regions. The bottom-up approach has been applied to synthesize the artificial Mycoplasma mycoides JCVI-syn3.0 with a minimal genome of only 531 kb (Hutchison et al. 2016). This genome is smaller than that of any independently replicating bacterium found in nature. The bottom-up approach also includes attempts to synthesize protocells that are well-suited to study basic cellular processes such as cell division and replication (Blain and Szostak 2014; Xavier et al. 2014).
The top-down approach has been used to streamline the genomes of several bacteria (Komatsu et al. 2010; Leprice et al. 2012; Juhas et al. 2014; Choe et al. 2016). For Escherichia coli, it has been shown that up to 35% of the genome is dispensable for viability (Hirokawa et al. 2013). In a first attempt to streamline the Bacillus subtilis genome, 7.7% of the genetic information was removed (Westers et al. 2003). The loss of more than 300 genes did not cause any growth defect, and the differentiation processes remained unaffected. The B. subtilis genome has even been reduced by ∼25%, but growth of the cells was unstable (Ara et al. 2007). Recently, 146 individual B. subtilis deletion mutants have been generated that could grow on rich medium (Tanaka et al. 2013). For both E. coli and B. subtilis, it remains to be evaluated how far the genome reduction can go. However, given the different cellular organization and biology of E. coli, M. mycoides, and B. subtilis, genome reduction approaches with these and other bacteria are required to get a final glimpse of the very essence of life (Reuß et al. 2016a; Martínez-Garcia and de Lorenzo 2016).
Essential genes are crucial for the viability of an organism under optimal growth conditions. Thus, the identification and evaluation of the essential gene set is important for the construction of a viable minimal cell. However, the genome of a minimal organism is much more than an essential gene set because many cellular processes can be achieved in different ways (Commichau et al. 2013). For instance, paralogous proteins may carry out the same function and only loss of all of them is lethal. Moreover, essential building blocks can either be acquired by uptake or by de novo synthesis. Genes can also be essential because of their role in the protection of the cell against harmful molecules (Commichau et al. 2013). Large-scale studies identified 253 and 295 genes as being individually essential for growth of B. subtilis and E. coli, respectively, on rich medium at 37°C (Gerdes et al. 2003; Kobayashi et al. 2003; Reuß et al. 2016a). Although the E. coli genome contains 13 essential genes of unknown function, B. subtilis possesses only one essential gene whose function remains to be discovered (Juhas et al. 2014).
In this study, we have applied the top-down approach to reduce the B. subtilis genome in order to obtain minimal strains with robust growth on complex medium at 37°C.
Results
Construction of genome-reduced strains
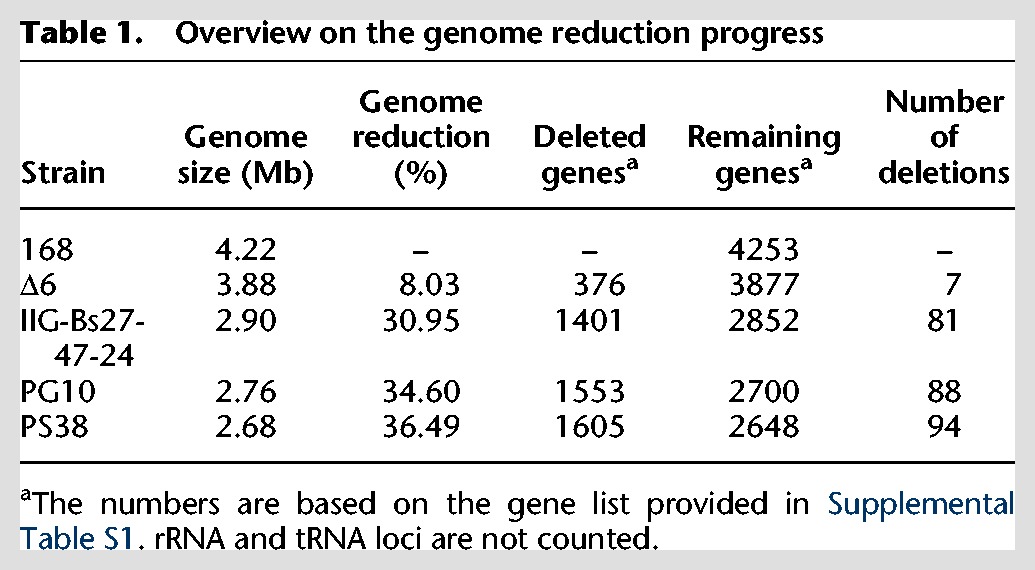
In order to construct a genome-reduced B. subtilis strain in which all remaining genes are essential for the survival of the cell and the genome integrity as well as to identify a minimal gene set required for life, we used a fast and reliable marker-free deletion system for a stepwise reduction of the B. subtilis Δ6 genome (Westers et al. 2003; Wenzel and Altenbuchner 2015). In order to avoid problems with loss of growth or genetic competence, we decided at an advanced stage of the project to continue with two independent strain lineages (Fig. 1). So far, ∼36% of the genome has been deleted (compared to the B. subtilis 168 genome [NC_000964]). This has been achieved by introducing 88 and 94 individual deletions in the two independent strains PG10 and PS38, respectively (Fig. 1; Table 1). The deletions were designed following the outline of a minimal cell based on B. subtilis (Reuß et al. 2016a). First priority was given to large dispensable regions and cellular functions, which are not necessary for the survival of the cell (e.g., sporulation, antibiotic production, motility, metabolism of secondary carbon sources, and genes of unknown functions). Among the selected deletion regions, a few could not be deleted or resulted in severe fitness defects (Supplemental Table S1). These regions were either modified or not included in the multideletion lines. For a detailed overview on the deleted regions, see Supplemental Table S1.
Figure 1.

Progress of Bacillus subtilis genome reduction. (A) Schematic overview on the important functions to be conserved in a genome-reduced strain. The pie chart indicates functional distribution of the remaining 64% of genes in the genome-reduced strain PG10. (B) Localization of the individual deletions in the reference strain B. subtilis Δ6, the last common ancestor IIG-Bs27-47-24, and the analyzed strains PG10 and PS38. Each bar indicates a deleted genomic region. The locations of the deletions refer to the B. subtilis 168 genome (NC_000964). (C) Genealogy of the genome-reduced strains. The number of deletions and the genome sizes of important intermediate strains are depicted.
Table 1.
Overview on the genome reduction progress
A major problem encountered with advancing genome reduction was a gradual decrease of genetic competence. This problem was solved by integrating a comK/comS cassette under control of the mannitol-inducible mtlP promoter (Rahmer et al. 2015). The resulting strain, B. subtilis IIG-Bs27-24 (Fig. 1C), showed a 20-fold higher transformation rate compared to the laboratory strain B. subtilis 168.
To determine the consequences of the combined deletions, we compared the physiological properties of the deletion strains PG10 and PS38 to the reference strain Δ6. Growth of the bacteria was analyzed in complex medium supplemented with glucose. The reference strain had a generation time of 21.5 ± 2.3 min, whereas the deletion strains PG10 and PS38 doubled every 33.0 ± 2.2 and 29.3 ± 0.4 min, respectively. Furthermore, the cytoplasmic volume and the genetic competence of the genome-reduced strains were analyzed. Strikingly, the individual cells were rod-shaped and similar to those of the reference strain. However, although the reference strain Δ6 grew in the form of individual separated cells, we observed long filaments of nonseparated cells for both deletion strains. The genetic competence was reduced only to a minor extent since the comK-comS cassette was introduced in the intermediate strain IIG-Bs27-24. For a detailed description of the phenotypic results, see Supplemental Data S1.
A multi-omics analysis of the minimized strains
In order to obtain deeper insights into the consequences of the deletions for the bacteria, we decided to perform a multi-omics analysis of the reference strain Δ6 and the two deletion strains PG10 and PS38. The genomes of the two deletion strains and the genome of their last common ancestor, IIG-Bs27-47-24, were sequenced and compared to the progenitor reference strain Δ6. Moreover, the bacteria were cultivated in complex medium supplemented with glucose, and samples of the same cultures were subjected to metabolome, proteome, and transcriptome analyses.
Mutations in the genome-reduced strains
The genome sequences confirmed the presence and the precise genomic location of all deletions in the three strains. In addition, we detected several mutations that were present either in both or in either one of the individual deletion strains. It is known from other large-scale genome engineering projects that such mutations may occur (Gibson et al. 2010; Hutchison et al. 2016), and they may have impact on the further development of the project. We found 73 mutations in the common ancestral strain, IIG-Bs27-47-24 (for the details of the mutation analysis, see Supplemental Table S2). Of these mutations, 12 affected noncoding regions of the genome. Moreover, 35 mutations affected the trpC gene. Hypervariability of this gene has been previously observed for different strains of B. subtilis. In particular, the 3NA strain, which was used to cure the trpC mutation of the reference strain Δ6, carries the same trpC allele as our progenitor strain (Reuß et al. 2016b), indicating that this polymorphism is a legacy of strain construction. Moreover, mutations were detected in the mfd, pit, dgcW, gpsB, and yusT genes that encode the transcription–repair coupling factor, a low affinity phosphate transporter, putative diguanylate cyclase/phosphodiesterase, a cell division protein, and a LysR-type transcription factor, respectively. The PG10 and PS38 strains share two additional mutations in noncoding regions. Among the mutations specific for PG10 are those affecting thyA and ynzD, encoding thymidylate synthase A and a phosphatase that targets Spo0A phosphate, the major regulator for post-exponential lifestyles, respectively. In PS38, we detected mutations in the mutSB and tagC genes that encode a putative mismatch repair protein and a nonessential protein that may be involved in polyglycerol phosphate teichoic acid biosynthesis.
General results of the multi-omics analysis
The deletion of about one-third of all protein-coding genes in the genome-reduced strains suggests that the relative amount of protein-coding mRNA in comparison to all RNAs has decreased. In agreement with this hypothesis, we calculated a reduction of the share of mRNA of total RNA in both deletion strains by ∼10% as compared to the reference strain.
The multi-omics analyses identified significant effects of the deletions at all levels; indeed, we observed 420 (371), 302 (269), and 14 (7) significant changes at the transcriptome, proteome, and metabolite levels for PG10 (PS38), respectively. At least 65% of all proteins with different amounts between the reference and genome-reduced strains show a similar change at the transcriptome level (Supplemental Data S2).
One interesting question of the proteome analysis is related to the contribution of the proteins encoded by genes deleted in the genome-reduced strains to the proteome of the reference strain Δ6. These deleted genes are mainly involved in minor or post-exponential functions and therefore likely to be underrepresented in the reference proteome. In addition to ∼8% already deleted in the reference strain, another 28% of the genome has been deleted in the genome-reduced strains PG10 and PS38. Indeed, the ∼28% difference in genome size between the reference strain and the genome-reduced strains account for only 1.1% and 2.4% of the proteome of the reference strain as compared to the minimized strains PG10 and PS38, respectively.
For all strains, we have analyzed the distribution of the genes among major functional categories. In parallel, all proteome data have been analyzed with respect to the allocation of the translation capacity to these different functional classes (Fig. 2A). A similar analysis has been performed to take gene essentiality and the level of knowledge on any given gene into account (Fig. 2B). The results can be visualized using the MB-proteome browser at http://www.minibacillus.org. As shown in Figure 2A, the share of genes involved in Metabolism and Information processing has increased in the genome-reduced strains at the expense of genes involved in Lifestyle functions (motility and biofilm formation, sporulation, stress adaptation) and of genes that cannot be grouped to any of the known functional classes (Other). Interestingly, the representation of functional classes differs drastically at the proteome level (Fig. 2A). In the reference strain, proteins involved in Information processing account for 56% of protein synthesis capacity, whereas the corresponding genes make up only 20% of the genome. Similarly, enzymes and proteins involved in Metabolism are overrepresented in the proteome as compared to their share in the coding capacity. On the other hand, the proteins involved in Lifestyles and Other functions require as little as 10% of the protein synthesis capacity in complex medium, although the respective genes sum up to 49% of the genome. In the genome-reduced strains, we observed a reduction of the protein synthesis capacity used for Information processing, although the relative number of genes for these functions has increased from 20% to 24%. On the other hand, proteins involved in Lifestyles became more prominent in the genome-reduced strains in spite of a reduction of the number of genes in this functional category (see below).
Figure 2.

The functional distribution of the genes and their corresponding relative protein fractions are highly disproportional. (A) Gene distribution and allocation of translation capacity according to functional categories. The upper panel shows the functional distribution of genes in the genome-reduced strains. All genes were assigned to one of four major functional categories (cellular processes, metabolism, information processing, lifestyles). The lower panel shows the allocation of translation capacity to functional categories. (B) Extreme overrepresentation and underrepresentation of essential and unknown proteins, respectively, in the proteome. The upper panel shows the distribution of genes in the genome-reduced strains according to essentiality and the level of knowledge. All genes were assigned to one of four classes (essential; nonessential, function known; nonessential, poorly characterized; and nonessential, unknown). The lower panel shows the allocation of translation capacity according to essentiality and the level of knowledge. The alpha values (percentage abundance) obtained for the individual proteins in the proteome analyses were pooled for each class. The relative protein fractions indicate the allocation of translation resources to each class.
In the genome of B. subtilis, the essential genes account for 6% of all genes, whereas ∼21% of the genes code for proteins of unknown function. In the genome-reduced strains, only five of the essential genes have been deleted. These genes are part of prophages and encode protective functions (Commichau et al. 2013). In contrast, about 300 of the genes of unknown function have been deleted. Thus, the essential genes are enriched to 9% in the genome-reduced strains, whereas the relative number of unknown genes has declined to 18% (Fig. 2B). Interestingly, even if only a small number of genes are essential, they account for a significant portion of the total proteome. In the reference strain, the essential proteins represent 57% of the total proteome, and this share is reduced in the genome-reduced strains PG10 and PS38 to 50% and 51%, respectively. In contrast, the proteins of unknown function represent only 2.7% and 2.5% of the proteome in the reference and the genome-reduced strains, respectively (Fig. 2A). These observations on one hand underline the importance of the essential genes and on the other hand suggest that unknown genes may only be expressed under very specific conditions.
The transcription units with the strongest changes at the level of gene expression are shown in Table 2 (all transcription data are provided in Supplemental Table S3). Among the most severely up-regulated transcription units in both strains were the mhqNOP operon and the mhqA and azoR2 genes. Strikingly, these three transcription units are repressed by the transcription factor MhqR that has been deleted early during genome reduction. Moreover, we observed a strong increase in transcription of the ydfQ gene coding for a thioredoxin-like protein. This gene is located immediately downstream from the mhqNOP operon, suggesting transcriptional read-through. The highly increased transcription of the MhqR regulon is also the reason for the overrepresentation of the functional category Lifestyle in protein resource allocation (see above). This category includes the stress proteins and thus also the proteins involved in resistance against oxidative and electrophile stress (see http://subtiwiki.uni-goettingen.de/wiki/index.php/Resistance_against_ oxidative_and_electrophile_stress) (Michna et al. 2016).
Table 2.
Genes with the most strongly affected expression in the genome-reduced strains
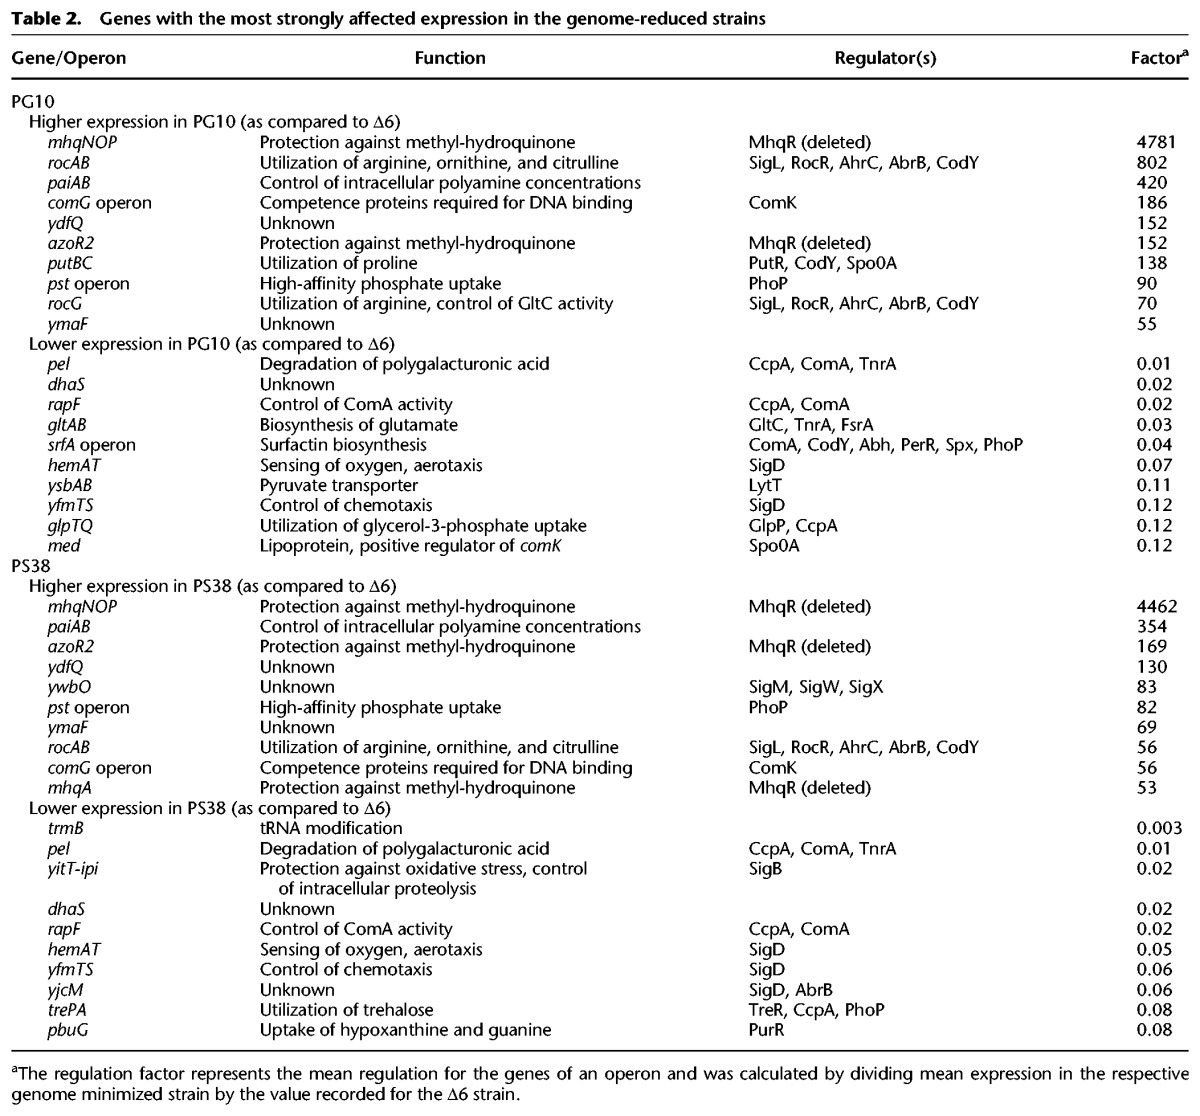
The increased expression of the comG operon in the genome-reduced strains is the result of the overexpression of the ComK competence transcription factor. As mentioned above, the pit gene encoding a low-affinity phosphate transporter carries a mutation in the deletion strains. The cells might perceive the resulting reduced phosphate uptake as a phosphate limitation, which results in activation of the PhoPR two-component regulatory system. Indeed, the pst operon encoding a high-affinity ABC transporter for phosphate as well as the pipA gene are strongly expressed in both deletion strains PG10 and PS38, supporting the idea of an activation of the PhoPR system. In addition, the rocA gene encoding an enzyme of the arginine utilization pathways and the putBC operon involved in proline utilization were strongly up-regulated in both deletion strains (for a detailed discussion of amino acid metabolism, see below). Finally, the paiAB operon encoding a spermine/spermidine-N-acetyltransferase exhibited an increased expression in both PG10 and PS38. In strain PS38, we observed an increased expression of genes of the PerR regulon, which is required for protection of the cell against peroxide stress. It is tempting to speculate that this increase is caused by deletion of the ahpCF operon in PS38, but not in PG10. The ahpCF operon encodes the highly expressed alkyl hydroperoxide reductase (Antelmann et al. 1996; Nicolas et al. 2012), and the loss of this enzyme triggers peroxide stress (Bsat et al. 1996).
Among the genes with reduced expression in both genome-reduced strains, several transcription units (including the pel and rapF genes and the srfA operon) depend on activation by the two-component system ComPA, which has been deleted already in the common progenitor of both deletion strains. In addition, both strains showed a strongly reduced expression of the dhaS gene encoding an aldehyde dehydrogenase. This might be the result of a deletion that extends into the immediate upstream region of dhaS and that may affect the expression signals. Similarly, the regions upstream of the trmB gene and the yitT-ipi operon have been deleted in PS38, and these deletions are accompanied by a strongly reduced expression of these genes in PS38. The gltAB operon was strongly repressed in the strain PG10. This might result from the significant overexpression of the glutamate dehydrogenase RocG in this strain (Fig. 6, see below). Taken together, most of the strongest changes at the level of gene expression can be explained by the introduced genome alterations or as a secondary consequence of primary changes in gene expression. For those alterations that cannot be explained, it is possible that the underlying regulatory mechanisms have not yet been identified. Alternatively, the significant reduction of genome size might cause topological alterations in the chromosome, which are then reflected by changes in gene expression (Hatfield and Benham 2002; Durand-Dubief et al. 2010; Vos et al. 2011; Ferrándiz et al. 2016).
Another consequence of the genome deletions for the transcriptional landscape is the generation of novel transcription units. This may result in the appearance of new operons or even of antisense transcripts if two transcription units from opposing strands are joined without a terminator between them. Indeed, a new operon consisting of recX and mutY was generated by the deletion of the region between yfhH and yfhP. The latter is the case for the expression of the ndh and pit genes encoding NAD dehydrogenase and the low-affinity phosphate transporter, respectively. In both genome-reduced strains, strong antisense transcription of both genes is observed due to read-through transcription.
The gene expression/translation machinery
The analysis of protein resource allocation revealed that in the reference strain Δ6, ∼56% of the resources are used for information processing (Fig. 2A). This observation is in excellent agreement with results obtained for resource allocation in other bacteria (Bremer and Dennis 1996; Hui et al. 2015). In contrast, the genome-reduced strains PG10 and PS38 use 49.8% and 50.3%, respectively, of their resources for information processing. This difference can be attributed to the fractions of ribosomal proteins, which were reduced by 25.3% and 22.3% in the two strains, respectively (Fig. 3A). The use of resources for the synthesis of ribosomal proteins typically reflects the growth rate of the bacteria (Bremer and Dennis 1996; Borkowski et al. 2016). Indeed, we observe a precise linear correlation between the growth rate of the strains and the fraction of ribosomal proteins (Fig. 3B). In E. coli, synthesis of the RNA polymerase is also affected by the growth rate (Bremer and Dennis 1996; Klumpp and Hwa 2008). This does not seem to be the case in B. subtilis, as the fraction of RNA polymerase subunits has remained unaffected in the genome-reduced strains as compared to the reference strain (Fig. 4).
Figure 3.
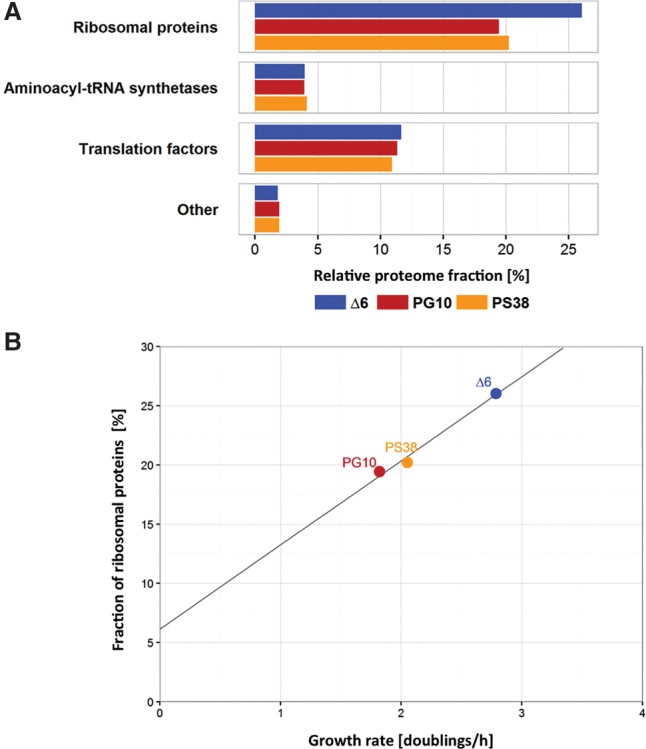
The growth rate of the genome-reduced strains correlates to the synthesis of ribosomal proteins. (A) Relative proteome fractions of the four major groups of genes involved in translation (ribosomal proteins, aminoacyl-tRNA synthetases, translation factors, and other proteins involved in translation) of the three genome-reduced strains Δ6, PG10, and PS38. (B) Fraction of ribosomal proteins as function of the growth rate (doubling times/hour). The proteome fraction and the doubling time show a linear correlation (black line).
Figure 4.
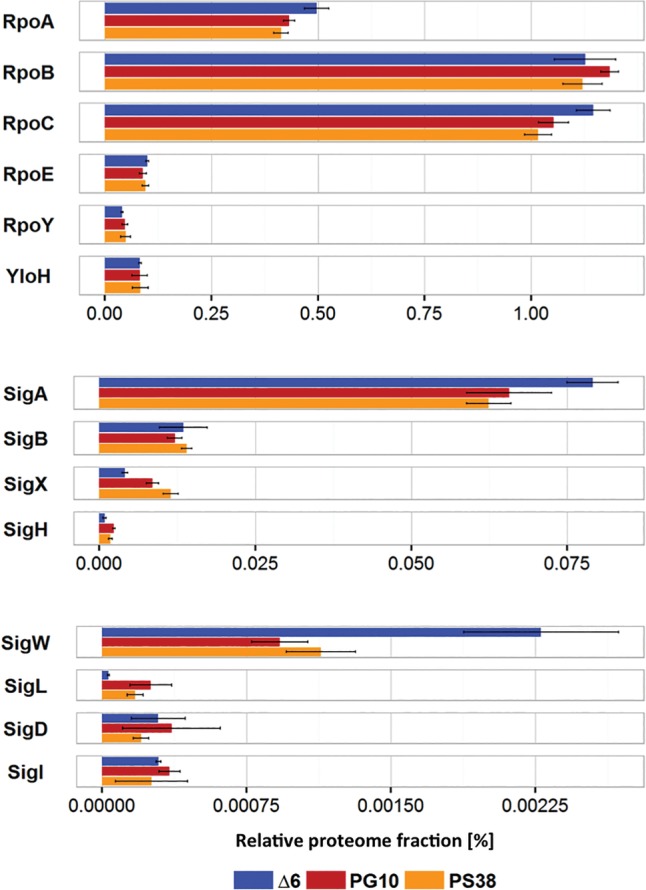
Proteome fractions of genes involved in transcription. Relative proteome fractions of the core RNA polymerase subunits α (RpoA), β (RpoB), β′ (RpoC), δ (RpoE), ε (RpoY), and ω (YloH), as well as for the sigma factors σA (SigA), σB (SigB), σX (SigX), σH (SigH), σW (SigW), σL (SigL), σD (SigD), and σI (SigI) for the genome-reduced strains Δ6, PG10, and PS38. Note that the scales are different for the three panels.
For the transcription apparatus, we have also investigated the relative amounts of the individual proteins. As stated above, we observed no changes of the amounts of the highly expressed core subunits and housekeeping sigma factor of the RNA polymerase (Fig. 4). Among the seven alternative sigma factors identified in the proteome, the membrane stress sigma factor σW showed reduced amounts in the genome-reduced strains, whereas the amounts of σX and σH were slightly increased. Interestingly, the amount of the alternative sigma factor σL was strongly increased in the genome-reduced strains, reflecting the increased sigL transcript levels in both minimized strains. However, RNA polymerase containing this sigma factor alone is not sufficient to initiate transcription, as this particular holoenzyme depends on one of a set of five operon-specific transcription factors (Joly et al. 2012). The expression of several SigL-controlled genes involved in arginine utilization (rocA, rocG) was strongly up-regulated in the genome-reduced strains, suggesting that the increased amount of SigL might be of physiological relevance (Fig. 6, see below).
Figure 6.

A detailed view at arginine and ornithine metabolism reveals drastic changes in PG10. Data obtained for the genome-reduced strains were compared to those for the reference strain Δ6. (Inset) Explanation of the color scheme and the presentation of the different entities.
Effect of genome reduction on metabolism and its regulation
The results of the determination of the intra-cellular and extracellular metabolites are summarized in Supplemental Table S4. The analysis of the metabolite profiles for the central metabolic pathways revealed several important changes in the genome-reduced strains that imply a rerouting of metabolism (for strain PG10, see Fig. 5; for strain PS38, see Supplemental Fig. S1). Importantly, the intracellular concentrations of several glycolytic intermediates were reduced in the genome-reduced strains. This was mirrored by the strongly reduced secretion of pyruvate, the end product of glycolysis, in the genome-reduced strains as compared to the reference strain Δ6 (Supplemental Table S4). Thus, flux through glycolysis is likely to be reduced in the deletion strains. This might be a result of the slightly reduced expression of the ptsGHI and gapA operons and of the pgi gene (Fig. 5).
Figure 5.

Integrated view of relative transcript, protein, and metabolite concentrations in central carbon metabolism. Data obtained for the genome-reduced strain PG10 were compared to those for the reference strain Δ6. (Inset) Explanation of the color scheme and the presentation of the different entities.
In the tricarboxylic acid (TCA) cycle, we observed distinct changes in the mutants. Although the citrate concentration was reduced in both deletion strains, reflecting the reduced pyruvate concentrations, the levels of succinate and malate were increased. In addition to the synthesis of citrate, there are several other entries into the TCA cycle. The organic acids can be taken up directly or they can be produced by the utilization of amino acids such as arginine, glutamate, or aspartate. Indeed, most of the amino acids present in the medium were utilized by the bacteria as indicated by reduced concentrations in the medium after cultivation. The entry of nutrients via the TCA cycle was reflected by the higher expression of two central transcription units that encode the enzymes for the core of the cycle (Meyer et al. 2011). The citZ-icd-mdh operon encoding citrate synthase, isocitrate dehydrogenase and malate dehydrogenase, and the citB gene encoding aconitase as well as the corresponding enzymes showed a strong accumulation in the genome-reduced strains, thus allowing efficient utilization of organic and amino acids via the TCA cycle.
The most striking effect on metabolism was observed for the arginine degradation pathway to glutamate and for glutamate biosynthesis. The genes and enzymes involved in arginine utilization as well as the corresponding metabolites were increased in the genome-reduced strains; in contrast, the genes and enzymes for glutamate biosynthesis were strongly reduced. However, the extent of these alterations was very different for the two analyzed strains. In both genome-reduced strains, the intracellular concentrations of arginine were similar; whereas the concentration of ornithine, an intermediate in arginine degradation was increased 16- and twofold in PG10 and PS38, respectively (Fig. 6). Similarly, the extracellular concentration of urea, which is generated during the conversion of arginine to ornithine, had increased very strongly in PG10, but only mildly in the strain PS38 (Supplemental Table S4). Moreover, we observed a strong increase of the intracellular glutamate level in PG10, but even a slight decrease in PS38.
An analysis of these metabolic patterns and of the underlying changes in gene expression suggests a complex picture. First, the amounts of both the RNA polymerase sigma factor, σL, and the transcription factor RocR, that are together responsible for the expression of arginine degradation genes, are increased in the genome-reduced strains (SigL: 7.1- and 5.1-fold; RocR: 3.9- and 1.6-fold for PG10 and PS38, respectively) (Fig. 4). This may be the reason for the increased expression of the genes encoding the arginine degradative pathway. Expression of the promoter-proximal genes of the transcription units in this pathway is increased 1400-fold, 49-fold, and 70-fold for rocA, rocD, and rocG, respectively, in PG10. The weaker increase of SigL and RocR in the genome-reduced strain PS38 is reflected by a concomitant weaker increase of expression of the arginine utilization genes (100-fold for rocA, smaller increase for rocD and rocG), and thus weaker accumulation of ornithine and glutamate. Second, the acquisition of arginine seems to be increased in both strains, but to a different extent. The concentrations of arginine and ornithine in the medium are very low (0.16 mM and 0.03 mM, respectively, compared to the glutamate concentration of 0.94 mM). The significant accumulation of arginine degradation products suggests a different source. Indeed, B. subtilis uses peptides as a source of nitrogen and amino acids, and expression of the major peptide uptake system OppABCDF is enhanced in both deletion strains (threefold and twofold in PG10 and PS38, respectively). Finally, the strong accumulation of the glutamate dehydrogenase RocG in the genome-reduced strain PG10 and the presence of glutamate in the medium result in the severe (more than 30-fold) repression of the glutamate biosynthetic gltAB operon in this strain. This repression results from the regulatory interaction of RocG with the transcription activator GltC, which leads to inactivation of GltC (Commichau et al. 2007; Stannek et al. 2015), and thus the inability to express the gltAB operon. Therefore, increased levels of a sigma factor, a transcription factor, and the effector molecule ornithine lead to increased expression of the arginine utilization pathway operons and reduced expression of glutamate biosynthetic genes, and increased uptake of oligopeptides may be responsible for the differential regulation of this metabolic pathway in the two genome-reduced strains. The impact of SigL and RocR on the expression of the arginine degradation genes is supported by an extended quasi-equilibrium model (Bintu et al. 2005) for the regulation of the roc genes, which shows that the combined slight changes in SigL, RocR, and ornithine amounts are sufficient to explain the strong up-regulation of rocA and rocG (Supplemental Data S3).
The strong changes in arginine and glutamate metabolism in the genome-reduced strains raise the possibility that these changes are relevant for the growth and physiology of the bacteria. To test this hypothesis, we deleted the rocR gene encoding the transcription factor required for the expression of the arginine utilization genes from the genome of PG10, which exhibited the strongest effect on arginine metabolism. The analysis of growth of PG10 and its isogenic rocR mutant GP2303 revealed that the growth rates were not affected by the rocR deletion (Supplemental Fig. S2). Therefore, we conclude that the strong activity of the arginine degradation pathway is not required for the genome-reduced bacteria.
Discussion
Genome minimization is an important approach to uncover the functions required for cellular life and to develop our understanding of the interactions between those essential components. The recent construction of M. mycoides JCVI-syn3.0 with a genome of only 531 kb was a major breakthrough in the field (Hutchison et al. 2016). However, the functions of ∼30% of the genes of this minimal genome are so far unknown (Danchin and Fang 2016). Moreover, the biology of Mycoplasma species with their lack of a cell wall, altered genetic code, and complex metabolic requirements is rather specific. Therefore, to get a more comprehensive view of minimal bacterial cells, it is of key importance to construct minimal genomes based on a selection of bacteria that represent the different biological concepts with respect to metabolism and cell biology as well as to their ecological niches.
In this study, we present the construction and functional characterization of two B. subtilis strains from which ∼36% of the original genome have been deleted. To the best of our knowledge, this represents the most extensive combined genome deletion for any complex bacterium. However, both strains are viable, and their growth rates are only slightly reduced compared with the reference strain.
The integrated “omics” study performed with these strains provides several important insights with respect to general principles of gene expression and previously unidentified regulatory mechanisms. Moreover, the results set the framework for further steps in genome reduction.
Our study demonstrates how differently each gene contributes to the proteome of the cell, in that the essential genes, which account for only 6% of all genes in the reference strain give rise to 57% of the translational activity. In contrast, the 25% unknown and poorly characterized genes use only 3% of the translation machinery. These results underline the relevance of the essential genes for the quantitatively most important processes in the cell, especially for information processing. Indeed, DNA replication, transcription, and translation require together 47.5% of the resources of the translation apparatus. The unknown genes define the other side of the coin, because although they are large in number, their contribution to global protein synthesis is negligible in complex medium. This observation supports the idea that the unknown genes are poorly expressed since they are involved in highly specific functions and probably not required under standard conditions, thus making only a minor contribution to a final minimal genome, if any. Therefore, a minimal B. subtilis genome may be better comprehensible than a minimal organism based on a Mycoplasma genome. Similar to the unknown genes, those involved in lifestyle selection (e.g., motility, biofilm formation, and genetic competence) and stress adaptation (24% of the genome of the reference strain) contribute little (6%) to global protein synthesis. In the genome-reduced strains, most genes involved in biofilm formation and motility have been deleted as these functions are dispensable for the cell. The conclusion on the rather minor contributions of unknown genes and of genes involved in lifestyle selection and stress adaptation is underlined by the fact that the 28% of the genome of the reference strain that has been deleted in the genome-reduced strains (among them many unknown and lifestyle genes) account for <2.5% of the proteome in the reference strain.
The analysis of changes in the proteome and transcriptome revealed a significant increase concerning proteins involved in the biosynthesis and assembly of iron-sulfur clusters in PS38 as compared to the reference strain and the sister strain PG10. Whereas these proteins require <0.9% of the translational capacity in the two latter strains, this proportion has doubled to 1.82% in PS38. In agreement with this, we also observed increased mRNA levels for the sufCDSUB operon in PS38; however, this increase is rather minor. So far, no regulatory mechanisms have been identified for the sufCDSUB operon. Our findings suggest that such a regulator that acts mainly at the posttranscriptional level has been deleted in PS38, but not in PG10. Further analyses are required to unravel these novel regulatory mechanisms.
The results of this characterization of two divergent, but similar genome-reduced strains provide valuable clues for further steps in the reduction of the B. subtilis genome. First, it seems reasonable to delete those genes with high priority that are strongly overexpressed in the present strains without causing obvious benefits. In particular, this is the case for all members of the MhqR regulon (mhqA, mhqNOP, azoR2) and the paiAB operon. In the genome-reduced strains, the encoded proteins account for >4% of the total protein resource allocation, suggesting that they impose a significant burden on the cell. Moreover, deletion of the sigL gene would result in loss of expression of the arginine/ornithine biosynthetic pathway. Although this pathway is highly expressed and very active in the genome-reduced strains, switching it off by removing the RocR transcription activator does not affect growth of the genome-reduced bacteria.
Another category of genes that can be deleted are those 225 genes that are not expressed in any of the three strains studied here. Such genes (mostly sporulation or stress response genes) are not likely to be required for the growth of the bacteria under the conditions set in this study for the construction of a minimal genome (complex medium with glucose, 37°C).
Taken together, the present study reports the most extensive genome reduction obtained in any complex bacterium so far. Our results emphasize the key relevance of essential genes for the biology of the cell, and they provide important clues for further steps in genome reduction and molecular analysis of B. subtilis.
Methods
Strains, media, and growth conditions
Escherichia coli JM109 (Yanisch-Perron et al. 1985) was used for cloning in plasmid pJOE6743.1 and propagation of the derivatives and DH5α for cloning into pJOE8739.1. E. coli NM538 (Frischauf et al. 1983) was used for plasmid multimerization to enhance B. subtilis transformation efficiency. The genome reduced B. subtilis IIG-Bs20 (Wenzel and Altenbuchner 2015) derived from Δ6 (Westers et al. 2003) formed the starting point of all further chromosomal deletions. The genotypes of the deletion strains B. subtilis IIG-Bs27-47-24, PG10, and PS38 (IIG-Bs27-47-38) are shown in Supplemental Table S1. The rocR mutant strain GP2303 was constructed by transferring a ΔrocR::aphA3 deletion from B. subtilis QB5533 (Calogero et al. 1994) to PG10. All strains were grown in LB liquid or plated on LB agar plates and incubated at 37°C. The media were supplemented with ampicillin (100 µg/mL) or spectinomycin (100 µg/mL), depending on the plasmid marker.
Molecular biology techniques
Standard recombinant DNA techniques were used. E. coli was transformed by the heat-shock method (Chung et al. 1989) and B. subtilis usually by the two-step method (Rahmer et al. 2015). Prior to the introduction of the inducible competence system, Spizizen's minimal medium (Spizizen 1958) was used for transformation. In strains carrying the genes comK and comS under the B. subtilis mannitol promoter PmtlP in addition to the natural comK and comS in the chromosome, competence was induced in LB medium by adding 0.5% mannitol to exponential growing cells for 1.5 h (Rahmer et al. 2015). Oligonucleotides were purchased from Eurofins MWG Operon. Polymerase chain reactions were done with High Fidelity PCR Enzyme Mix with DNA from B. subtilis 168 as template and colony PCRs with DreamTaq DNA polymerase (Thermo Fisher Scientific). DNA sequencing was performed by GATC Biotech.
Deletion formation in B. subtilis Δ6
Deletions in B. subtilis Δ6 were done in a markerless way using a selection/counter-selection strategy as described previously (Wenzel and Altenbuchner 2015). Briefly, two fragments of ∼700 bp are amplified from the upstream and downstream regions of the target sequence, fused to each other, and inserted into the nonreplicative suicide vectors pJOE6743.1 (Wenzel and Altenbuchner 2015) or pJOE8739.1. The latter vector contains the ccdB gene under the E. coli rhamnose promoter. For details of construction of pJOE8739.1, see Supplemental Methods. The sequence has been deposited in GenBank, KY200664. The PCR fragments were inserted into pJOE8739.1 linearized by SmaI using the Gibson assembly protocol as described by the manufacturer (New England Biolabs). Transformants of B. subtilis were selected on LB agar plates with spectinomycin. After integration of the vector into the chromosome via homologous recombination, counter-selection was performed by growing the cells first in LB liquid medium supplemented with 0.5% mannose and then on LB agar plates with mannose. Colonies with the desired deletions were identified by PCR (Wenzel and Altenbuchner 2015).
Characterization of genome-reduced strains
For phenotypic characterization, B. subtilis strains were grown in LB medium supplemented with 0.5% glucose. Membranes were stained with the dye Nile Red, and the samples were observed using an Axio Imager.M2 microscope (Carl Zeiss Microscopy GmbH). Based on the fluorescence signal of stained membranes, the lengths and widths of 200 individual cells per replicate were determined. For details of microscopic analysis, see Supplemental Methods.
For the multi-omics analysis, the bacteria were grown overnight in LB medium supplemented with 0.5% glucose at 37°C. Next day, the cultures were used to inoculate a preculture in LB-Glc. When the precultures had reached an OD600 of 0.5–0.8, they were used to inoculate the main cultures in the same medium (150 mL) to an initial OD600 of 0.05. The cultures were grown at 37°C until an OD600 of 0.5 had been reached. Sample preparation and analytic techniques for metabolite quantification, proteome, and transcriptome analysis are described in Supplemental Methods.
Data access
The mass spectrometry proteomics data from this study have been submitted to the ProteomeXchange Consortium via the PRIDE partner repository (https://www.ebi.ac.uk/pride/archive/) (Vizcaíno et al. 2016) under accession number PXD004565. The transcriptome data from this study have been submitted to the NCBI Gene Expression Omnibus (GEO; http://www.ncbi.nlm.nih.gov/geo/) under accession number GSE82249. The genome sequences from this study have been submitted to GenBank (https://www.ncbi.nlm.nih.gov/genbank/) under accession numbers CP016787, CP016788, and CP016789 for the strains IIG-Bs27-47-24, PG10, and PS38, respectively. The DNA sequence of plasmid pJOE8739.1 has been submitted to GenBank (https://www.ncbi.nlm.nih.gov/genbank/) under accession number KY200664.
Supplementary Material
Acknowledgments
We thank Julia Busse, Sabine Freitag, Adrian Kovač, and Annette Schneck for their expert technical assistance and help with strain construction; and Stephan Michalik and Manuela Gesell Salazar for their help with the R scripts and LC-MS/MS measurements. D.R.R. was supported by the Göttingen Graduate School for Neurosciences, Biophysics, and Molecular Biosciences (GGNB, Deutsche Forschungsgemeinschaft grant GSC226/2).
Author contributions: J.A., U.M., D.R.R., F.M.C., U.V., and J.S. designed the study; D.R.R., J.A., and J.S. designed and constructed the genome-reduced strains; D.R.R., U.M., H.R., T.I., P.K.S., A.T., L.S., I.F., and R.D. performed the multi-omics analysis; C.G., P.N., B.Z., and S.K. performed the bioinformatic analysis and modeling; and D.R.R., J.A., U.M., H.R., T.I., P.K.S., S.K., F.M.C., U.V., and J.S. wrote the paper.
Footnotes
[Supplemental material is available for this article.]
Article published online before print. Article, supplemental material, and publication date are at http://www.genome.org/cgi/doi/10.1101/gr.215293.116.
References
- Antelmann H, Engelmann S, Schmid R, Hecker M. 1996. General and oxidative stress responses in Bacillus subtilis: cloning, expression, and mutation of the alkyl hydroperoxide reductase operon. J Bacteriol 178: 6571–6578. [DOI] [PMC free article] [PubMed] [Google Scholar]
- Ara K, Ozaki K, Nakamura K, Yamane K, Sekiguchi J, Ogasawara N. 2007. Bacillus minimum genome factory: effective utilization of microbial genome information. Biotechnol Appl Biochem 46: 169–178. [DOI] [PubMed] [Google Scholar]
- Bintu L, Buchler NE, Garcia HG, Gerland U, Hwa T, Kondev J, Phillips R. 2005. Transcriptional regulation by the numbers: models. Curr Opin Genet Dev 15: 116–124. [DOI] [PMC free article] [PubMed] [Google Scholar]
- Blain JC, Szostak JW. 2014. Progress towards synthetic cells. Annu Rev Biochem 83: 615–640. [DOI] [PubMed] [Google Scholar]
- Borkowski O, Goelzer A, Schaffer M, Calabre M, Mäder U, Aymerich S, Jules M, Fromion V. 2016. Translation elicits a growth rate-dependent, genome wide, differential protein production in Bacillus subtilis. Mol Syst Biol 12: 870. [DOI] [PMC free article] [PubMed] [Google Scholar]
- Bremer H, Dennis PP. 1996. Modulation of chemical composition and other parameters of the cell by growth rate. In Escherichia coli and Salmonella, 2nd ed. (ed. Neidhardt FC), pp. 1553–1569. ASM Press, Washington, DC. [Google Scholar]
- Bsat N, Chen L, Helman JD. 1996. Mutation of the Bacillus subtilis alkyl hydroperoxide reductase (ahpCF) operon reveals compensatory interactions among hydrogen peroxide stress genes. J Bacteriol 178: 6579–6586. [DOI] [PMC free article] [PubMed] [Google Scholar]
- Calogero S, Gardan R, Glaser P, Schweizer J, Rapoport G, Débarbouillé M. 1994. RocR, a novel regulatory protein controlling arginine utilization in Bacillus subtilis, belongs to the NtrC/NifA family of transcriptional activators. J Bacteriol 176: 1234–1241. [DOI] [PMC free article] [PubMed] [Google Scholar]
- Choe D, Cho S, Kim SC, Cho BK. 2016. Minimal genome: worthwhile or worthless efforts toward being smaller? Biotech J 11: 199–211. [DOI] [PubMed] [Google Scholar]
- Chung CT, Niemela SL, Miller RH. 1989. One-step preparation of competent Escherichia coli: transformation and storage of bacterial cells in the same solution. Proc Natl Acad Sci 86: 2172–2175. [DOI] [PMC free article] [PubMed] [Google Scholar]
- Commichau FM, Herzberg C, Tripal P, Valerius O, Stülke J. 2007. A regulatory protein–protein interaction governs glutamate biosynthesis in Bacillus subtilis: The glutamate dehydrogenase RocG moonlights in controlling the transcription factor GltC. Mol Microbiol 65: 642–654. [DOI] [PubMed] [Google Scholar]
- Commichau FM, Pietack N, Stülke J. 2013. Essential genes in Bacillus subtilis: a re-evaluation after ten years. Mol Biosyst 9: 1068–1075. [DOI] [PubMed] [Google Scholar]
- Danchin A, Fang G. 2016. Unknown unknowns: essential genes in quest for a function. Microb Biotechnol 9: 530–540. [DOI] [PMC free article] [PubMed] [Google Scholar]
- Durand-Dubief M, Persson J, Norman U, Hartsuiker E, Ekwall K. 2010. Topoisomerase I regulates open chromatin and controls gene expression in vivo. EMBO J 29: 2126–2134. [DOI] [PMC free article] [PubMed] [Google Scholar]
- Ferrándiz MJ, Martín-Galiano AJ, Arnanz C, Camacho-Soguero I, Tirado-Vélez JM, de la Campa AG. 2016. An increase in negative supercoiling in bacteria reveals topology-reacting gene clusters and a homeostatic response mediated by the DNA topoisomerase I gene. Nucleic Acids Res 44: 7292–7303. [DOI] [PMC free article] [PubMed] [Google Scholar]
- Frischauf AM, Lehrach H, Poustka A, Murray N. 1983. Λ Replacement vectors carrying polylinker sequences. J Mol Biol 170: 827–842. [DOI] [PubMed] [Google Scholar]
- Gerdes S, Scholle M, Campbell J, Balázsi G, Ravasz E, Daugherty MD, Somera AL, Kyrpides NC, Anderson I, Gelfand MS, et al. 2003. Experimental determination and system level analysis of essential genes in Escherichia coli MG1655. J Bacteriol 185: 5673–5684. [DOI] [PMC free article] [PubMed] [Google Scholar]
- Gibson DG, Glass JI, Lartigue C, Noskov VN, Chuang RY, Algire MA, Benders GA, Montague MG, Ma L, Moodie MM, et al. 2010. Creation of a bacterial cell controlled by a chemically synthesized genome. Science 329: 52–56. [DOI] [PubMed] [Google Scholar]
- Hatfield GW, Benham CJ. 2002. DNA topology-mediated control of global gene expression in Escherichia coli. Annu Rev Genet 36: 175–203. [DOI] [PubMed] [Google Scholar]
- Hirokawa Y, Kawano H, Tanaka-Masuda K, Nakamura N, Nakagawa A, Ito M, Mori H, Oshima T, Ogasawara N. 2013. Genetic manipulations restored the growth fitness of reduced-genome Escherichia coli. J Biosci Bioeng 116: 52–58. [DOI] [PubMed] [Google Scholar]
- Hui S, Silverman JM, Chen SS, Erickson DW, Basan M, Wang J, Hwa T, Williamson JR. 2015. Quantitative proteomic analysis reveals a simple strategy of global resource allocation in bacteria. Mol Syst Biol 11: 784. [DOI] [PMC free article] [PubMed] [Google Scholar]
- Hutchison CA, Chuang RY, Noskov VN, Assad-Garcia N, Deerinck TJ, Ellisman MH, Gill J, Kannan K, Karas BJ, Ma L, et al. 2016. Design and synthesis of a minimal bacterium. Science 351: aad6253. [DOI] [PubMed] [Google Scholar]
- Joly N, Zhang N, Buck M, Zhang X. 2012. Coupling AAA protein function to regulated gene expression. Biochim Biophys Acta 1823: 108–116. [DOI] [PubMed] [Google Scholar]
- Juhas M, Reuß DR, Zhu B, Commichau FM. 2014. Bacillus subtilis and Escherichia coli essential genes and minimal cell factories after one decade of genome engineering. Microbiology 160: 2341–2351. [DOI] [PubMed] [Google Scholar]
- Klumpp S, Hwa T. 2008. Growth-rate-dependent partitioning of RNA polymerases in bacteria. Proc Natl Acad Sci 105: 20245–20250. [DOI] [PMC free article] [PubMed] [Google Scholar]
- Kobayashi K, Ehrlich S, Albertini A, Amati G, Andersen KK, Arnaud M, Asai K, Ashikaga S, Aymerich S, Bessières P, et al. 2003. Essential Bacillus subtilis genes. Proc Natl Acad Sci 100: 4678–4683. [DOI] [PMC free article] [PubMed] [Google Scholar]
- Komatsu M, Uchiyama T, Omura S, Cane DE, Ikeda H. 2010. Genome-minimized Streptomyces host for the heterologous expression of secondary metabolism. Proc Natl Acad Sci 107: 2646–2651. [DOI] [PMC free article] [PubMed] [Google Scholar]
- Lam CM, Diez MS, Godinho M, Martins dos Santos VA. 2012. Programmable bacterial catalysis – designing cells for biosynthesis of value-added compounds. FEBS Lett 585: 2184–2190. [DOI] [PubMed] [Google Scholar]
- Leprice A, de Lorenzo V, Völler P, van Passel MW, Martins dos Santos VA. 2012. Random and cyclical deletion of large DNA segments in the genome of Pseudomonas putida. Environ Microbiol 14: 1444–1453. [DOI] [PMC free article] [PubMed] [Google Scholar]
- Martínez-Garcia E, de Lorenzo V. 2016. The quest for the minimal bacterial genome. Curr Opin Biotechnol 42: 216–224. [DOI] [PubMed] [Google Scholar]
- Meyer FM, Gerwig J, Hammer E, Herzberg C, Commichau FM, Völker U, Stülke J. 2011. Physical interactions between tricarboxylic acid cycle enzymes in Bacillus subtilis: evidence for a metabolon. Metab Eng 13: 18–27. [DOI] [PubMed] [Google Scholar]
- Michna RH, Zhu B, Mäder U, Stülke J. 2016. SubtiWiki 2.0—an integrated database for the model organism Bacillus subtilis. Nucleic Acids Res 44: D654–D662. [DOI] [PMC free article] [PubMed] [Google Scholar]
- Nicolas P, Mäder U, Dervyn E, Rochat T, Leduc A, Pigeonneau N, Bidnenko E, Marchadier E, Hoebeke M, Aymerich S, et al. 2012. Condition-dependent transcriptome reveals high-level regulatory architecture in Bacillus subtilis. Science 335: 1103–1106. [DOI] [PubMed] [Google Scholar]
- Rahmer R, Heravi KM, Altenbuchner J. 2015. Construction of a super-competent Bacillus subtilis 168 using the PmtlA-comKS inducible cassette. Front Microbiol 6: 1431. [DOI] [PMC free article] [PubMed] [Google Scholar]
- Reuß DR, Commichau FM, Gundlach J, Zhu B, Stülke J. 2016a. The blueprint of a minimal cell: MiniBacillus. Microbiol Mol Biol Rev 80: 955–987. [DOI] [PMC free article] [PubMed] [Google Scholar]
- Reuß DR, Thürmer A, Daniel R, Quax WJ, Stülke J. 2016b. Complete genome sequence of Bacillus subtilis subsp. subtilis strain Δ6. Genome Announc 4: e00759-16. [DOI] [PMC free article] [PubMed] [Google Scholar]
- Spizizen J. 1958. Transformation of biochemically deficient strains of Bacillus subtilis by deoxyribonucleate. Proc Natl Acad Sci 44: 1072–1078. [DOI] [PMC free article] [PubMed] [Google Scholar]
- Stannek L, Thiele MJ, Ischebeck T, Gunka K, Hammer E, Völker U, Commichau FM. 2015. Evidence for synergistic control of glutamate biosynthesis by glutamate dehydrogenases and glutamate in Bacillus subtilis. Environ Microbiol 17: 3379–3390. [DOI] [PubMed] [Google Scholar]
- Tanaka K, Henry CS, Zinner JF, Jolivet E, Cohoon MP, Xia F, Bidnenko V, Ehrlich SD, Stevens RL, Noirot P. 2013. Building the repertoire of dispensable chromosome regions in Bacillus subtilis entails major refinement of cognate large-scale metabolic model. Nucleic Acids Res 41: 687–699. [DOI] [PMC free article] [PubMed] [Google Scholar]
- Trinh CT, Unrean P, Srienc F. 2008. Minimal Escherichia coli cell for the most efficient production of ethanol from hexoses and pentoses. Appl Environ Microbiol 74: 3634–3643. [DOI] [PMC free article] [PubMed] [Google Scholar]
- Vizcaíno JA, Csordas A, del-Toro N, Dianes JA, Griss J, Lavidas I, Mayer G, Perez-Riverol Y, Reisinger F, Ternent T, et al. 2016. 2016 update of the PRIDE database and related tools. Nucleic Acids Res 44: D447–D456. [DOI] [PMC free article] [PubMed] [Google Scholar]
- Vos SM, Tretter EM, Schmidt BH, Berger JM. 2011. All tangled up: how cells direct, manage and exploit topoisomerase function. Nat Rev Mol Cell Biol 12: 827–841. [DOI] [PMC free article] [PubMed] [Google Scholar]
- Wenzel M, Altenbuchner J. 2015. Development of a markerless gene deletion system for Bacillus subtilis based on the mannose phophoenolpyruvate-dependent phosphotransferase system. Microbiology 161: 1942–1949. [DOI] [PubMed] [Google Scholar]
- Westers H, Dorenbos R, van Dijl JM, Kabel J, Flanagan T, Devine KM, Jude F, Séror SJ, Beekman AC, Darmon E, et al. 2003. Genome engineering reveals large dispensable regions in Bacillus subtilis. Mol Biol Evol 20: 2076–2090. [DOI] [PubMed] [Google Scholar]
- Xavier JC, Patil KR, Rocha I. 2014. Systems biology perspectives on minimal and simpler cells. Microbiol Mol Biol Rev 78: 487–509. [DOI] [PMC free article] [PubMed] [Google Scholar]
- Yanisch-Perron C, Vieira J, Messing J. 1985. Improved M13 phage cloning vectors and host strains: nucleotide sequences of the M13mp18 and pUC19 vectors. Gene 33: 103–119. [DOI] [PubMed] [Google Scholar]
Associated Data
This section collects any data citations, data availability statements, or supplementary materials included in this article.