Abstract
The interaction of a small library of cyclic DKP–RGD peptidomimetics with α5β1 integrin has been investigated by means of an integrated experimental and computational approach. Bioaffinity NMR techniques, including saturation transfer difference (STD) and transferred NOESY, were applied to the ligands in a suspension of intact MDA‐MB‐231 breast cancer cells, in which integrin α5β1 is highly expressed. The NMR data were compared with the docking calculations of the RGD ligands in the crystal structure of the α5β1 binding site, and were integrated with competitive binding assays to the purified α5β1 integrin. Ligand binding epitopes involve protons of both the RGD moiety and the DKP scaffold, although the stereochemistry and the functionalization of the DKP scaffold as well as the macrocycle conformation determine a great variability in the interaction. The ligand showing the highest number of STD signals is also the most potent α5β1 ligand of the series, displaying a nanomolar IC 50 value.
Keywords: integrins, ligand–protein interactions, molecular docking, RGD peptidomimetics, NMR spectroscopy
1. Introduction
Integrins are a family of heterodimeric cell surface receptors that mediate cell–extracellular matrix and cell–cell interactions.1 Integrin‐mediated adhesion is critical in multiple phases of development and maintenance of tissue physiology. Conversely, aberrant integrin function that can arise because of inappropriate levels of activation is implicated in many diseases, including cancer, thrombosis, and immune system disorders.2 In particular, recent studies provide evidence of the importance of pairs and wider combinations of RGD‐binding integrins in angiogenesis and cancer, and suggest the development of dual and multi‐integrin antagonists to efficiently target these processes.3 Among tumor‐associated integrins from the RGD‐binding subfamily, α5β1 along with αVβ3 and other αV integrins are highly expressed on a wide range of tumors and surrounding vasculature, where they are correlated with disease progression and poor prognosis. These integrins recognize the RGD sequence in endogenous ligands (e.g. fibronectin, vitronectin) across their extracellular α/β subunit interface containing the metal‐ion‐dependent adhesion site (MIDAS).4 The context of the ligand RGD sequence (flanking residues, three dimensional presentation) and different features of the integrin binding pocket determine the recognition specificity.5
The most used strategy to inhibit integrin function consists of blocking endogenous ligand binding by small‐molecule integrin antagonists designed around the epitope of the natural ligands: the RGD motif. Unfortunately, linear RGD‐containing peptides suffer from low affinity and specificity, as one factor that affects integrin affinity and specificity for RGD ligands is a well‐defined conformation of the ligand. This drawback has been circumvented by the use of cyclic peptidic and peptidomimetic ligands, and a large number of such ligands have been developed that target tumor‐associated integrin heterodimers with high affinity and specificity and show potential as both antitumor and anti‐angiogenic agents.3, 5, 6 Among them, the cyclic pentapeptide cyclo[RGDf(N‐Me)V] 1 a (developed by Kessler and known as Cilengitide, Figure 1) has recently failed a Phase III clinical trial for the treatment of glioblastoma and is currently undergoing other Phase II clinical trials for the treatment of several cancer types, administered either alone or in combination with other therapeutic agents.5, 7
Figure 1.
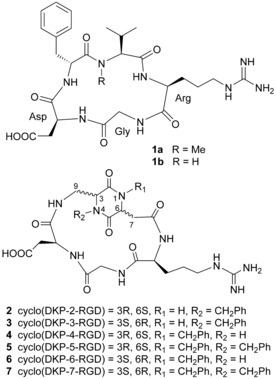
Cyclic pentapeptides 1 a and 1 b and cyclic RGD peptidomimetics 2–7 containing DKP scaffolds.
In this context, we have recently reported a small library of cyclic RGD peptidomimetic integrin ligands, containing diketopiperazine (DKP) scaffolds, as dipeptide mimics capable of controlling the conformation of the tripeptide recognition motif, as well as differing in the configuration of the two DKP stereocenters and in the substitution at the DKP nitrogen atoms.8 In particular, the RGD peptidomimetics 2–7 (Figure 1) derived from trans‐DKP scaffolds (DKP2‐DKP7) inhibited the binding of biotinylated vitronectin to αVβ3 integrin with low nanomolar IC 50 values. The molecular basis of this activity was rationalized in terms of preferred ligand conformations featuring an extended arrangement of the RGD sequence, which are highly pre‐organized for the interaction with integrin αVβ3, as demonstrated by docking studies and NMR experiments with αVβ3‐rich bladder cancer cells.9
Prompted by these results and by the perspective of targeting two key players in angiogenesis and cancer in the RGD‐binding integrin subfamily, we planned to investigate the interaction of our cyclic RGD peptidomimetics with α5β1 integrin by exploiting the same integrated computational and experimental approach applied in the study of αVβ3 integrin.
Recently reported X‐ray structures of different α5β1 integrin headpiece fragments, both in the absence and presence of linear or cyclic RGD ligands, provide an important starting point for developing an understanding of the interaction with small‐molecule ligands.10 Despite some differences in the overall α5β1 headpiece structure, the cyclic peptide RGD moiety adopted a bound extended conformation very similar to the linear RGD peptides and to the cyclic pentapeptide 1 a (Cilengitide)‐bound to αVβ3 integrin.11 Indeed, the X‐ray structures of αVβ3 and α5β1 complexed with RGD ligands reveal an identical atomic basis for the interaction: RGD binds at the junction of the α and β subunits, the Arg residue fitting into a cleft in the α subunit, and the Asp coordinating a cation in the β subunit. In particular, the RGD tripeptide adopts a highly extended conformation (displaying a distance of about 9 Å between the Cβ atoms of Asp and Arg) across the αVβ3 and α5β1 integrin subunit interface with the carboxylic and guanidine groups acting as an electrostatic clamp, respectively, on a positively charged metal ion of the β subunit (MIDAS) and on several α subunit specific acid residues.
The properties of integrins embedded into cell membranes differ from those of purified receptors, so a pure in vitro or in silico system may not fully recapitulate the complexity of integrin‐mediated recognition. In this regard, NMR spectroscopy is a powerful tool for the study of small molecule–biomolecule complexes.12 In addition, bioaffinity NMR experiments can be conducted on small ligands directly in the presence of intact cells, allowing for a detailed investigation into the binding process very close to physiological conditions.9, 13
Accordingly, to identify the molecular details of the interaction of our cyclic RGD peptidomimetics with α5β1 integrin, we applied bioaffinity NMR techniques, including saturation transfer difference (STD) and transferred NOESY (tr‐NOESY), to ligands in a suspension of MDA‐MB‐231 breast cancer cells, in which integrin α5β1 is highly expressed. The NMR data were integrated with the docking calculations of the RGD ligands in the crystal structure of the α5β1 binding site, thus affording an improved understanding of ligand–integrin interactions. Herein, we report a full account of our investigations that have been completed with competitive binding assays to the purified α5β1 receptor.
2. Results and Discussion
2.1. Integrin Receptor Competitive Binding Assays
The cyclic RGD peptidomimetics 2–7 were examined in vitro for their ability to compete with biotinylated fibronectin for binding to the purified α5β1 receptor. Screening assays were performed by incubating the immobilized integrin receptor with various concentrations (10−12–10−4 m) of the RGD ligands in the presence of biotinylated fibronectin (1 μgml −1), and measuring the bound fibronectin in the presence of the competitive ligands. The ability of the peptidomimetics 2–7 to inhibit the binding of biotinylated fibronectin to α5β1 integrin (expressed as the ligand concentration required for 50 % inhibition) was compared with that of reference compounds 1 a (Cilengitide) and 1 b [cyclo(RGDfV), Figure 1] and with the corresponding IC 50 value found for inhibition of biotinylated vitronectin binding to αvβ3 integrin (Table 1).
Table 1.
Inhibition of biotinylated fibronectin binding to α5β1 integrin compared with inhibition of biotinylated vitronectin binding to αvβ3.
| Compound | IC 50 [nM][a] α5β1 | IC 50 [nM][b] αvβ3 | IC 50 [α5β1]/IC 50 (αvβ3) |
|---|---|---|---|
| 2 | 1647±871 | 3.2±2.7 | 515 |
| 3 | 532±35 | 4.5±1.1 | 118 |
| 4 | 314±1.4 | 7.6±4.3 | 41 |
| 5 | 1217±157 | 12.2±5.0 | 100 |
| 6 | 73.3±3.7 | 2.1±0.6 | 35 |
| 7 | 25.7±6.2 | 0.2±0.09 | 128 |
| 1 a | 14.4±3.1 | 0.6±0.1 | 24 |
| 1 b | 166±28 | 3.2±1.3 | 52 |
[a] IC 50 values were calculated as the concentration of compound required for 50 % inhibition of biotinylated fibronectin binding as estimated by GraphPad Prism software; all values are the arithmetic mean±SD of triplicate determinations. [b] Calculated as the concentration of compound required for 50 % inhibition of biotinylated vitronectin binding. See Ref. 7a for 1 a and Ref. 8c for 1 b and 2–7.
All of the ligands showed binding affinities for α5β1 lower than those for αvβ3, displaying a selectivity ratio (IC 50 α5β1/IC 50 αvβ3) ranging from about 35 (compound 6) to approximately 500 (compound 2). The reference compounds 1 a and 1 b confirmed this trend, exhibiting binding affinities for α5β1 about 25–50 times lower than those for αvβ3. One potential explanation for this behavior (vide infra) might be the differences between the binding sites of the two receptor subtypes that can weaken the electrostatic clamp and other specific interactions. Among the peptidomimetics tested, compound 7 showed the highest affinity toward α5β1 integrin, inhibiting the binding of biotinylated fibronectin to α5β1 with an IC 50 value of 25.7 nm. Interestingly, this ligand was also the most potent αvβ3 ligand of the series, displaying a sub‐nanomolar IC 50 value. Compared to the corresponding αvβ3 binding affinities, the α5β1 IC 50 values showed a more pronounced dependence on the structure of the DKP scaffold, ranging from nanomolar to micromolar concentrations.
2.2. Docking Models of α5β1 Integrin
Computational models for the interaction of RGD peptidomimetic ligands 2–7 with the α5β1 integrin were built by means of docking calculations using the Glide program (version 5.7) of the Schrodinger suite.14 Two models were developed (see the Experimental Section for details), one starting from the X‐ray structure of a five‐domain α5β1 headpiece fragment bound to the allosteric anti‐β1 inhibitory antibody SG/19 and in complex with a linear RGD peptide (3VI4.pdb),10b and the other one using the most recent high‐resolution crystal structure of a four‐domain α5β1 headpiece fragment in complex with the disulfide‐bonded cyclic peptide ACRGDGWCG (4WK4.pdb).10a As noted by the authors of Ref. 10a, the overall α5β1 headpiece structure is very similar in both complexes and approximated to an integrin state that is intermediate between closed (low affinity) and open (high affinity). Moreover, the cyclic peptide RGD moiety adopts a bound conformation and a binding mode very similar to those of the linear RGD peptide. In both X‐ray complexes, the RGD motif binds at the junction of the α5 and β1 subunits, adopting a highly extended conformation across the integrin subunit interface. The Arg and Asp side chains extend in opposite directions, acting as an electrostatic clamp and interacting with the negatively charged Asp227 side chain of α5 subunit and the β1 MIDAS cation, respectively. Further stabilizing hydrogen bonds occur between the ligand Arg guanidine group and α5 Gln221 side chain, the ligand Asp carboxylic group and β1 Asn224, Tyr133 backbone amide and Ser132 side chain, and between the ligand Asp backbone amide and the backbone carbonyl of β1 Leu225. In addition, the cyclic peptide Trp side chain forms a T‐shaped interaction with the α5 Trp157 side chain.
Although the RGD binding mode found in α5β1 integrin recapitulates the RGD interaction with β3 integrins, differences between α5β1 and αVβ3 integrin binding pockets can affect the ligand recognition, as shown by competitive binding assays (Table 1). For instance, the mutation of αV Asp150 into α5 Ala159 produces a less acidic region, whereas the mutation of Arg214 and Arg216 (β3) into the hydrophobic residues Gly223 and Leu225 (β1) both expands the site and reduces the polar character of the region. Owing to the different physicochemical features of binding sites, the ligands could interact less strongly with α5β1 and reveal a greater mobility within this receptor site compared to αVβ3.
In all of the calculations, the X‐ray binding mode of the RGD motif with the α5β1 integrin was taken as a reference model for the analysis of the docking results in terms of ligand–protein interactions (see Figure S1). According to the similarity between the crystal structures of α5β1 (3VI4 and 4WK4), comparable results for the docking of ligands 2–7 in the two α5β1 integrin models were obtained.
2.3. NMR Analysis
The molecular details of the interaction between our cyclic RGD peptidomimetics and α5β1 integrin were investigated by applying bioaffinity NMR techniques to the ligands in a suspension of intact MDA‐MB‐231 breast cancer cells, in which the integrin α5β1 is highly expressed (α5β1/αVβ3 expression ratio=7.1, ratio of mean fluorescence intensity determined by flow cytometry).15
The NMR analysis of the interaction was performed by saturation transfer difference (STD) and transferred NOESY (tr‐NOESY) that focus on the NMR signals of the ligand and utilize NOE effects between the protein and the ligand. In particular, STD experiments permitted the identification of the epitope, pinpointing the interaction between parts of each ligand and the receptor, whereas tr‐NOESY data provided information on the bioactive conformation.
The conformation of ligands 2–7 in the presence of intact MDA‐MB‐231 cells was detected by tr‐NOESY experiments performed at 283 K in non‐deuterated phosphate buffer at pH 7.2. Under these experimental conditions, compounds 3, 4, 5, and 7 confirmed the free‐state conformational behavior (summarized in the Supporting Information),8c displaying NOE contacts in the bound state very similar to those in the free state. In particular, ligands 3 and 5 show, in the respective tr‐NOESY spectra, a cross peak between NHArg−NHGly, which is indicative of a pseudo‐β‐turn motif at DKP–Arg stabilized by a hydrogen bond between NHGly and C(5)=O (referred to as a type III H‐bonding pattern,16 Figure 2).
Figure 2.
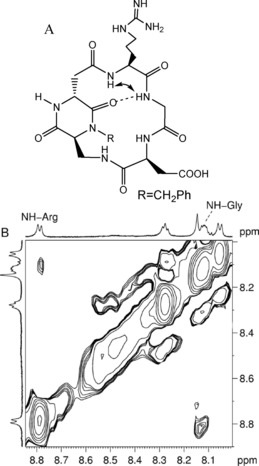
A) Type III H‐bonding pattern (pseudo‐β‐turn at DKP–Arg) proposed for compound 3 on the basis of spectroscopic data. The arrow indicates the NHArg−NHGly NOE contact and the dotted line represents the intramolecular hydrogen bond. B) tr‐NOESY spectrum (NH region) of compound 3 in MDA‐MB‐231 cancer cell suspension. The cross peaks are relative to the NHArg−NHGly interaction.
Also, the conformation of ligand 2 in the presence of the cell suspension can be re‐conducted to the type III geometry observed in the free state, although the significant NOE contact is absent in the tr‐NOESY spectrum. Indeed, the similarity of all other NOE contacts in the free and bound state does not suggest significant differences between the corresponding conformations.
Conversely, ligands 4, 6, and 7 were shown in the free state to adopt a conformation characterized by a β‐turn motif at Gly–Asp stabilized by a hydrogen bond between DKP−NH10 and Arg−C=O (referred to as a type I H‐bonding pattern, Figure 3),16 and by the NH10−NHAsp NOE contact (at least in compounds 6 and 7). Their tr‐NOESY spectra revealed high similarity to the free‐state spectra, confirming the presence of the type I conformation in the interaction with α5β1 integrin. Interestingly, only the cross peak NH10−NHAsp is evident in the tr‐NOESY spectrum of compound 6 (Figure 3), suggesting the selection of the type I conformation in the bound state between the two main geometries detected in the free state (described in the Supporting Information).8c Remarkably, the ligands adopting the type I conformation in the bound state (compounds 4, 6 and 7) showed the best binding affinities to the α5β1 receptor among the cyclic RGD peptidomimetics (lowest IC 50 values in Table 1).
Figure 3.
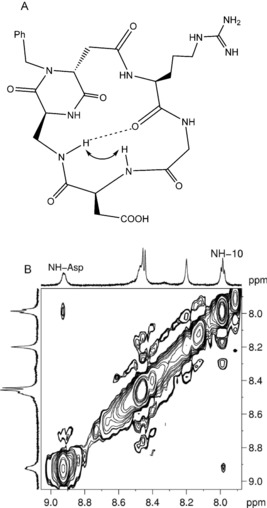
A) Type I H‐bonding pattern (β‐turn at Gly–Asp) proposed for compound 6 on the basis of spectroscopic data. The arrow indicates the NH10−NHAsp NOE contact and the dotted line represents the intramolecular hydrogen bond. B) tr‐NOESY spectrum (NH region) of compound 6 in MDA‐MB‐231 cancer cell suspension. The cross peak is relative to the NH10−NHAsp interaction.
To provide information, at atomic level, on the ligand interactions with protein residues, one‐dimensional STD experiments of the compounds 2–7 in the presence of MDA‐MB‐231 cell suspension were performed. As control experiments, the STD spectra of a RGD ligand without cells and of a non‐RGD compound (e.g. mannose) in the presence of cells were recorded. In both cases, no signals were observed. The protons of compounds 2–7, which exhibit a signal in the STD spectra and hence interact with the integrin receptor site, are marked with a full circle in Figure 4.
Figure 4.
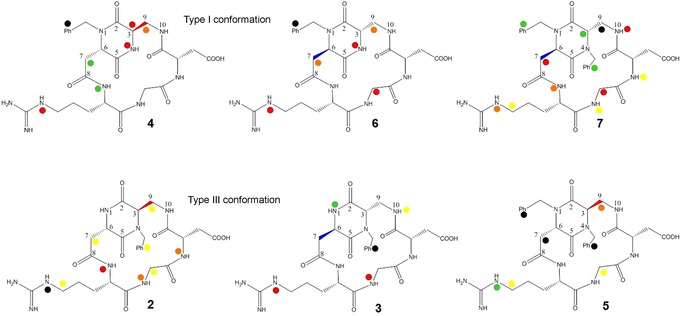
Relative STD % values, grouped in five intensity ranges for ligands 2–7 interacting with MDA‐MB‐231 cells (black=100 %, green>70 %, 50<red<70 %, 30<orange<50 %, yellow<30 %).
This scheme highlights how all compounds have points of contact with the α5β1 receptor. Transfer signals generally require a distance from the receptor of less than 5 Å, and the smaller the distance compared with other residues in the ligand, the stronger the transfer signal. Therefore, the degree of saturation of individual ligand protons (expressed as absolute‐STD percent) reflects their proximity to the target surface. The absolute STD values of all ligands (see Table S7 of the Supporting Information) can be compared by considering the similar nature of the compounds, the equivalence in concentration and in the ratio ligand to protein of the samples. To facilitate the interpretation of NMR data, absolute STD percent values are transformed into relative STD % values (see Table S7) for each molecule on the basis of the strongest signal. The relative STD % are grouped into five intensity ranges, as shown in Figure 4 (black=100 %, green>70 %, 50<red<70 %, 30<orange<50 %, yellow<30 %).
A first analysis of the STD data indicates the great variability of the interactions: each ligand binds the receptor site with a different epitope. Indeed, the STD spectra of ligands 2–7 in the presence of cells differ for the number and intensity of the signals and for the type of protons involved in the interaction. This behavior underlines how the ligand stereochemistry and functionalization at the DKP nitrogen atoms are decisive in the formation of the ligand–protein complex. The CH2–benzylic protons and DKP–H6 are not evaluated, because their chemical shifts are very close to the water signal.
However, all of the ligands share some common binding features: the aromatic and the guanidinic protons are in contact with the receptor, although with different STD percentages. Overall, within the RGD motif, the arginine residue displays a higher transfer signal than the aspartate residue, presumably because the aspartate interaction with the receptor is mediated by the coordination to a metal cation and, thus, compared with arginine, the aspartate protons could be more distant from the integrin. The STD NMR data were interpreted with the aid of docking calculations in the crystal structure of the α5β1 binding site and an integrated discussion is reported below for each ligand.
2.4. Ligands Adopting the Type I Bound Conformation
The STD spectrum of ligand 7 in the presence of MDA‐MB‐231 cell suspension is shown in Figure 5.
Figure 5.
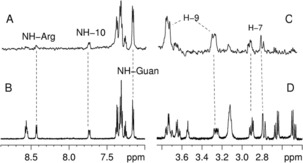
NMR spectra of compound 7. A) Low field and C) high field significant regions of the STD–NMR spectrum. B–D) The same regions of the 1H NMR spectrum.
With respect to the other library compounds, this ligand shows the highest number of protons involved in the interaction with an intensity greater than 50 % of relative STD. The largest STD effects (greater than 70 % of relative STD) are observed for DKP–H9, DKP–H3 (protons of the scaffold) and the protons of the two aromatic groups (Figure 4, black and green balls). Other protons appear in the spectrum with a relative STD between 50 and 70 %: DKP–H7, NH10, and HαGly (Figure 4, red balls). Additionally, the signals of NHGly and NHAsp overlap and it is difficult to assess their involvement in the binding process. Overall, the interaction of 7 with the receptor site is strong and involves protons of both the RGD moiety and the DKP scaffold. Indeed, this compound appears to be the most potent ligand of the series by effectively inhibiting the binding of biotinylated fibronectin to the isolated α5β1 integrin at nanomolar concentration (IC 50=25.7±6.2 nm). Docking calculations starting from the type I bound conformation of compound 7 produced top‐ranked binding modes, conserving all the key interactions described for the RGD peptides in the X‐ray complexes (Figure 6 a).
Figure 6.
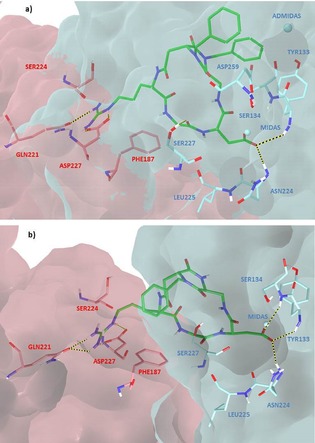
Docking best poses of a) compound 7 (green) and b) compound 6 (green) in the crystal structure of the extracellular domain of α5β1 integrin (α5 subunit pink, β1 subunit cyan, model from 3VI4.pdb). Only selected integrin residues involved in interactions with the ligand are shown. Non polar hydrogens are hidden for clarity, whereas intermolecular hydrogen bonds are shown as dashed lines.
In addition to the interactions of ligand guanidinium group with α5 Asp227 (side‐on) and Gln221 (head‐on) side chains, and to the interactions of ligand carboxylate moiety with MIDAS and β1 Asn224, Tyr133, Ser134 backbone amides, further stabilizing H bonds occur between the ligand Asp backbone amide and the carbonyl of β1 Leu225, and between the ligand Gly backbone carbonyl and the β1 Ser227 side chain. Moreover, in agreement with the STD data, the two benzyl groups are in contact with β1 subunit residues, one interacting with the aromatic side chain of Tyr133 and the other one pointing towards ADMIDAS ion and some surrounding residues (Ser134, Asp259, Ala342), and the protons DKP–H3 and DKP–H9 of the scaffold are close to the β1 Ser134 residue.
Compounds 4 and 6 feature the same benzyl substitution at the endocyclic nitrogen N‐1 of the scaffold and the opposite configuration of the two DKP stereocenters (see Figure 4). Accordingly, the two side arms of the diketopiperazine scaffold show a different stereochemical orientation that could affect the interaction of the ligands with the α5β1 receptor site. In fact, even though, for both ligands, the largest STD effect involves the aromatic protons (100 % relative STD), the STD spectra of 4 and 6 show some differences in intensity and assignment of the signals. Similarly to ligand 7, the STD spectrum of compound 6 includes protons belonging to both the scaffold and the RGD moiety: NH4, DKP–H9, HαGly, and the guanidine NH protons show comparable and notable STD intensities (48–63 % relative STD, see Table S7 of the Supporting Information) and, consequently, as the aromatic protons, can be considered lying close to the protein surface. This analysis nicely agrees with the ability of ligand 6 to inhibit the binding of biotinylated fibronectin to the isolated α5β1 integrin at nanomolar concentration (IC 50=73.3±3.7 nm). In agreement with the STD data and similarly to compound 7, docking calculations show that compound 6 binds to the α5β1 receptor with the Asp carboxylate group coordinating the metal ion at the MIDAS and interacting with β1 Asn224, Tyr133, Ser134 backbone amides, and the Arg guanidinium moiety establishing a bidentate salt bridge with α5 Asp227 and a H bond with α5 Gln221 (Figure 6 b). Moreover, the benzyl moiety is in proximity to β1 Ser227 and α5 Ser224, confirming the importance of the interaction of the aromatic group with the integrin binding pocket, whereas HαGly is in contact with the α5 Phe187 side chain, and protons NH4 and DKP–H9 of the scaffold are close to the β1 Ser134 residue. It is worth noting that, compared to ligand 7, compound 6 orientates the scaffold and the aromatic ring toward a different region of the receptor site (Figure 6). This binding mode affects the interaction of the whole ligand with the receptor and, as a consequence, could explain the lack of STD signals for some protons.
The STD spectrum of compound 4 includes protons belonging to the DKP scaffold, the benzyl group, and the Arg residue, suggesting the close proximity of these moieties to the integrin surface. Compared to 6, we observe a significant enhancement of STD intensity for DKP–H7, the appearance of important signals for DKP–H3 and NHArg, and the disappearance of the HαGly contact. Docking calculations show that compound 4 can fit into the α5β1 receptor pocket with different energetically favorable orientations, mainly differing in the position of the aromatic group and, consequently, of the DKP scaffold and the cyclic peptide backbone (see Figure S5). The mobility of the ligand within the α5β1 binding site revealed by docking poses is likely responsible of the non‐optimal interaction pattern observed for the RGD sequence with the MDA‐MB‐231 cells and of the sub‐micromolar affinity for the α5β1 receptor (IC 50 314±1.4 nm).
In conclusion, for type I ligands 4, 6, and 7, the aromatic groups display the major STD intensity. Moreover, the interaction between the guanidinium group and the integrin is present in all the compounds, whereas the RGD backbone and DKP scaffold protons contribute differently to the ligand epitope.
2.5. Ligands Adopting the Type III Bound Conformation
The ligands adopting the type III conformation in the bound state (compounds 2, 3, and 5) showed the lowest binding affinities to the α5β1 receptor among the cyclic RGD peptidomimetics tested (highest IC 50 values in Table 1, ranging from 532±35 nm of 3 to 1647±871 nm of 2). Nevertheless, clear peaks caused by magnetization transfer were observed in their STD spectra, revealing different binding epitopes to α5β1‐rich cancer cells, which share the aromatic and the guanidinic protons, even though with variable intensities. In particular, the STD spectrum of compound 2 (displaying the greatest variability in the competitive binding assay and the worst α5β1 IC 50) shows many signals of low intensity, relative to protons of both the scaffold and the RGD moiety, and only one signal (NHGuan) displaying an absolute STD percentage higher than 1 % (Table S7 of the Supporting Information). This behavior suggests that the most important recognition takes place by means of the guanidinium group (100 % relative STD) and that the cyclopeptide conformation of ligand 2 combined with its DKP configuration does not likely allow a favorable interaction of the other protons (e.g. the aromatic protons) with α5 or β1 residues. On the contrary, the STD spectra of ligands 3 and 5 show 100 % relative STD effects for the aromatic protons, indicating their close proximity to the integrin surface. Relative STD % values of notable intensity are displayed also by guanidine and scaffold protons of these ligands, supporting their ability to interact with α5β1‐rich cancer cells.
Docking calculations starting from the type III conformation into the α5β1 model generated ligand binding modes that could explain the poor ability of compounds 2, 3, and 5 to compete with biotinylated fibronectin for the binding to the purified α5β1 integrin, while maintaining extended conformations and several interactions with the receptor site. In fact, docking results starting from type III conformations showed both the classical RGD interaction pattern observed in X‐ray complexes as well as alternative binding modes lacking the classical electrostatic clamp. This behavior is well exemplified by docking poses of ligand 3, which adopts two main binding modes within the α5β1 receptor site (Figure 7). In the best pose, representing binding mode A (Figure 7 a), ligand 3 forms all the key crystallographic interactions, where the benzyl group is in contact with the side chains of β1 Tyr133, Ser134, Asp259 and Glu320, and the NH10 proton is close to the β1 Ser134 residue. In the alternative binding mode B (Figure 7 b), at less favorable docking scores, the guanidinium group loses the electrostatic interaction with the α5 Asp227 side chain and forms a cation‐π interaction with the α5 Trp157 aromatic ring and a salt bridge with the α5 Glu126 side chain, whereas the benzyl group interacts with the α5 Phe187 side chain and the NH1 and NH10 protons are close to β1 Tyr133 and Ser134 residues, respectively.
Figure 7.
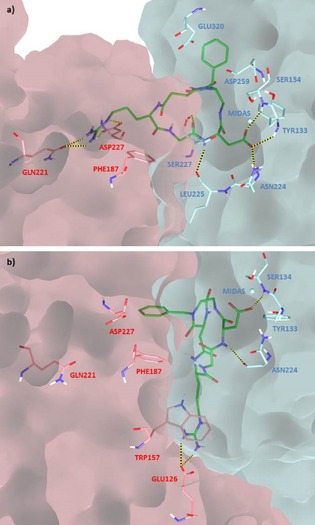
Docking binding modes: a) A and b) B of compound 3 (green) in the crystal structure of the extracellular domain of α5β1 integrin (α5 subunit pink, β1 subunit cyan, model from 3VI4.pdb). Only selected integrin residues involved in interactions with the ligand are shown. Non polar hydrogens are hidden for clarity, whereas intermolecular hydrogen bonds are shown as dashed lines.
The two binding modes can be used to interpret NMR results with MDA‐MB‐231 cells, suggesting that both the ligand arrangements in the binding pocket could contribute to the experimental binding epitope. The possibility of adopting different binding modes within the α5β1 receptor site, owing to the specific features of the pocket, could decrease the ligand ability to compete with biotinylated fibronectin in the binding assay, thus explaining the low affinity for the isolated receptor.
3. Conclusions
In our current work, we planned to investigate the interaction of cyclic RGD–DKP peptidomimetic ligands 2–7 with α5β1 integrin by exploiting an integrated computational and experimental approach. Our ligands, designed to target the αvβ3 integrin, adopt an extended conformation of the RGD moiety, appropriate also to interact usefully with the receptor site of α5β1 integrin. We use NMR methodologies based on the Overhauser effect: STD and transferred NOESY, to study the ligand–protein interactions. The NMR experiments were performed on a suspension of intact MDA‐MB‐231 breast cancer cells where the α5β1 integrin is overexpressed, allowing for a detailed investigation of the binding process very close to physiological conditions. The NMR results were supported by docking calculations and were compared with competitive binding assays to the purified α5β1 integrin.
The conformational analysis of the bound ligands revealed that the bioactive conformations of the ligands can be represented with two well‐defined preferred geometries: type I and type III. Remarkably, the ligands adopting the type I conformation in the bound state (compounds 4, 6, and 7) showed the best binding affinities to the α5β1 receptor. The results obtained from STD–NMR experiments are in agreement with docking analysis, pinpointing how the ligand stereochemistry and functionalization at the DKP nitrogen atoms are decisive in the formation of the ligand–protein complex. In any case, the aromatic moieties as well as the guanidinic protons are in contact with the receptor, although with different STD percentages for each ligand. The best ligand of our library is compound 7 [IC 50=25.7±6.2 nm] that produced top‐ranked binding modes conserving all the key interactions described for the RGD peptides in the X‐ray complexes. Nevertheless, mimic 7 exhibits a binding affinity for α5β1 about 100 times lower than that for αvβ3. This behavior was observed for all compounds of the library and might be imputed to the features of the α5β1 receptor site. In conclusion, the combination of advanced NMR techniques and computational modeling permitted us to identify structural requirements necessary to obtain an effective ligand.
Experimental Section
Competitive Binding Assays
Purified recombinant human integrin α5β1 (R&D Systems, Inc., Minneapolis, MN, USA) was diluted to 0.5 μg mL−1 in coating buffer containing 20 mm Tris‐HCl (pH 7.4), 150 mm NaCl, 1 mm MnCl2, 2 mm CaCl2, and 1 mm MgCl2. Diluted receptor (100 μL/well) was added to 96‐well microtiter plates (NUNC MW 96F Maxisorp Straight) and incubated overnight at 4 °C. The plates were then incubated with blocking solution [coating buffer plus 1 % bovine serum albumin (Sigma, St. Luis MO, USA)] for an additional 2 h at room temperature to block nonspecific binding, followed by 3 h incubation at room temperature with various concentrations (10−12‐–10−4 m) of test compounds in the presence of 1 μg mL−1 biotinylated fibronectin (Sigma, St. Luis MO, USA). Biotinylation was performed by using an EZ‐Link Sulfo‐NHS‐Biotinylation kit (Pierce, Rockford, IL, USA). After washing, the plates were incubated for 1 h at room temperature with streptavidin‐biotinylated hourseradish peroxidase complex (Amersham Biosciences, Uppsala, Sweden) followed by 30 min incubation with 100 μL/well substrate reagent solution (R&D Systems, Minneapolis, MN, USA) before stopping the reaction by addition of 50 μL/well 2 N H2SO4. The absorbance at 415 nm was read in a SynergyTM HT multi‐detection microplate reader (BioTek Instruments, Inc.). Each data point represents the average of triplicate wells; data analysis was carried out by nonlinear regression analysis with Prism GraphPad program.
Computational Studies
Protein Setup
Two crystal structures of the extracellular domain of the integrin α5β1 in a complex with linear and cyclic RGD peptides (PDB code: 3VI4 and 4WK4, respectively) were used for docking studies. Docking was performed only on the globular head of the integrin, because the headgroup of integrin has been identified in the X‐ray structure as the ligand‐binding region. The two protein structures were set up for docking as follows: the protein with the linear RGD ligand was truncated to residue sequences 40–351 for chain α (chain A of crystal asymmetric unit) and 121–358 for chain β (chain B of crystal asymmetric unit). All water was deleted. According to X‐ray structures, metal cations at MIDAS have been modeled as Mg2+ ions, whereas all the other metal cations were modeled as Ca2+ ions. As the complex of integrin α5β1 bound to the linear RGD peptide, that is, 3VI4.pdb, lacks the metal ion of ADMIDAS (adjacent to MIDAS, metal ion‐dependent adhesion site), it was added according to the apo structure of integrin (3VI3.pdb) and to the cyclic RGD peptide crystallographic complex (4WK4.pdb). The two structures were then prepared by using the Protein Preparation Wizard of the graphical user interface Maestro and the OPLSAA force field. Hydrogen bonds were optimized according to the exhaustive sampling option and the entire complexes were optimized by using a restrained minimization with convergence on heavy atoms to a RMSD (root‐mean‐square deviation) of 0.30 Å.
Ligand Docking Calculations
The automated docking calculations were performed by using Glide version 5.7 in the standard precision (SP) mode.14 The grids were generated for the RGD–integrin α5β1 complexes structure prepared as described in the protein setup section. The center of the grid‐enclosing box was defined by the center of the bound ligand. The enclosing box dimensions, which are automatically deduced from the ligand size, fit the entire active site. For the docking step, the size of the inner box for placing the ligand center was set to 12 Å. No further modifications were applied to the default settings. The GlideScore function was used to select 10 poses for each ligand. To validate the docking protocol, a high‐affinity ligand was selected, that is, the cyclic pentapeptide Cilengitide 1 a, showing an IC 50 value to isolated receptor of 14.4 nm (see Table 1). The program was successful in reproducing the experimentally determined binding mode of RGD peptides, as it corresponds to the best‐scored pose in both docking models (see Figure S1).
NMR Studies
All NMR spectra were registered at 283 and 298 K by using 7–9 mm solutions of the test compounds in saline phosphate buffer (pH 7.2) and containing 10 % D2O. The NMR assignment of the compounds were performed through one‐ and two‐dimensional 1H and 13C NMR spectra. The proton resonances did not show significant shifts when the compound was analyzed in the presence of the cells suspension. For conformational analysis, NOESY with 700 ms and tr‐NOESY with 200 ms of mixing time were used. The STD–NMR spectra were acquired in the presence of about 106 MDA‐MB‐231 cells in a total volume of 200 μL, using the watergate sequence for water suppression. The STD experiments discussed herein were achieved at 283 K by using a total irradiation time of 2.94 s. All negative controls were performed: unwanted STD signals were not observed in any of the spectra.
Supporting information
As a service to our authors and readers, this journal provides supporting information supplied by the authors. Such materials are peer reviewed and may be re‐organized for online delivery, but are not copy‐edited or typeset. Technical support issues arising from supporting information (other than missing files) should be addressed to the authors.
Supplementary
Acknowledgements
We gratefully acknowledge MIUR (PRIN project 2010NRREPL and PRIN project 20157WW5EH) and the European Commission (Marie Sklodowska‐Curie ITN MAGICBULLET 642004) for financial support.
I. Guzzetti, M. Civera, F. Vasile, D. Arosio, C. Tringali, U. Piarulli, C. Gennari, L. Pignataro, L. Belvisi, D. Potenza, ChemistryOpen 2017, 6, 128.
Contributor Information
Prof. Dr. Laura Belvisi, Email: laura.belvisi@unimi.it.
Dr. Donatella Potenza, Email: donatella.potenza@unimi.it.
References
- 1.
- 1a. Hynes R. O., Cell 2002, 110, 673–687; [DOI] [PubMed] [Google Scholar]
- 1b. Takada Y., Ye X., Simon S., Genome Biol. 2007, 8, 215. [DOI] [PMC free article] [PubMed] [Google Scholar]
- 2.
- 2a. Shimaoka M., Springer T. A., Nat. Rev. Drug Discovery 2003, 2, 703–716; [DOI] [PubMed] [Google Scholar]
- 2b. Avraamides C. J., Garmy-Susini B., Varner J. A., Nat. Rev. Cancer 2008, 8, 604–617; [DOI] [PMC free article] [PubMed] [Google Scholar]
- 2c. Desgrosellier J. S., Cheresh D. A., Nat. Rev. Cancer 2010, 10, 9–22; [DOI] [PMC free article] [PubMed] [Google Scholar]
- 2d. Cox D., Brennan M., Moran N., Nat. Rev. Drug Discovery 2010, 9, 804–820; [DOI] [PubMed] [Google Scholar]
- 2e. Ley K., Rivera-Nieves J., Sandborn W. J., Shattil S., Nat. Rev. Drug Discovery 2016, 15, 173–183. [DOI] [PMC free article] [PubMed] [Google Scholar]
- 3. Sheldrake H. M., Patterson L. H., J. Med. Chem. 2014, 57, 6301–6315. [DOI] [PubMed] [Google Scholar]
- 4. Plow E. F., Haas T. A., Zhang L., Loftus J., Smith J. W., J. Biol. Chem. 2000, 275, 21785–21788. [DOI] [PubMed] [Google Scholar]
- 5. Mas-Moruno C., Fraioli R., Rechenmacher F., Neubauer S., Kapp T. G., Kessler H., Angew. Chem. Int. Ed. 2016, 55, 7048–7068; [DOI] [PubMed] [Google Scholar]; Angew. Chem. 2016, 128, 7162–7183, and references therein. [Google Scholar]
- 6.
- 6a. Paolillo M., Russo M. A., Serra M., Colombo L., Schinelli S., Mini-Rev. Med. Chem. 2009, 9, 1439–1446; [DOI] [PubMed] [Google Scholar]
- 6b. Marelli U. K., Rechenmacher F., Sobahi T. R. A., Mas-Moruno C., Kessler H., Front. Oncol. 2013, 3, 222; [DOI] [PMC free article] [PubMed] [Google Scholar]
- 6c. Auzzas L., Zanardi F., Battistini L., Burreddu P., Carta P., Rassu G., Curti C., Casiraghi G., Curr. Med. Chem. 2010, 17, 1255–1299. [DOI] [PubMed] [Google Scholar]
- 7.
- 7a. Dechantsreiter M. A., Planker E., Math B., Lohof E., Hçlzemann G., Jonczyk A., Goodman S. L., Kessler H., J. Med. Chem. 1999, 42, 3033–3040; [DOI] [PubMed] [Google Scholar]
- 7b. Mas-Moruno C., Rechenmacher F., Kessler H., Anti-Cancer Agents Med. Chem. 2010, 10, 753–768; [DOI] [PMC free article] [PubMed] [Google Scholar]
- 7c. Gilbert M. R., Kuhn J., Lamborn K. R., Lieberman F., Wen P. Y., Mehta M., Cloughesy T., Lassman A. B., DeAngelis L. M., Chang S., Prados M., J. Neuro-Oncol. 2012, 106, 147–153; [DOI] [PMC free article] [PubMed] [Google Scholar]
- 7d. Stupp R., Hegi M. E., Gorlia T., Erridge S. C., Perry J., Hong Y.-K., Aldape K. D., Lhermitte B., Pietsch T., Grujicic D., Steinbach J. P., Wick W., Tarnawski R., Nam D.-H., Hau P., Weyerbrock A., Taphoorn M. J. B., Shen C.-C., Rao N., Thurzo L., Herrlinger U., Gupta T., Kortmann R.-D., Adamska K., McBain C., Brandes A. A., Tonn J. C., Schnell O., Wiegel T., Kim C.-Y., Nabors L. B., Reardon D. A., van den Bent M. J., Hicking C., Markivskyy A., Picard M., Weller M., Lancet Oncol. 2014, 15, 1100–1108. [DOI] [PubMed] [Google Scholar]
- 8.
- 8a. Ressurreição A. S. M., Bordessa A., Civera M., Belvisi L., Gennari C., Piarulli U., J. Org. Chem. 2008, 73, 652–660; [DOI] [PubMed] [Google Scholar]
- 8b. da Ressurreicao A. S. M., Vidu A., Civera M., Belvisi L., Potenza D., Manzoni L., Ongeri S., Gennari C., Piarulli U., Chem. Eur. J. 2009, 15, 12184–12188; [DOI] [PubMed] [Google Scholar]
- 8c. Marchini M., Mingozzi M., Colombo R., Guzzetti I., Belvisi L., Vasile F., Potenza D., Piarulli U., Arosio D., Gennari C., Chem. Eur. J. 2012, 18, 6195–6207. [DOI] [PubMed] [Google Scholar]
- 9. Guzzetti I., Civera M., Vasile F., Araldi E. M. V., Belvisi L., Gennari C., Potenza D., Fanelli R., Piarulli U., Org. Biomol. Chem. 2013, 11, 3886–3893. [DOI] [PubMed] [Google Scholar]
- 10.
- 10a. Xia W., Springer T. A., Proc. Natl. Acad. Sci. USA 2014, 111, 17863–17868; [DOI] [PMC free article] [PubMed] [Google Scholar]
- 10b. Nagae M., Re S., Mihara E., Nogi T., Sugita Y., Takagi J., J. Cell Biol. 2012, 197, 131–140. [DOI] [PMC free article] [PubMed] [Google Scholar]
- 11. Xiong J. P., Stehle T., Zhang R., Joachimiak A., Frech M., Goodman S. L., Arnaout M. A., Science 2002, 296, 151–155. [DOI] [PubMed] [Google Scholar]
- 12.
- 12a. Meyer B., Peters T., Angew. Chem. Int. Ed. 2003, 42, 864–890; [DOI] [PubMed] [Google Scholar]; Angew. Chem. 2003, 115, 890–918; [Google Scholar]
- 12b. Bhunia A., Bhattacharjya S., Chatterjee S., Drug Discovery Today 2012, 17, 505–512; [DOI] [PubMed] [Google Scholar]
- 12c. Freedberg D. I., Selenko P., Annu. Rev. Biophys. 2014, 43, 171–192. [DOI] [PubMed] [Google Scholar]
- 13.
- 13a. Potenza D., Vasile F., Belvisi L., Civera M., Araldi E. M. V., ChemBioChem 2011, 12, 695–699; [DOI] [PubMed] [Google Scholar]
- 13b. Potenza D., Belvisi L., Org. Biomol. Chem. 2008, 6, 258–262; [DOI] [PubMed] [Google Scholar]
- 13c. Claasen B., Axmann M., Meinecke R., Meyer B., J. Am. Chem. Soc. 2005, 127, 916–919. [DOI] [PubMed] [Google Scholar]
- 14.Glide, version 5.7, Schrödinger, LLC, New York, NY (USA), 2011.
- 15.The human breast adenocarcinoma MDA-MB-231 cell line was characterized for the expression of surface antigens of interest, namely integrins αvβ3 and α5β1, by means of flow cytometry. Results were quantified as MFI (Mean Fluorescence Intensity) values. MFI values of 592 and 4208 were measured for integrin αvβ3 and α5β1 amounts, respectively, as reported in E. M. V. Araldi, PhD thesis, Università degli Studi di Milano, Milano (Italy), 2010.
- 16.Four different H-bonding patterns (denoted as type I–IV) were identified in the free-state conformational analysis of the cyclic RGD ligands containing the DKP scaffolds, as described in ref. [8 c] and summarized in the Supporting Information. Depending on the configuration and substitution of the DKP scaffold, the cyclic DKP–RGD ligands showed different intramolecular H-bonding patterns characterized by specific γ- and β-turns and diverse arrangements of the RGD sequence.
Associated Data
This section collects any data citations, data availability statements, or supplementary materials included in this article.
Supplementary Materials
As a service to our authors and readers, this journal provides supporting information supplied by the authors. Such materials are peer reviewed and may be re‐organized for online delivery, but are not copy‐edited or typeset. Technical support issues arising from supporting information (other than missing files) should be addressed to the authors.
Supplementary


