Abstract
Mammalian color patterns are among the most recognizable characters found in nature and can have a profound impact on fitness. However, little is known about the mechanisms underlying their formation and subsequent evolution. Here we show that, in the African striped mouse (Rhabdomys pumilio), periodic dorsal stripes result from underlying differences in melanocyte maturation, which give rise to spatial variation in hair color, and we identify the transcription factor Alx3 as a regulator of this process. In embryonic dorsal skin, patterned expression of Alx3 foreshadows pigment stripes, and acts to directly repress Mitf, a master regulator of melanocyte differentiation, giving rise to light-colored hair. Moreover, Alx3 is also upregulated in the light stripes of chipmunks, which have independently evolved a similar pattern of dorsal stripes. Our results reveal a previously unappreciated mechanism for modulating spatial variation in hair color, and provide new insight into the ways in which phenotypic novelty evolves.
A fundamental challenge in biology is to understand how repetitive morphologic structures develop and evolve. Periodic color patterns are a fascinating system with which to explore these questions because of their diversity, sophistication, and visual accessibility, and because the cellular, developmental, and molecular mechanisms that underlie spots and stripes in warm-blooded animals are largely unknown.
Traditional model organisms such as laboratory mice have been instrumental for identifying genes that regulate pigment cell production, melanin synthesis, and the pathways that alter the balance between two types of pigment, pheomelanin and eumelanin1-7, but it is unknown to what extent these pathways explain or even contribute to the remarkable array of pigment patterns seen in wild animals. Here we take advantage of the naturally occurring coat pattern of the African striped mouse, Rhabdomys pumilio (Muridae), to gain insights into the processes underlying the formation and evolution of mammalian stripes, a striking and characteristic pattern that has independently evolved in many taxa, including ungulates, carnivores, rodents, marsupials, lagomorphs, and primates3,8,9, is often developmentally or seasonally regulated, and is thought to confer a fitness advantage in different species of vertebrates10-13
Striped mice are diurnal, social rodents distributed throughout southwest Africa14 and whose dorsal coat is characterized by the presence of four dark and two light dorsal longitudinal stripes arranged in a dark-light-dark pattern (Fig. 1a). To understand how this stripe pattern is formed, we first characterized the distribution of hair and hair types across the body. In adult striped mice, hair can be classified into one of three phenotypic categories based on their individual pigment pattern - light: unpigmented shaft with a eumelanic base; black: completely eumelanic from tip to base, and banded: phaeomelanic (yellow) shaft and eumelanic (black) base (Extended Data Fig. 1a). We quantified the proportion of each hair category in different regions along the dorsoventral axis (middle stripe, dark stripe, light stripe, flank, and ventrum) and found that their proportions differed: the middle stripe and flank had similar proportions of all three hair types, but the light stripe contained mostly light hair, similar to what is seen in the ventrum, and the dark stripe contained mostly black hair (Fig. 1b and Extended Data Fig. 1b). Thus, rather than by differences in pigment-type switching (pheomelanin vs. eumelanin), variation between light and dark stripes is largely determined by changes in the distribution of unpigmented (light) and eumelanic (black) hair.
Figure 1. Phenotypic characterization.

a, Striped mice have dark and light longitudinal stripes, b, Proportion of light, black, and banded hair along the dorsoventral axis for zigzag hair (n = 5; error bars represent SEM). c, The dorsal pattern at E22, P0, and P2. d-f, Postnatal day 2 skin sections from dark and light stripes showing hematoxilin and eosin stain (d), and immunohistochemistry for KIT (e) and MITF (f). g-h, number of detectable cells expressing MITF (g) and their fluorescence intensity (h) (dark stripe vs light stripe cell number: two-tailed t test; n = 4, ***p < 0.001; hair follicles analyzed: 65 in the dark stripe 1 [615 cells] and 62 in the light stripe [284 cells]; dark stripe 1 vs light stripe fluorescense intensity: two-tailed t test; n = 4, ***p < 0.001; hair follicles analyzed: 34 in the dark stripe 1 and 34 in the light stripe), i, Quantification of the extent of KIT stain in each hair bulb (dark stripe vs light stripe, two-tailed t test; n = 3, P = 0.5429; hair follicles analyzed: 20 in the dark stripe 1 and 20 in the light stripe), j, qPCR shows Tyr and Tyrpl mRNA levels in P2 dark and light stripes. Differences among stripes were evaluated by ANOVA followed by a Tukey-Kramer test; n = 4; *P < 0.05, **P < 0.01; ***P < 0.001; red bars indicate the mean, k, Tyramide-based assay reveals Tyr activity in hair follicles from P2 dark and light stripes. Brightfield images are shown in (e, f) to depict pigment. Scale bars in (d, k) 100 μm; in (e, f) 50 μm.
To understand how such spatial differences arise, we examined skin development of striped mice between E16 and birth and observed stripe-like changes in both hair length and skin color (Fig. 1c and Extended Data Fig. 2a-d). The hair length changes become apparent first, by embryonic day 19 (E19; Extended Data Fig. 2a, b), but do not persist in adult animals (Extended Data Fig. 2e); by contrast, the skin color changes become apparent at E22, creating a stable arrangement and appearance that persists as the animal grows (Fig. 1c). At birth, both phenomena are present, and are correlated with respect to both morphology and gene expression (Extended Data Fig. 2c, d). Thus, the patterning mechanisms that underlie adult stripes begin during embryogenesis, and can be visualized by changes in organization of mesenchymal tissues.
By postnatal day 2 (P2), light and dark stripes exhibit similar levels of cell proliferation and hair follicle densities (Extended Data Fig. 3a, b); however, histological sections of skin show that hair follicles from the light stripe display a striking reduction in melanin deposition in the hair bulb relative to those from the dark stripe (Fig. 1d). Although hair follicles from both light and dark stripes contain pigment cells, as revealed by immunohistochemistry for KIT (Fig. 1e), those from light stripes exhibit a striking reduction in immunohistochemistry against MITF, a key transcription factor that promotes melanocyte differentiation and melanogenic gene expression15 (Fig. 1f-h).
The extent of KIT staining at the base of hair follicles was indistinguishable between dark and light stripes, despite the large differences in MITF staining and visible pigmentation (Fig. 1f-i). We used quantitative PCR (qPCR) to measure the level of gene expression for key melanogenic genes and observed that the light stripe had lower expression of both Tyrosinase (Tyr) and Tyrosinase-related protein1 (Tyrp1) (Fig. 1j). This difference was confirmed using an enzymatic assay for tyrosinase activity (Fig. 1k). Taken together, these results suggest that the differences in the proportions of black and light hair in dark and light stripes, respectively, are explained largely by differences in levels of Mitf, melanocyte differentiation, and melanogenic gene expression.
Differential expression of Alx3 between stripes
We used RNA-Seq to carry out an unbiased survey of transcriptome differences that correlate with stripe identity. Three different regions of skin (light stripe, dark stripe, and flank) from each of three individuals were examined at each of four stages (E19, E22, P0, P2; n = 12; 36 libraries). For E19, we used hair length as a proxy to mark and isolate incipient pigmentation stripes from E19 (Extended Data Fig. 2). Our initial analyses were carried out using, as a reference, either the laboratory mouse genome or a striped mouse transcriptome that we assembled and annotated in-house. The results from the two approaches exhibited considerable overlap but alignment to the de novo transcriptome reference captured a richer and more comprehensive differential signature (Extended Data Fig. 4a-c and Supplementary Table 1), and is described in what follows. Of more than 17000 genes that we annotated in the striped mouse transcriptome, 1062 exhibited significant differential expression between two regions (false discovery ratio (FDR) < 0.1, using the negative binomial generalized linear model implemented in DESeq2, for which both stage and region are considered as factors). The largest number of differentially expressed genes between regions was observed for the flank vs. the dark or the light stripe (Extended Data Fig. 4d and Supplementary Table 1), which likely reflects a difference in body region or tissue composition rather than a color pattern-specific difference. Among 36 genes significantly upregulated in the dark stripe vs. the light stripe, there is an obvious signature of melanocyte pigment production (Tyr, Tyrp1, Mc1r, Oca2, Gpr143, Trpm1) (Fig. 2a, Extended Data Fig. 5a, and Supplementary Table 1). Several of these genes are direct targets of Mitf, but we did not observe a difference in Mitf mRNA levels between dark and light stripe skin, probably because Mitf is also expressed in non-pigmentary skin cells outside the hair follicle.
Figure 2. Alx3 is a candidate for regulating spatial differences in hair color.
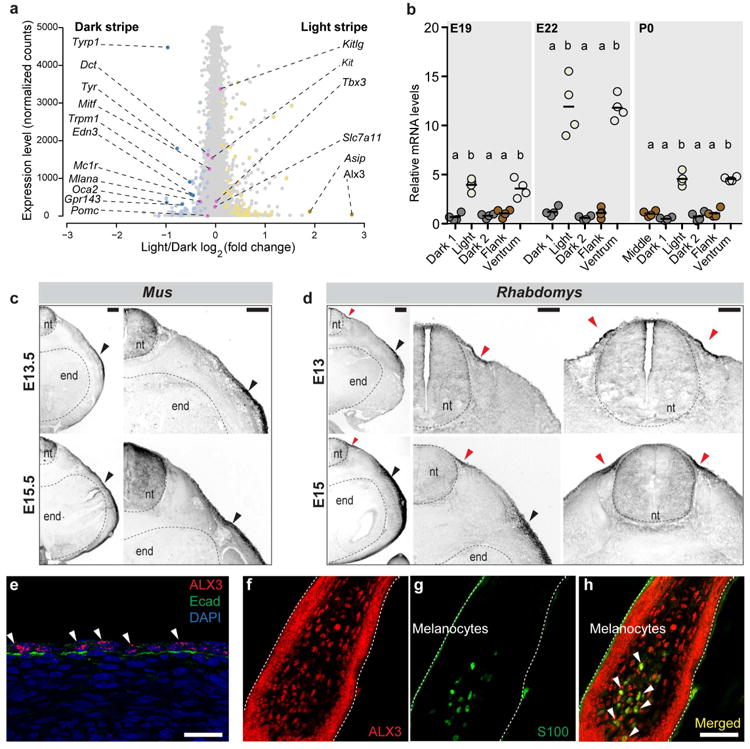
a, Transcript levels (normalized gene counts) plotted as a function of differential expression (log2 fold-change) in light vs. dark stripe. The 145 genes showing significant (FDR < 0.1) differential expression in the light vs. the dark stripe, including Alx3, are shown in yellow (higher expression in the light stripe) or blue (higher expression in the dark stripe; Supplementary Table la). Nine differentially expressed pigmentation-related genes are shown in darker colors (dark yellow or dark blue), while 8 additional pigmentation-related genes not differentially expressed are shown in pink, b, Quantitative PCR showing Alx3 mRNA levels from El9, E22, and P0. Differences among skin regions within each time point were evaluated by ANOVA followed by a Tukey-Kramer test; n = 4 per time point; statistically significant differences (P < 0.05) are indicated by different letters. Red bars indicate the mean, c, d, Comparative Alx3 in situ hybridization analysis between laboratory mice (c) and striped mice (d) embryos show lateral and ventral mesenchyme expression in both species (black arrow) and a symmetrical dorsal domain of expression unique to striped mice (red arrows), e-h Immunohistochemistry for ALX3 and E-cadherin (Ecad) in an El5 striped mouse embryo (e) and for ALX3 (f) and SI00 (g) in a developing dorsal hair follicles from P0. Arrowheads show ALX3 expressing cells (e) and colocalization (h); nt: neural tube, end: endoderm. Scale bars in (c, d) 200 μm, (e-h) 50 μm.
Among 28 genes significantly upregulated in the light vs. the dark stripe, a clear functional signature did not emerge; however, our attention was drawn to Alx3, which encodes a paired-class aristaless-like homeoprotein that has previously been implicated in fate specification of mesenchymal tissues16-19. As described below, the temporal and spatial expression of Alx3 make it a strong candidate for regulating color differences among stripes; furthermore, Alx3 showed the highest fold differences in transcript abundance relative to dark stripe and the flank (6.73 and 4.32-fold, FDR 1.16*10-17 and 4.09*10-11 respectively; Fig. 2a, Extended Data Fig. 5b, and Supplementary Table 1).
To further investigate a potential role of Alx3 in stripe patterning, we examined its spatial and temporal expression during skin development and stripe formation. Quantitative RT-PCR showed that Alx3 mRNA is elevated in the incipient light vs. dark stripes at E19, increasing at E22 and then declining by P0 (Fig. 2b). This pattern contrasts with that observed for other pigmentation-related genes including Asip, Edn3, Tyr, and Tyrp1 (Extended Data Fig. 6a, b, c) for which differential expression is not apparent until E22 or later.
Alx3 is expressed in a new dorsal domain and in various cell types in the hair bulb
We used in situ hybridization to examine the expression of Alx3 during the early stages of skin development. Previous work on Alx3 during embryogenesis (E10.5-E12.5) in laboratory mice (Mus) showed expression in neural crest-derived mesenchyme and in lateral plate mesoderm16. In sections from E13.5 and E15.5 laboratory mouse embryos, we confirmed this pattern of expression, observing Alx3 mRNA in lateral mesenchyme at E13.5, extending to and predominating in ventral mesenchyme by E15.5 (Fig. 2c). A similar pattern is present in striped mice (Fig. 2d); however, striped mouse embryos show an additional domain of Alx3 expression in the developing dorsal skin (red arrowheads in Fig. 2d), which corresponds anatomically with the future position of the stripe domain. At these early stages (E15), ALX3 is primarily expressed in epithelial cells, as indicated by combined immunohistochemistry with E-cadherin, an epidermal compartment marker (Fig. 2e). At P0, when Alx3 mRNA remains elevated in light vs. dark stripe skin, immunostaining with antisera for ALX3 reveals cells in developing dorsal hair bulbs (Fig. 2f). Combined immunostaining with antisera for S100 (Fig. 2g), a marker for neural crest-derived cells21, indicates that hair bulb expression of ALX3 includes melanocytes as well as keratinocytes (Fig. 2f-h). Taken together, these results indicate that establishment of a cellular compartment corresponding to the stripe domain occurs early during skin development, implicate Alx3 as a participating and/or responding factor in pattern establishment, and suggest multiple pathways—a direct effect on pigment cells and/or an indirect effect on hair bulb keratinocytes—through which alterations of melanocyte Mitf expression and pattern implementation may take place.
Perturbation of Alx3 expression in cultured melanocytes and keratinocytes
To further investigate the potential relationship between Alx3, Mitf, and pigment production, we carried out gain- and loss-of-function perturbation experiments in cultured cells. A lentiviral construct in which Alx3 and a GFP reporter are driven by a PGK promoter (LV-Alx3:GFP) (Extended Data Fig. 7a) was transduced into B16-F1 cells, a laboratory mouse melanocyte cell line that expresses Alx3 (Extended Data Fig. 7b); control cells were transduced with the same construct but lacking Alx3 (LV-GFP) (Extended Data Fig. 7a). We found that cells carrying the full length Alx3 construct (LV-Alx3:GFP) exhibited a marked decrease in mRNA levels of Mitf and Silver, a key melanogenesis gene and Mitf target (Extended Data Fig. 7c).
For loss-of-function, we used short hairpin RNAs (shRNAs) against Alx3. Three of the four shRNA lentiviral constructs tested (shRNA1, 2, and 3) caused Alx3 mRNA levels to decrease relative to cells containing a scrambled shRNA control (Extended Data Fig. 7d). The same three constructs caused Mitf and Silver mRNA levels to increase. Thus, these experiments show that Alx3 negatively regulates Mitf.
To investigate a potential indirect effect of Alx3, we transduced primary Mus keratinocytes with LV-Alx3:GFP or LV-GFP and co-cultured them with wildtype B16-F1 melanocytes using an cell culture insert system (Extended Data Fig. 8a). Melanocytes exposed to keratinocytes stably expressing LV-Alx3:GFP did not differ in their Mitf, Tyrosinase, or Silver mRNA levels, relative to those co-cultured with LV-GFP expressing keratinocytes (Extended Data Fig. 8b). In addition, we obtained a similar response when wildtype melanocytes were co-cultured with LV-Alx3:GFP transduced melanocytes (Extended Data Fig. 8c, d). Taken together, these results reveal a reciprocal and rheostat-like relationship between Alx3 and Mitf, in which expression of Mitf mRNA and its melanogenic gene targets can either be up- or down-regulated in response to inhibition or overexpression, respectively, of Alx3 mRNA. Our results further indicate that regulation of Mitf expression and melanogenic gene expression by Alx3 occurs via a melanocyte-autonomous process.
Alx3 interferes with melanocyte differentiation and melanin synthesis in vivo
We also examined the effect of Alx3 in vivo using the same lentiviral constructs described above, and ultrasound-assisted in utero injections into E8.5 mouse embryos. At this stage prior to neural tube closure, injected lentivirus infects skin epidermis and cells originating from the neural crest, including melanocyte precursors (Fig. 3a-b). We observed GFP expression in cells in the center of the hair follicle as well as the upper periphery; co-staining with KIT confirmed that many/most of the GFP-positive cells in the center of the follicle were melanocytes (Fig. 3b).
Figure 3. Alx3 decreases melanin synthesis in vivo.
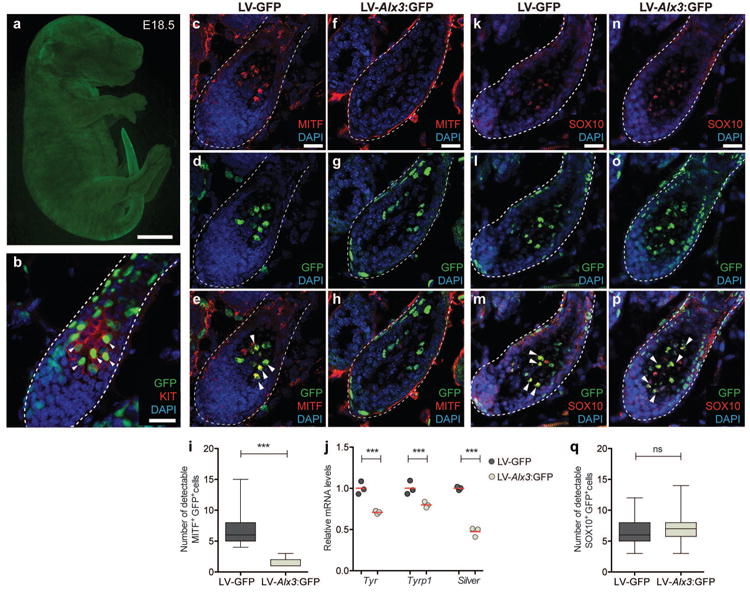
a, b, Injections at E8.5 allowed stable transduction of various cell types, including melanocytes (arrowheads), c-h, Hair follicles from samples injected with LV-GFP control (c-e) and LV-Alx-3:GFP (f-h) depicting immunohistochemistry for MITF (c, f), virus transduced cells (d, g), and merged images showing MITF+GFP+ cells (e, h)(arrowheads). i, Number of detectable MITF+ cells (LV-GFP vs LV-Alx3, two-tailed t test; n = 3, ***P < 0.001; hair follicles counted: 61 in LV-Alx3:GFP [88 cells] and 60 in LV-GFP [402 cells]), j, Quantitative PCR of FACS-isolated melanocytes transduced with both viruses (two-tailed t test; n = 3, ***P < 0.001). (k-p) Hair follicles from samples injected with lentiviruses depicting immunohistochemistry for SOX 10 (k, n), virus transduced cells (1, o) and merged images with arrowheads showing SOX+GFP+ cells (m, p). q, Number of detectable SOX 10+ cells (two-tailed t test; n = 3, P = 0.1173; hair follicles counted: 62 in LV-Alx3:GFP [426 cells] and 61 in LV-GFP [398 cells]). Scale bar in (a) 1mm, (b) 100 μm. Scale bar in (c-h and k-p) 50 μm.
Hair follicles from mice sampled at P4, a stage in which melanin synthesis is active2, that were transduced with LV-Alx3:GFP had a marked reduction in the number of MITF+GFP+ cells compared to the control, as revealed by immunohistochemistry (Fig 3c-i). In addition, LV-Alx3:GFP transduced melanocytes, isolated by FACS, showed a decrease in mRNA levels of melanin synthesis markers (Tyrp1, Tyr, and Silver) relative to the control (Fig. 3j). To determine whether the effect of Alx3 over-expression was reducing the number of melanocytes or just their expression of Mitf, we performed immunohistochemistry against SOX10, a melanocyte marker upstream of Mitf15,23-25, and found that the number of SOX10+GFP+ cells in LV-Alx3:GFP and control samples did not differ (Fig. 3k-q). Furthermore, we did not detect a difference in the number of keratinocytes, as determined by counts of K14+GFP+ cells inside hair follicles, or in hair follicle density (Extended Data Fig. 9). The ability of elevated levels of Alx3 to suppress expression of Mitf and melanocyte differentiation in experiments with laboratory mice recapitulates the differences seen between the light and dark stripes of striped mice.
Alx3 represses Mitf by binding to its promoter
The histological and genomic data point to several pathways that contribute to stripe differences, in which an Alx3-Mitf connection may play an early and predominant role. We used in vivo and in vitro protein-DNA interaction experiments to gain additional insight into how Alx3 downregulates Mitf. Alx3 can selectively bind to a DNA consensus sequence containing a TAAT motif26. The Mitf gene consists of four isoforms, which differ in their first exons and associated promoters (1A, 1H, 1B, and 1M); among these, 1M is specific to melanocytes15. Among a ∼1.5kb region upstream of the laboratory mouse Mitf M transcriptional initiation site, we identified ten candidate TAAT binding sites conserved between Mus and Rhabdomys, four of which were also conserved across mammals (labeled 1-10; Fig. 4a and Extended Data Fig. 10a, b). Electrophoretic mobility shift assays (EMSA) with nuclear extracts of B16-F1 cells, revealed that binding sites 3, 5, and 10 (Probes 2, 4, and 8, respectively), generated sequence-specific DNA-protein complexes (Fig. 4b). The addition of ALX3 antiserum27 disrupted the formation of these complexes, demonstrating the presence of ALX3 bound to the oligonucleotide probes for these three sites (Fig. 4b).
Figure 4. AIx3 binds to the Mitf promoter directly.
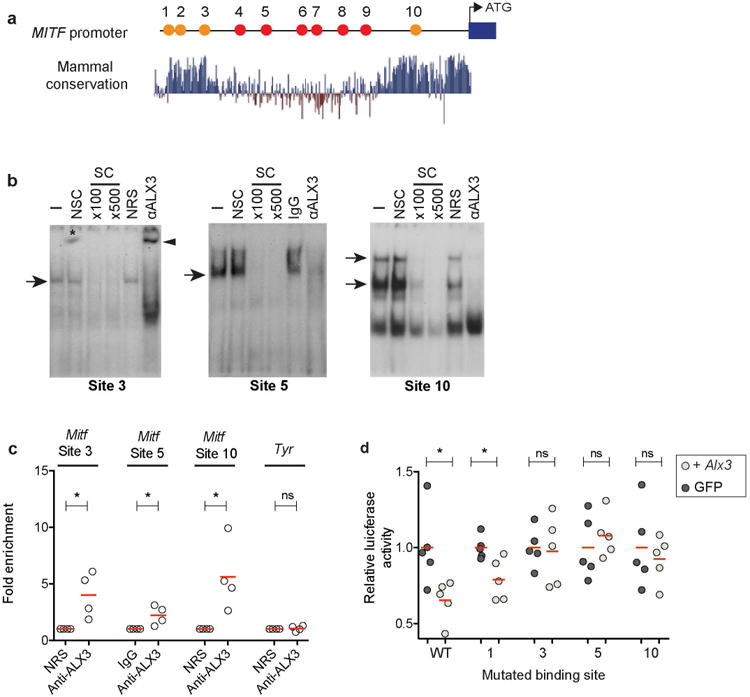
a, Location of putative Alx3 binding sites (labeled 1-10), conserved in Mus and Rhabdomys (red circles) and across mammals (orange circles), along the Mitf M promoter, b, EMSAs show the binding of nuclear proteins from B16-F1 cells to sites 3, 5, and 10. The absence (-) or presence of non-specific (NSC; 500-fold molar excess) or specific (SC; indicated fold molar excess) competing oligonucleotides, or the addition of ALX3 antibodies or control (non-immune rabbit serum [NRS] or IgG) is indicated. Arrows indicate complexes containing ALX3, arrowhead shows supershitf for site 3, and asterisk shows an artifact in the gel. c, ChlP-qPCR assays showing amplification of Mitf chromatin corresponding to different regions of the promoter immunoprecipitated with an anti-ALX3 antibody or with control NRS (Anti-ALX3 vs. NRS, two-tailed t test; n = 4,*P< 0.05). d, Relative levels of luciferase activity in B16-F1 cells stably expressing Alx3 (light circles) or GFP (dark circles). Labels of mutated binding sites correspond to those described in (a). Luciferase activity was normalized relative to cells transfected with the pLightSwitch_Prom luciferase reporter vector (empty vector) and values are given as a fraction of luminescence for GFP transfected cells. Differences between cells transfected with LV-Alx3:GFP and LV-GFP for each plasmid was evaluated using two-tailed t tests; n = 5; *P < 0.05. Red bars in (c and d) indicate the mean.
We also carried out chromatin immunoprecipitation (ChIP) assays on B16-F1 cells, and found that Mitf promoter sequences that contain candidate binding sites 3, 5, and 10 were selectively amplified by qPCR from chromatin immunoprecipitated with the anti-ALX3 antiserum, but not with control non-immune serum (Fig. 4d). Promoter sequences from the Tyr gene, used as a control, were not amplified from the anti-ALX3 immunoprecipitated chromatin (Fig. 4d). Thus, ALX3 binds to evolutionarily conserved sequences immediately upstream of the melanocyte Mitf promoter in vitro and in vivo.
We also tested the effect of Alx3 overexpression on Mitf promoter activity in B16-F1 cells. Using a luciferase reporter cloned downstream of Mitf promoter sequences, overexpression of Alx3 caused a decrease in luciferase expression relative to GFP overexpression (Fig. 4e). Furthermore, when we mutated the TAAT motifs identified by our EMSA experiments as relevant for ALX3 interactions (i.e., candidate binding sites 3, 5 and 10), luciferase activity between GFP and Alx3 expressing cells did not differ, indicating that Alx3 could no longer suppress expression (Fig. 4e). As a control, we mutated candidate binding site 1, which did not show binding in our EMSA experiments, and found that Alx3 transfected cells had a decrease in luciferase activity relative to GFP transfected cells, similar to what was seen with the wild-type Mitf promoter (Fig. 4e).
We next investigated whether Alx3 could be exerting its repressive effect by interacting with other known regulators of Mitf. A recent study showed that Alx3 represses the glucagon promoter by interacting with Pax626, a transcription factor structurally related to the Mitf transcriptional activator Pax329. Since our results shows that Alx3 binds to a region of the Mitf promoter residing near a binding site for Pax3 (Site 10; Fig. 4 and Extended Data Fig. 10a), we compared the effects of adding an Alx3 or a Pax3 antibody to the binding reaction that occurs with Probe 8 and found that the Pax3 antibody decreases the intensity of the fastest migrating band, which is not disturbed by the Alx3 antibody (Extended Data Fig. 10c). In addition, the Pax3 antibody interferes with the two upper bands that are inhibited by the Alx3 antiserum, suggesting that Alx3 and Pax3 are part of the same protein-DNA complex and their interaction could contribute to decreased transcriptional activity (Extended Data Fig. 10c).
Evolutionary interplay and innovation in hair color patterns: Alx3 and pigment-type switching
Color patterns in striped mice are very similar to but independently evolved from those displayed in Eastern chipmunks (Tamias striatus), a sciurid rodent which shares a last common ancestor with the Muridae about 70mya30-32 (Fig. 5a). In skin biopsies from five adult Eastern chipmunks, we measured expression of Alx3 in the chipmunk skin using qPCR and found that mRNA levels are higher in the light stripe, relative to the dark stripe and flank (Fig. 5b).
Figure 5. Hair color patterning mechanisms in rodents.
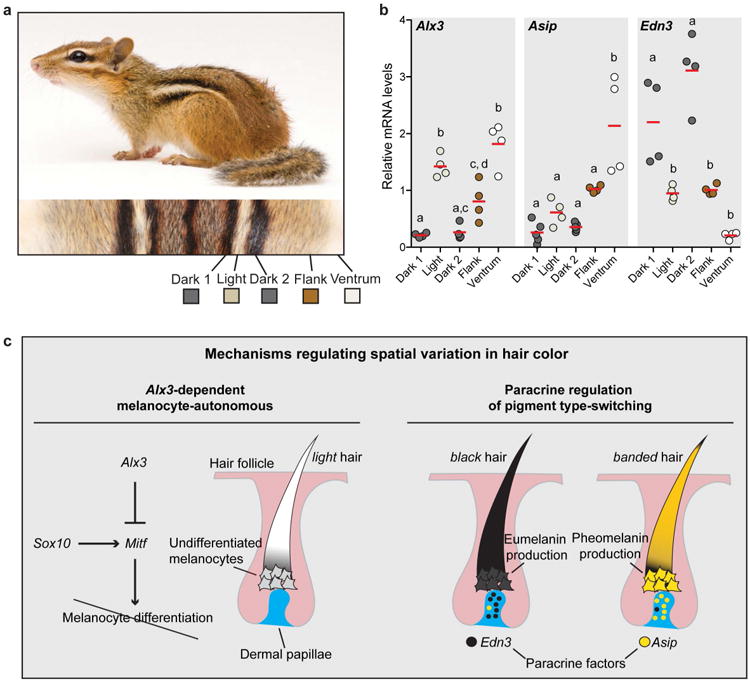
a, Chipmunks (Sciuridae) have independently evolved dark and light stripe in a pattern that resembles the one seen in striped mice, b, Quantitative PCR revealed spatial differences in Alx3, Asip, and Edn3 mRNA levels along the dorsoventral axis. Differences among dorsal regions were evaluated by ANOVA followed by a Tukey-Kramer test; n = 4; statistically significant differences (P < 0.05) are indicated by different letters. Red bars indicate the mean, c, The combination of melanocye autonomous pathways, mediated by Alx3, and non-autonomous pathways, mediated by paracrine factor (Edn3 and Asip), may help explain variation in pigmentation patterns seen across rodents and mammals.
We also measured expression of Asip and Edn3, which encode paracrine regulators of pigment type-switching, and compared the results in chipmunks (Fig. 5b) to those in striped mice (Extended Data Fig. 6a, b). Overall, Asip mRNA levels are elevated in light areas (the light stripe, flank, and ventrum in striped mice, the flank and the ventrum in chipmunks), whereas Edn3 mRNA levels are elevated in dark areas (the dark stripes in both species). Thus, Alx3-mediated repression of Mitf in melanocytes and paracrine regulation of pigment type switching are common developmental mechanisms used repeatedly during mammalian evolution to bring about stripe patterns.
In non-mammalian vertebrates, mechanisms that underlie color patterns depend on specialized types of pigment cells that become organized into specific arrangements during development3,5-7. But in mammals, there exists only a single type of pigment cell, the melanocyte, and, in general, localized differences in color are brought about by heterogeneity of gene expression rather than heterogeneity of cellular distribution1-3. For stripes and spots in felids, pigment-type switching controlled by Asip and Edn3 is the major determinant of color pattern20, but for dorsal stripes in striped mice, suppression of melanocyte development is a main driver of color pattern. Indeed, Alx3-induced inhibition of Mitf expression without loss of melanocytes represents a previously unrecognized evolutionary tool for local modulation of color pattern.
In chipmunks and striped mice, both pigment type-switching and Alx3-mediated repression of Mitf are at play; for example, increased expression of Edn3 distinguishes the dark stripes from surrounding regions, and increased expression of both Asip and Alx3 distinguish the ventrum from the flank. This interplay between melanocyte-autonomous (Alx3-dependent) and non-autonomous (paracrine regulation of pigment type-switching) pathways may help to explain patterns composed of more than two shades or intensities of pigment, e.g. pattern elements that are yellow or orange (pigment type-switching) mixed with elements that are almost devoid of pigment (Alx3-mediated repression of Mitf) (Fig. 5c). From an evolutionary perspective, we note that laboratory mice, striped mice, and chipmunks all express Alx3 in ventral skin, but only the latter two species upregulate Alx3 in their dorsum. We hypothesize that Alx3 and Asip33,34, contribute to pale-colored ventrums, and that Alx3 was subsequently co-opted and expressed in an additional dorsal domain, ultimately giving rise to light-colored stripes.
It is not yet clear if the developmental cues that direct Alx3 expression and stripe formation in chipmunks and striped mice originate from an organizing center, such as the neuroectoderm, or arise spontaneously, e.g. through a reaction-diffusion mechanism, but it is possible that the same principles operate broadly across mammalian phyla. Although striped mice and chipmunks share a similar dark-light-dark stripe pattern, the location of the stripes along the dorso-ventral axis differs considerably, with stripes in chipmunks situated more laterally than in striped mice. In addition, stripe number varies considerably among rodents, from the single-striped grass mouse (Lemniscomys rosalia) to the thirteen-lined ground squirrel (Ictidomys tridecemilineatus). From this perspective, spatial control of Alx3 provides a new entry point to explore phylogenetic plasticity of patterned gene expression and the developmental basis of evolutionary novelty.
Methods
Striped mice (Rhabdomys pumilio) breeding colony
F10 descendants of wild-derived striped mice (Rhabdomys pumilio, originating from Goegap Nature Reserve, South Africa S29 41.56, E 18 1.60) were obtained from a captive colony kept at the University of Zurich (Switzerland) and now maintained at Harvard University. They are kept at a 16:8 light dark cycle and given food ad libitum. Developmental stages were inferred from morphological similarities with Mus musculus embryos. Harvard University's IACUC committee approved all experiments.
Phenotypic characterization
Adults
We identified three main hair types based on their individual pigment pattern: black, banded, and light. To characterize pigment pattern along the dorsoventral axis, we quantified the proportion of each of these hair types in 1mm hair plugs taken from each dorsal stripe, the flank and the ventrum of adult mice. In addition, we scored the number of guard, awl, and zigzag hair found in each region. To determine hair length, we placed hairs from the hair plugs on microscope slides, mounted them with glycerol, and measured their length using Axiovision Microscopy Software (Zeiss).
Embryos and Pups
We fixed embryos, dissected the skin, and mounted it on glass slides (dermal side up). For estimating hair follicle density in pups, we detached a portion of each stripe from the muscle, while leaving the ends attached, embedded samples in OCT (Fisher Scientific), cryosectioned them coronally, and stained them with Hematoxilin and Eosin. This technique allowed us to count individual hair follicles and assign them to the specific region to which they belonged (light stripes, dark stripes, or flank). We counted the number of hair follicles and estimated surface area using ImageJ35. Since our phenotypic characterization (Fig. 1b and Extended Data Figs. 1b and 3b) and gene expression patterns determined by qPCR (Figs. 1j and 2b) showed no differences between the two dark stripes, we carried out most analyses with dark stripe 1. We manually quantified the number of MITF+ cells per hair follicle, as detected with our antibody. For quantification of MITF fluorescence, we obtained images from hair follicles in the light and dark stripe, outlined stained cells, and measured the integrated density using ImageJ35. To obtain the corrected total cell fluorescence (CTCF), we multiplied the area of each selected cell by the mean fluorescence of the background readings and subtracted that value from the integrated density of stained cells36. To quantify the extent of KIT staining, we obtained images from hair follicles in the light and dark stripe, delineated the hair bulb area, and measured the proportion of the follicular area stained with KIT+ using ImageJ.
All counts were done blind, and statistical differences were determined using two-tailed t tests or ANOVA (sample sizes and statistical tests used are indicated in figure legends).
Cell proliferation
We injected the peritoneum of R. pumilio pregnant females with 10 μg/g of EdU (5-ethynyl-2′-deoxyuridine) two days prior to birth and collected pups at P0. To reveal proliferating cells, we microdissected dark and light stripes, embedded them in OCT for posterior cryosectioning, and used the Click-iT EdU Imaging kit (ThermoFisher Scientific), following the manufacturers protocol. We counted proliferating cells in the epidermis and hair follicles from pictures of light and dark stripes. All counts were done blind. Statistical differences were established using two-tailed t tests, and sample sizes are provided in the figure legend.
Immunohistochemistry
Striped mouse embryos were fixed in 4% PFA, embedded in OCT/sucrose, and sectioned using a cryostat (CM 3050S, Leica). We performed immunohistochemistry using anti-MITF (Abcam 80651; 1:100), anti-ALX3 (Abcam 64985; 1:500), anti-KIT (DAKO A4502; 1:1000), anti-E-cadherin (Millipore ECCD-2; 1:200), anti-S100 (Abcam 4066; 1:200), and anti-SOX10 (Abcam 27655; 1:100). We visualized reactions with Alexa dye conjugated secondary antibodies (Molecular Probes) at 1:500 dilution in 3% BSA/PBS/Tween or with Biotinylated Goat Anti Rabbit (Jackson Labs) and TSA (Perkin Elmer). For controls, we incubated sections with PBS instead of primary antibodies, but no specific cellular staining was observed. Cell nuclei were stained with DAPI (Southern Biotech). We examined sections using a LSM 700 confocal microscope and an A1 Imager (Zeiss). All pictures are representative of at least three individuals.
Tyramide-based tyrosinase assay
We carried out the Tyramide-Based tyrosinase assay as described previously37. Briefly, we permeabilized tissue with PBT and blocked endogenous peroxidase with H2O2 and blocked the tissue with 5% BSA after a brief wash. Subsequently, we incubated tissues with Avidin and Biotin solution and exposed them to biotinyl tyramide in amplification diluent (Perkin Elmer) for 10min. After washing 3 times, each for 5 min, we incubated sections for 1 hour with Strepatavdin-CY3 (1:600; Sigma-Aldrich), washed them, stained them with DAPI, and mounted the slides. We examined sections using a LSM 700 confocal microscope and an A1 Imager (Zeiss). All pictures are representative of at least three individuals.
Quantitative PCR (qPCR)
We separated the skin from the muscle and microdissected skin tissue corresponding to different regions (i.e., dark stripe 1, light stripe, dark stripe 2, flank, and ventrum) at the different time points indicated throughout the text. We then extracted total RNA using the Fibrous Tissue RNeasy kit (Qiagen), which included a DNAse on column treatment. Using qScript cDNA SuperMix (Quanta BioSciences), we generated complementary DNA (cDNA) and then performed qPCR using PerfeCTa SYBR Green FastMix (Quanta BioSciences). Forty cycles of amplification were used, and data acquisition was carried out with an Eppendorf Mastercycler. For analysis of striped mice, we designed primers along sites that were conserved across mice and rats. For chipmunk samples, we designed primers along sites that were conserved across mice and thirteen-lined ground squirrels (all primers sequences are listed in Supplementary Table 2). For measurements of Mitf expression in laboratory mouse samples, we used validated qPCR primers from the PrimerBank database38. We assayed gene expression in triplicate for each sample and normalized the data using the housekeeping gene β-actin. Samples used for qPCR correspond to different individuals than those used for RNA-seq analysis. We analyzed data from all qPCR experiments using the comparative CT method39, and established statistical significance of expression differences using either ANOVA followed by a Tukey-Kramer test or two-tailed t tests (sample numbers and specific statistical tests used are given in each figure legend).
RNA sequencing
For each of the time points described in the text, we dissected skin tissue (dark stripe 1, light stripe, flank) and extracted RNA as indicated for qPCR. We used RNA from three different regions (light stripe, dark stripe, and flank) from each of three individuals for four different stages (E19, E22, P0, P2; n = 12; 36 libraries in total). We prepared cDNA libraries for each sample using Illumina's TruSeq RNA Library Preparation Kit v2. We multiplexed individual libraries (six per lane) and sequenced them as paired-end 50-bp reads on an Illumina HiSeq 2000 instrument at the Genome Sequencing Laboratory of the HudsonAlpha Institute. We used Cutadapt software (v. 1.8.1) to trim RNA-seq reads for residual adaptors and low quality sequences. Since a good quality reference genome is not currently available for the striped mouse, we used a dual exploratory strategy to assess differential expression between skin regions across various developmental stages. First, we aligned the trimmed RNA-Seq reads against the laboratory mouse (Mus musculus) reference genome version using genomic sequence and transcript annotations obtained from Ensembl (release 80) and the STAR aligner software (v. 2.5.0b). In parallel, we assembled trimmed RNA-Seq reads into a de novo transcriptome using the Trinity suite of tools (v. 2.1.0). The resulting de novo transcriptome assembly was subsequently annotated using an in-house annotation procedure supported by the human reference exon sequences retrieved from the RefSeq sequence database (GRCh37/hg19, release 55; http://www.ncbi.nlm.nih.gov/refseq/). Briefly, to associate a specific gene entity to each de novo assembled transcriptomic contig, we mapped our de novo assembly against a comprehensive database of reference human exon sequences using the Blast software (v. 2.2.22). We retained only alignments with a significant Blast Expected Value < 10-4 for subsequent annotation purposes. Based on these alignments, we subsequently computed an ad-hoc mapping score for each pair {assembly contig, gene entity} for which at least one significant exon alignment was identified. The mapping score was computed as the sum of the highest Blast alignment bit-scores at each position within a particular contig, associated with at least one significant alignment against an exon of the considered gene entity. Ultimately, the annotation procedure associated to each mapped contig the gene entity with the highest ad-hoc mapping score. We then used the annotated de novo transcriptome assembly as reference for aligning trimmed RNA-Seq reads using the Bowtie2 software (v. 2.2.5).
We computed gene counts from read alignments, obtained using either the laboratory mouse reference or the de novo transcriptome assembly, with three software tools included in the Trinity suite: eXpress (v. 1.5.1), Kallisto (0.42.4) and RSEM (v. 1.2.23). We then used the individual sets of gene counts computed for each transcriptome reference and each abundance estimation tool to test for differential gene expression between samples from various skin regions with the DESeq2 package (v. 1.10.1) from Bioconductor. The entire dataset (3 individuals, 3 regions, 4 stages; n=36 libraries) was analyzed under the DESeq2 negative binomial generalized linear model, which is a powerful and robust approach for identifying genes that are differentially expressed, either between stages or between regions. In all situations we used a false discovery ratio (FDR) <0.1 as a statistical significance threshold. Results presented here depict region-specific two-way comparisons across all 4 stages, dark vs. light (Fig. 2a), dark vs. flank (Extended Fig. 5a), and flank vs. light (Extended Fig. 5b), in which genes assessed as significant represent the intersection between the three abundance estimation approaches implemented in the Trinity suite.
There are major changes in cell composition and skin development across the four stages we examined by RNA-Seq (E19, E22, P0, P2), associated with large changes in gene expression profiles. Therefore, to examine the relationship between light or dark stripes at different stages, we developed supervised learning models in which the gene expression profile at one stage was tested as a predictor of stripe identity, light vs. dark, and subsequent stages. After normalization and variance stabilization using R functions implemented in DESeq2, we carried out a principal component analysis (PCA), using R functions implemented in the FactoMineR (v.1.33) package, to identify variance components associated with light vs. dark phenotype across all stages. The PCA results were then used to develop supervised learning models using the R functions implemented in the randomForest package (v.4.6-12), including optimization steps based on the top 5% of the most informative gene expression profiles associated with each stage. The results presented here (Extended Data Fig. 2f) depict the ability of learning models based on a specific region and stage to predict region identity, light vs. dark, of other stages, in which accuracy of the models is evaluated by averaging over 30 independent iterations.
In situ hybridizations
For in situ hybridization, we generated species-specific riboprobes by cloning a 545bp fragment of Alx3 from the striped mouse and the laboratory mouse. We carried out section in situ hybridizations following protocols described previously40,41 and visualized samples using an A1 Imager (Zeiss). All pictures are representative of at least three individuals.
Cell culture experiments
We purchased B16-F1 melanoma cells from ATCC and maintained in DMEM with 10% Fetal Bovine Serum (FBS, Sigma-Aldrich), 100 U/mL penicillin, and 100 μg/mL streptomycin in a 37 °C incubator with 5% CO2 at physiological pH 7.4. We grew cells to 70-80% confluency and performed all experiments within 10 passages. We cultured mouse keratinocytes and maintained them in 0.05 mM Ca2+ E-media with 10% FCS serum.
For gain of function experiments, we used the LV-Alx3:GFP and LV-GFP constructs described above. For loss of function experiments, we used five constructs (4 specific to Alx3 and one scrambled sequence) from existing RNAi lentiviral libraries42 (details listed in Supplementary Table 2). For viral infections, we plated cells in 6-well dishes at 300,000 cells per well and incubated with lentivirus in the presence of polybrene (100μg/mL). All infections were carried in triplicate. After two days in culture, we selected infected cells using either puromycin (2μg/mL; shRNA constructs) or FACS (gain of function), and processed samples for mRNA analyses. For cell culture insert experiments, we plated wildtype cells on 0.4 um transwell inserts (Falcon, BD) at 200,000 cells/mL and incubated them in plates containing a bottom layer of transduced cells (keratinocytes or melanocytes) for three days (see Extended Data Fig. 9 for a diagram of the experimental design).
Ultrasound-assisted in utero lentiviral microinjections
For construction of LV-Alx3:GFP, we replaced the puromycin cassette of PLKO.1, a generic lentiviral vector containing the PKG promoter42, with a fragment containing Alx3 cDNA cloned from a laboratory mouse (NM_007441.3), a P2A sequence, and a histone-fluorescent protein gene fusion (Hist2h2be-eGFP). LV-GFP, which contains only the sequence coding for Hist2h2be-eGFP, was originally designed from PLKO.1 using a similar strategy22 (Addgene plasmid 25999). We carried large-scale production of VSV-G pseudotyped lentivirus using calcium phosphate transfections of 293FT cells and helper plasmids, pMD2.G and psPAX2 (Addgene plasmids 12259 and 12260). Transfection conditions, subsequent viral concentration, and titering followed established guidelines22. For injections, we anesthetized C57Bl6 females at E8.5 of gestation and injected embryos with 1.5 μl of a constant viral titer. We collected transduced skin from P4 pups, which we used for immunohistochemistry, following procedures outlined above, and for isolation of virus infected melanocytes via FACS. For FACS, we used a KIT antibody (ebioscience 14-1171-81; 1:1000), sorted KIT+GFP+ cells directly in Trizol LS (Invitrogen), and extracted RNA following the protocol outlined in the TRIZOL LS manual. We manually quantified the number of MITF+GFP+ and SOX10+GFP+ cells in hair follicles, as detected with our antibodies. To determine the number of keratinocytes per follicular area, we divided the number of K14+GFP+ cells in hair follicles by the hair follicle area, as determined using ImageJ35. To determine hair follicle density, we obtained pictures of skin sections stained with DAPI and counted the number of hair follicles per skin section area, as determined using ImageJ35. All counts were done blind. Statistical differences were established using two-tailed t tests, and sample sizes for each analysis are indicated in figure legends.
Comparative sequence analysis
We obtained sequence data for different species from publicly available nucleotide databases at NCBI (http://www.ncbi.nlm.nih.gov/BLAST/). Evolutionarily conserved non-coding sequences were identified using the global sequence alignment tool incorporated in the UCSC genome browser (http://genome.ucsc.edu)43, PipMaker (http://bio.cse.psu.edu/pipmaker)44, and Lagan (http://lagan.stanford.edu/lagan_web/index.shtml)45.
Electrophoretic mobility shift assays (EMSA)
We conducted EMSA using nuclear extracts46 of melanoma B16-F1 cells prepared in the presence of protease inhibitors (Complete protease inhibitor cocktail; Roche) and determined protein concentrations using the Bio-Rad protein assay. Synthetic complementary oligonucleotides were annealed and labeled using [γ-32P] ATP and T4 kinase. We performed binding reactions at room temperature in the presence of 20,000 cpm of radiolabeled probe (approximately 6–10 fmol) in a volume of 20 μl containing 2 μg poly (dI-dC), 20 mM HEPES (pH 7.9), 70 mM KCl, 2.5 mM MgCl2, 1 mM dithiothreitol, 0.3 mM EDTA, and 10% glycerol. We then added competitor oligonucleotides of identical (specific) or unrelated (non-specific) sequence to the probe at the indicated fold molar excess. The sequences of the oligonucleotides used are listed in Supplementary Table 2. When indicated, we added specific antiserum27 or control non-immune rabbit serum to the binding reaction. The reaction mixtures were resolved using 5% nondenaturing polyacrylamide gels, which were subsequently dried and autoradiographed.
Western Blots
We prepared cell lysates from B16-F1 cells, resolved by SDS/PAGE, and blotted them onto a BioTrace PVDF membrane (Pall Corporation). We detected ALX3 immunoreactivity with a rabbit polyclonal primary antiserum (1:4000 dilution)27 and a horseradish peroxidase-conjugated goat anti-rabbit secondary antibody (1:10000 dilution; Bio-Rad Laboratories). To detect ACTIN we used a mouse monoclonal antibody (1:10000 dilution, clone AC-15; Sigma) and a horseradish peroxidase-conjugated goat anti-mouse antibody (1:5000 dilution; Bio-Rad Laboratories). We visualized immunoreactive bands using an ECL detection system (GE Healthcare).
Chromatin immunoprecipitation (ChIP) – qPCR assays
We performed ChIP assays as previously described28 using B16-F1 cells treated with 1% formaldehyde. We isolated the cross-linked protein-DNA complexes and, after sonication, we incubated chromatin with an ALX3 antiserum27 or with control non-immune rabbit serum. Next, we isolated antibody-protein-DNA complexes by incubation with protein A-Sepharose. To detect bound DNA, we carried out qPCR out on triplicate samples using oligonucleotide primers that amplify fragments of the Mitf gene corresponding to the regions containing either Site 2 or Site 3. As a control, we used promoter sequences from the Tyr gene as described47. Oligonucleotides used in ChIP assays are listed in Supplementary Table 2.
Luciferase assays
We amplified a 2kb region of the Mitf M promoter from the laboratory mouse and subsequently cloned it into the SacI-HindIII sites of the pLightSwitch_Prom luciferase reporter vector (Switchgear Genomics, Active Motif). We then generated additional luciferase constructs from the wild-type construct by mutating the different Alx3 binding motifs (TAAT for GCCG) using the Q5 Site-Directed Mutagenesis Kit (New England Biolabs). We verified all constructs by sequencing. We next transfected B16-F1 melanocytes with LV-Alx3:GFP and LV-GFP by using FuGENE HD (Active Motif). Using FACS, we selected the stable transfectant clones, and confirmed overexpression of Alx3 by qPCR. The day prior to the transfection, we seeded cells at a density of 1×10⁴ cells per well and 16 hours later transfected them with the different Mitf constructs using a FuGENE HD to plasmid DNA ratio of 3:1 (300nL FuGENE HD to 100ng plasmid DNA per well). We then harvested cells and processed them using the LightSwitch Luciferase Assay Kit (Switchgear Genomics) following the protocol guidelines and measured luciferase using a SpectraMax L luminometer (Molecular Devices). We normalized luciferase activity relative to luminescence from cells transfected with the pLightSwitch_Prom luciferase reporter vector (empty vector). We did not observe a difference in luciferase activity when we transfected our two stable cell lines (LV-Alx3:GFP and LV-GFP) with an empty vector (pLightSwitch_Prom) or a vector containing the promoter for a housekeeping gene (ACTB_PROM). We performed all luciferase experiments using five replicates per construct and established statistical significance of luminescence differences using two-tailed t tests.
Chipmunk (Tamias striatus) samples
We collected Tamias striatus at Harvard University's Concord Field Station (Concord, MA) using Sherman live traps (Massachusetts state permit: 027.14SCM). Chipmunks were euthanized, skin punches were taken from the different body regions, and samples were processed for qPCR as indicated above.
Extended Data
Extended Data Figure 1. Hair characterization in adult striped mice.
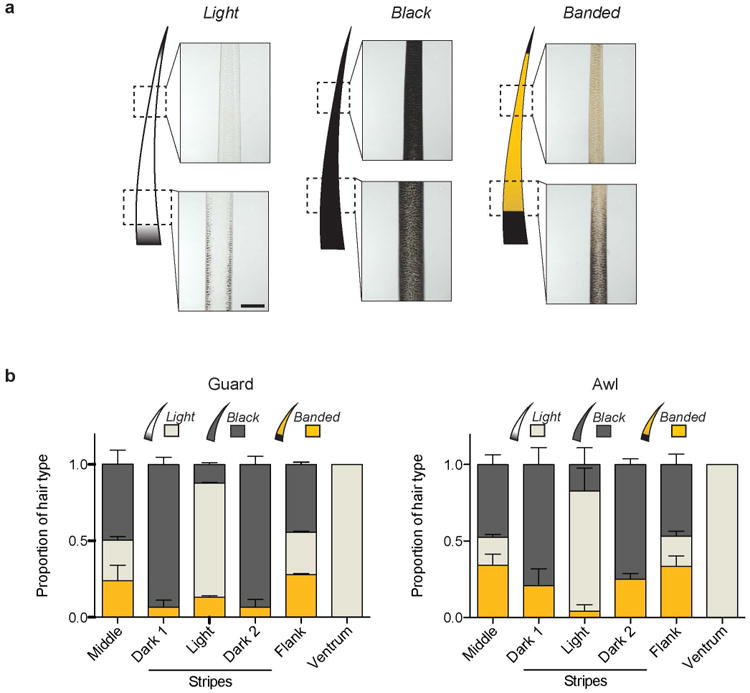
a, Striped mice have three different phenotypic categories (light, black, and banded) of hair based on individual pigment pattern. All hair types have a black tip, which corresponds to structural hair features (not pigment). b, Relative proportion of light, black, and banded guard and awl hair along the striped mouse dorsoventral axis (n = 5; error bars represent SEM). Scale bar in (a) 100 μm.
Extended Data Fig. 2. Stripe-like differences in hair length along the dorsum in Rhabodmys embryos and pups.
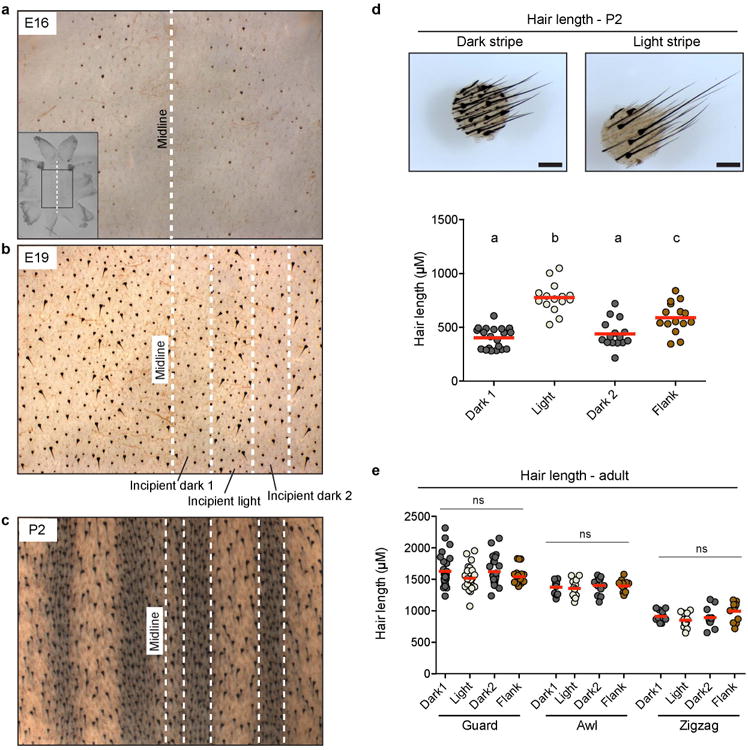
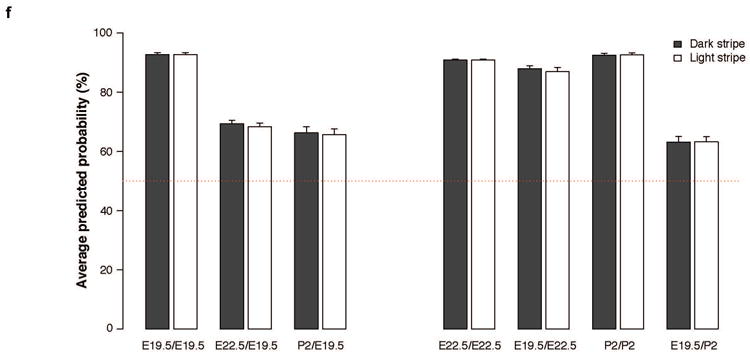
a-c, Flat-mount skin preparations (‘dermis up’) of embryos at E16 (a), E19 (b), and pups from P2 (c). Middle axis is indicated in all cases (midline). White dashed lines represent regions differing in hair length at El9 (b) and regions differing in pigmentation at P2 (c). Incipient pigmentation stripes are shown in (b). d, Skin punches and measurements show differences in hair length between the dark and light stripe of P2 individuals. Hair length differences in (b) (incipient stripes) correlate with those seen when pigment differences arise (c, d). Differences among dorsal regions were evaluated by ANOVA followed by a Tukey-Kramer test; n = 3; statistically significant differences (P < 0.05) are indicated by different letters. Red bars indicate the mean, e, Hair length measurements taken from guard, awl, and zigzag hair found along the dorsum of adults. Differences among dorsal regions were evaluated by ANOVA followed by a Tukey-Kramer test; n = 3; P = 0.1736 (guard hair), P = 0.8006 (awl hair) P = 0.1038 (zigzag hair). f, Predicted probabilities of the observed stripe-like phenotypes, as inferred by supervised learning models built and trained to recognize time point specific gene expression signatures of the stripes. The bars reflect the average probabilities and their standard errors computed from 30 consecutive iterations of the predictive model in each of the examined situations. The labels indicate, as a ratio, the time point at which the randomForests model was applied to predict the stripe-like phenotype (the left term of the ratio), and the time point at which the model was built and trained (the right term of the ratio). The dotted line indicates the prior probability of either stripe phenotype (i.e., 50% in case a case with only two distinct phenotypes). Please see methods section for more details.
Extended Data Figure 3. Cell proliferation and hair follicle density in striped mouse newborn pups (P0).
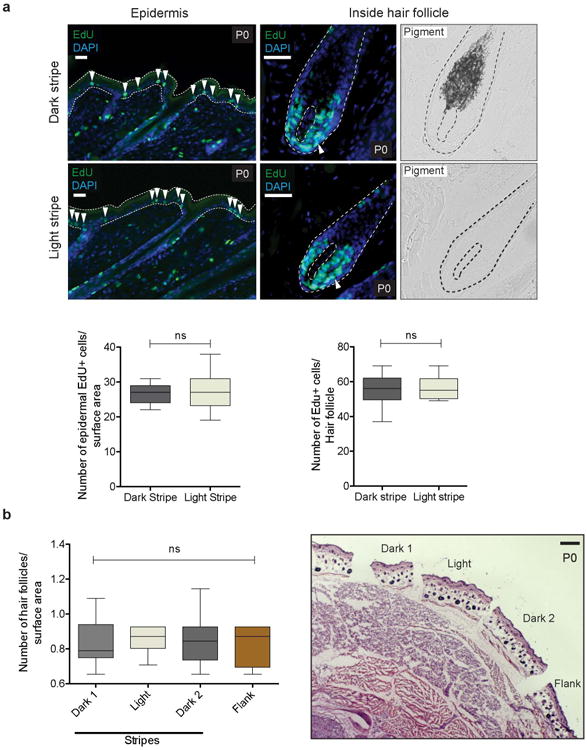
a, Counts of proliferating cells, as determined by EdU labeling, in the epidermis and inside hair follicles (Epidermal cells: dark stripe 1 vs. light stripe, two-tailed t test; n = 3, P = 0.5417; cells counted: 402 [dark stripe 1] and 444 [light stripe]); Intrafollicular cells (dark stripe 1 vs. light stripe, two-tailed t test; n = 3, P = 0.7537; cells counted: 724 [dark stripe 1] and 680 [light stripe]), b, Number of hair follicles per surface area along the dorsoventral axis. Differences among dorsal regions were evaluated by ANOVA; n = 3, P = 0.4391; total number of hair follicles counted: 139 [light stripe], 141 [dark stripe 1], 132 [dark stripe 2], and 128 [flank]). Bright field images in (a) depict pigment. Red bars indicate the mean. Scale bars in (a) 100 μm, (b) 200 μm.
Extended Data Figure 4. Venn diagrams comparing M. musculus and the de novo assembled transcriptome as references.
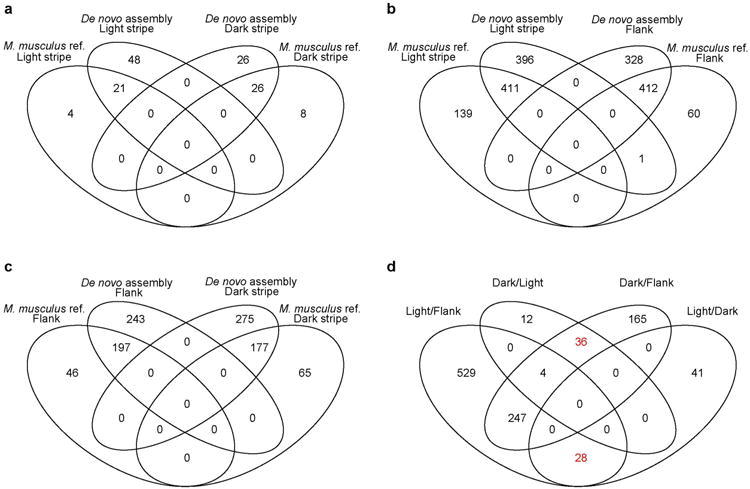
a-c, Differentially expressed genes identified using either the M. musculus reference or the de novo transcriptome assembly in light vs. dark stripes (a), light vs. flank (b), and flank vs. dark (c). d, Differentially expressed genes in light or dark stripes vs. the other skin region (light or dark stripes and the flank). Genes that are specifically upregulated only in the dark or light stripes are highlighted in red.
Extended Data Figure 5. RNA-Seq transcript levels (normalized gene counts) plotted as a function of differential expression (log2fold-change).
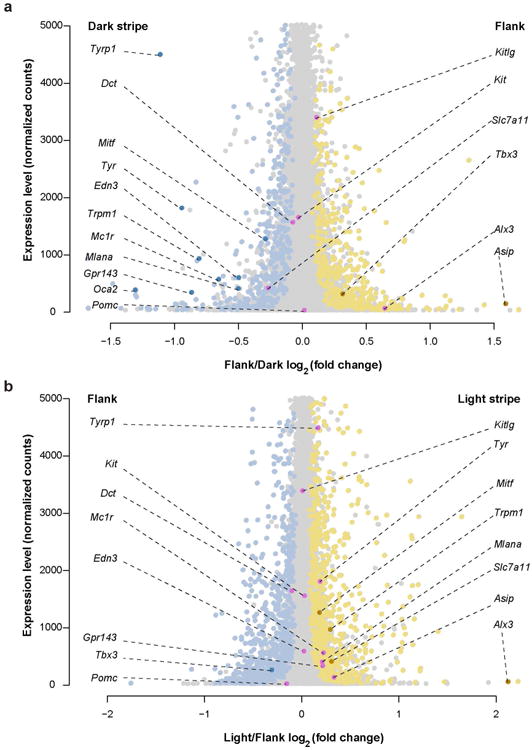
a, The 1148 genes demonstrating significant (FDR < 0.1) differential expression in the flank versus the dark stripe are shown in yellow (higher expression in the flank) or blue (higher expression in the dark stripe; Supplementary Table lc). Eleven differentially expressed pigmentation-related genes are illustrated in darker colors (dark yellow or dark blue), while 6 additional pigmentation-related genes that are not differentially expressed are shown in pink. b, The 1777 genes demonstrating significant (FDR < 0.1) differential expression in the light stripe versus the flank are shown in yellow (higher expression in the light stripe) or blue (higher expression in the flank; Supplementary Table lb). Four differentially expressed pigmentation-related genes are illustrated in darker colors (dark yellow or dark blue), while 11 additional pigmentation-related genes that are not differentially expressed are shown in pink.
Extended Data Figure 6. Stage-specific gene expression.
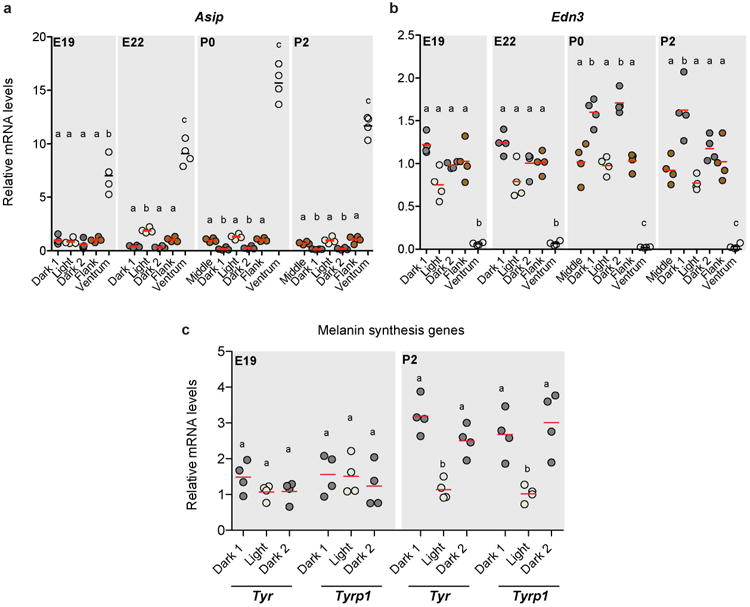
a-c, Quantitative PCR shows the relative expression of the pigment-type switching genes Asip (a), Edn3 (b), and melanin synthesis genes Tyr and Tyrpl (c) in different regions of the Rhabdomys skin. Differences among stripes in within each time point was evaluated by ANOVA followed by a Tukey-Kramer test; n = 4 per time point; statistically significant differences (P < 0.05) are indicated by different letters. Red bars indicate the mean.
Extended Data Fig. 7. Gain- and loss of function experiments in cultured cells.
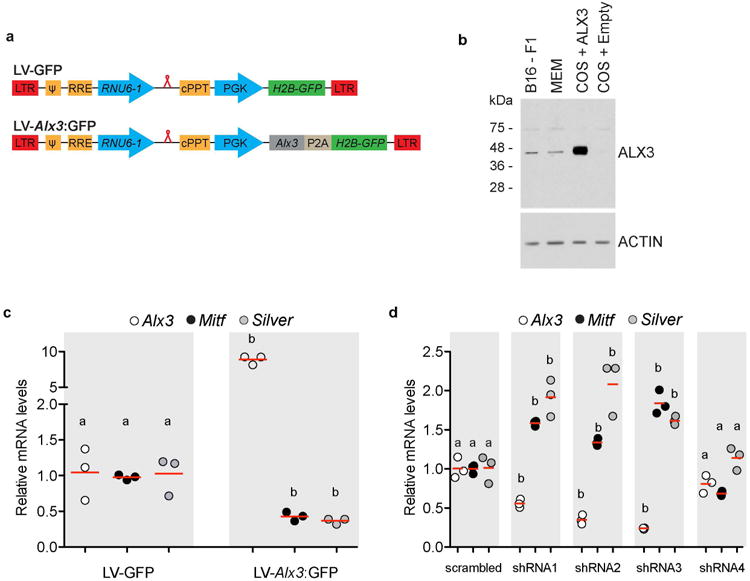
a, Lentiviral constructs were modified from pLKO. 1, a generic vector for expressing human RNU6-1 promoter-driven short hairpin RNAs (red loop). LTR, long terminal repeat;ψ, retroviral packaging element, RRE, Rev response element; cPPT, central polypurine tract; PGK, phosphoglycerate kinase promoter; H2B-GFP, Hist2h2be fused to GFP cDNA; P2A, 2A peptide, b, Western blot shows expression of ALX3 in nuclear extracts of B16-F1 cells. Positive controls were extracts from mouse embryonic mesenchyme (MEM) or COS cells transfected with a pcDNA-ALX3 expression vector. COS cells transfected with empty pcDNA served as negative controls. ACTIN immunoreactivity is shown for the same extracts as a control. c, Quantitative PCR showing mRNA levels of cells transduced with LV-Alx3:GFP, relative to cells transduced with the LV-GFP control (LV-Alx3:GFP vs. LV-GFP, two-tailed t test; n = 3. Red bars indicate the mean), d, Quantitative PCR showing mRNA levels of cells transduced with shRNA lentiviral constructs, relative to cells transduced with a scrambled control (shRNAl, 2, 3, or 4 vs. shRNA scrambled, two-tailed t test; n = 3; statistically significant differences [P < 0.05] are indicated by different letters. Red bars indicate the mean).
Extended Data Fig. 8. Non-cell autonomous effects of Alx3 on B16 melanocytes.
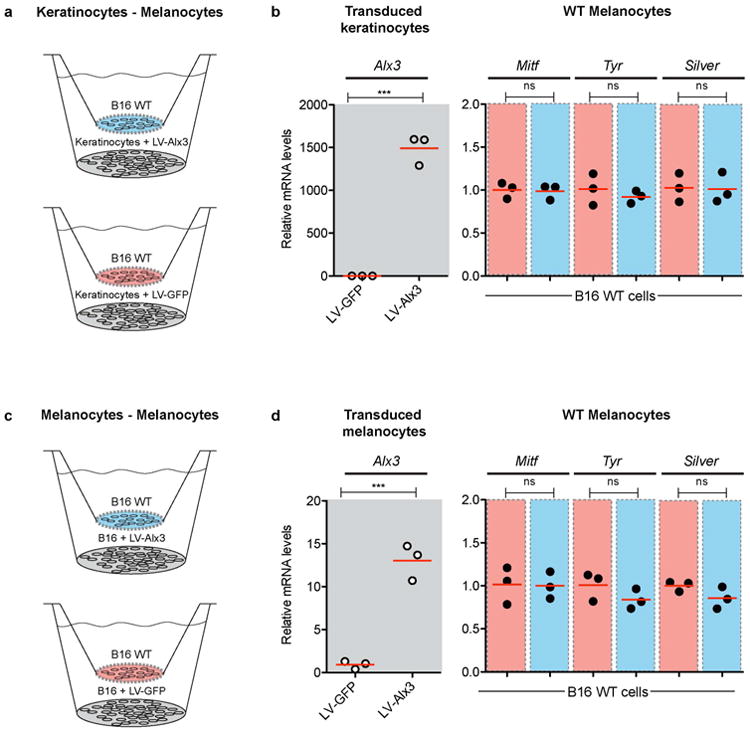
a-d, Wildtype B16 melanocytes (B16 WT) were exposed to keratinocytes (a) or melanocytes (c) stably transduced with either LV-Alx3:GFP (LV-Alx3 in graphs) or LV-GFP. b, d, Quantitative PCR showing relative mRNA levels of Alx3 in cells carrying the lentiviral constructs (gray panel) and of Mitf, Tyr, and Silver in B16 WT melanocytes exposed to keratinocytes (c) or melanocytes (d) transduced with LV-Alx3:GFP (red panels) or LV-GFP (blue panels) (LV-Alx3:GFP vs. LV-GFP, two-tailed t test; n = 3, ***P < 0.0001) Red bars in (b) and (d) indicate the mean.
Extended Data Figure 9. Effect of Alx3 on skin.

a-f, Hair follicles from samples injected with LV-GFP control (a-c) and LV-Alx3:GFP (d-f) depicting immunohistochemistry for K14 (a, d), virus transduced cells (b, e), and merged images showing K14+GFP+ cells (c, f). g, Number of detctable K14+GFP+ cells per follicular area (LV-GFP vs LV-Alx3:GFP, two-tailed t test; n = 3, P = 0.275; total number of hair follicles counted: 44 in LV-Alx3:GFP [Average: 52.809 cells/hair follicle area] and 50 in LV-GFP [Average: 55.123 cells/hair follicle area]), h, Hair follicle density in samples injected with the viruses (LV-GFP vs LVAlx3:GFP, two-tailed t test; n = 3, P = 0.103; total number of hair follicles counted: 914 in LV-Alx3:GFP [Average: 0.794 hair follicles/surface area] and 864 in LV-GFP [Average: 0.84 hair follicles/surface area]). Scale in (a-f) 50 μM.
Extended Data Figure 10. Alignment of a ~1.5kb region of the Mitf M promoter in laboratory mice (Mus) and striped mice (Rhabdomys).
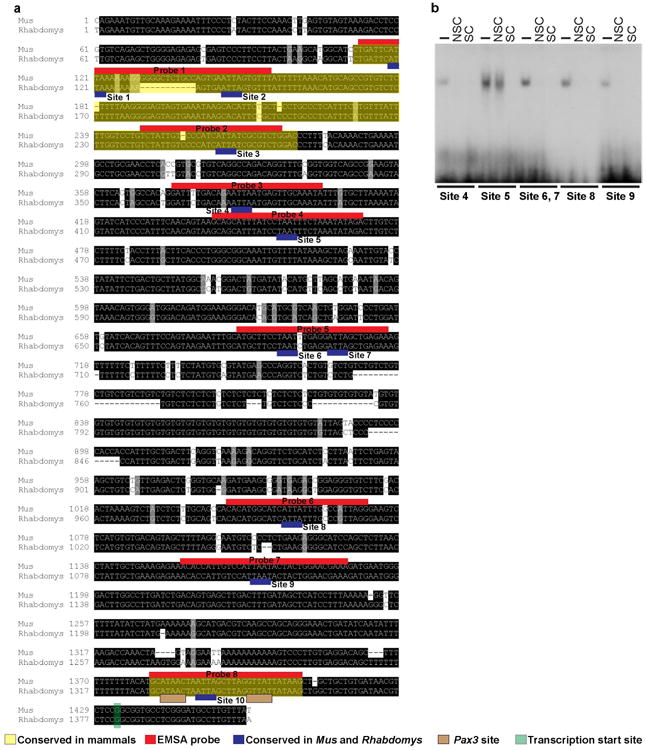
Black boxes represent conserved sequences. Mapped onto the sequences are the evolutionary conserved regions of the mammalian MitfM promoter, identified in silico (http://genome.ucsc.edu)(yellow), regions where the EMSA probes were designed (red), Alx3 binding sites analyzed (blue), and the transcription start site (green). b, EMS As showing the binding of recombinant Alx3 to the indicated sites. The absence (-) or presence of non-specific (NSC; 500-fold molar excess) or specific (SC; indicated fold molar excess) competing oligonucleotides.
Supplementary Material
Acknowledgments
We thank C. Perdomo, D. Mishkind, M. Omura, J. Chupasko, P. Walsh, and N. Hughes for providing technical and logistical support. A portion of the cell culture work was conducted in T. Capellini's lab. MM4 and MV are supported by the Spanish Ministry of Economy and Competitiveness (MINECO grants BFU2011-24245 and BFU2014-52149-R) and Instituto de Salud Carlos III. CIBERDEM is an initiative of the Instituto de Salud Carlos III, Madrid, Spain. HEH is an Investigator of the Howard Hughes Medical Institute.
Footnotes
Extended Data: Extended Data includes ten Extended Data Figures
Supplementary Information: Supplementary material includes two Excel files: Supplementary Tables 1 and 2.
Author contributions: RM, MM5, and HEH conceived the project. RM, GSB, and HEH designed experiments. CS provided the first embryos for pilot studies and founding members for the striped mice lab colony. RM and MM5 collected samples and performed phenotypic characterization. RM performed all experiments with the exception of: RM and SB performed in vivo lentiviral injections; MM4 and MV performed protein-DNA binding assays. CH carried out the large scale RNA experiments, including construction and annotation of the de novo transcriptome, and design and analysis of the RNA-seq work. RM, GSB, and HEH wrote the paper with input from all authors.
References
- 1.Barsh GS. The genetics of pigmentation: from fancy genes to complex traits. Trends in Genetics. 1996;12:299–305. doi: 10.1016/0168-9525(96)10031-7. [DOI] [PubMed] [Google Scholar]
- 2.Jackson I, et al. Genetics and molecular biology of mouse pigmentation. Pigment Cell Research. 1994;7:73–80. doi: 10.1111/j.1600-0749.1994.tb00024.x. [DOI] [PubMed] [Google Scholar]
- 3.Mills MG, Patterson LB. Not just black and white: Pigment pattern development and evolution in vertebrates. Seminars in Cell & Developmental Biology. 2009;20:72–81. doi: 10.1016/j.semcdb.2008.11.012. [DOI] [PMC free article] [PubMed] [Google Scholar]
- 4.Candille SI, et al. Dorsoventral patterning of the mouse coat by Tbx15. Plos Biol. 2004;2:e3. doi: 10.1371/journal.pbio.0020003. [DOI] [PMC free article] [PubMed] [Google Scholar]
- 5.Rawls JF, Mellgren EM, Johnson SL. How the zebrafish gets its stripes. Developmental Biology. 2001;240:301–314. doi: 10.1006/dbio.2001.0418. [DOI] [PubMed] [Google Scholar]
- 6.Parichy DM. Pigment patterns: fish in stripes and spots. Current Biology. 2003;13:R947–950. doi: 10.1016/j.cub.2003.11.038. [DOI] [PubMed] [Google Scholar]
- 7.Singh AP, Nüsslein-Volhard C. Zebrafish stripes as a model for vertebrate colour pattern formation. Current Biology. 2015;25:R81–92. doi: 10.1016/j.cub.2014.11.013. [DOI] [PubMed] [Google Scholar]
- 8.Morris D. Animal Watching A Field Guide to Animal Behavior. 1990 [Google Scholar]
- 9.Cloudsley-Thompson JL. Multiple factors in the evolution of animal coloration. Naturwissenschaften. 1999;86:123–132. doi: 10.1007/s001140050584. [DOI] [PubMed] [Google Scholar]
- 10.Caro T, Izzo A, Reiner RC, Walker H, Stankowich T. The function of zebra stripes. Nature Communications. 2014;5:1–10. doi: 10.1038/ncomms4535. [DOI] [PubMed] [Google Scholar]
- 11.Brodie ED., III Correlational selection for color pattern and antipredator behavior in the Garter snake Thamnophis ordinoides. Evolution. 2005;46:1284–1298. doi: 10.1111/j.1558-5646.1992.tb01124.x. [DOI] [PubMed] [Google Scholar]
- 12.King RB. Color pattern polymorphism in the Lake Erie water snake, Nerodia sipedon insularum. 1987;41:241–255. doi: 10.1111/j.1558-5646.1987.tb05794.x. [DOI] [PubMed] [Google Scholar]
- 13.Caro T. The adaptive significance of coloration in mammals. BioScience. 2005;55:125–136. [Google Scholar]
- 14.Schradin C, et al. Social flexibility and social evolution in mammals: a case study of the African striped mouse (Rhabdomys pumilio) Molecular Ecology. 2012;21:541–553. doi: 10.1111/j.1365-294X.2011.05256.x. [DOI] [PubMed] [Google Scholar]
- 15.Steingrimsson E, Copeland NG, Jenkins NA. Melanocytes and the Microphthalmia transcription factor network. Annu Rev Genet. 2004;38:365–411. doi: 10.1146/annurev.genet.38.072902.092717. [DOI] [PubMed] [Google Scholar]
- 16.Berge ten D, et al. Mouse Alx3: An aristaless-like homeobox gene expressed during embryogenesis in ectomesenchyme and lateral plate mesoderm. Developmental Biology. 1998;199:11–25. doi: 10.1006/dbio.1998.8921. [DOI] [PubMed] [Google Scholar]
- 17.Beverdam A, Brouwer A, Reijnen M, Korving J, Meijlink F. Severe nasal clefting and abnormal embryonic apoptosis in Alx3/Alx4 double mutant mice. Development. 2001;128:3975–3986. doi: 10.1242/dev.128.20.3975. [DOI] [PubMed] [Google Scholar]
- 18.Twigg SRF, et al. Frontorhiny, a distinctive presentation of frontonasal dysplasia caused by recessive mutations in the ALX3 homeobox gene. Am J Hum Genet. 2009;84:698–705. doi: 10.1016/j.ajhg.2009.04.009. [DOI] [PMC free article] [PubMed] [Google Scholar]
- 19.Lakhwani S, García-Sanz P, Vallejo M. Alx3-deficient mice exhibit folic acid-resistant craniofacial midline and neural tube closure defects. Dev Biol. 2010;344:869–880. doi: 10.1016/j.ydbio.2010.06.002. [DOI] [PubMed] [Google Scholar]
- 20.Kaelin CB, et al. Specifying and sustaining pigmentation patterns in domestic and wild cats. Science. 2012;337:1536–1541. doi: 10.1126/science.1220893. [DOI] [PMC free article] [PubMed] [Google Scholar]
- 21.Peters EMJ, Tobin DJ, Botchkareva N, Maurer M, Paus R. Migration of melanoblasts into the developing murine hair follicle is accompanied by transient c-Kit expression. J Histochem Cytochem. 2002;50:751–766. doi: 10.1177/002215540205000602. [DOI] [PubMed] [Google Scholar]
- 22.Beronja S, Livshits G, Williams S, Fuchs E. Rapid functional dissection of genetic networks via tissue-specific transduction and RNAi in mouse embryos. Nature Medicine. 2010;16:821–827. doi: 10.1038/nm.2167. [DOI] [PMC free article] [PubMed] [Google Scholar]
- 23.Lee M, Goodall J, Verastegui C, Ballotti R, Goding CR. Direct regulation of the Microphthalmia promoter by Sox10 links Waardenburg-Shah syndrome (WS4)-associated hypopigmentation and deafness to WS2. J Biol Chem. 2000;275:37978–37983. doi: 10.1074/jbc.M003816200. [DOI] [PubMed] [Google Scholar]
- 24.Potterf SB, Furumura M, Dunn KJ, Arnheiter H, Pavan WJ. Transcription factor hierarchy in Waardenburg syndrome: regulation of MITF expression by SOX10 and PAX3. Hum Genet. 2000;107:1–6. doi: 10.1007/s004390000328. [DOI] [PubMed] [Google Scholar]
- 25.Elworthy S, Lister JA, Carney TJ, Raible DW, Kelsh RN. Transcriptional regulation of mitfa accounts for the sox10 requirement in zebrafish melanophore development. Development. 2003;130:2809–2818. doi: 10.1242/dev.00461. [DOI] [PubMed] [Google Scholar]
- 26.Perez-Villamil B, Mirasierra M, Vallejo M. The homeoprotein Alx3 contains discrete functional domains and exhibits cell-specific and selective monomeric binding and transactivation. Journal of Biological Chemistry. 2004;279:38062–38071. doi: 10.1074/jbc.M400800200. [DOI] [PubMed] [Google Scholar]
- 27.García-Sanz P, Fernández-Pérez A, Vallejo M. Differential configurations involving binding of USF transcription factors and Twist1 regulate Alx3 promoter activity in mesenchymal and pancreatic cells. Biochem J. 2013;450:199–208. doi: 10.1042/BJ20120962. [DOI] [PubMed] [Google Scholar]
- 28.Mirasierra M, Vallejo M. Glucose-dependent downregulation of glucagon gene expression mediated by selective interactions between ALX3 and PAX6 in mouse alpha cells. Diabetologia. 2016;1:1–10. doi: 10.1007/s00125-015-3849-4. [DOI] [PubMed] [Google Scholar]
- 29.Levy C, Khaled M, Fisher DE. MITF: master regulator of melanocyte development and melanoma oncogene. Trends Mol Med. 2006;12:406–414. doi: 10.1016/j.molmed.2006.07.008. [DOI] [PubMed] [Google Scholar]
- 30.Meredith RW, et al. Impacts of the Cretaceous terrestrial revolution and KPg extinction on mammal diversification. Science. 2011;334:521–524. doi: 10.1126/science.1211028. [DOI] [PubMed] [Google Scholar]
- 31.Reis dos M, et al. Phylogenomic datasets provide both precision and accuracy in estimating the timescale of placental mammal phylogeny. Proceedings of the Royal Society B: Biological Sciences. 2012;279:3491–3500. doi: 10.1098/rspb.2012.0683. [DOI] [PMC free article] [PubMed] [Google Scholar]
- 32.Huchon D, et al. Multiple molecular evidences for a living mammalian fossil. Proc Natl Acad Sci USA. 2007;104:7495–7499. doi: 10.1073/pnas.0701289104. [DOI] [PMC free article] [PubMed] [Google Scholar]
- 33.Vrieling H, Duhl DM, Millar SE, Miller KA, Barsh GS. Differences in dorsal and ventral pigmentation result fromregional expression of the mouse agouti gene. Proc Natl Acad Sci USA. 1994;91:5667–5671. doi: 10.1073/pnas.91.12.5667. [DOI] [PMC free article] [PubMed] [Google Scholar]
- 34.Manceau M, Domingues VS, Mallarino R, Hoekstra HE. The developmental role of Agouti in color pattern evolution. Science. 2011;331:1062–1065. doi: 10.1126/science.1200684. [DOI] [PubMed] [Google Scholar]
- 35.Schneider CA, Rasband WS, Eliceiri KW. NIH Image to ImageJ: 25 years of image analysis. Nat Methods. 2012;9:671–675. doi: 10.1038/nmeth.2089. [DOI] [PMC free article] [PubMed] [Google Scholar]
- 36.McCloy RA, et al. Partial inhibition of Cdk1 in G 2phase overrides the SAC and decouples mitotic events. Cell Cycle. 2014;13:1400–1412. doi: 10.4161/cc.28401. [DOI] [PMC free article] [PubMed] [Google Scholar]
- 37.Han R, Badem HP, Brissette JL, Weiner L. Redefining the skin's pigmentary system with a novel tyrosinase assay. Pigment Cell Research. 2002;15:290–297. doi: 10.1034/j.1600-0749.2002.02027.x. [DOI] [PubMed] [Google Scholar]
- 38.Spandidos A, Wang X, Wang H, Seed B. PrimerBank: a resource of human and mouse PCR primer pairs for gene expression detection and quantification. Nucleic Acids Research. 2009;38:D792–D799. doi: 10.1093/nar/gkp1005. [DOI] [PMC free article] [PubMed] [Google Scholar]
- 39.Livak KJ, Schmittgen TD. Analysis of relative gene expression data using real-time quantitative PCR and the 2(-Delta Delta C(T)) Method. Methods. 2001;25:402–408. doi: 10.1006/meth.2001.1262. [DOI] [PubMed] [Google Scholar]
- 40.Henrique D, et al. Expression of a Delta homologue in prospective neurons in the chick. Nature. 1995;375:787–790. doi: 10.1038/375787a0. [DOI] [PubMed] [Google Scholar]
- 41.Mallarino R, et al. Two developmental modules establish 3D beak-shape variation in Darwin's finches. Proc Natl Acad Sci USA. 2011;108:4057–4062. doi: 10.1073/pnas.1011480108. [DOI] [PMC free article] [PubMed] [Google Scholar]
- 42.Moffat J, et al. A lentiviral RNAi library for human and mouse genes applied to an arrayed airal high-content screen. Cell. 2006;124:1283–1298. doi: 10.1016/j.cell.2006.01.040. [DOI] [PubMed] [Google Scholar]
- 43.Kent WJ, et al. The Human Genome Browser at UCSC. Genome Research. 2002;12:996–1006. doi: 10.1101/gr.229102. [DOI] [PMC free article] [PubMed] [Google Scholar]
- 44.Schwartz S, et al. PipMaker---A Web Server for Aligning Two Genomic DNA Sequences. Genome Research. 2000;10:577–586. doi: 10.1101/gr.10.4.577. [DOI] [PMC free article] [PubMed] [Google Scholar]
- 45.Brudno M, et al. LAGAN and Multi-LAGAN: efficient tools for large-scale multiple alignment of genomic DNA. Genome Research. 2003;13:721–731. doi: 10.1101/gr.926603. [DOI] [PMC free article] [PubMed] [Google Scholar]
- 46.Schreiber E, Matthias P, Müller MM. Rapid detection of octamer binding proteins with ‘mini extracts’, prepared from a small number of cells. Nucleic Acids Research. 1989;17:6419. doi: 10.1093/nar/17.15.6419. [DOI] [PMC free article] [PubMed] [Google Scholar]
- 47.de la Serna IL, et al. The microphthalmia-associated transcription factor requires SWI/SNF enzymes to activate melanocyte-specific genes. J Biol Chem. 2006;281:20233–20241. doi: 10.1074/jbc.M512052200. [DOI] [PubMed] [Google Scholar]
Associated Data
This section collects any data citations, data availability statements, or supplementary materials included in this article.


