Significance
Although the oncogenic potential of β-catenin as a transcriptional factor is well-established, its role as a critical component of adherens junctions during tumorigenesis remains elusive. Using two transgenic mouse models of ErbB2-induced mammary tumorigenesis that recapitulate either luminal or basal human breast cancer, we show that β-catenin is required for proper adherens junction formation and that, consequently, β-catenin haploinsufficiency promotes aggressive mammary tumorigenesis. This haploinsufficient phenotype is unique to a basal ErbB2-driven model with a preexisting aberrant activation of β-catenin signaling, highlighting a tumor suppressor role of β-catenin, similar to other adherens junction proteins, in maintaining junctional integrity and a complex interplay between its junctional and transcriptional roles in facilitating tumor progression.
Keywords: ErbB2, breast cancer, transgenic model, beta-catenin, cell junction
Abstract
Aberrant activation of β-catenin through its activity as a transcription factor has been observed in a large proportion of human malignancies. Despite the improved understanding of the β-catenin signaling pathway over the past three decades, attempts to develop therapies targeting β-catenin remain challenging, and none of these targeted therapies have advanced to the clinic. In this study, we show that part of the challenge in antagonizing β-catenin is caused by its dual functionality as a cell adhesion molecule and a signaling molecule. In a mouse model of basal ErbB2 receptor tyrosine kinase 2 (ErbB2)-positive breast cancer (ErbB2KI), which exhibits aberrant β-catenin nuclear signaling, β-catenin haploinsufficiency induced aggressive tumor formation and metastasis by promoting the disruption of adherens junctions, dedifferentiation, and an epithelial to mesenchymal transition (EMT) transcriptional program. In contrast to the accelerated tumor onset observed in the haploid-insufficient ErbB2 tumors, deletion of both β-catenin alleles in the ErbB2KI model had only a minor impact on tumor onset that further correlated with the retention of normal adherens junctions. We further showed that retention of adherens junctional integrity was caused by the up-regulation of the closely related family member plakoglobin (γ-catenin) that maintained both adherens junctions and the activation of Wnt target genes. In contrast to the ErbB2KI basal tumor model, modulation of β-catenin levels had no appreciable impact on tumor onset in an ErbB2-driven model of luminal breast cancer [murine mammary tumor virus promoter (MMTV-NIC)]. These observations argue that the balance of junctional and nuclear β-catenin activity has a profound impact on tumor progression in this basal model of ErbB2-positive breast cancer.
The canonical Wnt/β-catenin pathway governs many cellular processes crucial to both normal development and cancer progression (1). β-Catenin is a key component in this pathway and plays two distinct roles in cells: as an adhesion protein and as a transcriptional coactivator. At the plasma membrane, β-catenin links classical Cadherins to α-catenin and the cytoskeletal network to form the basis of adherens junctions (2). On Wnt ligand engagement, the β-catenin degradation machinery, including APC, Axin, and GSK3β, is disrupted, allowing the subsequent accumulation of β-catenin in the nucleus, where it drives the transcription of a large number of genes involved in proliferation and differentiation (1). A growing body of evidence has highlighted a major interplay between these two functions of β-catenin (reviewed in refs. 3 and 4). Numerous studies have shown that the disruption of adherens junctions can promote the nuclear translocation of β-catenin and its transcriptional activity (5–7). However, these studies indicate that this cell adhesion-mediated activation of β-catenin only occurs when the Wnt pathway is active (5–7). Conversely, β-catenin can influence cell adhesion dynamics by activating genes, such as Twist, Snai1, Adam10, and MMPs, which repress expression of Cadherin at both the transcriptional and protein levels, thus creating a feed-forward loop that further enhances β-catenin’s transcriptional activity (reviewed in ref. 3).
As a result, the multiple functions of β-catenin must be tightly regulated to maintain proper tissue homeostasis. Aberrant β-catenin activity has been observed in many forms of human malignancies (8). In colorectal cancer, loss of function mutations in components of the degradation complex (APC and AXIN2) or activating mutations in β-catenin result in constitutive activation of downstream target genes (8). In breast cancer, these mutations are extremely rare; however, aberrant activation of β-catenin is observed in aggressive basal-like and ErbB2-positive breast cancer and associated with poor clinical outcome (9, 10). In contrast to colorectal cancer, β-catenin signaling is hyperactivated in breast cancer by alternative mechanisms, such as aberrant expression of Wnt ligands or the loss of negative regulators (11). Although there has been much research focused on the signaling function of β-catenin, the contribution of its adhesion function to tumorigenesis remains poorly understood.
Elevated expression of ErbB2 receptor tyrosine kinase 2 (ErbB2) through genomic amplification and/or overexpression at the protein level occurs in 20–30% of breast cancer patients and strongly correlates with poor clinical outcome (12). Transgenic mice expressing activated variants of ErbB2 in the mammary epithelium develop mammary tumors that recapitulate multiple molecular subtypes of human breast cancer. Expression of an Erbb2 mutant under the control of the murine mammary tumor virus promoter (MMTV-Neu-IRES-Cre or MMTV-NIC model) promotes highly metastatic mammary tumors that molecularly resemble human luminal breast cancer (10, 13). In contrast, the knockin of an Erbb2 mutant into its endogenous promoter (ErbB2KI model) promotes mammary tumorigenesis after a long latency period (14). Interestingly, these ErbB2KI tumors exhibit multiple features of the human ErbB2-amplified basal subtype, including genomic amplification of the Erbb2 locus and a strong basal molecular signature that correlates with activation of canonical β-catenin signaling (10).
To further study the in vivo roles of β-catenin during ErbB2-mediated mammary tumorigenesis, both the luminal MMTV-NIC and basal ErbB2KI genetic engineered mouse models (GEMMs) were interbreed with a separate strain of mice carrying β-catenin conditional alleles. Because both MMTV-NIC and ErbB2KI tumor models coexpress Cre recombinase and ErbB2 in the mammary epithelium, β-catenin levels would be specifically disrupted in the emerging ErbB2-positive tumors in both GEMMs. The results revealed that a complete disruption of β-catenin had little impact on the development of mammary tumors in both ErbB2 tumor models. We showed that the closely related plakoglobin (γ-catenin) could functionally replace both the adherens junction and transcriptional functions of β-catenin in both of these ErbB2 GEMMs. Interestingly, in the basal ErbB2KI GEMM, a 50% reduction in the β-catenin pool resulted in a dramatic acceleration of tumor onset. Tumor progression in these strains was associated with the disruption of adherens junctions, dedifferentiation, and activation of an epithelial to mesenchymal transition (EMT) transcriptional program that was further correlated with nuclear localization of β-catenin. By contrast, in the luminal MMTV-NIC model, which lacks nuclear β-catenin signaling, β-catenin heterozygosity had little impact on mammary tumorigenesis. Taken together, our data indicate that, in the basal category of ErbB2-positive breast cancer, alteration of β-catenin levels can have a dramatic impact on ErbB2 tumor progression, highlighting the need for therapeutic strategies that appropriately target signaling activity of β-catenin.
Results
The Subcellular Distribution of β-Catenin in Basal ErbB2KI Tumors has a Profound Impact on ErbB2-Mediated Mammary Tumor Progression.
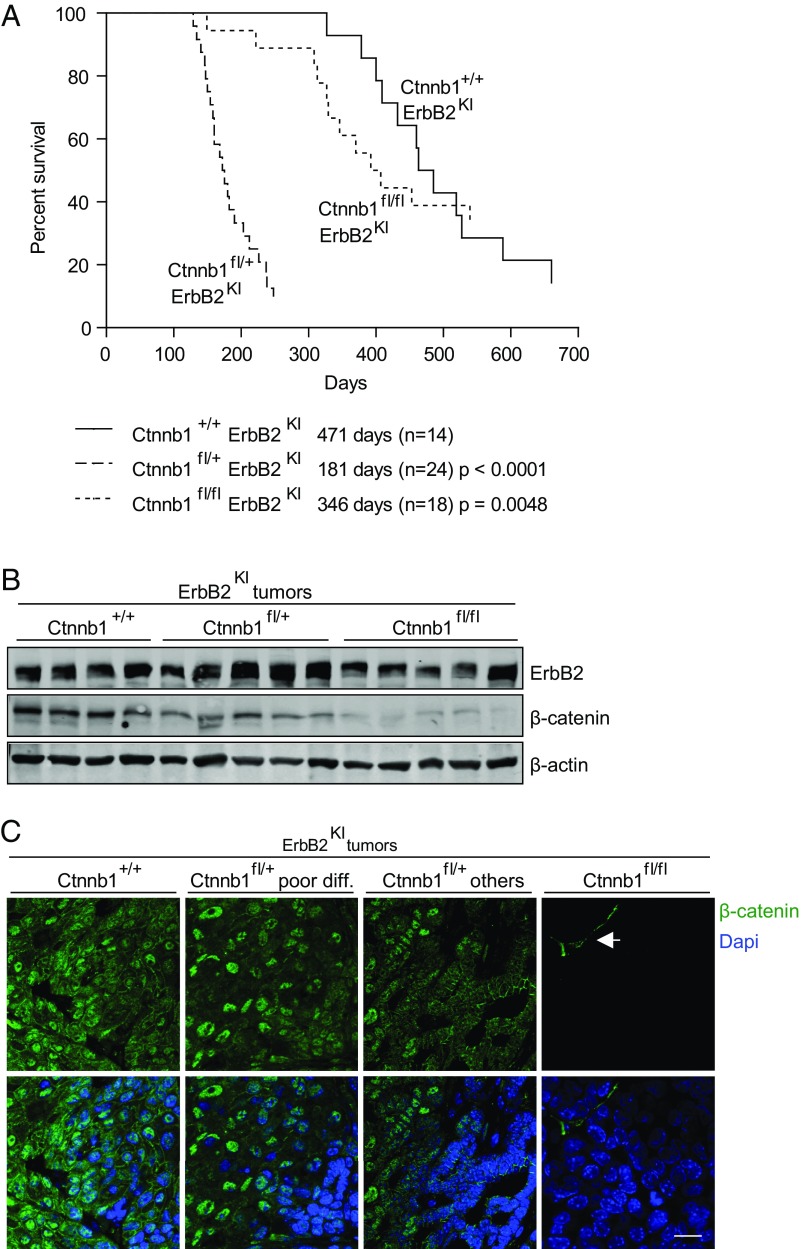
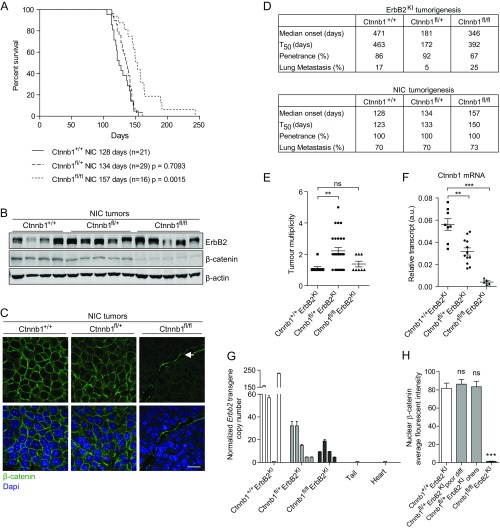
To investigate the in vivo roles of β-catenin in ErbB2-induced mammary tumorigenesis, we interbred two GEMMs of ErbB2-positive breast cancer that recapitulate either the luminal (MMTV-NIC) (13) or basal (ErbB2KI) (14) subtypes of ErbB2-positive breast cancer with a mouse model harboring a heterozygous or homozygous conditional β-catenin allele (Ctnnb1fl/+ or Ctnnb1fl/fl) (15). In both ErbB2 GEMMs, mammary gland-specific expression of the ErbB2 oncogene is strictly coupled with Cre-mediated deletion of β-catenin. Thus, every mammary epithelial cell that expresses ErbB2 will ablate conditional β-catenin allele(s). In the ErbB2KI GEMM, mammary epithelial-specific disruption of both β-catenin alleles had no significant impact on the tumor onset (Fig. 1A and Fig. S1D). However, loss of a single β-catenin allele in ErbB2KI mice resulted in a dramatic acceleration of tumor onset (181 d) compared with the parental ErbB2KI and the Ctnnb1fl/flErbB2KI strain, with average onsets of 471 and 346 d, respectively (Fig. 1A and Fig. S1D). In addition, β-catenin haploid-insufficient mice developed multifocal tumors in contrast to the focal tumors observed in the parental mice (Fig. S1E). To confirm that β-catenin deletion did not impact ErbB2 levels, we performed immunoblots and RT-PCR analyses on ErbB2KI tumors. Consistent with the corresponding genotypes, all tumors expressed ErbB2, with the expected reduction in β-catenin levels (Fig. 1B and Fig. S1 B and F). We have previously shown that ErbB2KI tumors often have genomic amplification of the Erbb2 transgene, which resembles a critical genetic event in human ErbB2-positive breast cancer (14). To assess whether Erbb2 amplification is still required for tumorigenesis on the loss of β-catenin, we performed an RT-PCR–based quantification of Erbb2 transgene copy number and found that all three cohorts of tumors had a variable gain of Erbb2 copy number (Fig. S1G). This result suggests that amplification of the Erbb2 transgene is an essential requirement for tumor development with or without β-catenin. In addition, immunofluorescent analyses with a β-catenin–specific antibody revealed that loss of a single β-catenin allele had an impact on the subcellular distribution of β-catenin pools. In contrast to the control ErbB2KI tumors, where β-catenin can be detected in both cell junctional and nuclear compartments, Ctnnb1fl/+ErbB2KI tumors displayed a decrease in the membrane/junctional pool of β-catenin, with no apparent change in the nuclear pool (Fig. 1C). A quantitative analysis of β-catenin localization from immunohistofluorescence (IHF) images further supported comparable nuclear pools between these two groups of tumors, indicating that the remaining pool of β-catenin is engaged primarily in nuclear activity (Fig. S1H). However, a similar heterozygous deletion of β-catenin had no impact on either tumor progression in the luminal MMTV-NIC model (Fig. S1 A and D) or β-catenin subcellular distribution (Fig. S1C). Taken together, these data argue that β-catenin is dispensable for ErbB2 tumor progression in both luminal and basal categories of ErbB2 mammary tumors. However, alteration of β-catenin dosage in the basal ErbB2KI GEMM can result in an acceleration of tumor onset by altering the subcellular distribution of β-catenin to the nuclear compartment.
Fig. 1.
Effect of β-catenin deletion on ErbB2KI mammary tumorigenesis. (A) Kaplan–Meier analysis of tumor onset shows the consequences of β-catenin deletion during ErbB2KI tumorigenesis. Statistical significance determined by Student’s t test. Median tumor onsets are indicated for each cohort. (B) ErbB2 expression and loss of β-catenin expression were confirmed by immunoblot analyses. (C) β-Catenin (green) was visualized by IHF staining on paraffin-embedded end-point mammary tumors, and nuclei were visualized by DAPI staining. Images were acquired by confocal microscopy. Arrow points to the stromal component of tumors. Ctnnb1+/+ErbB2KI, n = 6; Ctnnb1fl/+ErbB2K poorly differentiated, n = 5; Ctnnb1fl/+ErbB2KI others, n = 3; Ctnnb1fl/flErbB2KI, n = 5. (Scale bar: 20 μm.)
Fig. S1.
Tumor kinetics. (A) Kaplan–Meier analysis of tumor onsets shows the consequences of β-catenin deletion during NIC tumorigenesis. Statistical significance determined by Student’s t test. Median tumor onsets (days) are indicated for each mouse cohort. (B) Immunoblot analysis confirms expression of ErbB2 and loss of β-catenin. (C) β-Catenin was visualized by IHF. Arrow points to stromal cells. Ctnnb1+/+NIC, n = 5; Ctnnb1fl/+NIC, n = 5; Ctnnb1fl/flNIC, n = 5. (Scale bar: 20 μm.) (D) Summary of tumor kinetics and lung metastasis of both ErbB2KI and NIC models. (E) Number of tumors at end point (6 wk postpalpation) in ErbB2KI model. **P < 0.005 (Student's t test). (F) Transcript levels of β-catenin (Ctnnb1) were assessed by RT-PCR to confirm gene KO. **P < 0.005 (Student’s t test); ***P < 0.0005 (Student’s t test). (G) Copy number of Erbb2 transgene was assessed by RT-PCR with genomic DNA using primers specific to Erbb2 transgene and normalized to another genomic location (a reference location) in ErbB2KI tumors. DNA extracted from tail and heart served as a negative control for Erbb2 amplification. (H) Nuclear β-catenin fluorescent intensity was quantified from IHF images. At least 30 nuclei were scored and averaged for each tumor. Ctnnb1+/+ErbB2KI, n = 4; Ctnnb1fl/+ErbB2KI poor differentiation, n = 4; Ctnnb1fl/+ErbB2KI others, n = 3; Ctnnb1fl/flErbB2KI, n = 3. Error bar: SEM. ns, Not significant. ***P < 0.0005 (Student’s t test).
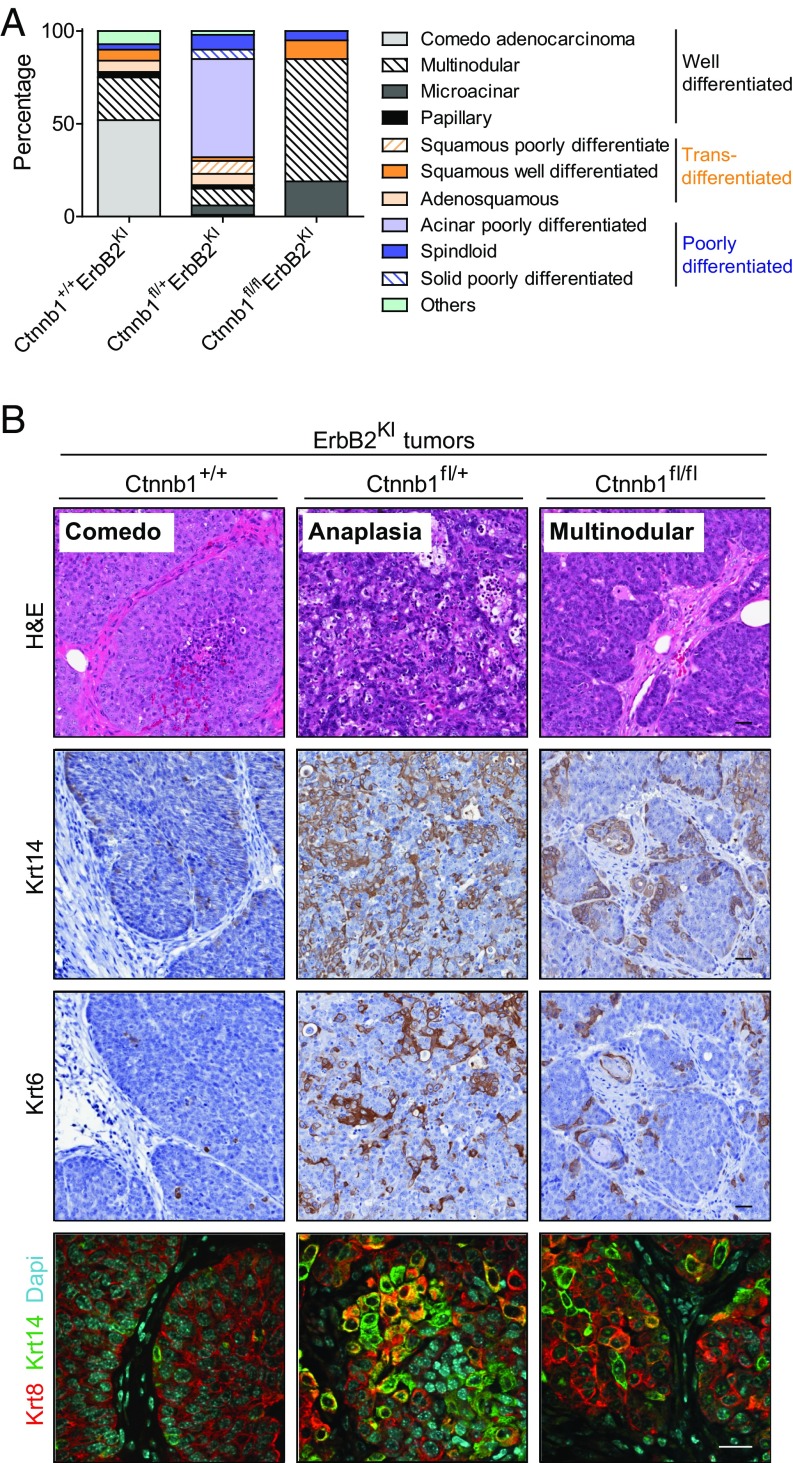
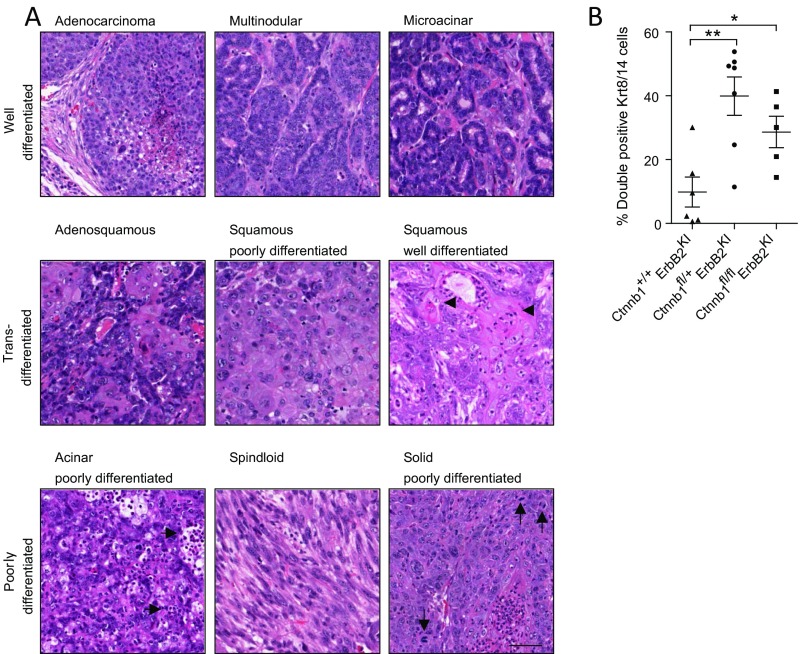
In contrast to the luminal MMTV-NIC–derived tumors, which exclusively express the luminal keratins, the basal ErbB2KI tumors exhibit a high degree of pathological intratumoral heterogeneity with expression of both luminal and basal keratins (10, 16). Histological analyses of the haploid-insufficient β-catenin tumors revealed a striking range of different histopathologies (Fig. 2 and Fig. S2A). Although 75% of ErbB2KI tumors displayed differentiated tumor pathologies, such as comedo and multinodular adenocarcinomas, the majority of β-catenin–deficient ErbB2KI tumors (80%) were poorly differentiated. Notably, poorly differentiated acinar tumors represented the predominant pathology among Ctnnb1fl/+ErbB2KI tumors and accounted for 53% of all tumors of this genotype (Fig. 2A). To further elucidate the cellular origin of these tumors, we performed immunohistochemical staining for myoepithelial marker Krt14 and mammary stem cell marker Krt6. We found that the poorly differentiated Ctnnb1fl/+ErbB2KI tumors exhibited an increase in both of these populations compared with the control tumors (Fig. 2B). Similarly, immunofluorescent analyses for luminal marker Krt8 and myoepithelial marker Krt14 confirmed an expansion of this double-positive population in Ctnnb1fl/+ErbB2KI tumors (Fig. 2B and Fig. S2B), indicating an effect of β-catenin heterozygous loss on the differentiation status of ErbB2-driven mammary tumor cells in this model. It is unclear how this population emerged, whether through an expansion of a progenitor population or dedifferentiation of a luminal population. Although heterozygous loss of β-catenin had a major impact on the pathology of the tumors, a complete loss of β-catenin resulted in an induction of differentiated tumor phenotypes (Fig. 2), with a corresponding reduction in the double Krt8/14 cell population (Fig. S2B). Taken together, these data suggest that β-catenin deficiency may alter the progenitor population and thus, promotes a switch from well-differentiated tumors to poorly differentiated tumors with diverse pathology and features of the basal breast cancer subtype.
Fig. 2.
Loss of β-catenin promotes a diverse spectrum of tumor pathologies, including features of poor differentiation and altered differentiation status. (A) Tumor pathologies are classified into three main categories: well-differentiated with epithelial features, transdifferentiated with squamous features, and poorly differentiated. Percentage of each pathology subtype is quantified from all tumors collected: Ctnnb1+/+ErbB2KI, n = 30; Ctnnb1fl/+ErbB2KI, n = 80; Ctnnb1fl/flErbB2KI, n = 21. (B) H&E staining (row 1) of the most common form of pathology for each genotype. Tumors were stained for Krt14 (row 2) and Krt6 (row 3) by IHC and costained for Krt8/14 by IHF (row 4). Ctnnb1+/+ErbB2KI, n = 6; Ctnnb1fl/+ErbB2KI, n = 7; Ctnnb1fl/flErbB2KI, n = 5. (Scale bar: 20 μm.)
Fig. S2.
Loss of β-catenin promotes a diverse spectrum of tumor pathologies, including features of poor differentiation and an expansion of a bipotent progenitor population. (A) End-point ErbB2KI tumors, regardless of β-catenin KO status, were subjected to H&E staining to illustrate various pathological subtypes. Tumor pathologies are classified into three main categories: well-differentiated, transdifferentiated, and poorly differentiated. Well-differentiated tumors still retain features of normal epithelial cell organization, such as cell to cell contact and partially intact basement membrane. Microacinar-type tumors contain tumor units resembling normal ducts. Transdifferentiated tumors contain cells with squamous morphology and often abundant keratin deposits (arrowheads). Poorly differentiated acinar tumors exhibit abundant leukocyte infiltration (horizontal arrows) as well as tumor cells that fail to arrange in organized structures, such as those observed in well-differentiated acinar type. Less common forms of poorly differentiated tumors include spindloid (EMT-like) tumors and solid tumors with leukocyte infiltration, pleomorphic nuclei, and abundant mitotic figures (vertical arrows). (Scale bar: 40 μm.) (B) End-point tumors were costained for Krt8 and Krt14 by IHF. Confocal images of 10 fields within the tumors were taken, and double-positive Krt8/14 cells were scored and presented as percentages of the total number of cells. Error bar: SEM. *P < 0.05 (Student’s t test); **P < 0.005 (Student’s t test).
Plakoglobin Can Functionally Compensate for the Loss of β-Catenin.
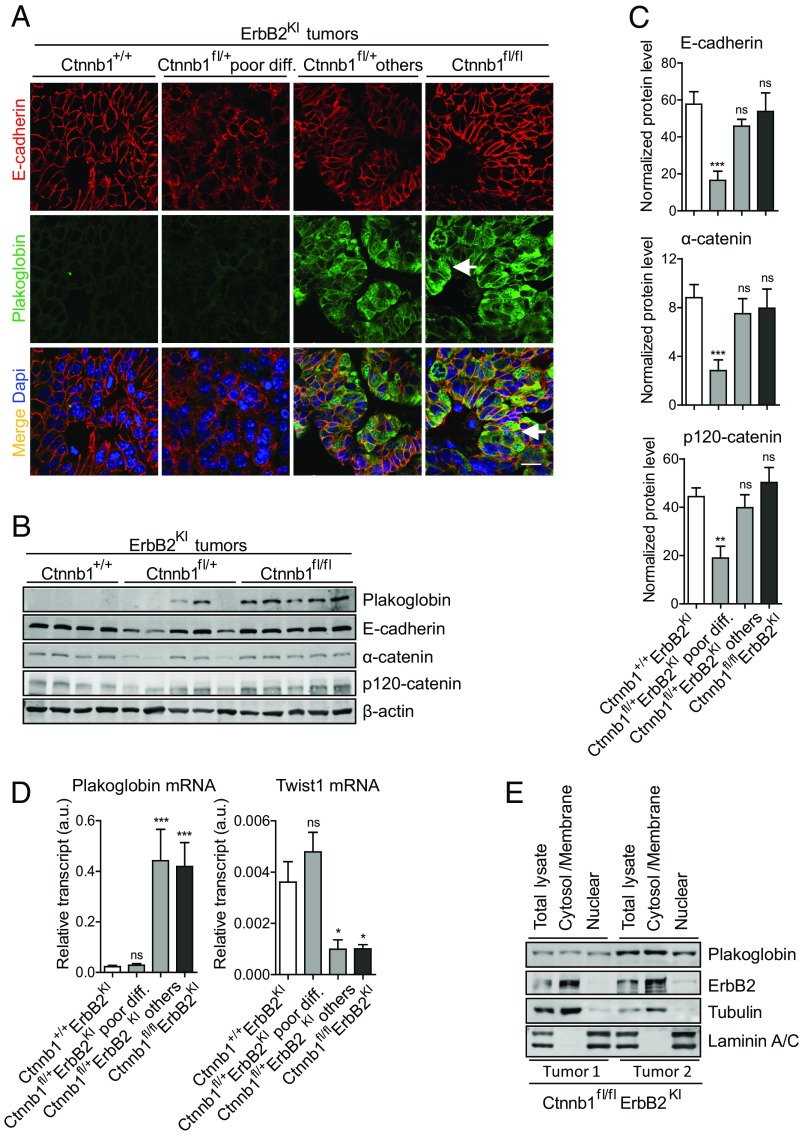
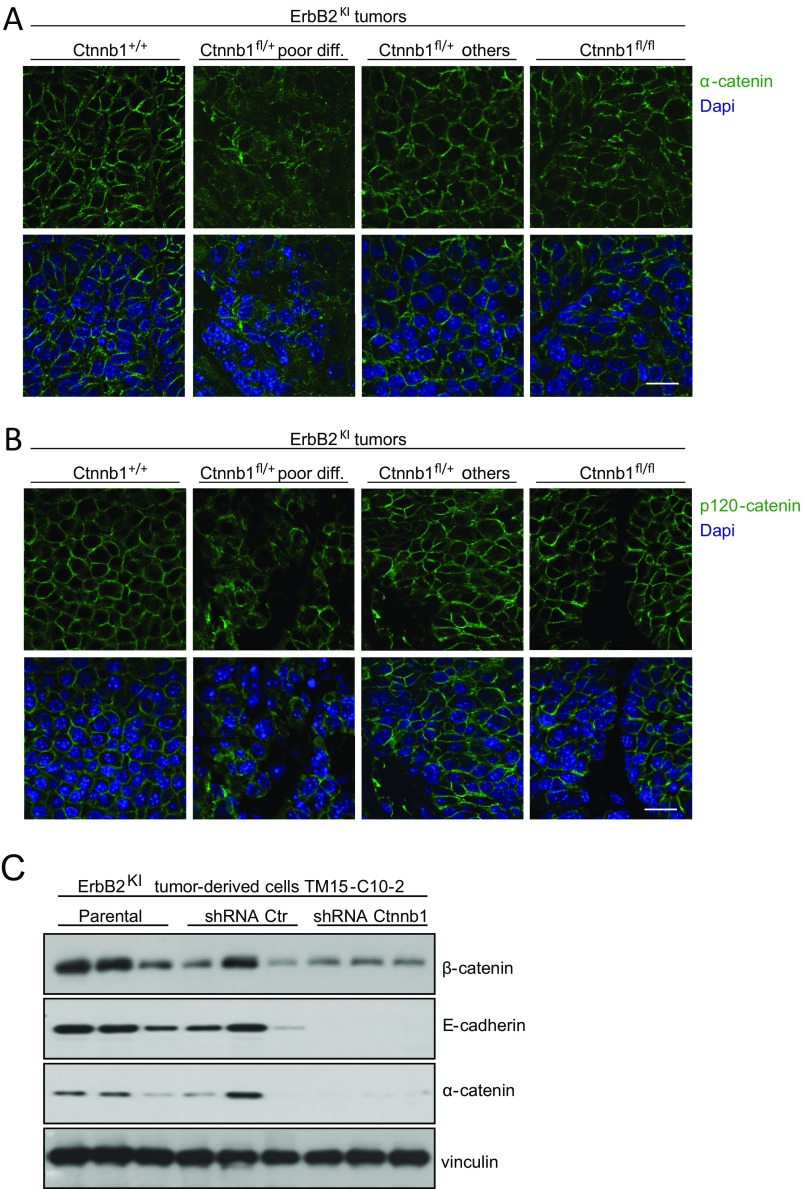
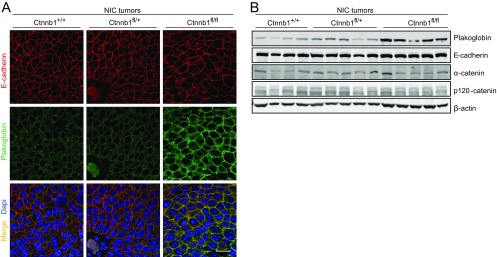
Given that β-catenin is an essential component of adherens junctions, we evaluated the consequence of a complete KO of β-catenin on cell adhesion by IHF staining for components of adherens junctions, including E-cadherin, p120-catenin, and α-catenin. Surprisingly, the β-catenin null tumors exhibited adherens junctions that were indistinguishable from the parental ErbB2KI tumors (Fig. 3A and S3 A and B). Immunoblot analysis showed that a complete loss of β-catenin did not affect the expression of any of these three adherens junction proteins (Fig. 3 B and C). One possible explanation for the lack of an obvious phenotype in the β-catenin null ErbB2KI tumors is a potential compensation by the closely related homolog plakoglobin (Jup). Consistent with this hypothesis, previous studies have shown that KO of β-catenin often results in the up-regulation of plakoglobin as a compensatory mechanism (17–19). To ascertain whether up-regulation of plakoglobin in β-catenin null ErbB2KI tumors was responsible for the maintenance of adherens junctions, we measured both transcript and protein levels of plakoglobin in ErbB2 tumors using both immunoblot and immunofluorescent analyses. The results revealed that the β-catenin null ErbB2KI tumors expressed elevated levels of plakoglobin protein and mRNA transcript (Fig. 3 A, B, and D). Significantly, immunofluorescent analysis showed that plakoglobin colocalized with E-cadherin at the plasma membrane, indicating its engagement in adherens junctions (Fig. 3A). Previous studies have shown that, similar to β-catenin, plakoglobin interacts with both E-cadherin and α-catenin to form adherens junctions (19, 20). We observed a similar phenomenon in the MMTV-NIC mice, in which β-catenin deficiency also promoted an up-regulation of plakoglobin that was associated with adherens junctions (Fig. S4).
Fig. 3.
A heterozygous loss of β-catenin results in defective adherens junctions, whereas a homozygous β-catenin deletion promotes plakoglobin up-regulation to maintain adherens junctions. (A) Adherens junctions were visualized by IHF staining for E-cadherin and costained with plakoglobin, a common component of both adherens and desmosomal junctions. Arrows point to cells with nuclear plakoglobin signal. Haploid-insufficient β-catenin tumors exhibited a high degree of heterogeneity and therefore, were further categorized into two main groups: poorly differentiated tumors (low plakoglobin) and others (high plakoglobin), consisting of mostly well-differentiated tumors. Ctnnb1+/+ErbB2KI, n = 6; Ctnnb1fl/+ErbB2KI poorly differentiated, n = 5; Ctnnb1fl/+ErbB2KI others, n = 3; Ctnnb1fl/flErbB2KI, n = 5. (Scale bar: 20 μm.) (B) Tumor lysates were subjected to immunoblot analysis for components of adherens junctions. Notably, Ctnnb1fl/+ErbB2KI tumors with high plakoglobin displayed similar levels of all adherens junction proteins assessed. (C) Levels of adherens junction proteins were assessed using a larger sample size by immunoblot analysis and quantified using LI-COR Odyssey Software. Ctnnb1+/+ErbB2KI, n = 7; Ctnnb1fl/+ErbB2KI poorly differentiated, n = 7; Ctnnb1fl/+ErbB2KI others, n = 6; Ctnnb1fl/flErbB2KI, n = 6. Error bar: SEM. **P < 0.005 (Student’s t test); ***P < 0.0005 (Student's t test). (D) Transcript levels of plakoglobin (Jup) and Twist1 were assessed by RT-PCR. Data were normalized to Gapdh. Ctnnb1+/+ErbB2KI, n = 9; Ctnnb1fl/+ErbB2KI poorly differentiated, n = 8; Ctnnb1fl/+ErbB2KI others, n = 5; Ctnnb1fl/flErbB2KI, n = 5. Error bar: SEM. *P < 0.05 (Student’s t test); ***P < 0.0005 (Student’s t test). (E) Ctnnb1fl/flErbB2KI tumor cells were subjected to cellular fractionation to separate nuclear fraction from the cytosol/membrane fraction to show the subcellular localization of plakoglobin. Tubulin and ErbB2 are markers for cytosol and membrane fractions. Laminin A/C is a marker for a nuclear fraction. ns, Not significant.
Fig. S3.
Reduction of β-catenin level results in defective adherens junctions. (A and B) Adherens junctions were visualized by IHF staining for p120-catenin and α-catenin components of adherens junctions. Ctnnb1+/+ErbB2KI, n = 6; Ctnnb1fl/+ErbB2KI poorly differentiated, n = 5; Ctnnb1fl/+ErbB2KI others, n = 3; Ctnnb1fl/flErbB2KI, n = 5. (Scale bar: 20 μm.) (C) ErbB2KI-derived tumor cells (TM15-C10-2) and stable cells expressing nonsilencing shRNA control or Ctnnb1-specific shRNA were injected into mammary fat pad of athymic mice to allow tumor formation. At end-point burden, tumors were collected, and protein lysate was subjected to immunoblot analysis for indicated proteins.
Fig. S4.
Both heterozygous and homozygous losses of β-catenin have no effect on adherens junctions in NIC tumors. (A) IHF staining for E-cadehrin and plakoglobin showed that β-catenin deficiency had no impact on adherens junctions. E-cadehrin and plakoglobin colocalize at the plasma membrane. Ctnnb1+/+NIC, n = 5; Ctnnb1fl/+NIC, n = 5; Ctnnb1fl/flNIC, n = 5. (Scale bar: 20 μm.) (B) Tumor lysate was subjected to immunoblot analysis for components of adherens junctions.
Previous studies have indicated that plakoglobin up-regulation is inversely correlated with expression of Twist1, a repressor of plakoglobin transcription (21). To explore whether Twist1 could account for the up-regulation of plakoglobin, we next measured the levels of Twist1 in the β-catenin–deficient tumors. Consistent with this expectation, we showed that the β-catenin null ErbB2KI tumors that expressed elevated levels of plakoglobin exhibited a corresponding reduction in Twist1 transcript levels (Fig. 3D). Analyses of the haploid-insufficient β-catenin ErbB2KI tumors revealed a more complex and varied phenotype with respect to plakoglobin and Twist1 expression. In the poorly differentiated category of haploid-insufficient β-catenin ErbB2KI tumors, Twist1 expression was maintained, resulting in the suppression of plakoglobin expression (Fig. 3D). However, in tumors that exhibited the differentiated mammary tumors, we observed an inverse pattern of Twist1 and plakoglobin expression (Fig. 3D), indicating that the levels of these key transcriptional regulators had a direct impact on the differentiation status of these tumors. Indeed, Twist1 is a known inhibitor of epithelial cell differentiation (21). Taken together, these observations indicate that plakoglobin can functionally replace β-catenin in restoring adherens complex formation.
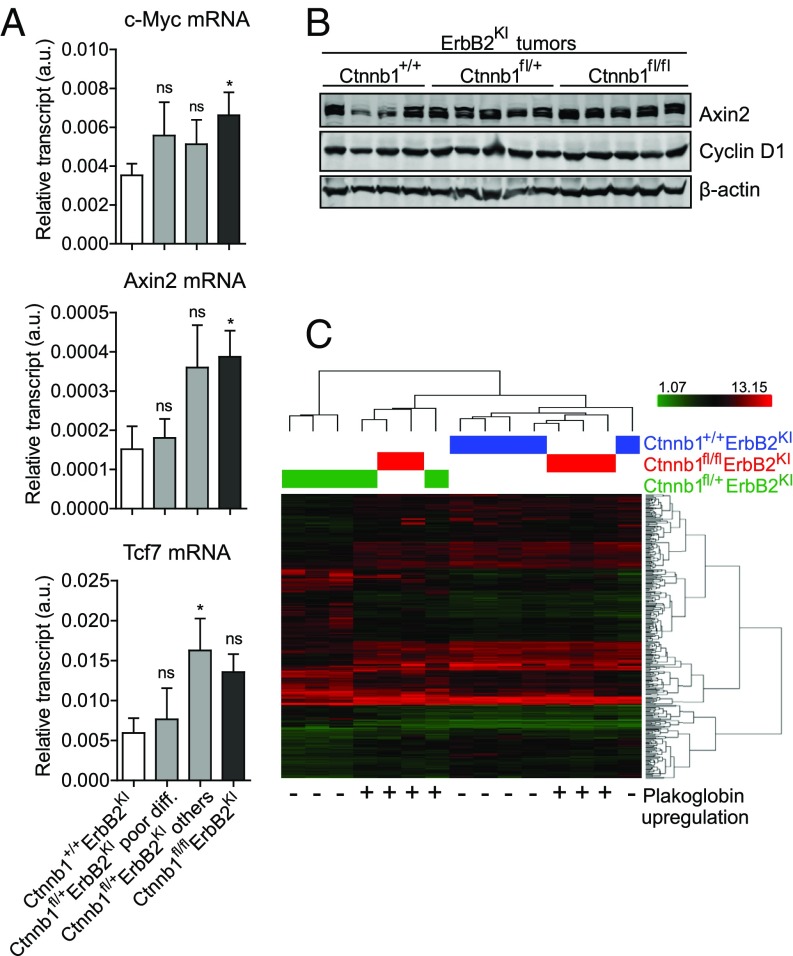
Like β-catenin, plakoglobin shares the ability to activate Tcf/Lef-mediated transcription in response to Wnt ligand stimulation (22–24). To ascertain whether plakoglobin can be recruited to the nucleus to activate β-catenin target genes, we first assessed whether plakoglobin could be detected in the nuclear compartment. In contrast to the β-catenin null MMTV-NIC tumors, where plakoglobin was exclusively located at the adherens junctions (Fig. S4A), plakoglobin staining was detected in both the nucleus and adherens junctions in the Ctnnb1fl/flErbB2KI tumors, indicating that it could functionally replace nuclear β-catenin activity (Fig. 3A). Cellular fractionation analysis further confirmed the presence of plakoglobin in both compartments (Fig. 3E). Consistent with plakoglobin’s role as a transcription factor (22), the β-catenin null ErbB2 tumors retained expression of a number of known β-catenin target genes, including c-Myc, Axin2, Tcf7, and Ccnd1 (Fig. 4 A and B). This observation is further supported by comparing the gene expression profiles of β-catenin–deficient and –proficient ErbB2KI tumors (Fig. 4C). Unsupervised clustering analysis showed β-catenin null tumors grouped closely with β-catenin–proficient tumors, indicating that, on ablation of β-catenin, plakoglobin can activate a similar set of target genes. Together, these observations argue that plakoglobin can functionally replace both the junctional and transcriptional functions of β-catenin.
Fig. 4.
Plakoglobin maintains β-catenin–dependent transcription. (A) Transcript levels of selected β-catenin downstream target genes c-Myc, Axin2, and Tcf7 were assessed by RT-PCR. Data were normalized to Gapdh. Ctnnb1+/+ErbB2KI, n = 8; Ctnnb1fl/+ErbB2KI poor differentiation, n = 6; Ctnnb1fl/+ErbB2KI others, n = 6; Ctnnb1fl/flErbB2KI, n = 5. Error bar: SEM. ns, Not significant. *P < 0.05 (Student’s t test). (B) Immunoblot analysis illustrates comparable protein levels of β-catenin target genes Axin2 and Cyclin D1. (C) The heat map shows unsupervised clustering analysis of gene expression profile from end-point tumors. Expression of plakoglobin is indicated as + (high or up-regulated) or − (low or unexpressed) to show that expression of plakoglobin alone is sufficient to segregate heterogeneous Ctnnb1fl/+ErbB2KI tumors into two distinct groups: (i) high plakoglobin tumors that are well-differentiated and cluster with Ctnnb1+/+ErbB2KI tumors and (ii) low plakoglobin tumors that are poorly differentiated and form their own unique group.
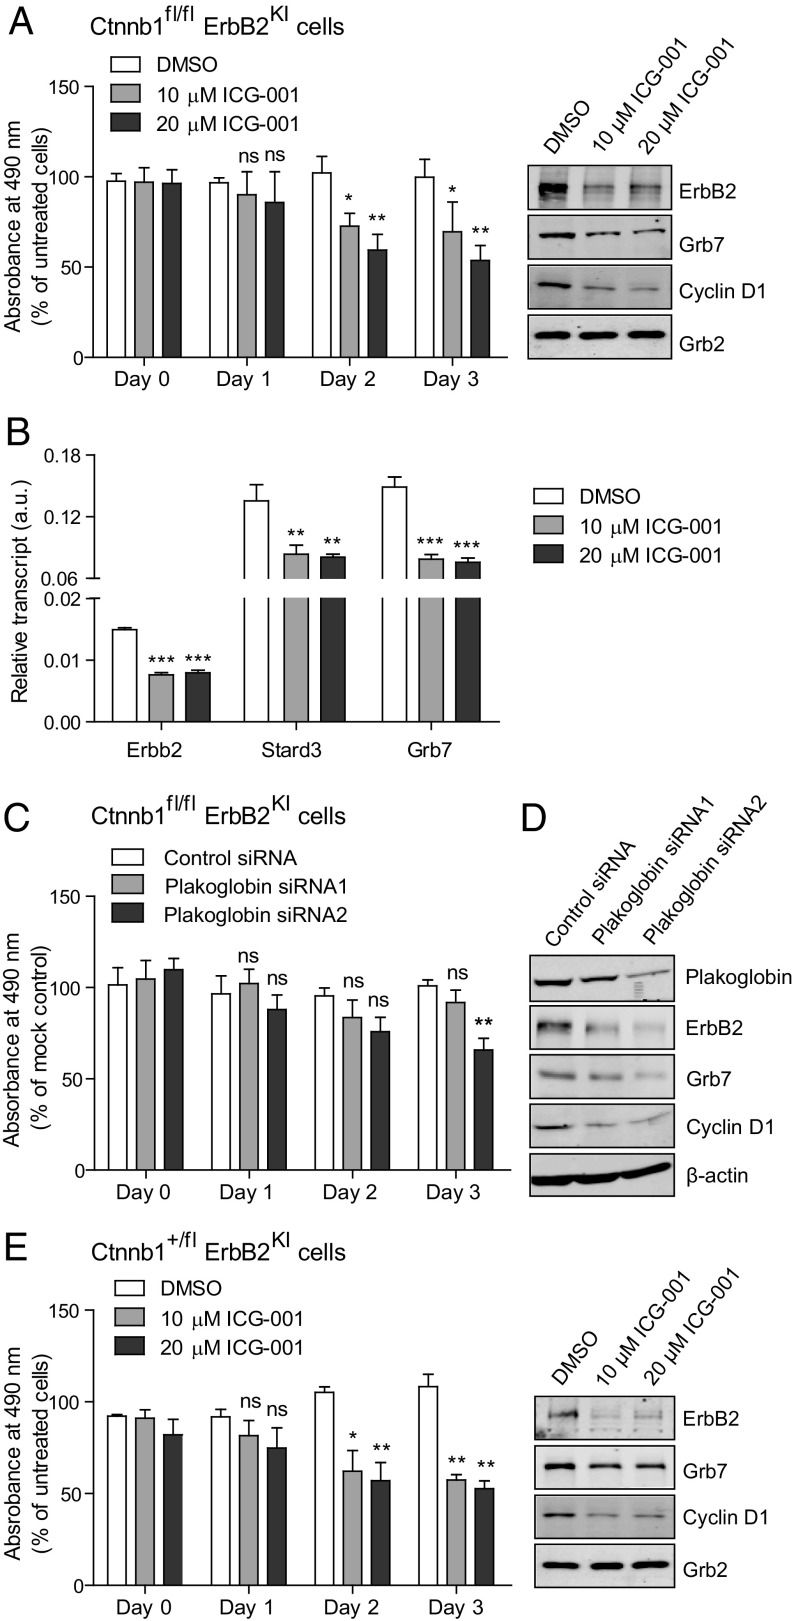
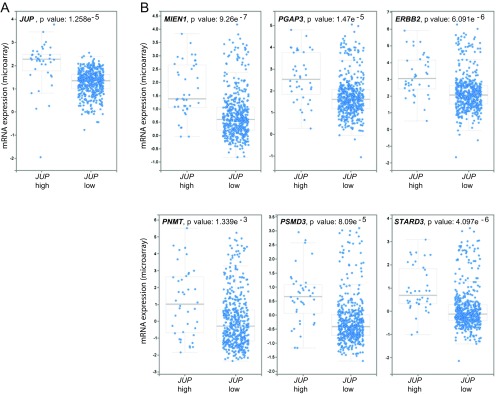
To further validate the role of plakoglobin in maintaining the transformed phenotype in the β-catenin–deficient ErbB2 tumor cells, we evaluated whether inhibition of plakoglobin activity through either small molecule inhibitors or RNAi would diminish the proliferative properties of Ctnnb1fl/flErbB2KI tumor cells. One inhibitor that has been used to inhibit β-catenin family members is ICG-001. Although ICG-001 was initially identified to be a potent antagonist of β-catenin, it was later found to inhibit the transcriptional activity of plakoglobin as well (25). The results revealed that treatment of ErbB2KI tumor cells lacking both β-catenin alleles with ICG-001 inhibitor resulted in significant impairment of the proliferative capacity of these tumor cells (Fig. 5A). Our previous studies with the ICG-001 inhibitor in an ErbB2KI cell line had shown that inhibition of β-catenin activity resulted in direct transcriptional inhibition of components of Erbb2 amplicon, including Erbb2, Grb7, and Stard3 (7). Consistent with these previous analyses, RT-PCR analyses of ICG-001–treated β-catenin null ErbB2KI cells resulted in profound decrease in Erbb2, Grb7, and Stard3 transcription, suggesting that, similar to β-catenin, plakoglobin can also regulate the Erbb2 amplicon (Fig. 5 A and B). To further confirm that IGC-001 was targeting plakoglobin in the β-catenin null tumor cells, we also used RNAi approaches that specifically target plakoglobin. Consistent with small molecule inhibitor studies, treatment of the β-catenin null ErbB2KI tumor cells with plakoglobin siRNAs resulted in a similar blockade in the proliferative capacity of these cells and suppression of Wnt target gene Cyclin D1 and components of the Erbb2 amplicon (ErbB2 and Grb7) (Fig. 5 C and D). Conversely, elevated expression of plakoglobin in a subset of human breast cancers is strongly correlated with the high expression of various components of the Erbb2 amplicon (Fig. S5). Taken together, these observations argue that, like β-catenin (10), plakoglobin can replace its role in the transcriptional control of the Erbb2 amplicon.
Fig. 5.
Ctnnb1fl/flErbB2KI cells are dependent on plakoglobin activity, whereas Ctnnb1fl/+ErbB2KI cells are still dependent on residual β-catenin activity. (A) Proliferation of Ctnnb1fl/flErbB2KI cells on plakoglobin inhibition (using ICG-001 inhibitor) was assessed by MTS [3-(4,5-dimethylthiazol-2-yl)-5-(3-carboxymethoxyphenyl)-2-(4-sulfophenyl)-2H-tetrazolium] assay. Data were averaged from three independent experiments. Protein lysate was collected at day 3 of ICG-001 treatment and subjected to immunoblot analyses to show the effect of plakoglobin inhibition on its target gene (Cyclin D1) and the Erbb2 amplicon (ErbB2 and Grb7). Grb2 served as a loading control. Error bar: SD. *P < 0.05 (Student’s t test); **P < 0.005 (Student’s t test). (B) Total RNA was extracted from Ctnnb1fl/flErbB2KI cells treated with ICG-001 for 3 d, and transcript levels of genes belonging to the mouse Erbb2 amplicon were evaluated by RT-PCR. Data were averaged from three independent runs and normalized to Gapdh. Error bar: SD. **P < 0.005 (Student’s t test); ***P < 0.0005 (Student’s t test). (C) Primary cells derived from Ctnnb1fl/flErbB2KI tumor were transfected with siRNAs targeting plakoglobin (Jup), and cell proliferation was assessed by MTS assay. Data were averaged from three independent experiments. Error bar: SD. **P < 0.005 (Student’s t test). (D) Immunoblot was used to assess plakoglobin knockdown efficiency and show the effect of plakoglobin inhibition on its target gene (Cyclin D1) and the Erbb2 amplicon (ErbB2 and Grb7). (E) Cells derived from a poorly differentiated Ctnnb1fl/+ErbB2KI tumor were treated with ICG-001, and proliferation was assessed by MTS assay. Data were averaged from three independent experiments. Protein lysate was collected at day 3 of ICG-001 treatment and subjected to immunoblot analyses for the indicated proteins. Error bar: SD. ns, Not significant. *P < 0.05 (Student’s t test); **P < 0.005 (Student’s t test).
Fig. S5.
Interrogation of gene expression data from 1,105 breast tumor samples (The Cancer Genome Atlas; Cell 2015; mRNA expression dataset). (A) All breast cancer cases were categorized into two groups based on plakoglobin (JUP) mRNA expression: high plakoglobin z scores > 2.5 and low plakoglobin z scores < 2.5. (B) Cases with high plakoglobin expression also have high levels of genes belonging to the ERBB2 amplicon [MIEN1 (C17ORF37), PGAP3 (PERLD1), PNMT, PSMD3, and STARD3]. Data were mined through cBioPortal.
β-Catenin Haploinsufficiency Promotes Tumor Initiation Through the Disruption of Adherens Junctions and EMT Phenotype.
One of the striking observations of our studies is the fact that deletion of a single β-catenin allele resulted in a dramatic acceleration of tumor onset (Fig. 1A). Although 25% of these β-catenin haploid-insufficient tumors, like their β-catenin null counterparts, could up-regulate plakoglobin and presented with the well-differentiated multinodular phenotype, the remaining 75% fail to activate this compensatory pathway. This latter plakoglobin-deficient category of tumors exhibits a poorly differentiated pathology characterized by disrupted adherens junctions and reduced E-cadherin protein levels (Fig. 3 A–C). Like E-cadherin, other adherens junction proteins, including p120-catenin and α-catenin, were also down-regulated at the protein level (Fig. 3 B and C) and mislocalized to the cytoplasm in this poorly differentiated category of tumors (Fig. S3 A and B). Although all tumors have a heterozygous deletion of β-catenin in common, these two distinct groups of tumors pose a question on why plakoglobin could not compensate for adherens junction formation in poorly differentiated Ctnnb1fl/+ErbB2KI tumors. We speculate that these tumors express very low levels of plakoglobin because of high expression of its repressor Twist1 (Fig. 3D) in addition to other adherens junction components (Fig. 3 B and C), and compensation by plakoglobin to preserve adherens junctions is not possible. Furthermore, shRNA-mediated knockdown of β-catenin in ErbB2KI-derived cells also resulted in a similar down-regulation of adherens junction proteins (Fig. S3C).
Although a heterozygous deletion of β-catenin resulted in a disruption of proper adherens junction formation, the remaining β-catenin was able to maintain the transcription of β-catenin’s target genes (c-Myc, Axin2, Tcf7, and Ccnd1) comparable with the control tumors (Fig. 4 A and B). This observation is consistent with the strong nuclear staining of β-catenin that suggests its engagement in transcriptional activity (Fig. 1C and Fig. S1H). To assess whether this remaining β-catenin signaling was important in Ctnnb1fl/+ErbB2KI tumors, we treated primary Ctnnb1fl/+ErbB2KI tumor cells with the potent β-catenin antagonist ICG-001 and found that β-catenin inhibition severely impaired cell proliferation (Fig. 5E). This proliferative defect was further correlated with decreased expression of β-catenin’s target gene Cyclin D1 and components of the Erbb2 amplicon, including ErbB2 and Grb7 (Fig. 5E). These observations argue that the remaining β-catenin in the Ctnnb1fl/+ErbB2KI tumors remains oncogenic by promoting the transcription of its target genes and the Erbb2 amplicon.
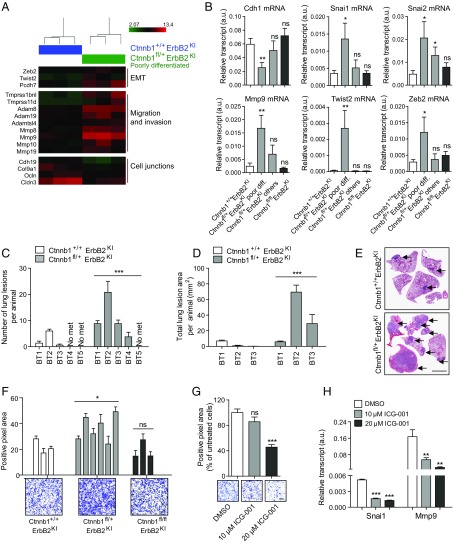
To further understand the molecular changes of these haploid-insufficient Ctnnb1fl/+ErbB2KI tumors, we performed unsupervised clustering analysis of gene expression profiles and observed a high degree of heterogeneity among the Ctnnb1fl/+ErbB2KI tumors (Fig. 4C). Two of five Ctnnb1fl/+ErbB2KI tumors clustered with the Ctnnb1+/+ErbB2KI tumors, whereas the other three tumors formed a distinct group. Remarkably, the two tumors with similar transcriptional profile to Ctnnb1+/+ErbB2KI tumors showed plakoglobin up-regulation, arguing that plakoglobin is functionally substituting for β-catenin (Fig. 4C). By contrast, the three remaining tumors with a distinct gene signature were poorly differentiated acinar tumors with no plakoglobin compensation and defective adherens junctions. Close examination of the gene expression profiles revealed an EMT signature unique to poorly differentiated Ctnnb1fl/+ErbB2KI tumors (Fig. 6A). These tumors exhibited classic features of EMT, including up-regulation of EMT repressors Twist2 and Zeb2, genes involved in migration and invasion, and down-regulation of genes involved in cell adhesion (Fig. 6A). Using RT-PCR, we confirmed this EMT signature in poorly differentiated Ctnnb1fl/+ErbB2KI tumors but not in those cases with high plakoglobin expression (Fig. 6B). To establish whether this EMT signature is also associated with metastasis, we used a tail vein injection assay to assess lung metastasis in immunocompromised mice and showed that Ctnnb1fl/+ErbB2KI tumor cells metastasized to the lungs more efficiently than the control ErbB2KI cells in terms of both number and size of lung lesions (Fig. 6 C–E). Furthermore, poorly differentiated Ctnnb1fl/+ErbB2KI cells were more invasive in vitro than the control ErbB2KI cells (Fig. 6F). Because β-catenin can promote EMT and invasion by activating its target genes, such as Snai1 (26) and Mmp9 (27), we proposed that an active β-catenin/Snai1/Mmp9 signaling axis might underscore the invasiveness of the Ctnnb1fl/+ErbB2KI cells. Indeed, antagonizing β-catenin with ICG-001 in Ctnnb1fl/+ErbB2KI cells significantly inhibited transcription of both Snai1/Mmp9 as well as their invasiveness (Fig. 6 G and H). Collectively, these analyses indicate that a heterozygous loss of β-catenin promotes poorly differentiated tumors with EMT characteristics and enhanced metastasis that is dependent on the residual β-catenin signaling.
Fig. 6.
Poorly differentiated Ctnnb1fl/+ErbB2KI tumors exhibit an EMT signature and are more metastatic. (A) Heat map of selected genes differentially expressed between Ctnnb1+/+ErbB2KI and poorly differentiated Ctnnb1fl/+ErbB2KI tumors. (B) A panel of EMT genes (Cdh1, Mmp9, Snai1/2, Twist2, and Zeb2) were validated by RT-PCR. Ctnnb1+/+ErbB2KI, n = 8; Ctnnb1fl/+ErbB2KI poor differentiation, n = 6; Ctnnb1fl/+ErbB2KI others, n = 6; Ctnnb1fl/flErbB2KI, n = 5. Error bar: SEM. *P < 0.05 (Student’s t test); **P < 0.005 (Student’s t test). (C and D) Freshly dissociated cells (0.5 × 10³) from five independent primary tumors per genotype were injected into the tail vein of groups of five athymic mice. Lungs were harvested 4 wk postinjection, and the number and area of lung lesions were scored. Error bar: SEM. ***P < 0.0005 (two-way ANOVA). (E) Representative images of lungs collected 4 wk post tail vein injection. Arrows point to lung metastases. (Scale bar: 0.4 mm.) (F, Upper) Primary tumor cells were subjected to a Boyden transwell invasion assay in the presence of matrigel. Average positive pixel areas for each cell line were calculated from crystal violet-stained membranes. Data were averaged from three independent experiments. Error bar: SD. *P < 0.05 (Student’s t test). (F, Lower) Images show representative crystal violet-stained membranes. (Scale bar: 200 μm.) (G) Cells derived from a poorly differentiated Ctnnb1fl/+ErbB2KI tumor were pretreated with ICG-001 or DMSO for 36 h before being subjected to a Boyden transwell invasion assay. Data were averaged from three independent experiments. Error bar: SD. (Scale bar: 300 μm.) ***P < 0.0005 (Student’s t test). (H) Total RNA was extracted from Ctnnb1fl/+ErbB2KI cells (derived from a poorly differentiated tumor) treated with ICG-001 or DMSO for 3 d, and transcript levels of β-catenin target genes Snai1 and Mmp9 were assessed by RT-PCR. Data were averaged from three independent runs and normalized to Gapdh. Error bar: SD. ns, Not significant. **P < 0.005 (Student’s t test); ***P < 0.0005 (Student’s t test).
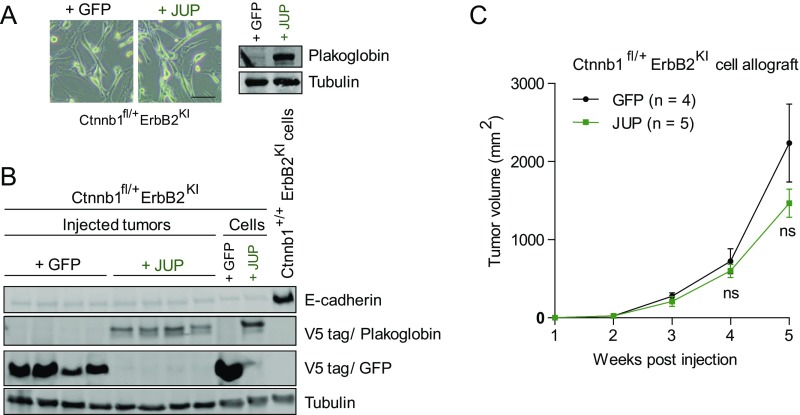
Because poorly differentiated Ctnnb1fl/+ErbB2KI tumors exhibited an aggressive phenotype that correlated with a lack of plakoglobin expression, we asked whether forced expression of plakoglobin could reverse such aggressiveness. Using two Ctnnb1fl/+ErbB2KI cell lines that lack plakoglobin expression, we generated stable cells expressing either plakoglobin or GFP control. Forced expression of plakoglobin did not affect the EMT spindloid morphology or restore the protein level of E-cadherin in vitro (Fig. S6 A and B). In an in vivo allograft assay, expression of plakoglobin did not inhibit tumor growth of these cells (Fig. S6C). Because these tumor cells were derived from end-stage tumors, these data suggest an inability of plakoglobin to restore adherens junction to inhibit tumor growth at this late stage of tumor development. Whether expression of plakoglobin at an early stage of tumor initiation could preserve junctional integrity and epithelial characteristics of ErbB2-transformed cells remains to be addressed.
Fig. S6.
Forced expression of plakoglobin was unable to reverse EMT characteristics and aggressiveness of poorly differentiated Ctnnb1fl/+ErbB2KI cells. (A) Bright-field images of Ctnnb1fl/+ErbB2KI cells with stable expression of either Plakoglobin or control GFP. (Scale bar: 40 μm.) (B) Protein lysates were collected from injected tumors and primary cells and subjected to immunoblot analyses. Antibody against V5 tag was used to show exogenous plakoglobin and GFP expression. A Ctnnb1+/+ErbB2 KI cell line was used to show E-cadherin expression, which is absent in Ctnnb1fl/+ErbB2KI cells. (C) Stable cells were injected into mammary fat pad of athymic nude mice to allow in vivo tumor growth. Data are representative of two independent Ctnnb1fl/+ErbB2KI cell lines.
Discussion
Dysregulation of the canonical Wnt/β-catenin signaling pathway has been implicated as a major driving event in various human malignancies (8). Using a transgenic approach, we found that mammary-specific ablation of β-catenin in luminal and basal GEMMs of ErbB2-positive breast cancer had little impact on ErbB2 mammary tumor progression. In both GEMMs, β-catenin function was compensated by a corresponding up-regulation of the closely related plakoglobin. In the luminal ErbB2 model (MMTV-NIC), which lacks activation of the canonical Wnt/β-catenin signaling pathway, up-regulation of plakoglobin was strictly involved in restoring adherens junctional complexes. However, in the basal ErbB2 model (ErbB2KI), where Wnt/β-catenin signaling pathway is engaged, plakoglobin functionally compensated for both the adherens junctional and transcriptional functions of β-catenin. In contrast to the complete ablation of β-catenin, deletion of a single β-catenin allele in the basal ErbB2 GEMM resulted in a dramatic acceleration in tumor onset. The majority of haploid-insufficient β-catenin ErbB2KI tumors exhibited a poorly differentiated phenotype that further correlated with disruption of adherens complexes and nuclear β-catenin transcriptional activity that resulted in an EMT phenotype. These results argue that alteration of β-catenin levels can have a dramatic impact on the balance between junctional and nuclear pools of β-catenin, resulting in accelerated tumor development.
Numerous studies in both ES cells and adult tissues have reported this compensatory capacity of plakoglobin to replace β-catenin in adherens junctions (17, 18). Our data, together with those studies, argue that, when β-catenin expression is ablated, a compensatory induction of the closely related plakoglobin can functionally replace the loss of both the nuclear and junctional pools of β-catenin. In β-catenin null ErbB2KI tumors, plakoglobin exhibited nuclear localization (Fig. 3 A and E), a hallmark for its activation akin to β-catenin. This activation is consistent with the observation that plakoglobin was able to maintain the transcription of β-catenin’s target genes (Fig. 4). For example, expression of c-Myc, a target gene of both β-catenin and plakoglobin (22), was significantly increased on the complete loss of β-catenin (Fig. 4A). In addition to its role in maintaining β-catenin–dependent transcription, our data also indicate a role for plakoglobin in regulating the Erbb2 amplicon (Fig. 5 A and B). Remarkably, in human breast cancers, expression of plakoglobin is strongly correlated with the expression of all components of the Erbb2 amplicon (Fig. S5). Knockdown and pharmacological inhibition of plakoglobin proved that active plakoglobin signaling was required for proliferation in β-catenin null ErbB2KI tumors (Fig. 5 A and B). Collectively, our study shows that, on β-catenin loss, plakoglobin is engaged to activate Wnt/β-catenin target genes and modulate the Erbb2 amplicon.
Unlike a homozygous deletion of β-catenin, deletion of a single β-catenin allele resulted in multifocal metastatic mammary tumors with an accelerated onset. This haploid-insufficient β-catenin tumor phenotype was further correlated with the disruption of adherens junctions, disturbance of a mammary progenitor population, and an EMT transcriptional program. Surprisingly, reduced β-catenin levels through a single-allele loss in these tumors did not interfere with its signaling activity (Fig. 4 A and B) but rather, resulted in highly disrupted adherens junctions (Fig. 3 A and B). Concomitant with disrupted adherens junctions, the remaining pool of β-catenin localized predominantly to the nucleus (Fig. 1C). Intriguingly, in the luminal ErbB2 model (MMTV-NIC), which lacks active Wnt/β-catenin signaling, deletion of a single β-catenin allele did not disrupt adherens junctions or promote nuclear β-catenin redistribution (Figs. S1C and S4). Our observation supports the idea that, in cancer cells with an active Wnt/β-catenin pathway, down-regulation of adherens junctions allows nuclear β-catenin redistribution and therefore, sustains its signaling activity (5–7). By contrast, another class of haploid-insufficient β-catenin tumors retained adherens junctions and exhibited a differentiated phenotype (Fig. 3 A–C). Like the β-catenin null ErbB2KI tumors, this latter category of ErbB2-positive tumors exhibited a compensatory increase in plakoglobin levels (Fig. 3 A, C, and D), indicating that restoration of the balance between adherens and nuclear β-catenin pools could reverse this poorly differentiated phenotype.
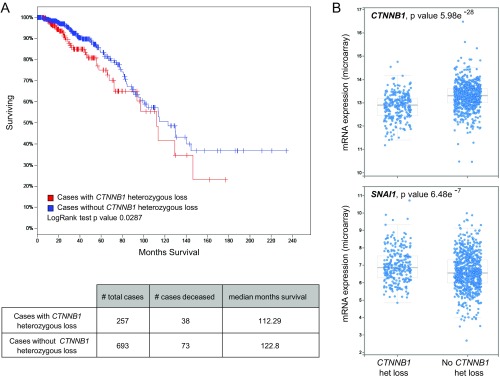
Consistent with our observations, inactivation of p120-catenin or α-catenin also promotes disruption of adherens junctions (28–30). Adherens junction proteins, such as E-cadherin and p120-catenin, play tumor-suppressive roles through their functions in cell adhesion. For example, germ-line loss of function mutation of E-cadherin (Cdh1) is a frequent genetic alteration in invasive lobular breast cancer (31). KO of E-cadherin in transgenic mice leads to aggressive mammary tumor formation (32). Invasive lobular tumors arising in this mouse model also exhibit poorly differentiated features (32). Similarly, inactivation of p120-catenin also promotes tumor metastatic progression (33). Together, these data argue that the stoichiometry of the different core components of adherens complex can have a profound impact on tumor progression. Our observations, together with many previously published studies, emphasize the critical requirement of cell adhesion for proper tissue homeostasis, especially in tissues of epithelial origin. Tissue disruption through the loss of adherens junctions, tight junctions, and cell polarity can lead to the initiation of tumor progression and metastasis (34, 35). Consistent with our data in mouse models, a significant proportion of breast cancer patients (27%) have a heterozygous deletion of β-catenin (CTNNB1), which is strongly correlated with poor overall survival (Fig. S7A). These cases also exhibit a decrease in CTNNB1 mRNA levels as well as an increase in SNAI1 mRNA levels (Fig. S7B), recapitulating our observations in the ErbB2 mouse models. It would, however, be interesting to determine whether those cases with a CTNNB1 heterozygous loss also have an activation of β-catenin signaling. These observations highlight a complex interplay between the two important roles of β-catenin as a cell adhesion molecule and a transcription factor during ErbB2-driven tumorigenesis. Modulation of β-catenin levels or disruption of its cell adhesion role is correlated with aggressive tumorigenesis in basal ErbB2-driven mammary tumors with preexisting β-catenin activation. The disruption of adherens junctions may serve as a mechanism to maintain the nuclear activity of the remaining β-catenin pool. Our data also emphasize the tumor suppressor role of β-catenin, similar to other adherens junction proteins, in maintaining junctional integrity during tumor progression.
Fig. S7.
A heterozygous loss of β-catenin (CTNNB1) correlates with poor survival in breast cancer patients. (A) Interrogation of gene expression data from 1,105 breast tumor samples reveals that a significant number of cases (26.9%) possesses a heterozygous loss of CTNNB1 locus, which correlates with worse overall survival. (B) Cases with heterozygous loss of CTNNB1 also exhibit a decrease in CTNNB1 mRNA levels and an increase in SNAI1 levels, similar to our data using a mouse model.
Materials and Methods
Transgenic Mice.
Generation of ErbB2KI, MMTV-NIC, and murine mammary tumor virus-Cre mice was described previously (13, 14). Mice with floxed Ctnnb1 alleles were obtained from The Jackson Laboratory and are described elsewhere (15). All mice were maintained in or backcrossed to a pure FVB background. Nulliparous female mice were monitored weekly for tumor formation by physical palpation. Mice were housed and handled in accordance with McGill University Animals Ethics Committee guidelines.
Immunohistochemistry/IHF, Imaging, and Fluorescent Intensity Analysis.
Primary tumors and lungs were harvested at end-point burden (about 6 cm3). Tissues were fixed for 24 h in 10% (vol/vol) formalin (Leica), embedded in paraffin, and sectioned at 5 μm. Tissues sections were stained with H&E by Histology Services at McGill University and scanned using the Scanscope XT Digital Slide Scanner (Aperio). Tumor pathology was examined by comparative pathologists (R.D.C. and O.H.A.).
Antigen retrieval was performed in boiling 10 mM citrate buffer (pH 6.0). Tissues were blocked for 10 min with Universal Blocking Agent (Biogenics). For immunohistochemistry (IHC), tissues were further treated with 3% (vol/vol) H2O2. Immunohistochemical labeling was performed using the Vectastatin Elite ABC Kit (Vector Laboratories). Primary and secondary antibodies (detailed in SI Materials and Methods) were prepared in 2% (wt/vol) BSA in PBS. IHC images were acquired using an Aperio-XT Slide Scanner (Aperio Technologies). Immunofluorescence images were taken using an LSM510 Confocal Microscope (Carl Zeiss) and analyzed using Zen software. For nuclear β-catenin quantification, a line is drawn across a nucleus to generate intensity peaks over the nucleus length. Nuclear intensity was then calculated as a total of intensity values over this distance. Data were averaged from fluorescent intensities measured from at least 30 nuclei per at least eight random fields per tumor.
Isolation and Culture of Mouse Mammary Tumor Cells.
Primary cells were isolated from mouse mammary tumors as described (36) and cultured in DMEM supplemented with FBS [5% (vol/vol)], EGF (5 ng/mL), bovine pituitary extract (35 μg/mL), insulin (5 μg/mL), and hydrocortisone (1 μg/mL) for a short term (fewer than six passages).
Microarray Data Acquisition and Analysis.
Total RNA extraction and quantification were done as described above. Total RNA was quantified using the NanoDrop Spectrophotometer ND-1000 (NanoDrop Technologies, Inc.), and its integrity was assessed using the 2100 Bioanalyzer (Agilent Technologies). Sense-strand cDNA was synthesized from 100 ng total RNA, and fragmentation and labeling were performed to produce ssDNA with the Affymetrix GeneChip WT Terminal Labeling Kit according to the manufacturer’s instructions (Affymetrix). After fragmentation and labeling, 3.5 µg DNA target was hybridized on the GeneChip Mouse Gene 2.0 ST Array (Affymetrix) and incubated at 45 °C in the GeneChip Hybridization Oven 640 (Affymetrix) for 17 h at 60 rpm. GeneChips were then washed in a GeneChips Fluidics Station 450 (Affymetrix) using the Affymetrix Hybridization Wash and Stain Kit according to the manufacturer’s instructions (Affymetrix). The microarrays were finally scanned on the GeneChip Scanner 3000 (Affymetrix). All procedures were performed by service at the Genome Quebec Innovation Center, McGill University. Raw data were first processed to perform gene-level normalization and quality control using Affymetrix Expression Console software (Affymetrix). Processed data were next subjected to gene-level differential expression analysis using Affymetrix Transcriptome Analysis Console software with filter criteria as following: linear fold change < −2 or > 2 and ANOVA P value (condition pair) < 0.05. Microarray data were deposited in the Gene Expression Omnibus database under the accession number GSE89498.
SI Materials and Methods
Immunoblot Analysis.
Snap-frozen tumors were crushed in liquid nitrogen and lysed to extract protein using a lysis buffer (100 mM NaCl, 20 mM Tris⋅Cl, pH 8.0, 0.5 mM EDTA, 0.5% Nonidet P-40, 1 mM PMSF, 1 mM sodium orthovanadate, 1 mM sodium fluoride, 10 μg/mL aprotinin, 10 μg/mL leupeptin). Protein lysates from cultured cell lines were generated using the same lysis buffer. Proteins were resolved by SDS/PAGE and transferred to Immobilon FL PVDF Membranes (Millipore). Membranes were blocked in Odyssey Blocking Buffer (LI-COR Biosciences) for 1 h at room temperature and probed with primary antibodies in Odyssey Blocking Buffer (plus 0.1% Tween 20) overnight at 4 °C. Membranes were washed three times in Tris-buffered saline (TBS) (plus 0.1% Tween 20) and incubated with fluorophore-conjugated secondary antibodies for 1 h at room temperature. Membranes were then washed three times in TBS (plus 0.1% Tween 20) and scanned using an LI-COR Odyssey Scanner (LI-COR Biosciences). Images were processed and quantified using Odyssey V3 software. Primary and secondary antibodies are listed below.
Cellular Fractionation.
Cells were freshly dissociated from tumors and plated overnight (15-cm plate). Cells (washed twice with PBS) were scraped and incubated for 10 min in 1.0 mM EDTA/PBS. Cells were then centrifuged at 5,000 × g for 30 s, resuspended in 800 μL buffer A (10 mM KCl, 10 mM Tris, pH 8.0, 0.1 mM EDTA, 0.1 mM EGTA, protease inhibitors), and incubated on ice for 15 min. After 25 μL 10% (vol/vol) Nonidet P-40 was added, the sample was vortexed for 10 s, incubated on ice for 2 min, and centrifuged at 12,000 × g for 5 s. At this point, the supernatant contained the cytosol and membrane fraction, whereas the pellet contained predominantly intact nuclei. To further purify the nuclear fraction, the nucleus pellet was subjected to two additional rounds of buffer A and Nonidet P-40 to remove nonnuclear proteins. Finally, the nucleus pellet was lysed using RIPA buffer (140 mM NaCl, 10 mM Tris, pH 8.0, 1.0 mM EDTA, 0.5 mM EGTA, 1% Triton X-100, 0.1% sodium deoxycholate, 0.1% SDS, protease inhibitors).
siRNA Knockdown, IGC-001 Inhibitor, Proliferation, and Invasion Assay.
Primary cells were transfected with siRNA against mouse plakoglobin (Jup; Cell Signaling) at a final concentration of 40 nM using Lipofectamine 2000 (Invitrogen) according to the manufacturer’s protocol. Protein lysate was collected at day 3 to confirm knockdown via immunoblot analysis. In MTS proliferation assay, 20,000 cells were seeded per well (in quadruple) in a 96-well plate and treated with DMSO, IGC-001 (10 or 20 μm; Selleckchem), or media only (untreated) 1 d after plating (day 0). Cell proliferation was assessed for the following 3 d using the CellTiter Aqueous MTS Assay (Promega) according to the manufacturer’s protocol. Data were averaged from three independent experiments. In invasion assay, cells were pretreated with DMSO, IGC-001 (10 or 20 μm), or media only (untreated) for 36 h before trypsinization. Subsequently, 200,000 cells were plated into each transwell cell insert (BD) coated with 5% (vol/vol) Matrigel (BD). Media free of FBS but containing the appropriate treatment were added to the upper chamber, whereas complete media [with 10% (vol/vol) FBS] were added to the lower chamber. Cells were incubated for 24 h, formalin fixed, and stained with crystal violet. Images of cells that passed through the membrane were taken using Axio Zoom V16 (Zeiss), and positive pixel count was determined using ImageJ (NIH). Data were averaged from three independent experiments.
Generation of Stable Cell Lines and Allograft Assay.
Plasmid carrying human JUP cDNA was obtained from Mission TRC3 Human LentiORFs Library (Sigma-Aldrich). Control plasmid carrying GFP cDNA was a gift from Vincent Giguere's laboratory (Goodman Cancer Centre, McGill University, Montreal, QC, Canada). Primary Ctnnb1fl/+ErbB2KI cells were transduced with lentiviral particles according to the manufacturer’s protocol. Cells with stable expression were selected under puromycin; 1.0 × 10⁶ cells were injected into the mammary fat pad of five athymic nude mice. Tumor sizes were measured weekly by a caliper until an end burden. Bright-field images were taken using the EVOS Cell Imaging System (Thermo Fisher Scientific). Generation of TM15-C10-2 cells stably expressing nonsilencing shRNA control or Ctnnb1-specific shRNA is described previously (10).
Tail Vein Injection and Lung Metastasis Score.
Cells were freshly dissociated from mammary tumors as described (36). To remove fibroblasts, cells were spun at 80 × g for 1 min in a 15-mL Falcon tube, and the pellet contained predominantly epithelial cells. Cells (1.0 × 10⁶) from a single tumor (five independent tumors per genotype) were collected and injected via the tail vein into five athymic nude mice. Mice were killed 4 wk postinjection, and lungs were fixed in 10% (vol/vol) formalin (Leica) for subsequent H&E staining. H&E-stained lung sections (five step sections per lung at 50-μm intervals) were analyzed by ImageScope software (Aperio) to quantify the number and total area of lung lesions. Lesions that were present in multiple step sections were counted only once.
RNA/DNA Extraction, RT-PCR Analysis, and Erbb2 Transgene Amplification.
Snap-frozen pieces of tumors were crushed in liquid nitrogen and homogenized using Qiashredder Columns (Qiagen). Total RNA and DNA were isolated using the Allprep Kit (Qiagen). Quantity of DNA and RNA was determined using a NanoDrop Spectrophotometer ND-1000 (NanoDrop Technologies, Inc.).
cDNA was synthesized by reverse transcription using the NEB ProtoScript II First Strand cDNA Synthesis Kit. Real-time PCR was performed using LightCycler 480 SYBR Green I Master Reagents (Roche). Data were normalized to Gapdh to generate the relative transcript levels using the expression 2(crossing point value of Gapdh − crossing point value of gene of interest). Each reaction was run in triplicate. Primer sequences are listed below.
For Erbb2 copy number, genomic DNA was treated with RNase and subjected to real-time PCR using LightCycler 480 SYBR Green I Master Reagents (Roche). Primers were designed to specifically amplify the transgene (rat Neu) but not the endogenous mouse Erbb2. Data were normalized to a reference genomic location using a different pair of primers. The copy numbers were calculated using the expression 2(crossing point value of reference − crossing point value of Erbb2). DNA isolated from heart and tail was used as negative control for Erbb2 amplification. Each reaction was run in triplicate. Primer sequences are listed below.
Statistical Analysis and Public Data Mining.
Significance of the data was assessed using two-tailed Student’s t test or two-way ANOVA using GraphPad Prism 5 software. Correlation between expression of JUP and genes belonging to ERBB2 amplicon was derived from the breast-invasive carcinoma dataset (The Cancer Genome Atlas; Cell 2015) available on cBioPortal (www.cbioportal.org) (37, 38). All cases were categorized into two groups: one with high JUP expression (z score > 2.5) and one with low JUP expression (z score < 2.5). Similarly, patients were categorized based on their status on CTNNB1 heterozygous loss. Overall survival and expression of CTNNB1 and SNAI1 were then compared between these two groups.
List of Antibodies.
| Antibody | Company | Antibody dilution | |
| IHC or IHF | Western blotting | ||
| Rabbit anti-ErbB2 | Santa Cruz | 1/1,000 | |
| Rabbit anti-Axin2 | EMD Millipore | 1/1,000 | |
| Rabbit anti-Grb2 | Santa Cruz | 1/1,000 | |
| Rabbit anti-Grb7 | Santa Cruz | 1/1,000 | |
| Rabbit anti-Keratin 14 | Covance | 1/500 | |
| Rabbit anti-Keratin 6 | Covance | 1/500 | |
| Guinea pig anti-Keratin 8/18 | Fitzgerald | 1/200 | |
| Rabbit anti–β-Catenin | Cell Signaling | 1/200 | 1/1,000 |
| Rabbit anti-Plakoglobin | Cell Signaling | 1/1,000 | |
| Rabbit anti-Plakoglobin | Santa Cruz | 1/200 | |
| Mouse anti–E-Cadherin | BD Biosciences | 1/200 | 1/1,000 |
| Mouse anti–p120-Catenin | BD Biosciences | 1/200 | 1/500 |
| Mouse anti–α-Catenin | BD Biosciences | 1/200 | 1/500 |
| Mouse anti-Cyclin D1 | Sigma-Aldrich | 1/500 | |
| Mouse anti-Laminin A/C | Cell Signaling | 1/1,000 | |
| Mouse anti-Vinculin | EMD Millipore | 1/1,000 | |
| Mouse anti-Actin | Sigma-Aldrich | 1/1,000 | |
| Rabbit anti–α/β-Tubulin | Cell Signaling | 1/1,000 | |
| Rabbit anti-V5 tag | Cell Signaling | 1/1,000 | |
| All biotin-conjugated antibodies for IHC | Jackson Immunoresearch | 1/1,000 | |
| All Alexa-Fluor–conjugated antibodies for IF | Invitrogen | 1/1,000 | |
| Goat anti-rabbit IRDye 800 | LI-COR Biosciences | 1/10,000 | |
| Goat anti-mouse IRDye 680 | LI-COR Biosciences | 1/10,000 | |
List of Primers.
| Target | Orientation | Sequence |
| RT-PCR | ||
| Gapdh | Left primer | ctgcaccaccaactgcttag |
| Gapdh | Right primer | gtcttctgggtggcagtgat |
| Ctnnb1 | Left primer | atggtgtctgccattgtacg |
| Ctnnb1 | Right primer | gtgacccaagcattttcacc |
| Jup | Left primer | gtcctgttccgcatctctg |
| Jup | Right primer | tctgcatagggttcgttgatc |
| Axin2 | Left primer | ttcaagaaggcgagtgacg |
| Axin2 | Right primer | gtcgatcctctccactttgc |
| Myc | Left primer | gctgtttgaaggctggatttc |
| Myc | Right primer | gatgaaatagggctgtacggag |
| Tcf7 | Left primer | atcaggctcttcccagttcc |
| Tcf7 | Right primer | ccccacagagaaactgaagc |
| Erbb2 (Neu) | Left primer | gtgctagacaaccgagatcctcagg |
| Erbb2 (Neu) | Right primer | cccttcaggatctctgtgagacttcg |
| Grb7 | Left primer | gctctgagtgccgccatgg |
| Grb7 | Right primer | ggctgggtgcgatgaatgg |
| Stard3 | Left primer | ctcccttctctggatcatcg |
| Stard3 | Right primer | agcatagcccaggagcagc |
| Cdh1 | Left primer | attggcatgaagtgcatgag |
| Cdh1 | Right primer | ccactaatgtcgccagacct |
| Mmp9 | Left primer | caatccttgcaatgtggatg |
| Mmp9 | Right primer | agtaaggaaggggccctgta |
| Snai1 | Left primer | cttgtgtctgcacgacctgt |
| Snai1 | Right primer | gcagtgggagcaggagaat |
| Snai2 | Left primer | ggctgcttcaaggacacatt |
| Snai2 | Right primer | gatgtgccctcaggtttgat |
| Twist1 | Left primer | ctcggacaagctgagcaag |
| Twist1 | Right primer | cagcttgccatcttggagtc |
| Twist2 | Left primer | atgtccgcctcccactagc |
| Twist2 | Right primer | gtcatgaggagccacaaggt |
| Zeb2 | Left primer | tggcctatacctacccaacg |
| Zeb2 | Right primer | gtgctccatccagcaagtct |
| Erbb2 transgene amplification | ||
| Erbb2 (Neu) | Left primer | gtgctagacaaccgagatcctcagg |
| Erbb2 (Neu) | Right primer | cccttcaggatctctgtgagacttcg |
| Reference | Left primer | ctgtgaaacgtgtatgctaagaatg |
| Reference | Right primer | Gtacttggaatctaggtctgttgga |
Acknowledgments
We thank Cynthia Lavoie, Vasilios Papavasiliou, and Dongmei Zuo for technical support and Dr. Harvey W. Smith and Laura Jones for their critical comments and editorial assistance. This work was supported by National Cancer Institute Grant U01 CA141582 (to R.D.C. and O.H.A.) and a Canadian Cancer Society Innovation Grant (to W.J.M.). T.B. is supported by a Ontario Quebec Exchange Fellowship. W.J.M. is supported by Canada Research Chair in Molecular Oncology.
Footnotes
The authors declare no conflict of interest.
This article is a PNAS Direct Submission. K.P. is a Guest Editor invited by the Editorial Board.
Data deposition: The microarray data reported in this paper have been deposited in the Gene Expression Omnibus (GEO) database, www.ncbi.nlm.nih.gov/geo (accession no. GSE89498).
This article contains supporting information online at www.pnas.org/lookup/suppl/doi:10.1073/pnas.1610383114/-/DCSupplemental.
References
- 1.Clevers H, Nusse R. Wnt/β-catenin signaling and disease. Cell. 2012;149(6):1192–1205. doi: 10.1016/j.cell.2012.05.012. [DOI] [PubMed] [Google Scholar]
- 2.Peifer M, McCrea PD, Green KJ, Wieschaus E, Gumbiner BM. The vertebrate adhesive junction proteins beta-catenin and plakoglobin and the Drosophila segment polarity gene armadillo form a multigene family with similar properties. J Cell Biol. 1992;118(3):681–691. doi: 10.1083/jcb.118.3.681. [DOI] [PMC free article] [PubMed] [Google Scholar]
- 3.Heuberger J, Birchmeier W. Interplay of cadherin-mediated cell adhesion and canonical Wnt signaling. Cold Spring Harb Perspect Biol. 2010;2(2):a002915. doi: 10.1101/cshperspect.a002915. [DOI] [PMC free article] [PubMed] [Google Scholar]
- 4.Jeanes A, Gottardi CJ, Yap AS. Cadherins and cancer: How does cadherin dysfunction promote tumor progression? Oncogene. 2008;27(55):6920–6929. doi: 10.1038/onc.2008.343. [DOI] [PMC free article] [PubMed] [Google Scholar]
- 5.Kuphal F, Behrens J. E-cadherin modulates Wnt-dependent transcription in colorectal cancer cells but does not alter Wnt-independent gene expression in fibroblasts. Exp Cell Res. 2006;312(4):457–467. doi: 10.1016/j.yexcr.2005.11.007. [DOI] [PubMed] [Google Scholar]
- 6.Onder TT, et al. Loss of E-cadherin promotes metastasis via multiple downstream transcriptional pathways. Cancer Res. 2008;68(10):3645–3654. doi: 10.1158/0008-5472.CAN-07-2938. [DOI] [PubMed] [Google Scholar]
- 7.Ma L, et al. miR-9, a MYC/MYCN-activated microRNA, regulates E-cadherin and cancer metastasis. Nat Cell Biol. 2010;12(3):247–256. doi: 10.1038/ncb2024. [DOI] [PMC free article] [PubMed] [Google Scholar]
- 8.Anastas JN, Moon RT. WNT signalling pathways as therapeutic targets in cancer. Nat Rev Cancer. 2013;13(1):11–26. doi: 10.1038/nrc3419. [DOI] [PubMed] [Google Scholar]
- 9.Geyer FC, et al. β-Catenin pathway activation in breast cancer is associated with triple-negative phenotype but not with CTNNB1 mutation. Mod Pathol. 2011;24(2):209–231. doi: 10.1038/modpathol.2010.205. [DOI] [PubMed] [Google Scholar]
- 10.Schade B, et al. β-Catenin signaling is a critical event in ErbB2-mediated mammary tumor progression. Cancer Res. 2013;73(14):4474–4487. doi: 10.1158/0008-5472.CAN-12-3925. [DOI] [PubMed] [Google Scholar]
- 11.Incassati A, Chandramouli A, Eelkema R, Cowin P. Key signaling nodes in mammary gland development and cancer: β-Catenin. Breast Cancer Res. 2010;12(6):213. doi: 10.1186/bcr2723. [DOI] [PMC free article] [PubMed] [Google Scholar]
- 12.Andrulis IL, et al. Toronto Breast Cancer Study Group neu/erbB-2 amplification identifies a poor-prognosis group of women with node-negative breast cancer. J Clin Oncol. 1998;16(4):1340–1349. doi: 10.1200/JCO.1998.16.4.1340. [DOI] [PubMed] [Google Scholar]
- 13.Ursini-Siegel J, et al. ShcA signalling is essential for tumour progression in mouse models of human breast cancer. EMBO J. 2008;27(6):910–920. doi: 10.1038/emboj.2008.22. [DOI] [PMC free article] [PubMed] [Google Scholar]
- 14.Andrechek ER, et al. Amplification of the neu/erbB-2 oncogene in a mouse model of mammary tumorigenesis. Proc Natl Acad Sci USA. 2000;97(7):3444–3449. doi: 10.1073/pnas.050408497. [DOI] [PMC free article] [PubMed] [Google Scholar]
- 15.Brault V, et al. Inactivation of the beta-catenin gene by Wnt1-Cre-mediated deletion results in dramatic brain malformation and failure of craniofacial development. Development. 2001;128(8):1253–1264. doi: 10.1242/dev.128.8.1253. [DOI] [PubMed] [Google Scholar]
- 16.Dourdin N, et al. Phosphatase and tensin homologue deleted on chromosome 10 deficiency accelerates tumor induction in a mouse model of ErbB-2 mammary tumorigenesis. Cancer Res. 2008;68(7):2122–2131. doi: 10.1158/0008-5472.CAN-07-5727. [DOI] [PMC free article] [PubMed] [Google Scholar]
- 17.Lyashenko N, et al. Differential requirement for the dual functions of β-catenin in embryonic stem cell self-renewal and germ layer formation. Nat Cell Biol. 2011;13(7):753–761. doi: 10.1038/ncb2260. [DOI] [PMC free article] [PubMed] [Google Scholar]
- 18.Wickline ED, et al. Hepatocyte γ-catenin compensates for conditionally deleted β-catenin at adherens junctions. J Hepatol. 2011;55(6):1256–1262. doi: 10.1016/j.jhep.2011.03.014. [DOI] [PMC free article] [PubMed] [Google Scholar]
- 19.Knudsen KA, Wheelock MJ. Plakoglobin, or an 83-kD homologue distinct from beta-catenin, interacts with E-cadherin and N-cadherin. J Cell Biol. 1992;118(3):671–679. doi: 10.1083/jcb.118.3.671. [DOI] [PMC free article] [PubMed] [Google Scholar]
- 20.Troyanovsky RB, Chitaev NA, Troyanovsky SM. Cadherin binding sites of plakoglobin: Localization, specificity and role in targeting to adhering junctions. J Cell Sci. 1996;109(Pt 13):3069–3078. doi: 10.1242/jcs.109.13.3069. [DOI] [PubMed] [Google Scholar]
- 21.Lamouille S, Xu J, Derynck R. Molecular mechanisms of epithelial-mesenchymal transition. Nat Rev Mol Cell Biol. 2014;15(3):178–196. doi: 10.1038/nrm3758. [DOI] [PMC free article] [PubMed] [Google Scholar]
- 22.Kolligs FT, et al. gamma-Catenin is regulated by the APC tumor suppressor and its oncogenic activity is distinct from that of beta-catenin. Genes Dev. 2000;14(11):1319–1331. [PMC free article] [PubMed] [Google Scholar]
- 23.Kodama S, Ikeda S, Asahara T, Kishida M, Kikuchi A. Axin directly interacts with plakoglobin and regulates its stability. J Biol Chem. 1999;274(39):27682–27688. doi: 10.1074/jbc.274.39.27682. [DOI] [PubMed] [Google Scholar]
- 24.Maeda O, et al. Plakoglobin (gamma-catenin) has TCF/LEF family-dependent transcriptional activity in beta-catenin-deficient cell line. Oncogene. 2004;23(4):964–972. doi: 10.1038/sj.onc.1207254. [DOI] [PubMed] [Google Scholar]
- 25.Kim YM, et al. The gamma catenin/CBP complex maintains survivin transcription in β-catenin deficient/depleted cancer cells. Curr Cancer Drug Targets. 2011;11(2):213–225. doi: 10.2174/156800911794328420. [DOI] [PubMed] [Google Scholar]
- 26.ten Berge D, et al. Wnt signaling mediates self-organization and axis formation in embryoid bodies. Cell Stem Cell. 2008;3(5):508–518. doi: 10.1016/j.stem.2008.09.013. [DOI] [PMC free article] [PubMed] [Google Scholar]
- 27.Wu B, Crampton SP, Hughes CC. Wnt signaling induces matrix metalloproteinase expression and regulates T cell transmigration. Immunity. 2007;26(2):227–239. doi: 10.1016/j.immuni.2006.12.007. [DOI] [PMC free article] [PubMed] [Google Scholar]
- 28.Kurley SJ, et al. p120-catenin is essential for terminal end bud function and mammary morphogenesis. Development. 2012;139(10):1754–1764. doi: 10.1242/dev.072769. [DOI] [PMC free article] [PubMed] [Google Scholar]
- 29.Sheikh F, et al. alpha-E-catenin inactivation disrupts the cardiomyocyte adherens junction, resulting in cardiomyopathy and susceptibility to wall rupture. Circulation. 2006;114(10):1046–1055. doi: 10.1161/CIRCULATIONAHA.106.634469. [DOI] [PubMed] [Google Scholar]
- 30.Davis MA, Ireton RC, Reynolds AB. A core function for p120-catenin in cadherin turnover. J Cell Biol. 2003;163(3):525–534. doi: 10.1083/jcb.200307111. [DOI] [PMC free article] [PubMed] [Google Scholar]
- 31.Berx G, et al. E-cadherin is a tumour/invasion suppressor gene mutated in human lobular breast cancers. EMBO J. 1995;14(24):6107–6115. doi: 10.1002/j.1460-2075.1995.tb00301.x. [DOI] [PMC free article] [PubMed] [Google Scholar]
- 32.Derksen PW, et al. Somatic inactivation of E-cadherin and p53 in mice leads to metastatic lobular mammary carcinoma through induction of anoikis resistance and angiogenesis. Cancer Cell. 2006;10(5):437–449. doi: 10.1016/j.ccr.2006.09.013. [DOI] [PubMed] [Google Scholar]
- 33.Schackmann RC, et al. Loss of p120-catenin induces metastatic progression of breast cancer by inducing anoikis resistance and augmenting growth factor receptor signaling. Cancer Res. 2013;73(15):4937–4949. doi: 10.1158/0008-5472.CAN-13-0180. [DOI] [PubMed] [Google Scholar]
- 34.Knights AJ, Funnell AP, Crossley M, Pearson RC. Holding tight: Cell junctions and cancer spread. Trends Cancer Res. 2012;8:61–69. [PMC free article] [PubMed] [Google Scholar]
- 35.Godde NJ, Galea RC, Elsum IA, Humbert PO. Cell polarity in motion: Redefining mammary tissue organization through EMT and cell polarity transitions. J Mammary Gland Biol Neoplasia. 2010;15(2):149–168. doi: 10.1007/s10911-010-9180-2. [DOI] [PubMed] [Google Scholar]
- 36.Ling C, Zuo D, Xue B, Muthuswamy S, Muller WJ. A novel role for 14-3-3sigma in regulating epithelial cell polarity. Genes Dev. 2010;24(9):947–956. doi: 10.1101/gad.1896810. [DOI] [PMC free article] [PubMed] [Google Scholar]
- 37.Gao J, et al. Integrative analysis of complex cancer genomics and clinical profiles using the cBioPortal. Sci Signal. 2013;6(269):pl1. doi: 10.1126/scisignal.2004088. [DOI] [PMC free article] [PubMed] [Google Scholar]
- 38.Cerami E, et al. The cBio cancer genomics portal: An open platform for exploring multidimensional cancer genomics data. Cancer Discov. 2012;2(5):401–404. doi: 10.1158/2159-8290.CD-12-0095. [DOI] [PMC free article] [PubMed] [Google Scholar]


