

Abstract
Solar ultraviolet radiation (UVR) is the major risk factor for skin carcinogenesis. To gain new insights into the molecular pathways mediating UVR effects in the skin, we performed comprehensive transcriptomic analyses to identify shared and distinctive molecular responses to UVR between human keratinocytes and melanocytes. Keratinocytes and melanocytes were irradiated with varying doses of UVB (10, 20 and 30 mJ/cm2) then analysed by RNA-Seq at different time points post-UVB radiation (4, 24 and 72 h). Under basal conditions, keratinocytes and melanocytes expressed similar number of genes, although they each expressed a distinctive subset of genes pertaining to their specific cellular identity. Upon UVB radiation, keratinocytes displayed a clear pattern of time- and dose-dependent changes in gene expression that was different from melanocytes. The early UVB-responsive gene set (4 h post-UVR) differed significantly from delayed UVB-responsive gene sets (24 and 72 h). We also identified multiple novel UVB signature genes including PRSS23, SERPINH1, LCE3D and CNFN, which were conserved between melanocyte and keratinocyte lines from different individuals. Taken together, our findings elucidated both common and distinctive molecular features between melanocytes and keratinocytes and uncovered novel UVB signature genes that might be utilized to predict UVB photobiological effects on the skin.
Keywords: keratinocytes, melanocytes, transcriptome, UV radiation
Introduction
Solar ultraviolet radiation (UVR) is a ubiquitous environmental factor that influences the survival and proliferation of skin cells. Solar UV rays that reach the earth's surface contain approximately 95% of UVA (320–400 nm) and 5% of UVB (280–320 nm) (1). Exposure to solar UVR, particularly its UVB component, results in a variety of harmful effects on human skin including sunburn, photoageing, immune suppression and increased susceptibility to skin cancer (2–4). Among these adverse effects, skin carcinogenesis is of the greatest concern, given that skin cancer is the most common human malignancy in the USA (5). Extensive experimental and epidemiological evidences support that excessive exposure to solar UVR is the most important aetiological factor in the development of skin cancer (6).
Despite decades of extensive research on the molecular basis of UVR-induced carcinogenesis, there remains a significant gap in our understanding of how UV interacts with skin cells to promote skin photocarcinogenesis. Keratinocytes and melanocytes are two major target cells of UVR in the skin. Excessive sun exposure serves as a key risk factor for both melanoma- and keratinocyte-derived tumors including basal cell carcinoma (BCC) and squamous cell carcinoma (SCC). Numerous studies have examined the impact of UVR on skin in different model organisms using approaches ranging from biochemistry, molecular and cellular biology and genetic tools. In the past decade, an increasing number of studies started to employ high-throughput approaches to identify UV-responsive genes and pathways (7–12), which have greatly enhanced our understanding of the molecular mechanisms through which UVR damages skin cells. The majority of these studies, however, relied on early microarray platforms with limited coverage of the genome. They also varied significantly in the choices of cell types, UV wave length and dose, and the time points of analyses following UV radiation, which makes cross-comparison and validation of these findings very challenging.
Recent advances in next-generation sequencing technologies offer an excellent opportunity to take a new look into the impact of UVR on the entire transcriptome of skin cells. In this study, we employed RNA-Seq to characterize the transcriptomes of keratinocytes and melanocytes under different UVB-stimulated conditions. We isolated keratinocytes and melanocytes from four individual donors. For UVB studies, we included three UVB doses and three time points for each dose. We then obtained transcriptomic data on both the control and irradiated cells under each UVR condition. This comprehensive UVB study design allowed us to perform comparative transcriptomic analyses of the transcriptomic features between keratinocytes and melanocytes and to identify UVB-responsive genes that are conserved under different UVB conditions and among different individuals as UVB biomarkers.
Materials and methods
Normal human keratinocyte and melanocyte cultures
Primary human keratinocytes and melanocytes were established from neonatal foreskins through the Columbia University Skin Disease Research Center tissue culture core facility. The protocol was exempt by our Institutional Review Board. Neonatal foreskins were obtained from four individual donors (donors 1 and 2 were of Latino origin; 3 and 4 were of Caucasian origin). Cells from each donor were maintained and analysed separately for assessing individual variations. Keratinocytes were cultured in 154CF medium supplemented with human keratinocyte growth supplement (Life Technologies, Grand Island, NY, USA). Melanocytes were cultured in MBM-4 medium supplemented with MGM-4 SingleQuot kit supplement and growth factors (Lonza, Basel, Switzerland).
UVB radiation
Keratinocytes and melanocytes were rinsed once with PBS and irradiated in approximately 1.0 ml of PBS in 150-mm2 culture dishes with UVB supplied by four FS20T12/UVB tubes (National Biological Corp., Beachwood, OH, USA). The intensity of UVB lights was measured using an IL1400 radiometer connected to a SEL240/UVB-1/TD detector (International Light, Newburyport, MA, USA). Cells were irradiated with a total dose of 10, 20 and 30 mJ/cm2, respectively. Cells were collected at 4, 24 and 72 h after UVB radiation, or time points as indicated.
MTT assay
The Vybrant MTT Cell Proliferation Assay (Invitrogen, Grand Island, NY, USA) was used to measure cell viability in response to UVB radiation. Keratinocytes and melanocytes were exposed to different doses of UVB (5, 10, 20, 30 and 40 mJ/cm2). At 4, 24 or 72 h after UVB exposure, cell viability was analysed following manufacturer's protocol using an iMark Microplate Reader at 570 nm wavelength (Bio-Rad, Hercules, CA, USA).
RNA isolation and RNA-Seq analysis
Total RNA was isolated from cultured cells using the RNeasy Kit (Qiagen, Gaithersburg, MD, USA) and treated with DNase I (Life Technologies) according to the manufacturers' protocols. All RNA samples were subsequently analysed using an RNA 6000 nano chip (Agilent Technologies, Wilmington, DE, USA) to confirm that the RNA integrity index was 8.0 or above. RNA concentration was measured using a nanodrop (Thermo Scientific, Franklin Lakes, NJ, USA). RNA isolated from cells from donors 1, 2 and 3 was subjected to RAN-Seq analysis. Briefly, total RNA (500 ng) from each sample was subjected to poly-A pull-down to enrich mRNAs for library preparation by using Illumina TruSeq RNA prep kit (Illumina, San Diego, CA, USA). The resulting libraries were sequenced using Illumina HiSeq2000 at Columbia Genome Center. Samples were multiplexed in each lane, which yielded targeted number of paired-end 100-bp reads for each sample, as a fraction of 180 million reads for the whole lane. We used RTA (Illumina) for base calling and bcl2fastq (version 1.8.4; Illumina) for converting BCL to fastq format, coupled with adaptor trimming. We mapped the reads to the human reference genome (NCBI/build37.2) using Tophat (version 2.0.4). The relative gene expression level was calculated using Cufflinks (version 2.0.2) with default settings. Differentially expressed genes under various conditions were determined using the DEseq software.
qRT-PCR
Total RNA (2 μg) from cells isolated from donor 4 was reverse transcribed using the RNA to cDNA EcoDry Premix reagents (Clontech, Mountain View, CA, USA). Resulting cDNA was used in qPCR analyses using the CFX96 Touch™ Real-Time PCR Detection System (Bio-Rad) as reported (13). Primers used are as follows: B2M (F: 5′-GAGGCTATCCAGCGTACT CCA-3′; R: 5′-CGGCAGGCATACTCATCTTTT-3′); CCNB1 (F: 5′-CCTGCCTGC AACAG TACCC-3′; R: 5′-CCAACACGATCTCTGGTCGC-3′); PRSS23 (F: 5′-GGAAGCGGCAG ATTTATGGCT-3′; R: 5′-TTCCA TCGTGTATGCAGTGGG-3′); SERPINH1 (F: 5′-ATGG TGACTC GGTCCTATACC-3′; R: 5′-CTCGTCGTCGTAGTAGTTGTAG-3′); CDKN1A (F: 5′-ACATCGCCAAGGAAAAACGC-3′; R: 5′-GTCT GTTTCGGTACTGTCATCC-3′); PLK1 (F: 5′-CACGAGGGGATTA ACTCAGGA-3′; R: 5′-TTTGGCGGCCCATAAAGATTG-3′); S100A7 (F: 5′-CGATGTTTCGCCAATACAGTGG-3′; R: 5′-GTTCACCAGA CCTGGCAT GT-3′); RNASE7 (F: 5′-CGTGTCCCTGACCATGTG TAA-3′; R: 5′-GACTTGTCTGTC GCTTCTCTT-3′); CNFN (F: 5′-ACACAGGTCTCACGGACTG-3′; R: 5′-CAGCACTCGC CAAAGTCGT-3′).
Functional classification of differentially expressed genes and meta-analysis of UVB-responsive genes
Differentially expressed genes (DEGs) identified by DEseq (fold change >2) between non-irradiated keratinocytes and melanocytes were classified by DAVID and ToppGene online software suites to identify enriched biological pathways. DEGs between UVB-irradiated cells and non-irradiated controls were analysed by iPathway (Advaita Corporation, Plymouth, MI, USA) online software suite to determine the enriched biological pathways in response to UVB radiation. Meta-analyses of UVB-responsive gene sets among different UVB conditions or between keratinocytes and melanocytes were performed using the iPathway online software suite to identify conserved UVB-responsive genes.
Statistics
Differential gene expression for RNA-seq data was calculated using DEseq (14). A False discovery rate (FDR) <0.05 was used to control for false discoveries. Significance of the differences in cell viability data between basal and UVB-stimulated conditions was determined by using the Wilcoxon signed-rank test. P < 0.05 was considered significant.
Results
UVB induced differential effects on cellular viability and transcriptomic changes between keratinocytes and melanocytes
Keratinocytes and melanocytes are two major skin cell types with distinctive embryonic origins, morphology and biological functions. We performed dose- and time-dependent analyses to compare cell viability in response to UVB radiation between keratinocytes and melanocytes isolated from the same individual. We found that UVB reduced the viability of both keratinocytes and melanocytes dose-dependently (Fig. 1a,b). At higher UVB doses such as 30 or 40 mJ/cm2, however, we found that UVB had less impact on the viability of melanocytes than on keratinocytes, consistent with previous observations (15). While melanin produced by melanocytes is widely known to confer protection against UVR in skin cells (16), the molecular mechanism(s) underlying melanocyte resistance to UVB have not been clearly defined.
Figure 1.
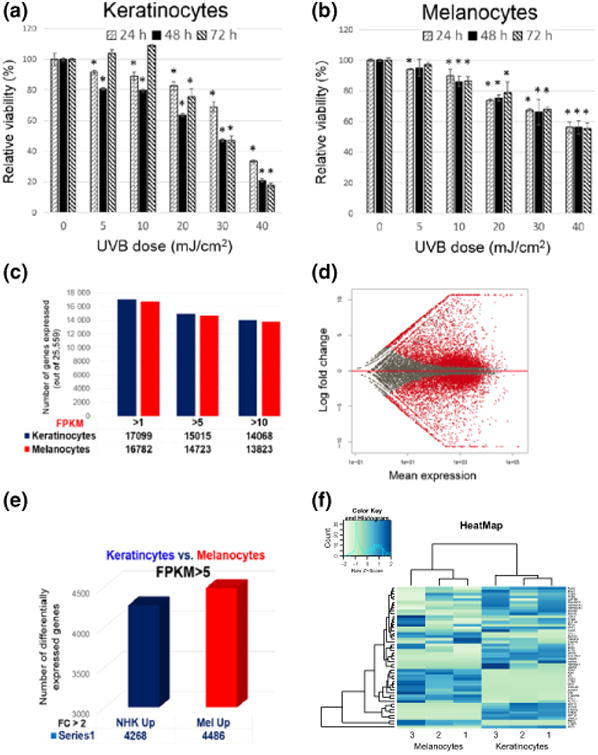
(a and b) Graphs illustrating dose- and time-dependent decreases in the viability of keratinocytes (a) and melanocytes (b) in response to UVB. Data from independent experiments (n = 3) using cells from a single donor were presented as mean ± SD. Relative viability values (%) were obtained by normalizing to the non-irradiated control cells. *: P < 0.05 when compared with non-irradiated control cells; (c–f) comparison of basal gene expression profiles between keratinocytes and melanocytes. (c) total number of genes expressed with relative expression values above each of the indicated FPKM cut-off; (d) Differential gene expression plot illustrating transcriptomic differences between melanocytes and melanocytes. Each dot represents a gene, and its position along the x-axis indicates its calculated mean expression. The y-axis depicts the log FC between keratinocyte and melanocytes. Each red dot indicates a differentially expressed gene between these two cell types (P value <0.05). Red dots above the middle red line represent genes with higher expressions in melanocytes. Red dots below the middle red line represent genes with higher expressions in keratinocytes; (e) Graphic representation of the total number of DEGs (FC cut-off >2) between keratinocyte and melanocytes; (f) Heat map depicting the expression patterns of 100 top-ranked DEGs between these two cell types from three different individuals (indicated by 1, 2 and 3).
To elucidate the molecular signatures underlying the distinctive cellular identity and function between keratinocytes and melanocytes, we compared the transcriptomes of melanocytes and keratinocytes derived from the same donor foreskin to assess differences in their gene expression profiles. We first calculated the total number of expressed genes based on their FPKM (fragments per kilobase of transcript per million mapped reads) values derived from RNA-Seq analyses. As summarized in Fig. 1c, there were similar numbers of genes expressed in these two cell types using three different FPKM cut-offs (1, 5, and 10), consistent with the findings from the Genotype-Tissue Expression project that compared tissue-specific gene expression profiles across 43 tissues from 175 individuals (17). To assess the differences in the relative level of gene expression between keratinocytes and melanocytes, we performed differential gene expression analysis using the DEseq software. The results are summarized in the differential gene expression plot in Fig. 1d, where each red dot indicates a DEG between these two cell types. Altogether, there are over 8700 genes displaying more than twofold differences in their relative levels of expression between melanocytes and keratinocytes (Fig. 1e). The expression pattern of 100 top-ranked DEGs (based on P values) is illustrated in the heat map in Fig. 1f. While there are individual variations in gene expression within each cell type at specific gene loci, the overall gene expression pattern between keratinocytes and melanocytes appears to be complementary to each other (Fig. 1f). Some of the top DEGs are well-characterized melanocyte or keratinocyte genes (Table S1). When we subjected the identified DEGs to gene ontology (GO) analysis using either DAVID or ToppGene software suites, melanocyte-specific or keratinocyte-specific biological pathways emerged among the top-ranked pathways (Figs S1 and S2), which supports the general concept that cellular identity is maintained by the expression of a specific subset of genes.
Differential transcriptomic responses to UVB radiation between keratinocytes and melanocytes
To test whether melanocyte resistance to UVB may reflect differences in UVR-induced transcriptomic alterations, we performed DEseq analyses to characterize gene expression changes in keratinocytes and melanocytes in response to UVB. Transcriptomes from UVB-irradiated keratinocytes and melanocytes were compared against their corresponding non-irradiated controls. UVB-induced transcriptomic changes are schematically presented in the differential gene expression plots in Fig. 2a,b, which illustrates that UVR caused more widespread transcriptomic changes in keratinocytes than in melanocytes. The observation that melanocytes are able to maintain a relative stable transcriptomic profile might explain partly their relative resistance to UVB-induced reduction in cell viability (Fig. 1b). Detailed dose- and time-dependent UVB-induced gene expression changes are shown in Fig. 2c,d, which reveals some major differences in UVR responses between keratinocytes and melanocytes. First, keratinocytes displayed a dose-dependent increase in total number of UVB-responsive genes at each of the three time points. Secondly, there is a time-dependent decrease in total number of UVB-responsive genes in keratinocytes within each dose group. And finally, UVB induced more gene repression than activation in keratinocytes 4 h following UVR, which reversed to more gene activation 24 h post-UVR. These UVR-responsive features were apparent in melanocytes (Fig. 2d).
Figure 2.
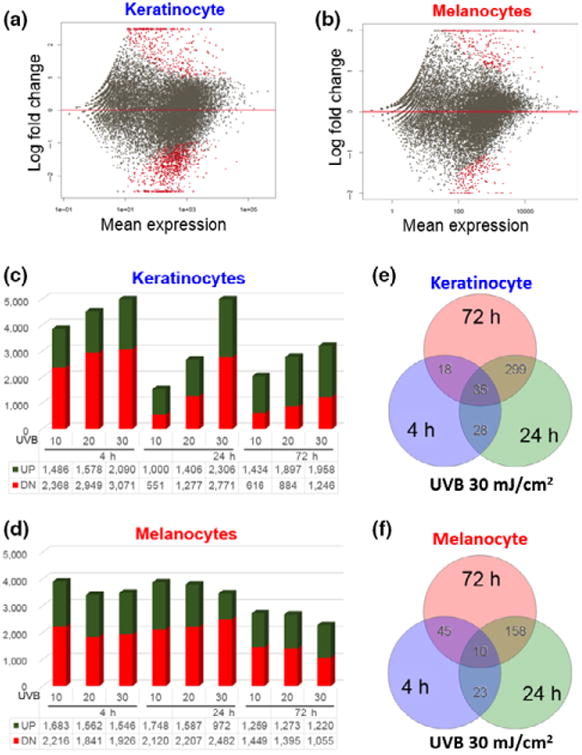
UVB-induced transcriptomic changes in keratinocytes and melanocytes. (a and b) Plots illustrating UVB-induced differential transcriptomic changes between keratinocytes and melanocytes. Each plot was generated using the average gene expression changes in response to three different UVB doses (10, 20 and 30 mJ/cm2) at 4 h after exposure. Each red dot indicates a differentially expressed gene between UVB-irradiated cells and non-irradiated control cells (FC cut-off set at 2 and P < 0.05). Red dots above the middle red line represent genes that were induced by UVB, while red dots below the middle red line represent genes that were repressed by UVB; (c and d) Time- and dose-dependent UVB-induced changes in global gene expression in keratinocytes and melanocytes; (e and f) Venn diagram illustrating the overlaps in the number of UVB-responsive genes at three different time points (4, 24 and 72 h) following 30 mJ/cm2 of UVB radiation.
To test whether UVB-induced changes in gene expression may persist through different time points post-UVR, we performed meta-analyses to identify UVB-responsive genes that overlap among the three time points of analyses (4, 24 and 72 h) following 30 mJ/cm2 UVR. We found that UVB-induced DEG set at 4 h had minimal overlap with DEG sets at 24 h or 72 h (Fig. 2e,f). In contrast, the overlap between 24 and 72 h DEG sets is much larger in both melanocytes and keratinocytes, suggesting that different sets of genes mediate early and late UVB responses. Similar patterns of UVR responses occurred in response to the 10 or 20 mJ/cm2 UVB doses (Fig. S3). Among the list of highly conserved UVB-responsive genes, CDNK1A (p21) and GDF15 are induced in both keratinocytes and melanocytes at all three time points post-UVR (Table S2). p21 induction by UVR has been reported previously and was proposed to function to initiate cell cycle arrest, inhibit DNA replication and facilitate DNA repair to compensate for the loss of p53 activity (18). GDF15 is a secreted protein belonging to TGF-β superfamily and has been shown to regulate keratinocyte differentiation in addition to its role in regulating cell proliferation and apoptosis (19).
Identification and validation of conserved UVB-responsive genes
To identify individual UVB-responsive genes and molecular pathways that are conserved in these two cell types, we performed meta-analyses of UVB-induced DEGs in keratinocytes and melanocytes exposed to different UVB doses using the iPathway software suite, which allows simultaneous analysis of up to five different data sets. We included two melanocyte lines and three keratinocyte lines in the meta-analyses and observed a dose-dependent increase in the number of conserved UVB-responsive genes (Fig. 3a). Interestingly, only 11 of the 95 common UVB-responsive genes at 30 mJ/cm2 were upregulated by UVR, including CDNK1A (p21) and GDF15 as described above, whereas the remaining genes were downregulated by UVR (Table S3). Furthermore, 94 of the 95 genes displayed consistent expression changes (activation or suppression) among these five different cell lines in response to UVR, strongly suggesting that UVR regulation of its target gene expression is mediated by specific transcription control mechanism(s).
Figure 3.
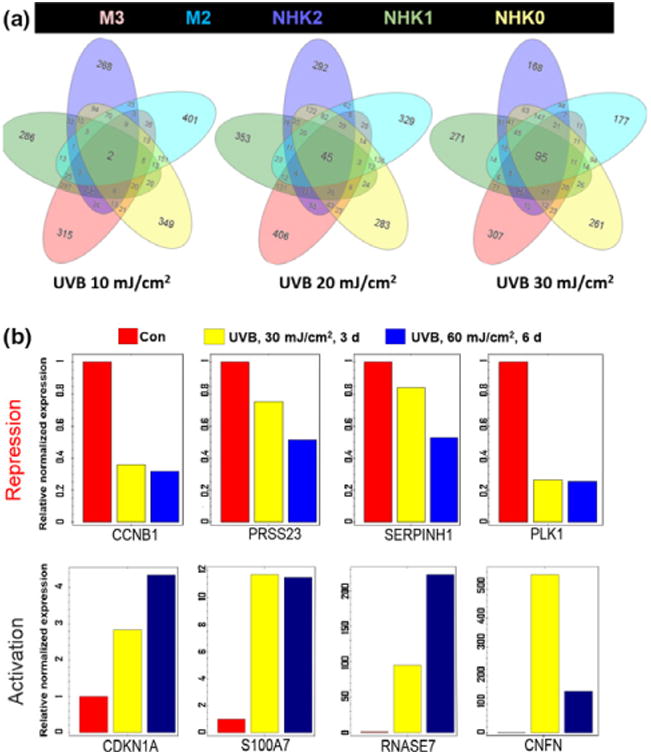
Conserved UVB-responsive genes in keratinocytes and melanocytes from different individuals. (a) dose-dependent increases in the total number of conserved UVB-responsive genes among different keratinocyte and melanocyte lines; (b) validation of selected UVB-responsive genes by qRT-PCR in keratinocytes from an independent donor. Four of the conserved UVB-upregulated genes and four downregulated genes by UVB were selected for this validation experiment. A time point at 6 days after exposure to a total of 60 mJ/cm2 UVB radiation was included to test the accumulative UVB effects on its target gene expression.
To test the general applicability of the identified UVB-responsive genes in keratinocytes, we selected eight representative UVB target genes for validation studies by qRT-PCR using cDNA prepared from an independent keratinocyte line (donor 4) that was not included in our RNA-Seq study. In the validation studies, we included an additional condition by irradiating the keratinocytes twice with 30 mJ/cm2 dose of UVB within a period of six days. qRT-PCR results in Fig. 3b confirmed our RNA-Seq results. We also observed an accumulative effect of UVR on the expression of most of the genes (Fig. 3b), highlighting their potential as reliable UVB biomarkers.
Distinctive and shared UVB-responsive pathways between keratinocytes and melanocytes
To compare UVR-responsive biological pathways between keratinocytes and melanocytes, we employed the iPathway software suite to perform gene ontology (GO) analysis using the differentially expressed gene sets under specific UVR conditions. We focused on keratinocytes and melanocytes exposed to 30 mJ/cm2 dose of UVB at 24-h and 72-h time points. Some of the shared and distinctive UVB-responsive pathways in these two cell types are summarized in Table 1. The p53 signalling pathway emerged as the most highly conserved functional pathway among the cell lines at two different time points post-UVR, consistent with the well-known role of p53 in UVR response. Surprisingly, changes in p53 signalling was mainly related to dysregulation of p53 target genes (Fig. S4a,b), whereas p53 mRNA expression itself was not profoundly affected by UVR (Table S4). Some of the commonly dysregulated p53 target genes between keratinocytes and melanocytes include CDKN1A (p21), CDC2, MDM2 and WIP1. However, there were cell type-specific variations in a subset of p53 target genes dysregulated by UVR. For example, dysregulation of GADD45 and DR5 was observed in melanocytes while dysregulation of PIDD and IGFBP3 occurred only in keratinocytes. This cell type-specific p53 UVR response exemplifies the versatility of p53 signalling in skin photobiology.
Table 1. Top-ranked molecular pathways following 30 mJ/cm2 of UVB radiation at 24 and 72 h in keratinocytes and melanocytes*.

|
Fonts in green highlights conserved pathways between keratinocytes and melanocytes at 72 h post-UVR; Fonts in blue highlights conserved keratinocyte pathways at 24 and 72 h post-UVR; Fonts in red highlights conserved pathways between keratinocytes and melanocytes at both 24 and 72 h post-UVR.
Discussion
Molecular mechanisms by which UVR modulates skin homoeostasis and disease susceptibility have been an active area of research for many decades. Our comprehensive transcriptomic analyses provided detailed information for the first time on the distinctive gene expression profiles between keratinocytes and melanocytes under both basal and UVR conditions. Many of the identified DEGs between keratinocytes and melanocytes under basal conditions fall into well-known cell type-specific functional pathways for each cell type. Many keratin genes (KRT5-8, KRT14-18), for example, are found to be abundantly expressed in keratinocytes but not detectable in melanocytes, and vice versa for melanocyte-specific genes such as TRY, TYRP1, DCT, PMEL and MLANA, consistent with Reemann et al. (20) reported previously. In response to UVR, keratinocytes manifest clear dose- and time-dependent changes in transcriptomic profile, with more genes being suppressed at 4 h post-UVR followed by a reversal towards more gene activation at later time points (24 and 72 h), highlighting differential acute and delayed transcriptomic responses to UVR. Unlike keratinocytes, the dose- and time-dependent UVB effects on gene dysregulation are less pronounced in melanocytes. Such differences in the kinetics of UVR-induced transcriptomic alterations may be attributed, at least in part, to the UV absorptive properties of melanin (21), which may act to diminish the acute effect of UVR on melanocytes. In addition to the commonly known role of melanin as a protector against UVR, a recent study shows that UV exposure causes chemiexcitation of melanin, which leads to a continuous lease of excited electrons that has DNA-damaging effects in melanocytes long after UV exposure (22). Thus, UVR can photochemically activate melanin to prolong UVR effects, which may explain the more sustained transcriptomic responses in the melanocytes as shown in Fig. 2d.
Mechanistically, the acute suppressive effects on global gene expression by UVB may arise from the large amount of UVB-induced DNA damages and formation of DNA dimers (23), which can alter DNA structures to block gene transcription (24,25). UVR may also adversely affect transcription initiation (25), or RNA maturation (26) to acutely suppress its target gene expression. While the cells recover from UVR, active DNA repair occurs following UVR to allow transcription restoration of genes affected by UV-induced DNA damages, which explains the decreased number of UVB-suppressed genes at 24 h post-UVR (Fig. 2c). In contrast to the time-dependent decrease in the number of UVB-suppressed genes, the number of genes activated by UVB remains relatively stable and persistent throughout the 72-h period (Fig. 2c). UVB-induced gene activation may involve rapid activation of MAP kinases p38 and JNK-SAPK that subsequently activate their target transcription factors, such as p53 and NF-kB, to augment the transcription of further downstream genes (27–29). We did not observe any pronounced changes in p53 mRNA, however, despite a widespread dysregulation of p53 downstream target genes (Fig. S4a,b). Activation of p53 activity may be achieved by increased protein stability and post-translational modifications in response to UVR (30,31). In addition to these established mechanisms through which UV regulates its target gene expression, UVR may also modulate the chromatin environment to alter its target gene expression via DNA methylation changes or post-translational modifications of the histone proteins (32,33), which awaits further studies in the future.
As shown in Table 1, cancer-related pathways are among the most frequently dysregulated pathways by UVB in both melanocytes and keratinocytes. Perturbation of immune-related pathways, however, is more prevalent in keratinocytes, highlighting the importance of keratinocytes in UVB-induced immune response in the skin. Solar UV radiation is known to exert profound immuno-suppressive effects on the skin that contribute to skin carcinogenesis (34,35). The exact mechanisms of UV-induced immunosuppression and the relative contribution of UVB and UVA, however, remain to be elucidated. Our analysis reveals that UVB augments the expression of key cytokines in keratinocytes including IL-8. Enhanced IL-8 (CXCL8) signalling has recently been shown to protect human paediatric sarcomas from the immune system (36), highlighting the potential role of IL-8 activation in UVB-induced immunosuppression. Given that our cell culture-based studies did not take into account the interactions between keratinocytes and immune cells in intact skin following UVB exposure, additional in vivo studies are warranted to verify and validate the role of IL-8 signalling in mediating UV-induced immunosuppression in skin carcinogenesis.
An unmet need in the field of skin photocarcinogenesis research relates to the lack of reliable biomarkers that can predict UVR photobiological effects following excessive sun exposure. Conceptually, reliable UVR biomarkers would consist of genes whose expression in response to UVR is persistent over time and also consistent among different individuals. Our analyses have yielded a list of promising UVB-responsive genes that are well conserved in keratinocytes and melanocytes from different individuals in response to different UVB doses and at different time points post-UVR. The observation that UVB-induced changes in the expression of a subset of genes can persist days after UVR highlights the potential of these genes as UVB biomarkers. In future studies, we will subject the list of conserved UVB-responsive genes to extensive validation studies. We aim to identify genes that exhibit persistent and/or accumulative changes upon multiple exposures to be further validated as clinical biomarkers for predicting UVB risk effects. In addition, some of the novel UVB-responsive genes can be exploited as targets for developing mechanism-based photochemopreventions as an effective strategy for reducing UV-induced skin cancer incidence and other adverse photobiological effects on the skin.
Supplementary Material
Figure S1. GO analysis using DAVID and ToppGene software suites showing that genes more highly expressed in keratinocytes than in melanocytes fall into keratinocyte-specific biological pathways.
Figure S2. GO analysis using DAVID or ToppGene software suites showing that genes more highly expressed in melanocytes than in keratinocytes fall into melanocyte-specific biological pathways.
Figure S3. UVB-induced DEG set at 4 h had minimal overlap with DEG sets at 24 h or 72 h, whereas the overlap between 24 h and 72 h UVB-induced DEG sets is much larger in both melanocytes and keratinocytes in response to two different UVB doses (10 and 20 mJ/cm2).
Figure S4A. Perturbed p53 signaling via UVB-induced dysregulation of p53 target genes in keratinocytes 24 h post 30 mJ/cm2 of UVR.
Figure S4B. Perturbed p53 signaling via UVB-induced dysregulation of p53 target genes in melanocytes 24 h post 30 mJ/cm2 of UVR.
Table S1. List of representative differentially expressed genes and their FPKM values in melanocyte and keratinocyte from three different individuals.
Table S2. UVR-induced consistent changes in CDKN1A and GDF15 expression (FPKM values) under different UVB conditions in keratinocytes (NHK) and melanocyte (MEL).
Table S3. List of common UVB-responsive genes in melanocyte and keratinocyte lines 24h post 30 mJ/cm2 of UVR.
Table S4. UVR-induced changes in the level of p53 gene expression (FPKM values) under different UVB conditions in three individual keratinocyte lines (K) and two melanocyte (M) lines.
Acknowledgments
We thank Dr. Angela Christiano for her generous support and critical reading of the manuscript. Research reported in this publication was supported by the National Institute of Arthritis and Musculoskeletal and Skin Diseases of the National Institutes of Health under Award Number K01AR064315, the Columbia University Skin Disease Research Center grant P30AR44535, the Center for Environmental Health in Northern Manhattan P30 ES009089 and American Skin Association (L.L.).
Abbreviations
- BCC
basal cell carcinoma
- DEG
differentially expressed gene
- FC
fold change
- FDR
false discovery rate
- FPKM
fragments per kilobase of transcript per million mapped reads
- GO
gene ontology
- RTA
real-time analysis
- SCC
squamous cell carcinoma
- UVA
ultraviolet A
- UVB
ultraviolet B
- UVR
ultraviolet radiation
Footnotes
Author contributions: LL designed the study, performed the research and wrote the manuscript. XS, MN, YS and LL analysed and interpreted the data. AK contributed essential tools and critically revised the manuscript. All authors reviewed the manuscript.
Conflict of interests: The authors stated that they have no conflict of interest.
Supporting Information: Additional Supporting Information may be found online in the supporting information tab for this article
References
- 1.Kollias N, Ruvolo E, Jr, Sayre RM. Photochem Photobiol. 2011;87:1474–1475. doi: 10.1111/j.1751-1097.2011.00980.x. [DOI] [PubMed] [Google Scholar]
- 2.Afaq F, Adhami VM, Mukhtar H. Mutat Res. 2005;571:153–173. doi: 10.1016/j.mrfmmm.2004.07.019. [DOI] [PubMed] [Google Scholar]
- 3.Fisher GJ. Cutis. 2005;75:5–8. discussion 8-9. [PubMed] [Google Scholar]
- 4.Aubin F, Eur J. Dermatol. 2003;13:515–523. [PubMed] [Google Scholar]
- 5.Federman DG, Kirsner RS, Viola KV. Clin Dermatol. 2013;31:666–670. doi: 10.1016/j.clindermatol.2013.05.002. [DOI] [PubMed] [Google Scholar]
- 6.Pfeifer GP, Besaratinia A. Photochem Photobiol Sci. 2012;11:90–97. doi: 10.1039/c1pp05144j. [DOI] [PMC free article] [PubMed] [Google Scholar]
- 7.de la Fuente H, Lamana A, Mittelbrunn M, et al. PLoS ONE. 2009;4:e6735. doi: 10.1371/journal.pone.0006735. [DOI] [PMC free article] [PubMed] [Google Scholar]
- 8.Koch-Paiz CA, Amundson SA, Bittner ML, et al. Mutat Res. 2004;549:65–78. doi: 10.1016/j.mrfmmm.2004.01.010. [DOI] [PubMed] [Google Scholar]
- 9.Yang G, Zhang G, Pittelkow MR, et al. J Invest Dermatol. 2006;126:2490–2506. doi: 10.1038/sj.jid.5700470. [DOI] [PubMed] [Google Scholar]
- 10.Rieger KE, Chu G. Nucleic Acids Res. 2004;32:4786–4803. doi: 10.1093/nar/gkh783. [DOI] [PMC free article] [PubMed] [Google Scholar]
- 11.Dazard JE, Gal H, Amariglio N, et al. Oncogene. 2003;22:2993–3006. doi: 10.1038/sj.onc.1206537. [DOI] [PubMed] [Google Scholar]
- 12.Dawes JM, Antunes-Martins A, Perkins JR, et al. PLoS ONE. 2014;9:e93338. doi: 10.1371/journal.pone.0093338. [DOI] [PMC free article] [PubMed] [Google Scholar]
- 13.Liu L, Kim H, Casta A, et al. FASEB J. 2014;28:1534–1542. doi: 10.1096/fj.13-237677. [DOI] [PMC free article] [PubMed] [Google Scholar]
- 14.Anders S, Huber W. Genome Biol. 2010;11:R106. doi: 10.1186/gb-2010-11-10-r106. [DOI] [PMC free article] [PubMed] [Google Scholar]
- 15.Cooper KL, Yager JW, Hudson LG. Toxicol Lett. 2014;224:407–415. doi: 10.1016/j.toxlet.2013.11.010. [DOI] [PMC free article] [PubMed] [Google Scholar]
- 16.Kadekaro AL, Kavanagh RJ, Wakamatsu K, et al. Pigment Cell Res. 2003;16:434–447. doi: 10.1034/j.1600-0749.2003.00088.x. [DOI] [PubMed] [Google Scholar]
- 17.Consortium GT. Science. 2015;348:648–660. [Google Scholar]
- 18.Liu M, Wikonkal NM, Brash DE. J Invest Dermatol. 1999;113:283–284. doi: 10.1046/j.1523-1747.1999.00657.x. [DOI] [PubMed] [Google Scholar]
- 19.Ichikawa T, Suenaga Y, Koda T, et al. Oncogene. 2008;27:409–420. doi: 10.1038/sj.onc.1210658. [DOI] [PubMed] [Google Scholar]
- 20.Reemann P, Reimann E, Ilmjarv S, et al. PLoS ONE. 2014;9:e115717. doi: 10.1371/journal.pone.0115717. [DOI] [PMC free article] [PubMed] [Google Scholar]
- 21.Jenkins NC, Grossman D. Biomed Res Int. 2013;2013:908797. doi: 10.1155/2013/908797. [DOI] [PMC free article] [PubMed] [Google Scholar]
- 22.Premi S, Wallisch S, Mano CM, et al. Science. 2015;347:842–847. doi: 10.1126/science.1256022. [DOI] [PMC free article] [PubMed] [Google Scholar]
- 23.Cadet J, Sage E, Douki T. Mutat Res. 2005;571:3–17. doi: 10.1016/j.mrfmmm.2004.09.012. [DOI] [PubMed] [Google Scholar]
- 24.McKay BC, Ljungman M. Neoplasia. 1999;1:276–284. doi: 10.1038/sj.neo.7900028. [DOI] [PMC free article] [PubMed] [Google Scholar]
- 25.Kantor GJ, Hull DR. Biophys J. 1979;27:359–370. doi: 10.1016/S0006-3495(79)85223-6. [DOI] [PMC free article] [PubMed] [Google Scholar]
- 26.McKay BC. Antioxid Redox Signal. 2014;20:640–654. doi: 10.1089/ars.2013.5523. [DOI] [PMC free article] [PubMed] [Google Scholar]
- 27.Latonen L, Taya Y, Laiho M. Oncogene. 2001;20:6784–6793. doi: 10.1038/sj.onc.1204883. [DOI] [PubMed] [Google Scholar]
- 28.Ono K, Han J. Cell Signal. 2000;12:1–13. doi: 10.1016/s0898-6568(99)00071-6. [DOI] [PubMed] [Google Scholar]
- 29.Cooper SJ, Bowden GT. Curr Cancer Drug Targets. 2007;7:325–334. doi: 10.2174/156800907780809714. [DOI] [PMC free article] [PubMed] [Google Scholar]
- 30.Ashcroft M, Taya Y, Vousden KH. Mol Cell Biol. 2000;20:3224–3233. doi: 10.1128/mcb.20.9.3224-3233.2000. [DOI] [PMC free article] [PubMed] [Google Scholar]
- 31.Hofmann TG, Moller A, Sirma H, et al. Nat Cell Biol. 2002;4:1–10. doi: 10.1038/ncb715. [DOI] [PubMed] [Google Scholar]
- 32.Chen IP, Henning S, Faust A, et al. Photochem Photobiol Sci. 2012;11:180–190. doi: 10.1039/c1pp05197k. [DOI] [PubMed] [Google Scholar]
- 33.Katiyar SK, Singh T, Prasad R, et al. Photochem Photobiol. 2012;88:1066–1074. doi: 10.1111/j.1751-1097.2011.01020.x. [DOI] [PMC free article] [PubMed] [Google Scholar]
- 34.Noonan FP, Muller HK, Fears TR, et al. J Invest Dermatol. 2003;121:1175–1181. doi: 10.1046/j.1523-1747.2003.12560.x. [DOI] [PubMed] [Google Scholar]
- 35.Damian DL, Patterson CR, Stapelberg M, et al. J Invest Dermatol. 2008;128:447–454. doi: 10.1038/sj.jid.5701058. [DOI] [PubMed] [Google Scholar]
- 36.Highfill SL, Cui Y, Giles AJ, et al. Sci Transl Med. 2014;6:237ra267. doi: 10.1126/scitranslmed.3007974. [DOI] [PMC free article] [PubMed] [Google Scholar]
Associated Data
This section collects any data citations, data availability statements, or supplementary materials included in this article.
Supplementary Materials
Figure S1. GO analysis using DAVID and ToppGene software suites showing that genes more highly expressed in keratinocytes than in melanocytes fall into keratinocyte-specific biological pathways.
Figure S2. GO analysis using DAVID or ToppGene software suites showing that genes more highly expressed in melanocytes than in keratinocytes fall into melanocyte-specific biological pathways.
Figure S3. UVB-induced DEG set at 4 h had minimal overlap with DEG sets at 24 h or 72 h, whereas the overlap between 24 h and 72 h UVB-induced DEG sets is much larger in both melanocytes and keratinocytes in response to two different UVB doses (10 and 20 mJ/cm2).
Figure S4A. Perturbed p53 signaling via UVB-induced dysregulation of p53 target genes in keratinocytes 24 h post 30 mJ/cm2 of UVR.
Figure S4B. Perturbed p53 signaling via UVB-induced dysregulation of p53 target genes in melanocytes 24 h post 30 mJ/cm2 of UVR.
Table S1. List of representative differentially expressed genes and their FPKM values in melanocyte and keratinocyte from three different individuals.
Table S2. UVR-induced consistent changes in CDKN1A and GDF15 expression (FPKM values) under different UVB conditions in keratinocytes (NHK) and melanocyte (MEL).
Table S3. List of common UVB-responsive genes in melanocyte and keratinocyte lines 24h post 30 mJ/cm2 of UVR.
Table S4. UVR-induced changes in the level of p53 gene expression (FPKM values) under different UVB conditions in three individual keratinocyte lines (K) and two melanocyte (M) lines.