

Abstract
Background/Objectives
Central adiposity measures such as waist circumference (WC) and waist-to-hip ratio (WHR) are associated with cardiometabolic disorders independently of BMI and are gaining clinically utility. Several studies report genetic variants associated with central adiposity, but most utilize only European ancestry populations. Understanding whether the genetic associations discovered among mainly European descendants are shared with African ancestry populations will help elucidate the biological underpinnings of abdominal fat deposition.
Subjects/Methods
To identify the underlying functional genetic determinants of body fat distribution, we conducted an array-wide association meta-analysis among persons of African ancestry across seven studies/consortia participating in the Population Architecture using Genomics and Epidemiology (PAGE) consortium. We used the Metabochip array, designed for fine mapping cardiovascular associated loci, to explore novel array-wide associations with WC and WHR among 15 945 African descendants using all and sex-stratified groups. We further interrogated 17 known WHR regions for African ancestry-specific variants.
Results
Of the 17 WHR loci, eight SNPs located in four loci were replicated in the sex-combined or sex-stratified meta-analyses. Two of these eight independently associated with WHR after conditioning on the known variant in European descendants (rs12096179 in TBX15-WARS2 and rs2059092 in ADAMTS9). In the fine mapping assessment, the putative functional region was reduced across all four loci but to varying degrees (average 40% drop in number of putative SNPs and 20% drop in genomic region). Similar to previous studies, the significant SNPs in the female stratified analysis were stronger than the significant SNPs from the sex-combined analysis. No novel associations were detected in the array-wide analyses.
Conclusions
Of 17 previously identified loci, four loci replicated in the African ancestry populations of this study. Utilizing different linkage disequilibrium patterns observed between European and African ancestries, we narrowed the suggestive region containing causative variants for all four loci.
INTRODUCTION
Waist-related traits such as waist-to-hip ratio (WHR) and waist circumference (WC) are common measures of central adiposity – a risk factor of cardiovascular and metabolic disease. WC may better predict type 2 diabetes mellitus in comparison to overall adiposity (BMI) and greater hip circumference potentially associates with lower risk of cardiovascular diseases, particularly among women.1–4 In the U.S., while the increase in overall obesity prevalence has slowed,5 the average WC continues to increase6 and obesity (overall and central) continues to disproportionally burden minority groups such as African Americans.7, 8 According to a recent report by the Centers for Disease Control, the demographic group with the highest prevalence of obesity is non-Hispanic African American women (57% obese).9
Though obesity is higher among many minority groups, most genetic studies have focused on European descendant populations, and any benefits reaped from genetic studies may only be applicable and benefit European descendants. In addition, due to high linkage disequilibrium (LD) in European ancestry groups, the single nucleotide polymorphisms (SNPs) identified in European ancestry genome wide association studies (GWAS) often only point to general genomic areas of interest and the causal functional variants remain elusive. A greater refinement of genomic regions containing putative functional variants is possible by utilizing different LD patterns among various ancestry populations, particularly the relatively low LD among African descendants.10
We aimed to refine the genomic regions containing the functional genetic determinants of body fat distribution by conducting an array-wide association analysis among African descendants. For genotyping, we used a chip (Metabochip) uniquely poised to refine genomic regions of interest due its custom design densely covering cardiovascular related genomic regions of interest, including 17 genetic regions associated with waist-to-hip ratio adjusted for BMI (WHRa).11
MATERIALS AND METHODS
Participant recruitment and study population
Participants were recruited from studies involved in the PAGE consortium – a consortium initiated by the National Human Genome Research Institute (NHGRI) specially designed to investigate well-replicated genetic variants among racially and ethnically diverse populations in the U.S as described elsewhere.12 For this PAGE Metabochip study, all cohorts with African American participants and waist-related traits were included for the analyses, which consisted of the Atherosclerosis Risk in Communities (ARIC) study, Coronary Artery Risk Development in Young Adults (CARDIA) study, the Cardiovascular Health Study (CHS), the Multiethnic Cohort Study (MEC), and the Women’s Health Initiative (WHI). We also extended the collaboration to three additional studies – GenNet, Hypertension Genetic Epidemiology Network (HyperGen), and the Multi-Ethnic Study of Atherosclerosis (MESA), which brought up the total sample size to 15 945 (see Supplementary Information and Supplementary Table S1 for detailed study descriptions). All studies were approved by Institutional Review Boards at their respective sites. All participants in this analyses provided written informed consent and self-identified as African American or having African ancestry.
Anthropometry measurements
Weight, height, WC and hip circumference were measured by trained staff at study enrollment in a clinical setting for studies ARIC, CARDIA, CHS, HyperGEN, GenNet, MESA, and WHI. MEC participants provided self-reported height and weight and self-measured WC and hip circumference. In a MEC validation subset, self-measured circumferences were highly correlated with technician measurements for waist (r=0.93), hip (r=0.96), and WHR (r=0.76) and slightly underestimated the waist (by 3.95cm) and hip (by 0.1cm) circumferences.13 Other studies have similarly shown correlations above 0.8614–16 and small systematic mismeasurement between self-reported and measured anthropometry, which may reduce detection power of WC or WHR associated variants but not bias the associations in self-reported data.14, 17, 18
BMI was calculated by dividing weight (kg) by height (m2) and WHR was calculated by dividing waist circumference (cm) by hip circumference (cm). We excluded, underweight (BMI<18.5 kg/m2) and extreme overweight (BMI>70 kg/m2) individuals and those with outlier WC and WHR values (SD > 3) with the assumption that these extremes could be attributable to data coding errors or underlying rare conditions with contributions from genetic variants not common to the general population. We also limited analysis to individuals aged 20 years or above to exclude the adolescent age period where weight and height can fluctuate dramatically and increase variability.
Genotyping and quality control
Genotyping was performed using the Metabochip – a chip with more than 122 000 SNPs included to fine-map 257 GWAS loci of 23 traits. The Metabochip design, trait selection, and locus definition has been described elsewhere.19 Of the 257 loci, fourteen WHRa GWAS loci were included on the array and were the main focus of the current study. After the completion of the Metabochip design, another large-scale GWAS on WHR by Shungin et al.20 identified 33 additional novel WHRa SNPs. We cross checked whether these 33 SNPs overlapped with other Metabochip fine-mapping regions and found three more loci initially placed on the Metabochip for other trait investigation (triglycerides, systolic blood pressure, and QT interval). The additional three loci increased our target loci to 17 (Supplementary Table S2). Further quality control information available elsewhere21 and Supplementary Table S3.
For all studies, with the exception of family based studies (HyperGen and GenNet), we estimated identical-by-descent statistics to identify related persons using PLINK.22 For each first-degree relative pairs identified, we excluded the member with the lower call rate. We also excluded samples with an inbreeding coefficient (F) above 0.15 (ARIC, CHS, CARDIA, MEC, MESA, WHI).23 As described elsewhere,21,24 ancestral outliers were determined visually against HapMap phase 2 reference populations (Supplementary Figure S1), in addition to EIGENSOFT25,26 determination of outliers (any first ten principal components with SD > 6). Ancestral principal components were then recalculated separately for each study excluding HapMap genotypes.
Statistical analysis
The overall study design are depicted in Figure 1. We evaluated the association between each SNP and natural log-transformed WC and WHR with adjustment for BMI (WCa and WHRa respectively). Due to the high sex dimorphism noted in several studies on WHR associated SNPs,11, 27–30 we conducted the association analyses in sex stratified groups as well (sex-combined, females-only, and males-only) in each study. For all studies except GenNet and HyperGen (family studies), we used linear regression under the assumption of an additive genetic model with the adjustment for BMI, age, sex, age*sex (for sex-combined analyses only), study site (as applicable), and ancestry principal components in each study. Any overly influential outliers were removed. Family data from GenNet and HyperGen were analyzed using linear mixed models to account for relatedness.31 As a sensitivity analysis, we analyzed MEC using all participants combined and also separately by case-control status for diabetes (390 cases, 667 controls). However, there was little difference between the meta-analyzed results (Supplementary Figure S2); therefore, we present meta-analyses from all studies including all MEC participants.
Figure 1.
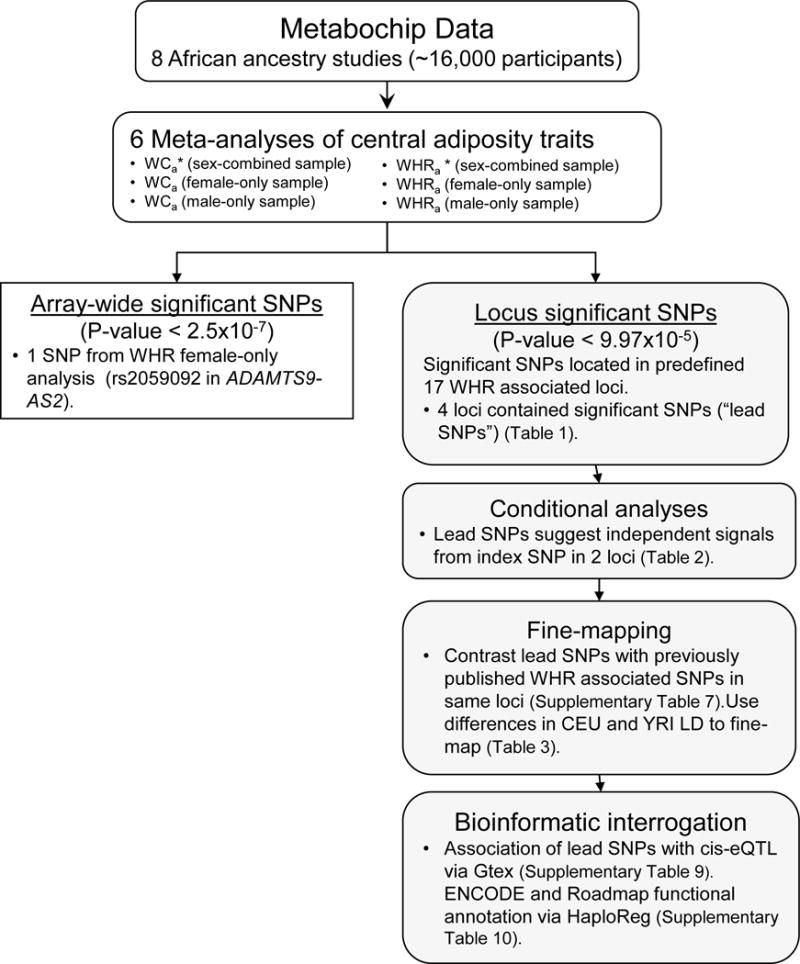
Analysis flow chart. This diagram shows the main steps used in the meta-analysis. The rectangular box shows steps for SNPs reaching array-wide significance. Shaded boxes show steps for SNPs reaching locus-wide significance, including the further locus interrogation through conditional analyses, fine-mapping, and bioinformatics interrogation.
*WCa: Waist circumference adjusted for BMI; WHRa: Waist-to-hip ratio adjusted for BMI
Fixed-effect models with inverse variance weighting were used to pool the study-specific association results as implemented in METAL.32 Chi-square statistics and I2 were used to measure heterogeneity across studies, and SNPs with chi-square heterogeneity P-value <0.05 or I2 > 50 were excluded. When testing all SNPs Metabochip-wide for SNPs with significant association with WCa or WHRa, we used a Bonferroni adjusted significance level based on the total number of SNPs on the chip, 2.5×10⁻⁷ (0.05 divided by 200,000 SNPs).
For the 17 WHRa regions of interest (Supplementary Information, Supplementary Table S2), we first interrogated the genome-wide significant SNP from Heid et al.11 or Shungin et al.20 which we labeled the “index SNP”. If the SNP shared directional consistency in both European and African ancestry populations and showed nominal statistical significance (P-value<0.05) in our meta-analyses, we classified the index SNP as “generalized”.
Due to the decreased LD in populations of African ancestry,33, 34 we also hypothesized that even if the index SNP originally identified in European ancestry populations was not associated with WHRa for those within our African ancestral cohort, another variant in the same chromosomal region may show strong associations: “lead SNPs”. Therefore, we searched for common variants strongly associated with WHRa within the established loci and differentiated whether the identified SNPs were “index-dependent lead signals” or “index independent lead signals”. We identified lead SNPs as index-dependent signals (thus potentially better markers of the index signal) if they were (1) within the defined WHRa region of the index SNP as defined on the Metabochip19, (2) dependent on the index SNP (r2≥0.4) based on the referent population (CEU), and (3) associated with WHRa in our data at a Bonferroni significance level, correcting for the average number of SNPs across the 17 regions tested (P-value<9.97×10⁻⁵). We identified lead SNPs as index-independent signals if they (1) were within the defined WHRa region, (2) had an r2<0.4 of the index SNP based on CEU LD, (3) displayed a region wide significance (P-value<9.97×10⁻⁵) and 4) after controlling for the index SNP using approximate conditional analysis methods35, had retained a P-value of at least 9.97×10⁻⁵.
LD in the African American sample (including African Americans from ARIC, MEC, and WHI) was calculated in 500kb sliding windows using PLINK.22 Likewise, Metabochip LD and frequency information in Europeans was provided by the Malmö Diet and Cancer Study on 2143 controls from a Swedish population36 to facilitate the LD pattern comparisons between African and European ancestry populations. LocusZoom plots37 were used to graphically display the fine-mapping results. Recombination rates were estimated from 1000G Project data.
Given our sample size (~16 000), we are reasonably powered (80%) to detect common SNPs (30%) with average effect sizes (0.003), but are underpowered to detect lower frequency variants (<10%) (Supplementary Information).
Comparison with other published lead SNPs
Several GWAS in European descent populations have identified different SNPs in the 17 loci38, 39 than those reported by Heid et al.11 Additionally, two discovery studies in African descent populations also identified other SNPs.27, 28 We compared our lead SNPs to the significant SNPs identified in these previous studies and assessed independence of the signals by conditional analyses when the LD was r2<0.4 using the 1000G CEU structure. We additionally estimated the amount of narrowing each WHRa region by contrasting all SNPs in high LD (r2 > 0.8) with the significant SNPs using the 1000G YRI LD structure and the 1000G CEU LD structure.
Genotype-tissue expression lookups
We collected association values between genetic variation and gene expression in human tissues using the Genotype-Tissue Expression (GTEx)40 database. The database offers expression quantitative trait locus (eQTL) mapping in several different tissues. We focused on subcutaneous adipose and skeletal muscle tissues (plausible target tissues for the waist size variants) to estimate eQTL. For the four loci where we identified a significant SNP (P-value<9.97×10⁻⁵), we found association strengths between our lead SNPs or other reported SNPs13,14,17,18,19 and the expression of genes lying within +/−500kb. We used a Bonferroni correction based on the number of SNPs and tissues and genes tested for each locus. For example, for the TBX15-WARS2 locus, we tested five SNPs in two tissues with expression in three different genes (TBX15, WARS2, and RP11-418J17.1), making our P-value cut-off 0.00167 (P-value < 0.05/(5*2*3)).
RESULTS
Up to 15 945 African ancestry participants from eight studies were included in the meta-analyses with a mean age of 55 years in women and 48 years in men (range 20 to 100 years; Supplementary Information, Supplementary Table S1). Approximately 77% of participants were females. On average, females had lower WHR and WC (WHR=0.85, WC=97.5 cm) in comparison to men (WHR=0.9, WC=98 cm).
In our Metabochip-wide analyses of the WCa trait, no SNPs reached array wide significance. In our analyses of the WHR and WHRa trait, only one SNP (rs2059092 SNP in ADAMTS9; β[SE]=0.0072 [0.0014]; P-value=9.98×10⁻⁸) reached array-wide significance for WHRa in the female stratified analysis. Minimal inflation was observed in the analyses (inflation factor λ<1.1) (Supplementary Figure S3).
Sex-specific Fine Mapping of Metabochip Regions for WHR
When we focused on fine mapping of the 17 known WHRa loci in European ancestry populations, our female-specific analysis (Supplementary Information, Supplementary Table S2) showed that 13 of the 17 index SNPs had directional consistency in the effect estimates (binominal distribution P-value = 0.005) with the lead SNP for the region. Of the 17 known WHR regions on the Metabochip, four loci (in or near TBX15-WARS2, GRB14, ADAMTS9, and RSPO3) contained a lead SNP associated with WHRa at our Bonferonni corrected significance threshold of P-value<9.97×10⁻⁵ in this African ancestry sample (Table 1, Supplementary Information, and Supplementary Figures S4–7). The lead SNP in RSPO3 (rs9491696) was also the index SNP previously identified in the European ancestry discovery study.14 The lead SNP near the locus GRB14 has strong LD (r2=0.806 using 1000G CEU LD) with the index SNP. The lead SNP in the TBX15-WARS2 locus had a LD r2 of 0.326 with the index SNP, and the lead SNP in the ADAMTS9 locus had a LD r2 of 0.056 with the index SNP of the same locus. Of the three significant lead SNPs, only rs2059092 showed attenuation in significance after adjusting for the index SNP (rs6795735) but remained significant (P-value before conditioning = 9.98×10⁻⁸, P-value after conditioning = 1.23×10⁻⁶) indicating that the lead SNP in the ADAMTS9 locus points to an independent signal (Table 2).
Table 1.
WHR association results of significant lead SNPs and the previously reported European descent index SNP in the same locus.
| Locus | Locus Namea | Lead SNPb | Index SNPc | BP positiond | EA/OA | EAF | Beta | SE | P-value | Het P-value e | Sample Size | r2 in EA f | r2 in AA g | Nearest Geneh |
|---|---|---|---|---|---|---|---|---|---|---|---|---|---|---|
|
Female-only analysis significant lead SNPs
| ||||||||||||||
| 1p12 | TBX15-WARS2 | rs6701378 | 119440076 | A/G | 0.462 | 0.0054 | 0.0013 | 3.07E-05 | 0.104 | 10870 | – | – | WARS2 (intronic) | |
| rs984222 | 119305366 | G/C | 0.454 | 0.0018 | 0.0012 | 0.15 | 0.039 | 10867 | 0.326 | 0.367 | TBX15 (intronic) | |||
| 2q24.3 | GRB14 | rs6717858 | 165247907 | A/G | 0.318 | 0.0071 | 0.0014 | 3.49E-07 | 0.554 | 10863 | – | – | 1.6kb 3′ of COBLL1 | |
| rs10195252 | 165221337 | A/G | 0.285 | 0.0074 | 0.0015 | 3.97E-07 | 0.278 | 10867 | 0.865 | 1 | 28kb 3′ of COBLL1 | |||
| 3p14.1 | ADAMTS9 | rs2059092 | 64690744 | A/G | 0.687 | 0.0072 | 0.0014 | 9.98E-08 | 0.860 | 10838 | – | – | ADAMTS9-AS2 (intronic) | |
| rs6795735 | 64680405 | G/A | 0.195 | 0.0027 | 0.0016 | 0.09 | 0.426 | 10867 | 0.056 | 0.090 | ADAMTS9-AS2 (intronic) | |||
| 6q22.33 | RSPO3 | rs9491696 | 127494332 | G/C | 0.381 | 0.0053 | 0.0013 | 2.58E-05 | 0.763 | 10872 | – | – | RSPO3 (intronic) | |
| index and lead are the same SNP | – | – | – | – | – | – | – | – | – | |||||
|
Male-only analysis significant lead SNPs | ||||||||||||||
| 1p12 | TBX15-WARS2 | rs7412918 | 119501988 | G/C | 0.626 | 0.0054 | 0.0013 | 2.47E-05 | 0.144 | 3698 | 0.236 | 0.096 | RP11-418J17.1 | |
| rs984222 | 119305366 | G/C | 0.463 | 0.0032 | 0.0012 | 6.92E-03 | 0.079 | 3706 | – | – | TBX15 (intronic) | |||
|
Sex-combined analysis significant lead SNPs | ||||||||||||||
| 1p12 | TBX15-WARS2 | rs12096179 | 119437246 | G/A | 0.451 | 0.0044 | 0.0009 | 2.24E-06 | 0.206 | 15943 | – | – | WARS2 (intronic) | |
| rs984222 | 119305366 | G/C | 0.454 | 0.0025 | 0.0009 | 5.52E-03 | 0.358 | 15936 | 0.326 | 0.367 | TBX15 (intronic) | |||
| 2q24.3 | GRB14 | rs10195252 | 165221337 | A/G | 0.279 | 0.0049 | 0.0011 | 3.69E-06 | 0.100 | 15939 | – | – | 28kb 3′ of COBLL1 | |
| index and lead are the same SNP | – | – | – | – | – | – | same | same | ||||||
| 3p14.1 | ADAMTS9 | rs2059092 | 64690744 | A/G | 0.686 | 0.0044 | 0.0010 | 5.897E-06 | 0.575 | 15906 | – | – | ADAMTS9-AS2 (intronic) | |
| rs6795735 | 64680405 | G/A | 0.188 | 0.0021 | 0.0011 | 0.06 | 0.231 | 15937 | 0.056 | 0.09 | ADAMTS9-AS2 (intronic) | |||
| 6q22.33 | RSPO3 | rs9321069 | 127434670 | G/A | 0.658 | 0.0042 | 0.0010 | 1.35E-05 | 0.208 | 15943 | – | – | RP11-73O6.4 | |
| rs9491696 | 127494332 | G/C | 0.379 | 0.0036 | 0.0009 | 8.91E-05 | 0.225 | 15944 | 0.365 | 0.072 | RSPO3 (intronic) | |||
Abbreviations: Chr = chromosome; BP = base pair; EA = effect allele; OA = other allele; EAF = effect allele frequency; SE = standard error; EA = European ancestry; AA = African ancestry
Locus name based on nearby gene reported by Heid et al. (2010)
Previously reported index SNP was taken from Heid et al (2010), within 14 known WHR regions on the metabochip.
SNP with the lowest p-value of all SNPs tested within a particular loci among African descendants in the PAGE study
BP position based on build 36
P-value of the heterogeneity test across all studies contributing to the meta-analysis
The r-square value between the lead SNP and index SNP using European ancestry linkage disequilibrium structure
The r-square value between the lead SNP and index SNP using African ancestry linkage disequilibrium structure
The Nearest gene to SNP; based on RefSeq but if not available cased on GENCODE genes
monomorphic SNP (tested in 1000G CEU)
Table 2.
Approximate conditional analyses assessing independence of lead SNPs in the current analysis from the index SNPs
| Locus | Locus Namea | Conditioning Status | SNP of interestb | Conditioning SNPc | EAF | Beta | SE | P-value | N | Result for independenced |
|---|---|---|---|---|---|---|---|---|---|---|
|
Female-only analysis: lead SNP conditioned upon by index SNP
| ||||||||||
| 1p12 | TBX15-WARS2 | Pre-conditioning | rs6701378 | 0.462 | 0.0054 | 0.0013 | 3.07E-05 | |||
| Post-conditioning | rs984222 | 0.470 | 0.0046 | 0.0012 | 1.02E-04 | 10355.9 | Not Independent | |||
| 3p14.1 | ADAMTS9 | Pre-conditioning | rs2059092 | 0.687 | 0.0072 | 0.0014 | 9.98E-08 | |||
| Post-conditioning | rs6795735 | 0.674 | 0.0064 | 0.0013 | 1.23E-06 | 10319.4 | Independent | |||
|
Male-only analysis: lead SNP conditioned upon by index SNP | ||||||||||
| 1p12 | TBX15-WARS2 | Pre-conditioning | rs7412918 | 0.626 | 0.0054 | 0.0013 | 2.47E-05 | |||
| Post-conditioning | rs984222 | 0.716 | 0.0042 | 0.0012 | 5.80E-04 | 3788.3 | Not Independent | |||
|
Sex-combined analysis: lead SNP conditioned upon by index SNP | ||||||||||
| 1p12 | TBX15-WARS2 | Pre-conditioning | rs12096179 | 0.451 | 0.0044 | 0.0009 | 2.24E-06 | |||
| Post-conditioning | rs984222 | 0.470 | 0.0032 | 0.0008 | 5.02E-05 | 16432.5 | Independent | |||
| 3p14.1 | ADAMTS9 | Pre-conditioning | rs2059092 | 0.686 | 0.0044 | 0.0010 | 5.90E-06 | |||
| Post-conditioning | rs6795735 | 0.674 | 0.0038 | 0.0009 | 6.37E-05 | 15308.0 | Independent | |||
| 6q22.33 | RSPO3 | Pre-conditioning | rs9321069 | 0.658 | 0.0042 | 0.0010 | 1.35E-05 | |||
| Post-conditioning | rs9491696 | 0.651 | 0.0028 | 0.0009 | 2.98E-03 | 14638.4 | Not Independent | |||
Abbreviations: EAF = effect allele frequency; SE = standard error; N = estimated effective sample size
Locus name based on nearby gene reported by Heid et al. (2010)
Lead SNPs of interest to be conditioned upon by the index SNP to establish independence.
Conditioning SNPs are the index SNPs (SNPs identified among European descendants from Heid et al. (2010))
Lead SNP signal is not fully depedendent on index signal if post-conditioning P-value retains significance (<9.97×10⁻⁵).
In the male-specific analysis (Supplementary Information and Supplementary Table S5), nine of the 17 index SNPs showed directional consistency in effect estimates (binominal distribution P-value = 0.183), and two index SNPs showed nominal significance (P-value<0.05). Only one of the 17 loci contained a lead SNP reaching significance (rs7412918 in TBX15-WARS2, P-value = 2.47×10⁻⁵) (Table 1). The lead SNP from the TBX15-WARS2 locus was in low LD with the index SNP (r2=0.24) and therefore was followed up with a conditional analysis. The lead SNP in TBX15-WARS2 for the male-only analysis was in a different gene than that of the index SNP (WARS2 instead of TBX15), yet strength of the association between the lead SNP and WHRa was attenuated after conditioning on the index SNP (P-value=2.47×10⁻⁵ before conditioning, P-value=5.80×10⁻⁴ after conditioning), suggesting they are identifying the same signal and makes the determination of which gene contains the true signal difficult (Table 2).
Sex-combined Fine Mapping of Metabochip Regions for WHR
In the sex-combined analysis, 12 out of the 17 index SNPs displayed effect estimates directionally consistent with estimates from Heid et al.11 (binomial distribution P-value = 0.02) (Supplementary Information, Supplementary Table S6).
For two loci, the index SNPs (rs10195252 near GRB14 and rs9491696 in RSPO3) displayed statistical evidence for generalization (directional consistency and P-value<9.97×10⁻⁵), while three other index SNPs (in or near TBX15-WARS2, LYPLAL1, and LY86) showed nominal statistical significance (p<0.05). For the RSPO3 locus there was another lead SNP, rs9321069, that was slightly more significant than the index SNP and had an r2<0.4 in CEU, thus we conditioned it on the index SNP. However, after conditioning on the index SNP, rs9491069 was no longer significant. Three loci (rs12096179 near TBX15-WARS2, rs2059092 in ADAMTS9, and rs9491069 in RSPO3) harbored a lead SNP that was in LD (r2<0.4) with the previously identified index SNP in European descent populations, thus we considered these possible index-independent SNPs. For the rs12096179 SNP in TBX15-WARS2 and rs2059092 in ADAMTS9, conditioning on the respective index SNP in these loci did not diminish their significance (Table 2), indicating these are independent signals.
Comparison with other published lead SNPs
We compared this study’s lead SNPs to previously reported WHRa SNPs in four loci (for full comparison results see Supplementary Information, Supplementary Table S7, and Supplementary Figures S8a–d, 9–12). The TBX15-WARS2 locus on chromosome 1 (position on Build36: 119.25 to 119.58 Mb), spans across the genes TBX15, WARS2, and RP11-418J17.1, a long non-coding RNA. To date, two SNPs in the TBX15-WARS2 locus have been associated with WHRa in the literature (the index SNP, rs984222,11 and the African ancestry discovery SNP, rs1092371428), to which we detected three additional SNPs; one each from the sex-combined (rs12096179), female (rs6701378), and male (rs7412918) analyses. Among these five SNPs, we identified one potentially independent signal: the sex-combined SNP (rs12096179) association with WHRa remains strong after conditioning on the index SNP from the literature (rs984222) (Table 2 and Supplementary Information, Supplementary Table S8). Importantly, fine mapping at this locus, using the YRI LD structure, reduces the number of putative SNPs from 37 to 24 SNPs and covers a 20kb region, reducing the regional space harboring the functional variant by 8% (Table 3).
Table 3.
Signals identified in each of the four significant loci and estimates of narrowing.
| Locus | Locus Name | CEU # SNPs a | YRI # SNPs a | % reduction # SNPs | CEU start to end BP pos b | CEU total distance | YRI start to end BP pos b | YRI total distance | % reduction distance |
|---|---|---|---|---|---|---|---|---|---|
| 1p12 | TBX15-WARS2 | 37 | 24 | 35% | 119305884–119526923 | 221039 | 119305884–119510190 | 204306 | 7.6% |
| 2q24.3 | GRB14 | 20 | 16 | 20% | 165212811–165265564 | 52753 | 165210095–165252696 | 42601 | 19.2% |
| 3p14.1 | ADAMTS9 | 45 | 7 | 84% | 64672956–64702880 | 29924 | 64683154–64699593 | 16439 | 45.1% |
| 6q22.33 | RSPO3 | 95 | 68 | 28% | 127422175–127564266 | 142091 | 127432378–127562820 | 130442 | 8.2% |
Abbreviations: CEU = 1000 Genomes CEU population; YRI = 1000 Genomes YRI population
Number of SNPs in the locus identified in the current analysis or previous publications, in addition to all SNPs with an r2 > 0.8 with the identified SNPs
BP position based on build 36
The GRB14 locus on chromosome 2 (position on Build36 165.21 to 165.28Mb), stretches across the genes GRB14, COBLL1, SNORA70F and TCONS_00004484 (a long non-coding RNA). In the GRB14 locus, the two SNPs from our analyses and all five published SNPs are in high LD with one another (r2 > 0.7) and point to a single signal. Using the CEU LD structure, 16 SNPs have a LD r2 of 0.8 or greater with any of the four significant SNPs and span across approximately 53kb. In contrast, using the YRI LD structure, 12 SNPs have a LD r2 of 0.8 or greater with any of the four significant SNPs and span across approximately 43kb, narrowing the region by 19% (Table 3).
The ADAMTS9 locus in chromosome 3 (position on Build36: 64.67Mb to 64.71Mb), spans across the ADAMTS9-AS2, an anti-sense noncoding RNA, and microRNA, MIR548A2. The index SNP, rs6795735, identified in CEU by Heid et al14 is conditionally independent of the sex-combined and female lead SNP identified in this study (Table 2). Overall, 45 SNPs are in high CEU LD (r2 > 0.8) with these lead SNPs as compared to only seven SNPs that are in high YRI LD. Using the physical genomic region to assess the narrowing of a signal region, the 45 SNPs span over ~30kb whereas the seven SNPs span over ~16kb, thus the region is narrowed by 45.1% (Table 3).
The RSPO3 locus on chromosome 6 (position on Build36: 127.42 to 127.57 Mb) includes the AK127272 and the RSPO3 genes. In reviewing previous studies, we found five SNPs in the RSPO3 locus that have been associated with WHRa. We contribute an additional WHRa SNP (rs9321069 from the sex-combined analysis) to the list. All six SNPs are conditionally dependent on one another and therefore appear to be tagging the same signal (Supplementary Information, Supplementary Table S8). Treating these six SNPs as a single signal and comparing the CEU LD to the YRI LD structure, we narrowed the pool of potentially functional SNPs from 95 SNPs down to 68 SNPs, though only reduced the purported functional variant region by 8% (Table 3).
Genotype-tissue expression associations
We assessed the association of our lead SNPs and other reported SNPs detected in the four WHRa regions with expression of genes lying within +/-500kb of the lead SNP (for full description of results see Supplementary Information and Supplementary Table S9). For the TBX15-WARS2 region, we identified significance within the WARS2 gene in skeletal muscle for two SNPs, rs7412918 identified in the current study, and the previously identified rs984222. For the locus in and near GRB14-COBLL1 genes, we identified significance within the SLC38A11 gene in skeletal muscle for three SNPs, rs6717858 rs13389219, and rs1128249. The latter eQTL, rs1128249-SLC38A11, was also significant in adipose tissue as well (P-value =0.001). For the loci in and near ADAMTS9 and RSPO3, no eQTLs were significant.
DISCUSSION
Interrogation of 17 previously reported European descent loci
We interrogated 17 previously identified genomic regions associated with WHRa in a large sample of African ancestry participants. Among the 17 WHRa loci, we found at least one significant lead SNP in either the sex-combined, female, or male only analyses. Notably, the lead SNP (rs10195252) in the GRB14 locus for the sex-combined analysis was the same as the Heid et al. index SNP identified in European descent populations. Similarly in RSPO3, the lead SNP in the female-only analysis (rs9491696) was also the same as the Heid et al. index SNP. The lack of significant SNPs in the other 13 loci may be due to low power to detect genetic effects and the small relative sample sizes rather than true lack of generalization. Power calculations using our sample size (N ~16 000) compared to the Heid et al. sample size (N ~ 100 000) show diminished ability to detect variants (Supplementary Information).
An advantage of using the custom Metabochip, unlike previous array-wide investigations of WHRa, is the inclusion of 1000G SNPs on the Metabochip and therefore their direct characterization. We were able to densely genotype both rare and common SNPs in specific regions of the genome that contained variants highly associated with WHR. While we did not identify any novel independent signals, we were able to narrow the purported region containing the functional variant due to the dense mapping and comparison of the CEU LD to the YRI LD.
Another advantage of using the Metabochip is that some of the LD regions extended beyond the traditional 250 kb flanking region of the Heid et al. index SNP. Because African descent populations have lower LD, previous investigations have traditionally explored only the 250 kb flanking regions of identified variants, whereas in European descent populations, investigators have explored a larger 500 kb flanking region. However, in our investigation, we found significant SNPs in African ancestry populations can span over a wide interval of the genome (e.g. SNPs identified in the TBX15-WARS2 locus spanned across the 330kb locus region). Future studies may consider looking beyond 250 kb, even in ancestral populations with lower LD.
Sex heterogeneity
The lead SNPs in GRB14 and ADAMTS9 were stronger in the female only analysis compared to the lead SNP in the sex-combined analysis. Additionally, the effect estimates for the lead SNPs identified in the female-only analysis were larger than the effect estimates of the lead SNPs identified in the sex-combined analysis. This finding is similar to observations made by Heid et al.11 Direct comparison of the female-specific and male-specific results are difficult due to the large disparity in sample size, but the results are similar to previous studies which have found that the signals from the male-only analysis have lower effect sizes and are less significant in comparison to the female-only analysis. The reasoning for strong sex-heterogeneity observations is still unclear, though sex differential regulation factors, transcripts, metabolites, and microbes have been observed.41–43 Variant interaction with these factors may lead to larger impacts on WHRa in one sex group over the other.
Biologic function of identified genomic regions
In addition to using differences in ancestral LD patterns to narrow a genomic region, we assessed whether any genes or variants within the genomic region have any biological plausibility in affecting WHR. While several SNP variants may affect functionality, unfortunately, based on the available bioinformatics data, no definitive functional SNPs were identified (for full function description see Supplementary Information and Supplementary Table S10). A possible limitation is the current lack of experiments on specific tissue samples that would be relevant to WHR. While data from over 1600 experiments have been added to the ENCODE project, only a few experiments have been run on normal karyotype tissue samples of adipose, liver, and pancreas tissues. Since chromatin shape and regulation is known to be tissue specific, understanding whether a genetic variant affects function is limited to the cell lines that have been given first priority in the ENCODE project.
CONCLUSION
Fine-mapping of previously identified WHR loci produced variable results among African ancestry populations: some loci produced lead SNPs identical to the index SNPs from European ancestries, some loci where the identified SNPs were conditionally dependent on the index SNPs, and a couple of loci had lead SNPs independent of the index signal. Out of the 17 loci, four loci generalized to the African ancestry population in our study, suggesting that at least some of the biologic pathways that affect WHR are shared across race and ethnic groups. More importantly, this study demonstrates the utility of fine-mapping regions which may contain functional variants. Further analyses in various multi-racial and ethnic groups are likely to provide a more complete picture of how the associated loci contribute to waist-related traits. Importantly, a clearer understanding of the genetic underpinnings of central adiposity may help elucidate molecular pathways that affect obesity, which in turn may help improve interventions and drug development.
Supplementary Material
Acknowledgments
The PAGE consortium thanks the staff and participants of PAGE studies for their important contributions. The PAGE program is funded by the NHGRI, supported by U01HG004803 (CALiCo), U01HG004802 (MEC), U01HG004790 (WHI), and U01HG004801 (Coordinating Center), and their respective NHGRI ARRA supplements. The National Institutes of Mental Health also contributes to the support for the Coordinating Center. The contents of this paper are solely the responsibility of the authors and do not necessarily represent NIH official views. See Detailed Acknowledgment for full PAGE and collaborating study acknowledgements (Supplementary Information).
Footnotes
DATA ACCESS
Data for this research are available through dbGAP: accession numbers phs000236 (CARDIA); phs000301 (CHS); phs000220 (MEC); and phs000227 (WHI). Other data are available from the corresponding author upon reasonable request.
CONFLICT OF INTEREST
Authors declare no conflict of interest
Supplementary information, figures, and tables are available at International Journal of Obesity’s website
References
- 1.de Koning L, Merchant AT, Pogue J, Anand SS. Waist circumference and waist-to-hip ratio as predictors of cardiovascular events: meta-regression analysis of prospective studies. European heart journal. 2007;28(7):850–6. doi: 10.1093/eurheartj/ehm026. [DOI] [PubMed] [Google Scholar]
- 2.Dobbelsteyn CJ, Joffres MR, MacLean DR, Flowerdew G. A comparative evaluation of waist circumference, waist-to-hip ratio and body mass index as indicators of cardiovascular risk factors. The Canadian Heart Health Surveys. Int J Obes Relat Metab Disord. 2001;25(5):652–61. doi: 10.1038/sj.ijo.0801582. [DOI] [PubMed] [Google Scholar]
- 3.Heitmann BL, Frederiksen P, Lissner L. Hip circumference and cardiovascular morbidity and mortality in men and women. Obes Res. 2004;12(3):482–7. doi: 10.1038/oby.2004.54. [DOI] [PubMed] [Google Scholar]
- 4.Staiano AE, Reeder BA, Elliott S, Joffres MR, Pahwa P, Kirkland SA, et al. Body mass index versus waist circumference as predictors of mortality in Canadian adults. Int J Obes (Lond) 2012;36(11):1450–4. doi: 10.1038/ijo.2011.268. [DOI] [PMC free article] [PubMed] [Google Scholar]
- 5.Visscher TL, Heitmann BL, Rissanen A, Lahti-Koski M, Lissner L. A break in the obesity epidemic? Explained by biases or misinterpretation of the data? Int J Obes (Lond) 2015;39(2):189–98. doi: 10.1038/ijo.2014.98. [DOI] [PubMed] [Google Scholar]
- 6.Ford ES, Maynard LM, Li C. Trends in mean waist circumference and abdominal obesity among US adults, 1999–2012. JAMA. 2014;312(11):1151–3. doi: 10.1001/jama.2014.8362. [DOI] [PMC free article] [PubMed] [Google Scholar]
- 7.Geiss LS, Wang J, Cheng YJ, Thompson TJ, Barker L, Li Y, et al. Prevalence and incidence trends for diagnosed diabetes among adults aged 20 to 79 years, United States, 1980–2012. JAMA. 2014;312(12):1218–26. doi: 10.1001/jama.2014.11494. [DOI] [PubMed] [Google Scholar]
- 8.Ogden CL, Carroll MD, Kit BK, Flegal KM. Prevalence of childhood and adult obesity in the United States, 2011–2012. JAMA. 2014;311(8):806–14. doi: 10.1001/jama.2014.732. [DOI] [PMC free article] [PubMed] [Google Scholar]
- 9.Ogden Cl, Carroll MD, Fryar CD, Flegal KM. NCHS data brief. 219. Hyattsville, MD: National Center for Health Statistics; 2015. Prevalence of obesity among adults and youth: United States, 2011–2014. [PubMed] [Google Scholar]
- 10.Wall JD, Pritchard JK. Haplotype blocks and linkage disequilibrium in the human genome. Nat Rev Genet. 2003;4(8):587–97. doi: 10.1038/nrg1123. [DOI] [PubMed] [Google Scholar]
- 11.Heid IM, Jackson AU, Randall JC, Winkler TW, Qi L, Steinthorsdottir V, et al. Meta-analysis identifies 13 new loci associated with waist-hip ratio and reveals sexual dimorphism in the genetic basis of fat distribution. Nature Genetics. 2010;42(11):949–60. doi: 10.1038/ng.685. [DOI] [PMC free article] [PubMed] [Google Scholar]
- 12.Matise TC, Ambite JL, Buyske S, Carlson CS, Cole SA, Crawford DC, et al. The Next PAGE in understanding complex traits: design for the analysis of Population Architecture Using Genetics and Epidemiology (PAGE) Study. American journal of epidemiology. 2011;174(7):849–59. doi: 10.1093/aje/kwr160. [DOI] [PMC free article] [PubMed] [Google Scholar]
- 13.Lim U, Wilkens LR, Albright CL, Novotny R, Le Marchand L, Kolonel LN. University of Hawai’i Cancer Center Connection: bias in self-reported anthropometry in relation to adiposity and adulthood weight gain among postmenopausal Caucasian and Japanese American Women. Hawaii J Med Public Health. 2013;72(12):445–9. [PMC free article] [PubMed] [Google Scholar]
- 14.Dekkers JC, van Wier MF, Hendriksen IJ, Twisk JW, van Mechelen W. Accuracy of self-reported body weight, height and waist circumference in a Dutch overweight working population. BMC Med Res Methodol. 2008;8:69. doi: 10.1186/1471-2288-8-69. [DOI] [PMC free article] [PubMed] [Google Scholar]
- 15.Freudenheim JL, Darrow SL. Accuracy of self-measurement of body fat distribution by waist, hip, and thigh circumferences. Nutrition and cancer. 1991;15(3–4):179–86. doi: 10.1080/01635589109514125. [DOI] [PubMed] [Google Scholar]
- 16.Spencer EA, Roddam AW, Key TJ. Accuracy of self-reported waist and hip measurements in 4492 EPIC-Oxford participants. Public Health Nutr. 2004;7(6):723–7. doi: 10.1079/phn2004600. [DOI] [PubMed] [Google Scholar]
- 17.Bes-Rastrollo M, Sabate J, Jaceldo-Siegl K, Fraser GE. Validation of self-reported anthropometrics in the Adventist Health Study 2. BMC public health. 2011;11:213. doi: 10.1186/1471-2458-11-213. [DOI] [PMC free article] [PubMed] [Google Scholar]
- 18.Powell-Young YM. The validity of self-report weight and height as a surrogate method for direct measurement. Appl Nurs Res. 2012;25(1):25–30. doi: 10.1016/j.apnr.2010.06.001. [DOI] [PMC free article] [PubMed] [Google Scholar]
- 19.Voight BF, Kang HM, Ding J, Palmer CD, Sidore C, Chines PS, et al. The metabochip, a custom genotyping array for genetic studies of metabolic, cardiovascular, and anthropometric traits. PLoS genetics. 2012;8(8):e1002793. doi: 10.1371/journal.pgen.1002793. [DOI] [PMC free article] [PubMed] [Google Scholar]
- 20.Shungin D, Winkler TW, Croteau-Chonka DC, Ferreira T, Locke AE, Magi R, et al. New genetic loci link adipose and insulin biology to body fat distribution. Nature. 2015;518(7538):187–96. doi: 10.1038/nature14132. [DOI] [PMC free article] [PubMed] [Google Scholar]
- 21.Buyske S, Wu Y, Carty CL, Cheng I, Assimes TL, Dumitrescu L, et al. Evaluation of the metabochip genotyping array in African Americans and implications for fine mapping of GWAS-identified loci: the PAGE study. PloS one. 2012;7(4) doi: 10.1371/journal.pone.0035651. [DOI] [PMC free article] [PubMed] [Google Scholar]
- 22.Purcell S, Neale B, Todd-Brown K, Thomas L, Ferreira MAR, Bender D, et al. PLINK: a tool set for whole-genome association and population-based linkage analyses. American journal of human genetics. 2007;81(3):559–75. doi: 10.1086/519795. [DOI] [PMC free article] [PubMed] [Google Scholar]
- 23.Weale ME. Quality control for genome-wide association studies. Methods in molecular biology. 2010;628:341–72. doi: 10.1007/978-1-60327-367-1_19. [DOI] [PubMed] [Google Scholar]
- 24.Manichaikul A, Naj AC, Herrington D, Post W, Rich SS, Rodriguez A. Association of SCARB1 variants with subclinical atherosclerosis and incident cardiovascular disease: The Multi-Ethnic Study of Atherosclerosis. Arterioscler Thromb Vasc Biol. 2012;32:1991–1999. doi: 10.1161/ATVBAHA.112.249714. [DOI] [PMC free article] [PubMed] [Google Scholar]
- 25.Patterson N, Price AL, Reich D. Population structure and eigenanalysis. PLoS genetics. 2006;2(12):e190. doi: 10.1371/journal.pgen.0020190. [DOI] [PMC free article] [PubMed] [Google Scholar]
- 26.Price AL, Patterson NJ, Plenge RM, Weinblatt ME, Shadick NA, Reich D. Principal components analysis corrects for stratification in genome-wide association studies. Nature genetics. 2006;38(8):904–9. doi: 10.1038/ng1847. [DOI] [PubMed] [Google Scholar]
- 27.Liu CT, Buchkovich ML, Winkler TW, Heid IM, African Ancestry Anthropometry Genetics C, Consortium G et al. Multi-ethnic fine-mapping of 14 central adiposity loci. Hum Mol Genet. 2014;23(17):4738–44. doi: 10.1093/hmg/ddu183. [DOI] [PMC free article] [PubMed] [Google Scholar]
- 28.Liu CT, Monda KL, Taylor KC, Lange L, Demerath EW, Palmas W, et al. Genome-wide association of body fat distribution in African ancestry populations suggests new loci. PLoS Genet. 2013;9(8):e1003681. doi: 10.1371/journal.pgen.1003681. [DOI] [PMC free article] [PubMed] [Google Scholar]
- 29.Berndt SI, Gustafsson S, Mägi R, Ganna A, Wheeler E, Feitosa MF, et al. Genome-wide meta-analysis identifies 11 new loci for anthropometric traits and provides insights into genetic architecture. Nature genetics. 2013;45(5):501–12. doi: 10.1038/ng.2606. [DOI] [PMC free article] [PubMed] [Google Scholar]
- 30.Randall JC, Winkler TW, Kutalik Z, Berndt SI, Jackson AU, Monda KL, et al. Sex-stratified Genome-wide Association Studies Including 270,000 Individuals Show Sexual Dimorphism in Genetic Loci for Anthropometric Traits. PLoS Genet. 2013;9(6) doi: 10.1371/journal.pgen.1003500. [DOI] [PMC free article] [PubMed] [Google Scholar]
- 31.Chen MH, Yang Q. GWAF: an R package for genome-wide association analyses with family data. Bioinformatics. 2010;26(4):580–1. doi: 10.1093/bioinformatics/btp710. [DOI] [PMC free article] [PubMed] [Google Scholar]
- 32.Willer CJ, Li Y, Abecasis GR. METAL: fast and efficient meta-analysis of genomewide association scans. Bioinformatics. 2010;26(17):2190–1. doi: 10.1093/bioinformatics/btq340. [DOI] [PMC free article] [PubMed] [Google Scholar]
- 33.Campbell MC, Tishkoff SA. African genetic diversity: implications for human demographic history, modern human origins, and complex disease mapping. Annu Rev Genomics Hum Genet. 2008;9:403–33. doi: 10.1146/annurev.genom.9.081307.164258. [DOI] [PMC free article] [PubMed] [Google Scholar]
- 34.The International HapMap Project. Nature. 2003;426(6968):789–96. doi: 10.1038/nature02168. [DOI] [PubMed] [Google Scholar]
- 35.Yang J, Ferreira T, Morris AP, Medland SE, Genetic Investigation of ATC, Replication DIG, et al. Conditional and joint multiple-SNP analysis of GWAS summary statistics identifies additional variants influencing complex traits. Nat Genet. 2012;44(4):369–75. S1–3. doi: 10.1038/ng.2213. [DOI] [PMC free article] [PubMed] [Google Scholar]
- 36.Berglund G, Elmstahl S, Janzon L, Larsson SA. The Malmo Diet and Cancer Study. Design and feasibility. Journal of internal medicine. 1993;233(1):45–51. doi: 10.1111/j.1365-2796.1993.tb00647.x. [DOI] [PubMed] [Google Scholar]
- 37.Pruim RJ, Welch RP, Sanna S, Teslovich TM, Chines PS, Gliedt TP, et al. LocusZoom: regional visualization of genome-wide association scan results. Bioinformatics. 2010;26(18):2336–7. doi: 10.1093/bioinformatics/btq419. [DOI] [PMC free article] [PubMed] [Google Scholar]
- 38.Berndt SI, Gustafsson S, Magi R, Ganna A, Wheeler E, Feitosa MF, et al. Genome-wide meta-analysis identifies 11 new loci for anthropometric traits and provides insights into genetic architecture. Nature genetics. 2013;45(5):501–12. doi: 10.1038/ng.2606. [DOI] [PMC free article] [PubMed] [Google Scholar]
- 39.Randall JC, Winkler TW, Kutalik Z, Berndt SI, Jackson AU, Monda KL, et al. Sex-stratified Genome-wide Association Studies Including 270,000 Individuals Show Sexual Dimorphism in Genetic Loci for Anthropometric Traits. PLoS genetics. 2013;9(6):e1003500. doi: 10.1371/journal.pgen.1003500. [DOI] [PMC free article] [PubMed] [Google Scholar]
- 40.The Genotype-Tissue Expression (GTEx) project. Nat Genet. 2013;45(6):580–5. doi: 10.1038/ng.2653. [DOI] [PMC free article] [PubMed] [Google Scholar]
- 41.Gilks WP, Abbott JK, Morrow EH. Sex differences in disease genetics: evidence, evolution, and detection. Trends in genetics: TIG. 2014;30(10):453–63. doi: 10.1016/j.tig.2014.08.006. [DOI] [PubMed] [Google Scholar]
- 42.Trabzuni D, Ramasamy A, Imran S, Walker R, Smith C, Weale ME, et al. Widespread sex differences in gene expression and splicing in the adult human brain. Nature communications. 2013;4:2771. doi: 10.1038/ncomms3771. [DOI] [PMC free article] [PubMed] [Google Scholar]
- 43.Patel MJ, Batch BC, Svetkey LP, Bain JR, Turer CB, Haynes C, et al. Race and sex differences in small-molecule metabolites and metabolic hormones in overweight and obese adults. Omics: a journal of integrative biology. 2013;17(12):627–35. doi: 10.1089/omi.2013.0031. [DOI] [PMC free article] [PubMed] [Google Scholar]
Associated Data
This section collects any data citations, data availability statements, or supplementary materials included in this article.