Abstract
Signalling by TGFβ superfamily factors plays an important role in tissue growth and cell proliferation. In Drosophila, the activity of the TGFβ/Activin signalling branch has been linked to the regulation of cell growth and proliferation, but the cellular and molecular basis for these functions are not fully understood. In this study, we show that both the RII receptor Punt (Put) and the R-Smad Smad2 are strongly required for cell and tissue growth. Knocking down the expression of Put or Smad2 in salivary glands causes alterations in nucleolar structure and functions. Cells with decreased TGFβ/Activin signalling accumulate intermediate pre-rRNA transcripts containing internal transcribed spacer 1 regions accompanied by the nucleolar retention of ribosomal proteins. Thus, our results show that TGFβ/Activin signalling is required for ribosomal biogenesis, a key aspect of cellular growth control. Importantly, overexpression of Put enhanced cell growth induced by Drosophila Myc, a well-characterized inducer of nucleolar hypertrophy and ribosome biogenesis.
Keywords: Drosophila, cell growth, Punt (Put), TGFβ/Activin, nucleolus, ribosome
1. Introduction
Tissue growth is a very complex process that requires interplay between multiple signalling pathways to ensure that an organ achieves its proper size and shape. Transforming growth factor beta (TGFβ) and bone morphogenetic protein (BMP) signalling pathways play multiple roles during animal development through the regulation of cellular growth, proliferation, differentiation and survival [1]. At the cell surface, the secreted polypeptides of the TGFβ superfamily (TGFβ, BMP, Activin and Nodal) bind tetrameric complexes of type I (RI) and type II (RII) serine/threonine kinase receptors. Ligand binding allows the active RII receptors to phosphorylate serines and threonines within the GS domain of RI receptors, which in turn phosphorylate and activate Smads. Receptor-activated (R) Smads then associate with the common-mediator (Co) Smad and the complex is shuttled to the nucleus where it regulates target gene expression [1]. TGFβ signalling can either suppress or promote cell growth and proliferation, a phenomenon described as the TGFβ paradox in the context of cancer progression [2,3]. TGFβ is also an important promoter of epithelial–mesenchymal transition (EMT), where its activity leads to increased protein synthesis and cell size through activation of the PI3K, Akt and mTOR complex 1 [4]. Furthermore, the activity of TGFβ receptor I kinase was shown to be required for glucose-induced hypertrophy in both fibroblasts and epithelial cells [5]. Similar to high glucose, adding TGFβ to these cells caused an increase in protein synthesis and cell size [5]. In a subsequent study, treatment with the anti-TGFβ1 neutralization antibody (1D11) was shown to protect mice from obesity and diabetes [6]. Thus, the control of cell growth by TGFβ in different cell types and contexts is expected to play important roles in diabetes and cancer pathology.
The TGFβ pathway is evolutionarily conserved in Drosophila, where both the BMP and TGFβ/Activin branches are crucial regulators of developmental processes [7]. Put is a common RII receptor for both signalling branches, and it heterodimerizes with branch-specific RI receptors to ensure pathway specificity. In the TGFβ/Activin branch, Put binds the RI receptor Baboon (Babo) that phosphorylates Smad2 (also known as Smox) in response to the Activin-β (Actβ), Dawdle (Daw) and Myoglianin (Myo) ligands [8–11]. The TGFβ/Activin pathway was shown to regulate axonal outgrowth and remodelling [12–14], as well as proliferation of neuroblasts and wing imaginal disc cells [8,9,15].
In a recent eye-targeted double-RNAi screen, we identified a genetic interaction between several Drosophila TGFβ signalling members (including Put, Baboon and Smad2) and the nucleolar regulator Viriato (Vito)/Nol12 [16]. Previously, we had shown that Vito acts downstream of dMyc to ensure a coordinated nucleolar response during dMyc-stimulated growth [17]. Thus, Vito could play a role in dMyc-mediated increase in the rate of ribosome biogenesis in the nucleolus, one of the main mechanisms by which dMyc drives growth [18]. Because the mechanisms enabling TGFβ signalling to induce cell growth and proliferation are poorly understood, we pursued the analysis of the novel link between TGFβ signalling and nucleolar-based events. Here, we study the cell-autonomous functions of TGFβ/Activin signalling in cell growth, using the salivary gland as a model tissue. During larval stages, the salivary gland is an endoreplicative tissue where overall growth correlates directly with cell growth, and that allows easy characterization of subcellular structures.
2. Results
2.1. TGFβ/Activin signalling is required for tissue growth and nucleolar dynamics
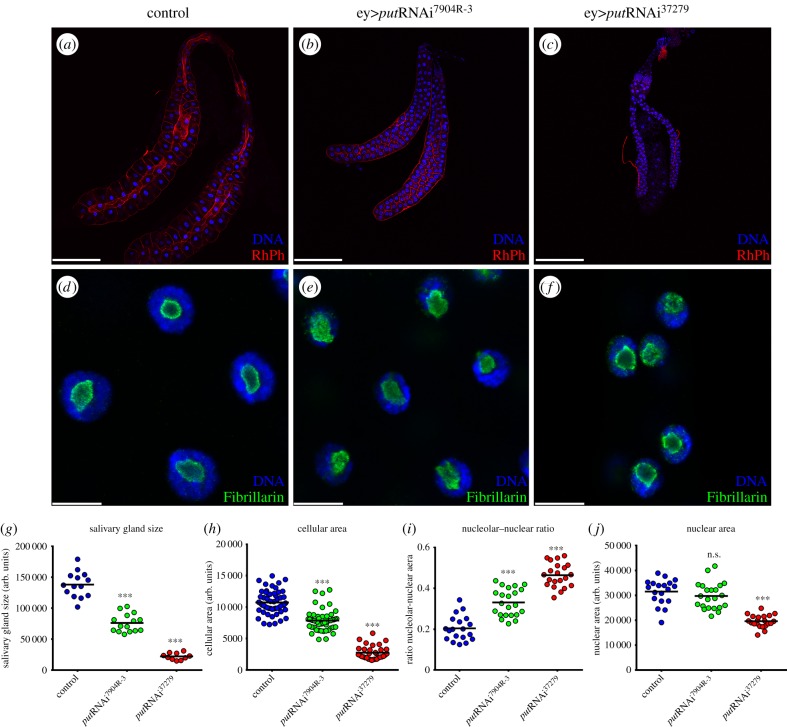
To study possible cell-autonomous functions of TGFβ signalling in salivary gland cell growth, we downregulated the expression of the RII receptor Put (figure 1). RNA interference (RNAi) was targeted to the post-mitotic salivary glands and eye imaginal discs using the ey-Gal4 driver [17]. The two putRNAi lines we used (VDRC37279 and NIG-FLY7904R-3) target non-overlapping regions of put and inhibited the progression of photoreceptor differentiation in the eye imaginal disc (electronic supplementary material, figure S1a–c). This phenotype mimics mutant put phenotypes [19], and confirms the specificity and efficiency of the RNAi knockdown. Importantly, knocking down put expression in the salivary glands caused a strong reduction in cellular area (figure 1a–c,h) with a strong effect on tissue growth (figure 1g). In particular, expression of the stronger putRNAi37279 caused a significant decrease in salivary gland area (84%, p < 1 × 10⁻⁴; figure 1c,g), and completely inhibited the onset of the photoreceptor differentiation (electronic supplementary material, figure S1c). Our recent work established a genetic interaction between put and vito, which encodes for a regulator of nucleolar organization and tissue growth [16]. Because uncoordinated nucleolar hypertrophy has been associated with defective cell growth [17,20], we evaluated whether Put controlled nucleolar dynamics. We stained salivary glands with anti-Fibrillarin, a nucleolar protein involved in pre-rRNA processing, or anti-AH6 to label nucleoli and DAPI for DNA (figure 1d–f, and not shown). Knocking down put caused an expansion of the nucleolar area, reflected in an increased ratio between nucleolar and nuclear areas. Expression of putRNAi7904R-3 resulted in a 62% increase in the nucleolar/nuclear area ratio (p < 1 × 10⁻⁴), whereas expression of putRNAi37279 caused an even stronger increase (127%, p < 1 × 10⁻⁴; figure 1i). Thus, for put depletion in salivary glands, we observe a direct correlation between increased nucleolar/nuclear ratio and diminished tissue growth (R2 = 0.99468). This suggests that put controls nucleolar dynamics during salivary gland cell growth. Importantly, the weaker putRNAi7904R−3 did not significantly affect nuclear size (figure 1j), suggesting that the reduced nuclear size caused by the stronger putRNAi37279 (figure 1j) is secondary or a consequence of the observed nucleolar alterations.
Figure 1.
TGFβ/Activin signalling is required for tissue growth and nucleolar dynamics. (a–c) Salivary glands show a substantial reduction in overall size upon put depletion. Low magnifications images of salivary glands from third-instar Drosophila larvae expressing (a) UAS-lacZ (control), (b) UAS-putRNAi7904R-3 and (c) UAS-putRNAi37279 under the control of the ey-Gal4 driver. Salivary glands of the indicated genotypes were stained for the cell limits with RhPh (red) and counterstained with DAPI (blue). (d–f) Put requirement for salivary glands growth is linked to an increase in nucleolar size. (d) Localization of the nucleolar marker Fibrillarin in control nuclei of salivary glands. (e) put RNAi7904R-3 results in ectopic accumulation of Fibrillarin. (f) Strong putRNAi37279 induction results in expansion of the Fibrillarin at the nucleolus. (g) Scatter plot representative of put requirement for salivary gland growth. (h) Salivary gland growth deficit is linked to a decrease in the cellular area. (i) put depletion causes an increase in nucleolar/nuclear area ratio in the salivary glands. (j) Scatter plot showing nuclear area quantification of the described genotypes (n = 25–40; ***p < 1 × 10⁻⁴). Scale bars: (a–c) 200 µm, (d–f) 20 µm.
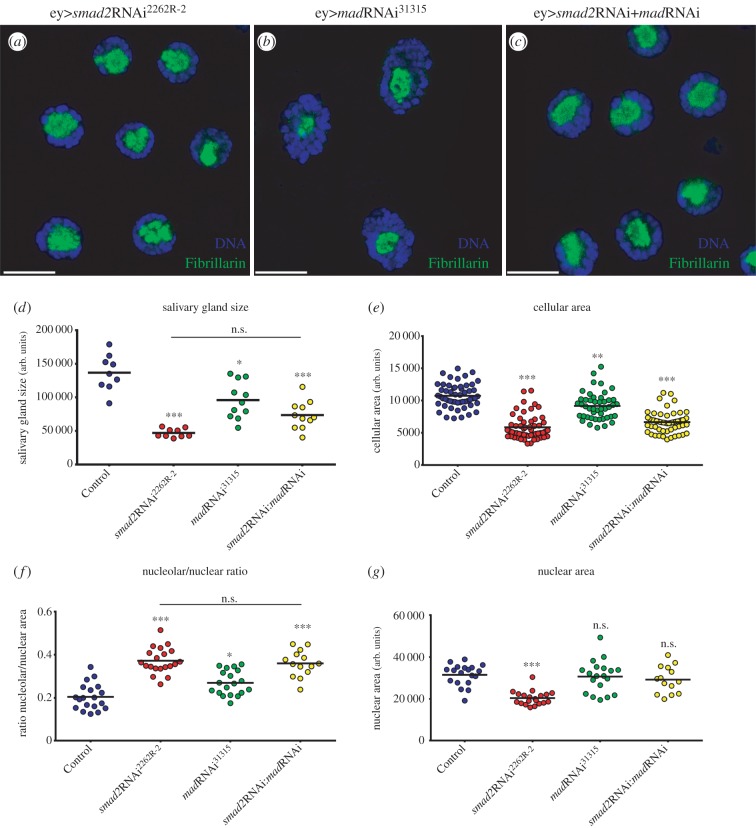
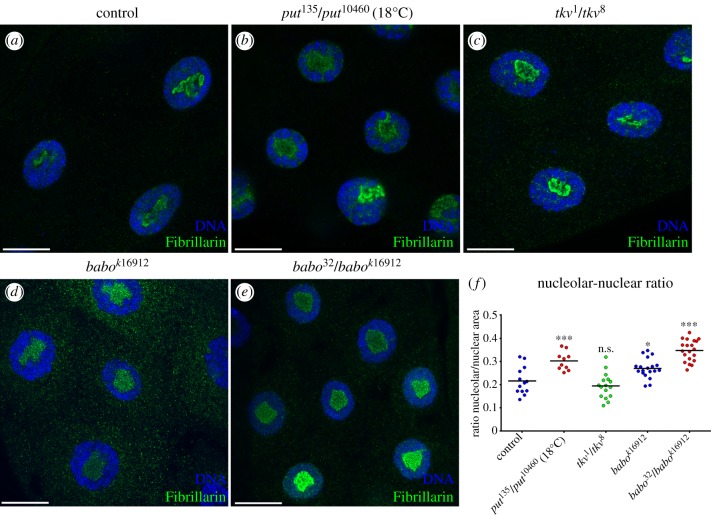
The RII receptor Put heterodimerizes with RI receptors Tkv or Babo to mediate BMP and TGFβ/Activin signalling, respectively. To study the contribution of each signalling branch to nucleolar regulation, we knocked down the expression of the TGFβ/Activin-branch-specific R-SMAD, Smad2 [8,21], and of the BMP-branch-specific R-SMAD Mad [22,23], either alone or in combination (figure 2). To validate the efficiency and specificity of the RNAi lines for Smad2 and Mad, we targeted their expression to the developing eye imaginal disc. In agreement with previous observations, downregulation of TGFβ/Activin signalling by smad2RNAi affected growth of the eye disc (electronic supplementary material, figure S1e) [8], whereas downregulation of BMP signalling by madRNAi strongly interfered with both tissue growth and patterning (electronic supplementary material, figure S1f) [24]. Importantly, expression of smad2RNAi caused a strong increase in the nucleolar/nuclear area ratio in salivary gland cells, which is not induced by madRNAi expression (figure 2f). Furthermore, co-expression of madRNAi failed to enhance the increase in nucleolar size, or the decrease in cellular and tissue size, induced by smad2RNAi (figure 2 and electronic supplementary material, figure S1g–j). In addition, salivary glands of larvae mutant for put or for babo, the Activin branch-specific RI receptor, also displayed a nucleolar phenotype, not observed in mutants for tkv, the BMP branch-specific RI receptor (figure 3a–f). Taken together, these results show that the TGFβ/Activin pathway is required for growth and normal nucleolar dynamics.
Figure 2.
Activin R-Smad smad2 is required for nucleolar dynamics. (a–c) TGFβ R-Smads contribution for nucleolar activity. Fibrillarin expansion caused by (a) Activin R-Smad smad2 depletion, (b) BMP R-Smad mad depletion and (c) co-depletion of both R-Smads presents a similar phenotype to smad2RNAi. In all panels, DNA was labelled with DAPI and represented in blue. Scale bars 20 µm. (d–g) Scatter plots showing the quantification of the different organ and cellular parameters after R-Smads depletion. smad2RNAi has a stronger effect on growth levels than madRNAi, both in overall tissue size (d) and cellular area (e). Reduction of the Activin pathway activity increases the relative nucleolar area (f) with a mild impact on the nuclear size (g). (n = 25–40; n.s. means no statistical difference between samples; *p < 0.05; **p < 0.01 and ***p < 1 × 10⁻⁴).
Figure 3.
TGFβ/Activin mutants display nucleolar phenotypes. (a–e) Reduced Activin activity induces nucleolar expansion. (a) Control nuclear and nucleolar staining (w1118). (b) put mutant combination (put135/put10460) grew at a permissive temperature (18°C) and present an expansion of the nucleolar area. (c) Dpp receptor tkv mutations (tkv1/tkv8) do not change the nucleolar/nuclear ratio. (d) A weak allele for the Activin receptor type I baboon (babok16912) shows a small expansion of the nucleolar area. (e) The heteroallelic combination of baboon (babok16912/babo32) shows a nucleolar expansion equivalent to put mutant combinations. All the nuclei were stained with DAPI (blue) and the nucleoli with Fibrillarin (green). (f) Scatter plot represents the nucleolar accumulation of the Fibrillarin in salivary glands of the indicated genotypes (*p < 0.05; ***p < 0.001). Scale bars: 20 μm.
2.2. TGFβ/Activin is required for the coordination of the ribosome biogenesis
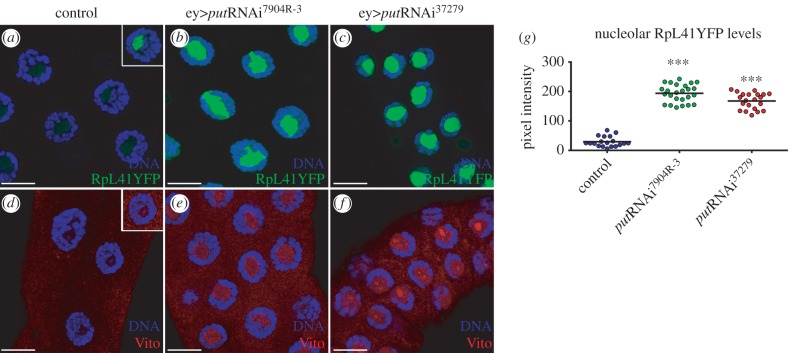
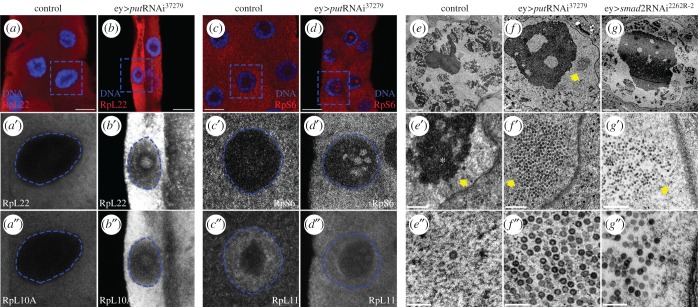
The increased size ratio of the nucleolus apparently contradicts the reduction in tissue growth observed when the TGFβ/Activin pathway is attenuated. One possibility is that the increase in size is reflecting a defective, rather than a gain of nucleolar function (e.g. a defective production of ribosomes). The nucleolus plays a major role in cell growth through the coordination of three steps in ribosome biogenesis: transcription of pre-rRNA by polymerase I, processing of pre-rRNA, and assembly of the large (60S) and small (40S) ribosome subunits [25]. Defects in the biogenesis of the large or small subunits (e.g. pre-rRNA processing deficits) lead to nucleolar stress accompanied by alterations in the localization of ribosomal proteins and other nucleolar factors [25]. To study if TGFβ/Activin signalling regulates ribosome biogenesis in the salivary gland, we analysed the localization pattern of the ribosomal protein RpL41 [26]. In the nuclei of control cells, RpL41 was mainly nucleolar restricted (figure 4a), as previously observed [27]. Inhibition of TGFβ/Activin signalling activity by putRNAi caused a strong nucleolar accumulation of RpL41 (figure 4a–c,g). Similarly, we also observed an increase in the nucleolar localization of Vito (figure 4d–f). Nucleolar enrichment of Vito was not homogeneous, as we detected intranucleolar regions with higher Vito levels (figure 4d–f). These results prompted us to further evaluate the role of TGFβ/Activin signalling in nucleolar structure and ribosome biogenesis. In control cells, immunostaining with αRpL22, αRpL10A and αRpS6 antibodies showed that these ribosomal proteins are mainly cytoplasmic, possibly reflecting a transient association with pre-ribosome subunits at the nucleolus (figure 5a–a″,c–c″). Interestingly, in putRNAi both RpL22 and Rpl10A are concentrated in the peripheral nucleoplasm and in the nucleolus (figure 5b–b″), whereas RpS6 accumulates in granular intranucleolar spots (figure 5d-d′). In comparison with control cells, RpL11 is also found at higher levels in these nucleolar granular spots, where it co-localizes with RpS6 (figure 5d″). This pattern of nucleolar accumulation was not a general attribute of all ribosomal proteins. RpS9 is mainly cytoplasmic in control cells and its levels decrease in putRNAi without any evidence of nucleolar re-localization (electronic supplementary material, figure S2).
Figure 4.
Inhibition of TGFβ/Activin signalling activity by putRNAi causes a strong nucleolar accumulation of RpL41 and Vito. (a–c) Put regulates nucleolar size and accumulation of nucleolar components. (a) Localization of the large ribosome subunit RpL41YFP in control nuclei salivary glands. Inset shows nuclei with higher acquisition settings to determine the precise localization of RpL41YFP. (b) put RNAi7904R-3 depletion results in ectopic accumulation of RpL41YFP. (c) Strong putRNAi37279 induction results in a growth deficit with several fold accumulation of RpL41YFP. (d–f) Vito accumulates at the nucleolus in put loss-of-function genotypes. (d) Vito localizes at the nucleolus in control where it strongly accumulates in (e) ey > putRNAi7904R-3 and (f) ey > putRNAi37279. In all panels, DNA was labelled with DAPI and shown in blue. (g) Scatter plot represents the nucleolar accumulation of the RpL41YFP protein in salivary glands of the indicated genotypes (n = 25–40; ***p < 1 × 10⁻⁴). Scale bars 20 µm.
Figure 5.
The TGFβ/Activin pathway is required for the coordination of the ribosome biogenesis. (a–d) Analysis of ribosome proteins (RPs) nucleolar localization. (a–a″) RpL22 and RpL10A are not detectable at the nucleolus in control nuclei. (b–b″) Depletion of put results in the accumulation of RpL22 and RpL10A at the nucleoplasm and nucleolus. (c–c″) RpS6 is not present at the nucleoplasm in control salivary glands while RpL11 has peripheral nucleoplasm localization. (d–d″) Decrease of TGFβ/Activin signalling results in nucleolar enrichment of RpS6 and RpL11. Blue squares represent the magnified area presented in a′–d″. Blue dashed circles represent the nuclear area of the respective nuclei. (e–g) Transmission electron micrographs of nuclear regions of independent salivary gland cells and examples of higher magnifications of the nucleoli (e″–g″). (e–e″) Higher magnifications of the control nucleoplasm reveal the nucleolus as the higher electrodense structure. Arrow points to an example of a single nuclear particle and asterisk represents the electrodense structure of the chromatin. In the absence of put (f–f″), or Smad2 (g–g″), the hypertrophied nucleolus presents vacuolar-like regions and clusters with a large number of particles (arrows). Scale bars: (a–d) 20 µm, (e–g) 2 µm, (e′–g′) 200 nm, (e″–g″) 20 nm.
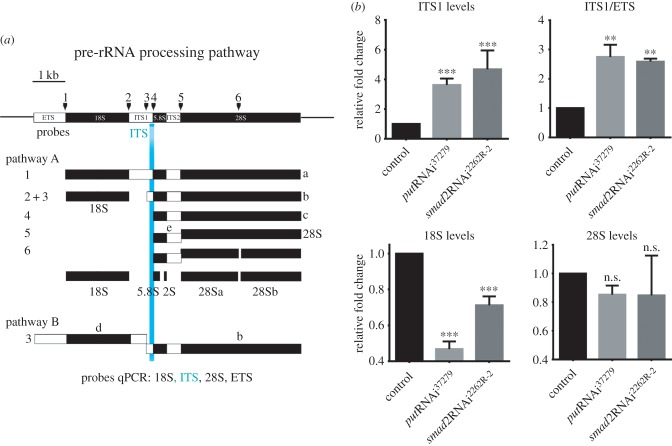
Ultrastructural TEM analysis of salivary gland cells where TGFβ/Activin signalling was inhibited by either putRNAi or smad2RNAi expression confirmed the presence of nucleolar hypertrophy in these genotypes (figure 5e–g). Further, low-contrast intranucleolar regions could be observed, although it is unclear if these regions correspond to the accumulation spots for Vito and RpS6 observed using confocal microscopy (figures 4f and 5d). Moreover, we detected an accumulation of densely packed particles in the nucleoplasm when compared with control cells (putRNAi n = 23 out of 23 cells from seven independent salivary glands, figure 5f–f″; smad2RNAi n = 10 out of 18 cells from six independent salivary glands, figure 5g–g″). Importantly, only individual particles were found occasionally in controls (figure 5e″) and are never found as clusters in our control samples (n = 0 out of 16 cells analysed from five independent salivary glands, figure 5e–e″). The size of these particles was on the scale expected for pre-ribosomal intermediates undergoing maturation in the path from the nucleolus to the cytoplasm [28]. These particles also resemble the particles found when nucleolar stress was induced in Drosophila midgut cells by knockdown of Nopp140 [29]. Thus, our results suggest that ribosome biogenesis had been stalled, in which case we would expect to detect alterations in pre-rRNA processing. The rRNA genes are organized in tandem in several arrays that are transcribed as single units (figure 6a) [30]. After being transcribed by RNA polymerase I, the pre-rRNA is subjected to cleavage, 5′ and 3′ exonucleolytic digestion, and base modifications to yield the mature 28S, 18S and 5.8S rRNAs (figure 6a) [30,31]. Interestingly, in both putRNAi and smad2RNAi cells, we detected a strong accumulation of uncleaved pre-rRNA intermediates containing the ITS1 region (figure 6b). To further distinguish whether this accumulation is derived from an increased transcription or an accumulation of the uncleaved pre-RNA intermediates, we quantified the relative abundance of pre-rRNA transcripts containing the external transcribed spacer (ETS) region. ETS-containing transcripts are short-lived, as the ETS is the first region to be processed with fast kinetics, and can be used as a proxy for the pre-rRNA transcription rate by the RNA polymerase I. Thus, when the levels of ITS1 were normalized to ETS levels, both TGFβ RNAis present about a threefold increase of ITS1-containing intermediate precursors. Furthermore, the levels of the small ribosome subunit 18S rRNA were also significantly reduced in these cells, whereas no significant differences were detected for the 28S rRNA (figure 6b). Together, these results point towards stalled ribosome biogenesis.
Figure 6.
The TGFβ/Activin pathway is required for pre-rRNA processing. (a) Diagram showing the several steps of the pre-rRNA processing. (b) The relative amounts of the ITS1 (target sequence labelled in light blue), ITS1/ETS ratio, 18S and 28S were measured by qPCR using RNA isolated from control larvae salivary glands or salivary glands from larvae expressing the putRNAi or smad2RNAi. Data are presented as fold change relative to control and indicate the mean + s.e.m (n = 5). Data were normalized to the levels of CaMKII mRNA (n.s. means no statistical difference between samples; ***p < 0.001).
2.3. Put overexpression exacerbates Myc-induced nucleolar hypertrophy and cell growth
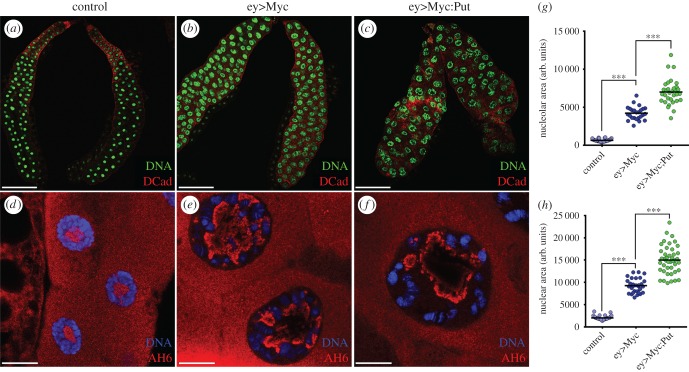
The ability of Myc to increase ribosome synthesis is an essential mechanism by which Myc promotes both cell growth and proliferation, as well as tumorigenesis [32]. In both mammalian and Drosophila cells, this mechanism requires coordination between nucleolar hypertrophy and the stimulation of pre-rRNA transcription and processing [17,18,33–36]. Overexpression of dMyc in salivary gland cells resulted in dramatic increases in nucleolar, nuclear and cellular sizes (figure 7a,b,d,e,g,h) [17,37]. dMyc expression also increases ploidy in these cells, an effect that has been proposed to be secondary to the strong stimulation of cell growth [18,38]. It has been shown that the transcription factor E2F1 acts as a ‘growth sensor’ coupling rates of endocycle progression to rates of cell growth [39]. Remarkably, we observed that overexpression of Put significantly enhanced the dMyc-stimulated nucleolar, nuclear and cellular growth (figure 7c,f,g,h). The overexpression of Put, on its own, was not sufficient to induce growth in the salivary glands (not shown). In support of these observations, in the eye imaginal disc and resulting adult retinas, the overexpression of Put was also able to synergize with Myc, increasing overall tissue size (electronic supplementary material, figure S3). These results suggest that TGFβ signalling cooperates with dMyc to control nucleolar function and mass accumulation.
Figure 7.
Put overexpression cooperates with dMyc to increase nucleolar hypertrophy and cell growth. (a–c) Drosophila salivary gland growth is substantially increased by Myc overexpression (ey>Myc) and is enhanced by TGFβ stimulation. (a) Lower magnification of the control salivary gland. (b) dMyc overexpression results in larger salivary glands with increased nuclear area. (c) Ectopic expression of Put potentiates dMyc-induced nuclear overgrowth. Salivary glands of the indicated genotypes were stained for the membrane marker DCad (red) and counterstained with DAPI (green). (d–f) Magnification of the nuclei of the indicated genotypes stained with a nucleolar marker AH6 (red) and counterstained with DAPI (blue). (d) Control nuclei showing the cytoplasmic and nucleolar localization of the nucleolar marker AH6. (e) Nuclear and nucleolar overgrowth induced by dMyc overexpression. (f) Nucleolar staining showing the synergistic effect between Put and Myc overexpression. (g) Quantification of nucleolar areas after overexpressing dMyc alone or together with Put. (h) Quantification of nuclear areas after overexpressing dMyc alone or together with Put. (n = 40–65), ***p < 1 × 10⁻⁴. Scale bars: (a–c) 200 µm, (d–f) 20 µm.
3. Discussion and conclusions
Taken together, our results show that members of the Activin branch of the TGFβ signalling pathway (the RII receptor Put and the R-Smad Smad2) are autonomously required for cell and tissue growth in the Drosophila larval salivary gland. In this simple tissue model, cell growth control can be untangled from cell proliferation and ligand gradient control. Previously, the Activin RI receptor Babo and Smad2 were shown to be specifically required for cellular proliferation and overall growth of the wing imaginal disc [15]. Interestingly, the TGFβ/Activin branch was not found to affect any specific transition of the cell cycle or to cause extensive apoptosis in the wing disc [15]. Recently, TGFβ signalling was also shown to regulate mitochondrial metabolism in Drosophila [40], and to promote the Warburg effect (aerobic glycolysis) in breast tumours [41]. These results, together with our previous report of a genetic interaction between members of the TGFβ signalling pathways and vito, a nucleolar regulator of growth [16], lead us to focus on the possible regulation of basic mechanisms of cell growth by TGFβ/Activin. We found that interfering with TGFβ/Activin signalling caused changes in nucleolar biogenesis with increased relative areas and altered ultrastructure. Furthermore, this correlated with accumulation of unprocessed intermediate pre-rRNA transcripts, defects in ribosome biogenesis with a significant decrease in 18S rRNA and very significant effects on the nuclear localization of ribosomal proteins. What are the mechanisms by which TGFβ regulates ribosome biogenesis? TGFβ signalling may regulate the transcription of targets with direct enzymatic roles in pre-RNA processing or ribosome biogenesis and nuclear export. The 5′–3′ RNA exonuclease Vito is a strong candidate to fulfil that role. In the budding yeast, the Vito homologue Rrp17p acts as a functional link between late processing of pre-rRNA and nuclear export of pre-60S ribosomal subunits [42]. When we interfered with Put function, Vito levels increased, but Vito accumulated in intranucleolar spots and thus might not be available at the peripheral nucleoplasm to efficiently chaperone pre-ribosomal particles for nuclear export. That would explain the observed accumulation of RpL10A and RpL22 (and putative ribosomal particles detected by TEM) at the peripheral nucleoplasm. At the same time, Rrp17p is required for ITS1 processing [42,43], thus the misregulation of Vito function in salivary gland cells could cause the observed increase in pre-rRNA intermediate transcripts, and the observed accumulation of RpS6 in intranucleolar spots.
Could TGFβ regulate ribosome biogenesis through other novel mechanisms? In fact, in breast cancer cells, a cancer-specific nuclear translocation of TβRI was shown to regulate nuclear mRNA processing [44]. Furthermore, in mammalian cells, TGFβ signalling has also been shown to regulate directly the biogenesis of a set of miRNA at the post-transcriptional level [45,46]. Surprisingly, R-Smads associated with the large Drosha/DGCR8/p68 microprocessor complex have been shown to bind pri-miRNAs and facilitate the cleavage of pri-miRNA to pre-miRNA by Drosha [45,46]. Alternatively, TGFβ may regulate the expression or nucleolar recruitment of ribosomal proteins, causing changes in nucleolar dynamics and indirectly affecting pre-rRNA processing. In fact, in Diamond–Blackfan anaemia, haploinsufficiency for several ribosomal genes has been shown to affect pre-ribosomal RNA (pre-rRNA) processing and thus to interfere with ribosome biogenesis [47]. Despite the precise mechanism, we show for the first time that TGFβ/Activin signalling is required for normal assembly of the nucleolus and pre-rRNA processing.
4. Material and methods
4.1. Fly strains and husbandry
All crosses were raised at 25°C under standard conditions and for synchronization; all the conditions were analysed after a single day of egg collection. The following stocks (described in FlyBase, unless stated otherwise) were used: ey-Gal4, UAS-lacZ and the wild-type strain w1118. UAS-CD4tdTomato was used to report salivary glands expression of ey-Gal4 (electronic supplementary material, figure S4a–c′). AB1-Gal4 and ptc-Gal4 were used as salivary gland alternative drivers with similar results to ey-Gal4 (electronic supplementary material, figure S4d–f′). The TGFβ RNAis were obtained from different collections: putRNAi#37279 (VDRC), putRNAi 7904R-3 (Nigfly), smad2RNAi (#2262R-2, Nigfly) and madRNAi (#31315, TRiP). The following TGFβ pathway mutants were obtained from the Bloomington Stock Center: put135, put10460, babo32, baboK16912, tkv1 and tkv8. Overexpression studies were done using UAS-Put [48] and UAS-dMyc [49]. The protein trap strains used in these studies were RpL41YFP (#115-344 Cambridge Protein Trap YFP insertions) and RpS9YFP (#115-034 Cambridge Protein Trap YFP insertions).
4.2. Immunostaining
Eye-antennal imaginal discs and salivary glands were prepared for immunohistochemistry using standard protocols. As the growth conditions strongly affect salivary gland size, all the experiments were controlled by synchronization of L3 wandering larvae after a single-day egg collection. To further control this issue, a controlled the egg laying for 5 h was set up, and the salivary glands were analysed 96 h after egg laying (96–101 h AEL; electronic supplementary material, figure S4g–j′).
Primary antibodies used were: mouse anti-Armadillo N27A1 at 1 : 100 (Developmental Studies Hybridoma Bank, DSHB), mouse anti-Dlg at 1 : 1000 (4F3, DSHB), rabbit anti-Viriato (Vito) at 1 : 250 (ABGent), rat anti-DCad at 1 : 100, mouse anti-AH6 at 1 : 10 (DSHB), rabbit anti-Fibrillarin at 1 : 250 (Abcam, #ab5821), mouse anti-Fibrillarin at 1 : 500 (Abcam, #ab4566), mouse anti-RpS6 at 1 : 100 (Cell Signaling, #2317), mouse anti-RpL11 at 1 : 100 (Abcam, #ab79352), mouse anti-RpL10A at 1 : 400 (Abcam, #ab55544), rabbit anti-RpL22 at 1 : 100 (kind gift from Dr Vassie Ware). To stain for cellular limits phalloidin conjugated with rhodamine was used at a dilution of 1 : 1000. Appropriate Alexa-Fluor conjugated secondary antibodies were from Molecular Probes. Images were obtained with the Leica SP2 confocal system or Leica SP5 confocal system and processed with Adobe Photoshop.
4.3. Size measurements and statistics
Salivary gland areas were measured using the Polygon selection tool of ImageJ 1.48r software (NIH, Bethesda, MA), considering the limits stained by Arm, Dcad or RhPh and represented as arbitrary units. The cellular parameters shown in this study were measured using the Polygon selection tool of ImageJ 1.48r. The nucleolar area was determined using the nucleolar markers RpL41YFP, anti-AH6 or anti-Fibrillarin and DAPI staining was used to stain for the nuclear area. The results are presented as the ratio of the nucleolar area to the nucleus that it corresponds to. The intensity of the nucleolar components was determined using a fixed ROI circle, and the mean intensity of each nucleolus was measured using ImageJ. To each measurement, another nucleolar component was used as reference (for example, AH6 and Fibrillarin). For each genotype, five to six nuclei from the proximal region of at least five to six independent salivary glands were used. Statistical analysis and generation of the graphical output was done using GraphPad Prism v. 5.0. Statistical significance was determined using an unpaired, two-tailed Student's t-test, with a 95% confidence interval, after assessing the normality distribution of the data with D'Agostino–Pearson normality test.
4.4. Transmission electron microscopy
Dissected third-instar salivary glands were fixed with 2.5% glutaraldehyde in 0.1 M sodium cacodylate buffer for 30 min and post-fixed with 4% osmium tetroxide. After washing, salivary glands were incubated with 0.5% uranyl acetate (30 min) and further dehydrated through a graded ethanol series (70% for 10 min, 90% for 10 min and four changes of 100%). Salivary glands were then soaked in propylene oxide for 10 min and then in a mixture (1 : 1) of propylene oxide and Epon resin (TAAB Laboratories) for 30 min. This mixture was then replaced by 100% Epon resin for 24 h. Finally, fresh Epon replaced the Epon and polymerization took place at 60°C for 48 h. Ultrathin sections were obtained using an ultramicrotome, collected in copper grids and then double contrasted with uranyl acetate and lead citrate. In total, at least 16 independent cells of five independent salivary glands were analysed for each genotype. Micrographs were taken using a TEM Jeol JEM-1400, with Orius SC 1000 digital camera (80 kV).
4.5. Quantitative real-time PCR
For qPCR experiments, all the RNAis were induced with the ey-Gal4 driver, and the salivary glands of wandering L3 instar larvae were dissected. The number of salivary glands was determined according to its size to yield similar RNA concentrations (i.e. for w1118 control strain, a minimum of 30 salivary glands were dissected, for ey-Gal4; putRNAi37279 50–60 salivary glands were dissected and 40–50 salivary glands were dissected for ey-Gal4; smad2RNAi2262R−2).
The RNA was extracted using TRIzol (Invitrogen) according to the manufacturer's instructions and treated with Turbo DNase I (Ambion). cDNA was generated by reverse transcription with the SuperScript III First-Strand Synthesis SuperMix for qRT-PCR (Invitrogen). Quantitative real-time PCR analysis was performed in triplicate in 20 µl reactions containing iQ SYBR Green Supermix (BioRad), each gene-specific primer at 250 nM and 1 µl of cDNA template. Cycling conditions in a BioRad iQ5 instrument were 95°C for 3 min, followed by 40 cycles of denaturation at 95°C for 10 s and annealing for 30 s at 53°C, 60°C or 64°C depending on the primer set. Fold change relative to the expression of CaMKII, which has been used previously as a control for gene expression [17], was calculated using the 2–ΔCT method [50]. Three to five biological replicates were analysed for each primer set. The following primer pairs (from 5′ to 3′) were used:
CaMKII (control): Fw—TTACACCATCCCAACATAGTGC
Rev—CAAGGTCAAAAACAAGGTAGTGATAG;
28S: Fw—GGAGGATCTTCGATCACCTGATG
Rev—GCTGCTCAACCACTTACAACAC;
18S: Fw— TGGTCTTGTACCGACGACAG
Rev—GCTGCCTTCCTTAGATGTGG;
ITS1: Fw—TTATTGAAGGAATTGATATATGCC
Rev—ATGAGCCGAGTGATCCAC;
ETS: Fw—GCTCCGCGGATAATAGGAAT
Rev—ATATTTGCCTGCCACCAAAA.
Supplementary Material
Acknowledgements
We thank Konrad Basler, Vassie Ware, the Bloomington Drosophila Stock Center, the Vienna Drosophila RNAi Center, the Drosophila Genetic Resource Center, and the Developmental Studies Hybridoma Bank for reagents; Paula Sampaio (ALMF, IBMC) and Rui Fernandes for technical assistance (HEMS, IBMC). We also thank Leah Bury for critical reading of the manuscript.
Data accessibility
The datasets supporting this article have been uploaded as part of the electronic supplementary material.
Competing interests
We declare we have no competing interests.
Funding
This work was supported by project Norte-01-0145-FEDER-000029, Advancing Cancer Research: From Basic Knowledge to Application, supported by Norte Portugal Regional Operational Programme (NORTE 2020), under the PORTUGAL 2020 Partnership Agreement, through the European Regional Development Fund (ERDF) and by National Funds through FCT–‘Fundação para a Ciência e a Tecnologia’ under the project FCOMP-01-0124-FEDER-015675 (PTDC/SAU-BID/112250/2009). T.M. was supported by an FCT Fellowship ALTF 677-2012, and N.E. was supported by a PhD FCT Fellowship SFRH/BD/95087/2013. P.S.P. is a recipient of a Portuguese ‘Investigator FCT’ contract.
References
- 1.Massague J. 2012. TGFβ signalling in context. Nat. Rev. Mol. Cell Biol. 13, 616–630. (doi:10.1038/nrm3434) [DOI] [PMC free article] [PubMed] [Google Scholar]
- 2.Salomon D. 2014. Transforming growth factor β in cancer: Janus, the two-faced god. J. Natl Cancer Inst. 106, djt441. (doi:10.1093/jnci/djt441) [DOI] [PMC free article] [PubMed] [Google Scholar]
- 3.Inman GJ. 2011. Switching TGFβ from a tumor suppressor to a tumor promoter. Curr. Opin. Genet. Dev. 21, 93–99. (doi:10.1016/j.gde.2010.12.004) [DOI] [PubMed] [Google Scholar]
- 4.Lamouille S, Derynck R. 2007. Cell size and invasion in TGF-β-induced epithelial to mesenchymal transition is regulated by activation of the mTOR pathway. J. Cell Biol. 178, 437–451. (doi:10.1083/jcb.200611146) [DOI] [PMC free article] [PubMed] [Google Scholar]
- 5.Wu L, Derynck R. 2009. Essential role of TGF-β signaling in glucose-induced cell hypertrophy. Dev. Cell 17, 35–48. (doi:10.1016/j.devcel.2009.05.010) [DOI] [PMC free article] [PubMed] [Google Scholar]
- 6.Yadav H, et al. 2011. Protection from obesity and diabetes by blockade of TGF-β/Smad3 signaling. Cell Metab. 14, 67–79. (doi:10.1016/j.cmet.2011.04.013) [DOI] [PMC free article] [PubMed] [Google Scholar]
- 7.Parker L, Stathakis DG, Arora K. 2004. Regulation of BMP and activin signaling in Drosophila. Prog. Mol. Subcell Biol. 34, 73–101. (doi:10.1007/978-3-642-18670-7_4) [DOI] [PubMed] [Google Scholar]
- 8.Brummel T, Abdollah S, Haerry TE, Shimell MJ, Merriam J, Raftery L, Wrana JL, O'Connor MB. 1999. The Drosophila activin receptor baboon signals through dSmad2 and controls cell proliferation but not patterning during larval development. Genes Dev. 13, 98–111. (doi:10.1101/gad.13.1.98) [DOI] [PMC free article] [PubMed] [Google Scholar]
- 9.Zhu CC, Boone JQ, Jensen PA, Hanna S, Podemski L, Locke J, Doe CQ, O'Connor MB. 2008. Drosophila Activin- and the Activin-like product Dawdle function redundantly to regulate proliferation in the larval brain. Development 135, 513–521. (doi:10.1242/dev.010876) [DOI] [PubMed] [Google Scholar]
- 10.Jensen PA, Zheng X, Lee T, O'Connor MB. 2009. The Drosophila Activin-like ligand Dawdle signals preferentially through one isoform of the type-I receptor Baboon. Mech. Dev. 126, 950–957. (doi:10.1016/j.mod.2009.09.003) [DOI] [PMC free article] [PubMed] [Google Scholar]
- 11.Gesualdi SC, Haerry TE. 2007. Distinct signaling of drosophila activin/TGF-β family members. Fly (Austin) 1, 212–221. (doi:10.4161/fly.5116) [DOI] [PubMed] [Google Scholar]
- 12.Zheng X, Wang J, Haerry TE, Wu AY, Martin J, O'Connor MB, Lee C-HJ, Lee T. 2003. TGF-β signaling activates steroid hormone receptor expression during neuronal remodeling in the Drosophila brain. Cell 112, 303–315. (doi:10.1016/S0092-8674(03)00072-2) [DOI] [PubMed] [Google Scholar]
- 13.Serpe M, O'Connor MB. 2006. The metalloprotease tolloid-related and its TGF-β-like substrate Dawdle regulate Drosophila motoneuron axon guidance. Development 133, 4969–4979. (doi:10.1242/dev.02711) [DOI] [PubMed] [Google Scholar]
- 14.Parker L, Ellis JE, Nguyen MQ, Arora K. 2006. The divergent TGF-β ligand Dawdle utilizes an activin pathway to influence axon guidance in Drosophila. Development 133, 4981–4991. (doi:10.1242/dev.02673) [DOI] [PubMed] [Google Scholar]
- 15.Hevia CF, de Celis JF. 2013. Activation and function of TGFβ signalling during Drosophila wing development and its interactions with the BMP pathway. Dev. Biol. 377, 138–153. (doi:10.1016/j.ydbio.2013.02.004) [DOI] [PubMed] [Google Scholar]
- 16.Marinho J, Martins T, Neto M, Casares F, Pereira PS. 2013. The nucleolar protein Viriato/Nol12 is required for the growth and differentiation progression activities of the Dpp pathway during Drosophila eye development. Dev. Biol. 377, 154–165. (doi:10.1016/j.ydbio.2013.02.003) [DOI] [PubMed] [Google Scholar]
- 17.Marinho J, Casares F, Pereira PS. 2011. The Drosophila Nol12 homologue viriato is a dMyc target that regulates nucleolar architecture and is required for dMyc-stimulated cell growth. Development 138, 349–357. (doi:10.1242/dev.054411) [DOI] [PubMed] [Google Scholar]
- 18.Grewal SS, Li L, Orian A, Eisenman RN, Edgar BA. 2005. Myc-dependent regulation of ribosomal RNA synthesis during Drosophila development. Nat. Cell Biol. 7, 295–302. (doi:10.1038/ncb1223) [DOI] [PubMed] [Google Scholar]
- 19.Burke R, Basler K. 1996. Hedgehog-dependent patterning in the Drosophila eye can occur in the absence of Dpp signaling. Dev. Biol. 179, 360–368. (doi:10.1006/dbio.1996.0267) [DOI] [PubMed] [Google Scholar]
- 20.Hovhanyan A, Herter EK, Pfannstiel J, Gallant P, Raabe T. 2014. Drosophila mbm is a nucleolar myc and casein kinase 2 target required for ribosome biogenesis and cell growth of central brain neuroblasts. Mol. Cell Biol. 34, 1878–1891. (doi:10.1128/MCB.00658-13) [DOI] [PMC free article] [PubMed] [Google Scholar]
- 21.Henderson KD, Andrew DJ. 1998. Identification of a novel Drosophila SMAD on the X chromosome. Biochem. Biophys. Res. Commun. 252, 195–201. (doi:10.1006/bbrc.1998.9562) [DOI] [PubMed] [Google Scholar]
- 22.Newfeld SJ, Chartoff EH, Graff JM, Melton DA, Gelbart WM. 1996. Mothers against dpp encodes a conserved cytoplasmic protein required in DPP/TGF-β responsive cells. Development 122, 2099–2108. [DOI] [PubMed] [Google Scholar]
- 23.Sekelsky JJ, Newfeld SJ, Raftery LA, Chartoff EH, Gelbart WM. 1995. Genetic characterization and cloning of mothers against dpp, a gene required for decapentaplegic function in Drosophila melanogaster. Genetics 139, 1347–1358. [DOI] [PMC free article] [PubMed] [Google Scholar]
- 24.Wiersdorff V, Lecuit T, Cohen SM, Mlodzik M. 1996. Mad acts downstream of Dpp receptors, revealing a differential requirement for dpp signaling in initiation and propagation of morphogenesis in the Drosophila eye. Development 122, 2153–2162. [DOI] [PubMed] [Google Scholar]
- 25.Boulon S, Westman BJ, Hutten S, Boisvert FM, Lamond AI. 2010. The nucleolus under stress. Mol. Cell 40, 216–227. (doi:10.1016/j.molcel.2010.09.024) [DOI] [PMC free article] [PubMed] [Google Scholar]
- 26.Wang S, Huang J, He J, Wang A, Xu S, Huang SF, Xiao S. 2010. RPL41, a small ribosomal peptide deregulated in tumors, is essential for mitosis and centrosome integrity. Neoplasia 12, 284–293. (doi:10.1593/neo.91610) [DOI] [PMC free article] [PubMed] [Google Scholar]
- 27.Rugjee KN, Roy Chaudhury S, Al-Jubran K, Ramanathan P, Matina T, Wen J, Brogna S. 2013. Fluorescent protein tagging confirms the presence of ribosomal proteins at Drosophila polytene chromosomes. PeerJ 1, e15 (doi:10.7717/peerj.15) [DOI] [PMC free article] [PubMed] [Google Scholar]
- 28.Nissan TA, Galani K, Maco B, Tollervey D, Aebi U, Hurt E. 2004. A pre-ribosome with a tadpole-like structure functions in ATP-dependent maturation of 60S subunits. Mol. Cell 15, 295–301. (doi:10.1016/j.molcel.2004.06.033) [DOI] [PubMed] [Google Scholar]
- 29.He F, James A, Raje H, Ghaffari H, DiMario P. 2014. Deletion of Drosophila Nopp140 induces subcellular ribosomopathies. Chromosoma 124, 191–208. (doi:10.1007/s00412-014-0490-9) [DOI] [PubMed] [Google Scholar]
- 30.Phipps KR, Charette J, Baserga SJ. 2011. The small subunit processome in ribosome biogenesis-progress and prospects. Wiley Interdiscip. Rev. RNA 2, 1–21. (doi:10.1002/wrna.57) [DOI] [PMC free article] [PubMed] [Google Scholar]
- 31.Thomson E, Ferreira-Cerca S, Hurt E. 2013. Eukaryotic ribosome biogenesis at a glance. J. Cell Sci. 126, 4815–4821. (doi:10.1242/jcs.111948) [DOI] [PubMed] [Google Scholar]
- 32.Ruggero D. 2009. The role of Myc-induced protein synthesis in cancer. Cancer Res. 69, 8839–8843. (doi:10.1158/0008-5472.CAN-09-1970) [DOI] [PMC free article] [PubMed] [Google Scholar]
- 33.Arabi A, et al. 2005. c-Myc associates with ribosomal DNA and activates RNA polymerase I transcription. Nat. Cell Biol. 7, 303–310. (doi:10.1038/ncb1225) [DOI] [PubMed] [Google Scholar]
- 34.Grandori C, Gomez-Roman N, Felton-Edkins ZA, Ngouenet C, Galloway DA, Eisenman RN, White RJ. 2005. c-Myc binds to human ribosomal DNA and stimulates transcription of rRNA genes by RNA polymerase I. Nat. Cell Biol. 7, 311–318. (doi:10.1038/ncb1224) [DOI] [PubMed] [Google Scholar]
- 35.Cowling VH, Turner SA, Cole MD. 2014. Burkitt's lymphoma-associated c-Myc mutations converge on a dramatically altered target gene response and implicate Nol5a/Nop56 in oncogenesis. Oncogene 33, 3519–3527. (doi:10.1038/onc.2013.338) [DOI] [PMC free article] [PubMed] [Google Scholar]
- 36.Barna M, Pusic A, Zollo O, Costa M, Kondrashov N, Rego E, Rao PH, Ruggero D. 2008. Suppression of Myc oncogenic activity by ribosomal protein haploinsufficiency. Nature 456, 971–975. (doi:10.1038/nature07449) [DOI] [PMC free article] [PubMed] [Google Scholar]
- 37.Pierce SB, et al. 2004. dMyc is required for larval growth and endoreplication in Drosophila. Development 131, 2317–2327. (doi:10.1242/dev.01108) [DOI] [PubMed] [Google Scholar]
- 38.Maines JZ, Stevens LM, Tong X, Stein D. 2004. Drosophila dMyc is required for ovary cell growth and endoreplication. Development 131, 775–786. (doi:10.1242/dev.00932) [DOI] [PubMed] [Google Scholar]
- 39.Zielke N, et al. 2011. Control of Drosophila endocycles by E2F and CRL4(CDT2). Nature 480, 123–127. (doi:10.1038/nature10579) [DOI] [PMC free article] [PubMed] [Google Scholar]
- 40.Ghosh AC, O'Connor MB. 2014. Systemic Activin signaling independently regulates sugar homeostasis, cellular metabolism, and pH balance in Drosophila melanogaster. Proc. Natl Acad. Sci. USA 111, 5729–5734. (doi:10.1073/pnas.1319116111) [DOI] [PMC free article] [PubMed] [Google Scholar]
- 41.Guido C, et al. 2012. Metabolic reprogramming of cancer-associated fibroblasts by TGF-β drives tumor growth: connecting TGF-β signaling with ‘Warburg-like’ cancer metabolism and L-lactate production. Cell Cycle 11, 3019–3035. (doi:10.4161/cc.21384) [DOI] [PMC free article] [PubMed] [Google Scholar]
- 42.Oeffinger M, Zenklusen D, Ferguson A, Wei KE, El Hage A, Tollervey D, Chait BT, Singer RH, Rout MP. 2009. Rrp17p is a eukaryotic exonuclease required for 5' end processing of Pre-60S ribosomal RNA. Mol. Cell 36, 768–781. (doi:10.1016/j.molcel.2009.11.011) [DOI] [PMC free article] [PubMed] [Google Scholar]
- 43.Sahasranaman A, Dembowski J, Strahler J, Andrews P, Maddock J, Woolford JL Jr. 2011. Assembly of Saccharomyces cerevisiae 60S ribosomal subunits: role of factors required for 27S pre-rRNA processing. EMBO J. 30, 4020–4032. (doi:10.1038/emboj.2011.338) [DOI] [PMC free article] [PubMed] [Google Scholar]
- 44.Chandra M, et al. 2012. Nuclear translocation of type I transforming growth factor β receptor confers a novel function in RNA processing. Mol. Cell Biol. 32, 2183–2195. (doi:10.1128/MCB.00320-12) [DOI] [PMC free article] [PubMed] [Google Scholar]
- 45.Davis BN, Hilyard AC, Nguyen PH, Lagna G, Hata A. 2010. Smad proteins bind a conserved RNA sequence to promote microRNA maturation by Drosha. Mol. Cell 39, 373–384. (doi:10.1016/j.molcel.2010.07.011) [DOI] [PMC free article] [PubMed] [Google Scholar]
- 46.Davis BN, Hilyard AC, Lagna G, Hata A. 2008. SMAD proteins control DROSHA-mediated microRNA maturation. Nature 454, 56–61. (doi:10.1038/nature07086) [DOI] [PMC free article] [PubMed] [Google Scholar]
- 47.Ellis SR. 2014. Nucleolar stress in Diamond Blackfan anemia pathophysiology. Biochim. Biophys. Acta 1842, 765–768. (doi:10.1016/j.bbadis.2013.12.013) [DOI] [PubMed] [Google Scholar]
- 48.Ruberte E, Marty T, Nellen D, Affolter M, Basler K. 1995. An absolute requirement for both the type II and type I receptors, punt and thick veins, for dpp signaling in vivo. Cell 80, 889–897. (doi:10.1016/0092-8674(95)90292-9) [DOI] [PubMed] [Google Scholar]
- 49.Datar SA, Jacobs HW, de la Cruz AF, Lehner CF, Edgar BA. 2000. The Drosophila cyclin D-Cdk4 complex promotes cellular growth. EMBO J. 19, 4543–4554. (doi:10.1093/emboj/19.17.4543) [DOI] [PMC free article] [PubMed] [Google Scholar]
- 50.Livak KJ, Schmittgen TD. 2001. Analysis of relative gene expression data using real-time quantitative PCR and the 2(-Delta Delta C(T)) method. Methods 25, 402–408. (doi:10.1006/meth.2001.1262) [DOI] [PubMed] [Google Scholar]
Associated Data
This section collects any data citations, data availability statements, or supplementary materials included in this article.
Supplementary Materials
Data Availability Statement
The datasets supporting this article have been uploaded as part of the electronic supplementary material.


