Abstract
Aims/hypothesis
The worldwide incidence of obesity and diabetes continues to rise at an alarming rate. A major cause of the morbidity and mortality associated with obesity and diabetes is heart disease, yet the mechanisms that lead to cardiovascular complications remain unclear.
Methods
We performed cardiac MRI to assess left ventricular morphology and function during the development of moderate obesity and insulin resistance in a well-established canine model (n=26). To assess the influence of dietary fat composition, we randomised animals to a traditional lard diet (rich in saturated and monounsaturated fat; n=12), a salmon oil diet (rich in polyunsaturated fat; n=8) or a control diet (n=6).
Results
High-fat feeding with lard increased bodyweight and fasting insulin and markedly reduced insulin sensitivity. Lard feeding also significantly reduced left ventricular function, evidenced by a worsening of circumferential strain and impairment in left ventricular torsion. High-fat feeding with salmon oil increased bodyweight; however, salmon oil feeding did not impair insulin sensitivity or cardiac function.
Conclusions/interpretation
These data emphasise the importance of dietary fat composition on both metabolic and cardiac function, and have important implications for the relationship between diet and health.
Keywords: Insulin resistance, Magnetic resonance imaging, Obesity, Subclinical heart disease, Type 2 diabetes
Introduction
Heart disease is the leading cause of death in the United States, and a substantial number of cases can be linked to obesity-related behaviours such as physical inactivity and unhealthy diets [1]. Current global estimates are that more than 1.4 billion adults are overweight; of these, approximately 500 million are considered obese (11% of the world population) [2]. The exact mechanisms by which obesity leads to heart disease, however, remain poorly understood.
Obesity increases traditional cardiovascular risk factors such as hypertension, hyperlipidemia and type 2 diabetes mellitus. Obesity may also have direct cardiovascular consequences, including altering circulatory hemodynamics. To examine the underlying mechanisms involved in the early development of heart disease, we studied our well-established canine model of diet-induced obesity and insulin resistance [3–7]. In our hands, this model has been critical in elucidating the relationship between insulin sensitivity (SI) and hyperinsulinaemic compensation to determine individual risk for the development of diabetes [8]. Additionally, this model has clarified the time course of impairments in glucose tolerance and SI and subsequent compensatory hyperinsulinaemia, as assessed by the acute insulin response to glucose (AIRg) [9]. Whether high-fat feeding also influences cardiac function in this model remains unknown.
Accordingly, we designed the present study to assess cardiac function in our lard-fed canine model: this diet is high in saturated and monounsaturated fat. We compared this fat diet with one supplemented instead with salmon oil, a rich source of polyunsaturated fatty acids (PUFAs), to determine the influence of dietary fat composition per se on cardiometabolic outcomes. Indeed, dietary supplementation with PUFAs is suggested to provide cardioprotective benefits [10]; however, previous studies have typically used PUFAs to supplement a standard or high-fat diet rather than completely substituting one type of fat for another [11]. We hypothesised that lard feeding would cause cardiac dysfunction in association with insulin resistance and that these changes would not be induced by a diet rich in PUFAs. We further hypothesised that the cardiac dysfunction observed in the lard-fed animals would be associated with ectopic fat deposition in cardiomyocytes (i.e. cardiac steatosis), as measured by magnetic resonance spectroscopy.
Methods
Animals
Male mongrel dogs (Antech, Barnhart, MO, USA; n=26, >1 year old, 31.1±3.1 [mean ± SD]) were housed in the Cedars-Sinai Medical Center vivarium under controlled kennel conditions (12-h:12-h light:dark cycle). Animals were accepted into the study following physical examination and a comprehensive panel of blood tests. Dogs were included in experiments only if judged to be in good health, as determined by visual observation, body temperature and haematocrit. All experimental protocols were approved by the Cedars-Sinai Medical Center Institutional Animal Care and Use Committee.
Diet
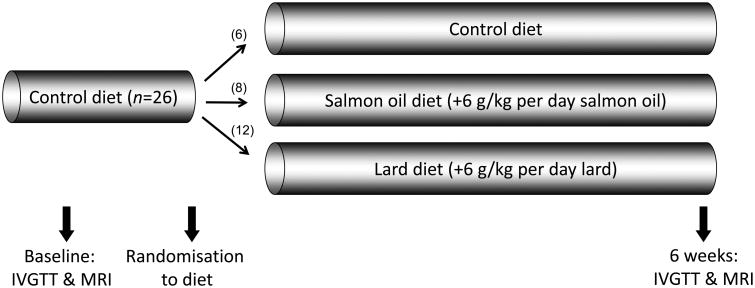
Dogs were fed a standard daily diet of one can of Hill's Prescription Diet (415 g; 10% carbohydrate, 9% protein, 8% fat, 0.3% fibre and 73% moisture [Hill's Pet Nutrition, Topeka, KS, USA]) and 825 g dry chow (40% carbohydrate, 26% protein, 14% fat, and 3% fibre [mixture of Laboratory HDL Canine Diet and Prolab Canine 2000, Richmond, IN, USA]) for 2 weeks prior to participation in the study. Food was presented from 9:00 to 10:00 each day and consisted of 14,970 kJ/day: 38% from carbohydrates, 26% from protein and 36% from fat. Following baseline experiments, animals were randomly assigned to a control, lard or salmon oil diets, on which they remained for the duration of the study. Animal batches were randomly assigned to dietary groups using the random number generator in Microsoft Excel. The control group remained on the standard diet (n=6). For the high-fat diet groups, the standard diet was supplemented with 6 g/kg of either rendered pork fat (lard, n=12) or salmon oil (n=8), resulting in high-fat diets of identical macronutrient content consisting of 21,025 kJ/day comprised of 27% carbohydrate, 19% protein and 53% fat. Diets were given for 6 weeks, according to the standard lard-fed protocol used in our laboratory to develop diet-induced insulin resistance in this model. A schematic diagram of the protocol is shown in Fig. 1. Each animal underwent baseline assessments, which were repeated after 6 weeks. A subset of eight lard-fed animals was intermediately assessed after 2 weeks.
Fig. 1.
Schematic diagram of the experimental protocol. Numbers in brackets are the numbers of dogs assigned to each group
MRI and magnetic resonance spectroscopy
MRI and magnetic resonance spectroscopy (MRS) were performed before and after high-fat feeding using a 3.0 T whole body scanner (MAGNETOM Verio, Siemens Healthcare, Erlangen, Germany). Prior to imaging, dogs were fasted overnight and initially sedated with acepromazine (0.1 mg/kg, s.c.) and then anesthetised with propofol (3.7 mg/kg, i.v.). The animals were then intubated and mechanically ventilated with room air supplemented with oxygen; anaesthesia was maintained with 1–2% isoflurane. A catheter was placed in a forelimb vein for the intravenous administration of fluids. A second catheter was placed in a hindlimb artery for the measurement of peripheral BP. Heart rate (electrocardiography) and BP were monitored using a magnetic resonance compatible monitoring system (Expression, Invivo, Gainesville, FL, USA).
Cardiac MRI
To assess left ventricular morphology and function, short-axis retrospectively gated cine images covering the entire left ventricle (LV) were acquired. Image acquisition variables were as follows: repetition time = 12.76 ms; echo time = 1.6 ms; flip angle = 50°; slice thickness = 6 mm with a 0 mm gap between slices; matrix = 138×192; field of view 195–270 mm; in-plane resolution 1.4×1.4 mm; and 25–28 ms temporal resolution with 35 reconstructed phases. Epicardial and endocardial border tracing of the short-axis cine images at the end of diastole and end of systole was performed using cvi42 commercial software (Circle Cardiovascular Imaging, Calgary, AB, Canada) for determining end-diastolic and end-systolic volumes. The papillary muscles were included in all tracings. End systole was visually defined as the phase with the smallest LV volume. Left ventricular mass was computed as the product of end-diastolic myocardial volume and myocardial density (1.05 g/ml). Left ventricular concentricity was defined as the ratio between left ventricular mass and left ventricular end-diastolic volume.
Myocardial tissue tagging was applied to four evenly spaced, short-axis, retrospectively gated slices spanning the LV from base to apex, using a gradient echo sequence – Fast Low Angle Shot. Care was taken to select the most basal slice (without including the outflow tract) and the apical slice was prescribed 1 cm above luminal obliteration. Typical imaging variables included a slice thickness of 6 mm, 7 mm grid tags, echo time = 1.8 ms, repetition time = 20.6 ms, matrix = 208×150, flip angle=8°, field of view =195×270 mm2, and an in-plane resolution of 1.3×1.3 mm. Images were analysed using commercially available software (HARP, Diagnosoft, Palo Alto, CA, USA) to determine circumferential strain and left ventricular torsion (i.e. basal to apical net rotation). Tag analysis was fully automated, with user input limited to tracing the endo- and epicardium at a single end-systolic reference cardiac phase for each slice. Peak circumferential strain and peak circumferential strain rate in systole and diastole were derived by averaging the strain vs time curve for all four slices. LV twist was defined as the basal to apical angle difference (in °) throughout the cardiac cycle, with peak twist, peak twisting rate and peak untwisting rate selected appropriately from the twist-by-time curve. Peak torsion was derived by normalising LV twist to the distance between the basal and apical slices (twist/cm).
Cardiac MRS
After anatomic imaging, the spectroscopic volume of interest (single voxel, 8×20×26 mm3, 4.5 ml) was positioned over the interventricular septum using the three perpendicular end-systolic cardiac cine images collected at end-expiration. During the acquisition of spectroscopic data, dogs were mechanically ventilated. Data acquisition was triggered simultaneously at the end of systole (via ECG gating) and the end of expiration [12]. Spectra were collected without water suppression and with the following variables: repetition time, approximately 4 s depending on heart rate, echo time = 35 ms; 1,024 data points over a 2,000 Hz spectral width; and 32 acquisitions. Spectroscopy data was processed using commercial software (NUTS, Acorn NMR, Fremont, CA, USA). The final calculation of fat and water signal intensities accounted for fat and water signal decay due to spin–spin relaxation. Myocardial triacylglycerol (mTG) content is expressed as a percentage of tissue water content [13, 14].
MRI of abdominal fat distribution
Total, subcutaneous, and intra-abdominal fat masses were determined from abdominal axial contiguous three-dimensional vibe images at the 20 cm region of the thorax, using the left renal artery branch from the abdominal aorta as a midpoint landmark. Typical imaging variables included slice thickness = 2.5 mm, echo time = 1.1 ms, repetition time = 3.0 ms, matrix = 256×136, flip angle=10°, field of view = 400×212 mm2, and in-plane resolution = 1.56×1.56 mm. The abdominal image analysis was performed using sliceOmatic software (4.3 rev 10; Virtual Magic, Montreal, Canada) by a single experienced observer blinded to study condition. Fat depots were defined and per cent fat was calculated as previously described [15].
Assessment of insulin action and insulin secretion
SI and AIRg were assessed using the frequently sampled IVGTT as previously described [16]. Briefly, overnight-fasted animals were brought into the laboratory at 07:00 and a catheter was placed in a peripheral vein and secured as previously described [17]. After three fasting samples were drawn, 0.3 g/kg of glucose was injected into the peripheral vein. After 20 min, 0.03 U/kg of insulin was injected. Blood samples were taken frequently for determining glucose and insulin concentrations and were measured in duplicate. AIRg was calculated as the AUC of insulin from 0–20 min. SI was calculated using the minimal model [17].
Statistical analysis
All data are expressed as the mean ± SEM. Mixed-model analysis was used to determine the effects of diet while controlling for time. Comparisons were made against the initial baseline period within groups and between groups after 6 weeks of each diet. Pearson's correlation coefficients (r) were computed to assess relationships between variables. Individual values greater or less than twice the SD were considered statistical outliers and excluded from the analysis. Statistical analyses were conducted using STATA 13 MP (StataCorp, State College, TX, USA). Statistical significance was set at p<0.05.
Results
Lard feeding impairs insulin action
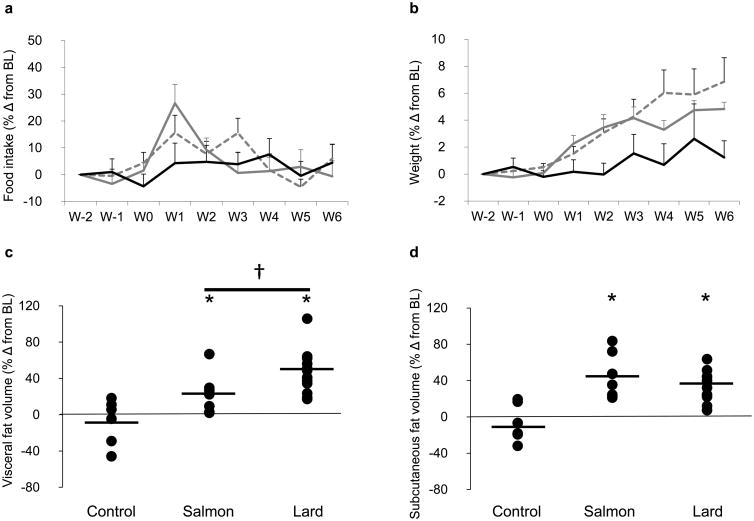
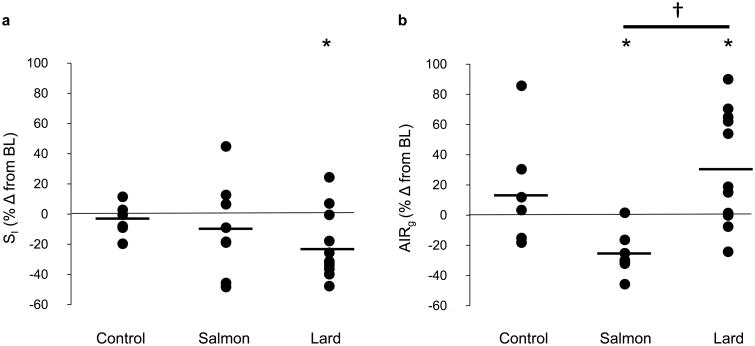
Baseline data are shown for each group of animals in Table 1. While there was a significant increase in food intake during week 1 for lard-fed animals, there was no difference between cumulative food intake over the study duration between dietary groups (±7% for both lard and salmon oil diets and ±4% for the control diet; p value, NS; Fig. 2a). Lard feeding for 6 weeks led to a significant increase in body weight (Table 2, Fig. 2b) due to increases in both the visceral and subcutaneous fat depots (Table 2, Fig. 2c–e). In addition, lard feeding was associated with an increase in the fasting insulin level (Table 2) and a significant reduction in SI with a corresponding compensatory increase in AIRg (Fig. 3a, b). The salmon oil supplemented diet induced significant overall weight gain and augmentation of both fat depots, similar to the lard-supplemented diet (Table 2, Fig. 2b–e). Notably, and in contrast to lard feeding, salmon oil feeding did not impair SI and led to a paradoxical reduction rather than increase in AIRg (Table 2, Fig. 3a, b).
Table 1. Baseline metabolic, hemodynamic and left ventricular data.
| Variable | Control (n=6) | Lard (n=12) | Salmon oil (n=8) |
|---|---|---|---|
| Metabolic indices | |||
| Weight (kg) | 29.5±0.5 | 31.5±0.6 | 31.7±1.1 |
| Fasting glucose (mmol/l) | 5.3±0.2 | 5.3±0.1 | 5.3±0.1 |
| Fasting insulin (pmol/l) | 40.6±11.0 | 50.4±7.7 | 34.6±6.8 |
| SI ([mU/l]−1 min−1) | 8.4±1.1 | 5.3±0.5 | 8.3±1.2 |
| AIRg (mU/l × min) | 398.8±28.3 | 501.6±48.8 | 519.2±64.0 |
| MRI fat compartmentalisation | |||
| Total body (cm3) | 744.5±22.5 | 834.9±32.5 | 775.8±25.2 |
| Visceral fat depot (cm3) | 75.5±8.1 | 102.7±10.7 | 72.7±9.3 |
| Subcutaneous fat depot (cm3) | 56.9±6.4 | 90.0±9.6 | 53.4±5.83 |
| Lean mass (cm3) | 612.2±13.4 | 642.2±21.5 | 651.6±15.6 |
| Hemodynamics | |||
| Systolic BP (mmHg) | 83±3 | 83±3 | 81±3 |
| Diastolic BP (mmHg) | 36 ±3 | 37±3 | 36±2 |
| Heart rate (beats/min) | 86±3 | 85±3 | 83±5 |
| Left ventricular morphology and global function | |||
| End-diastolic volume (ml) | 97.0±5.5 | 99.6±4.9 | 104.8±5.6 |
| Mass (g) | 85.5±7.6 | 88.2±3.4 | 95.2±5.1 |
| Concentricity (g/ml) | 0.88±0.04 | 0.89±0.02 | 0.92±0.06 |
| Ejection fraction (%) | 44±2 | 43±2 | 43±3 |
| Circumferential strain and ventricular torsion | |||
| Peak circumferential strain (%) | −11.8±0.7 | −11.6±0.7 | −11.4±0.7 |
| Peak systolic strain rate (%/s) | −95.2±5.7 | −90.5±5.5 | −90.7±2.6 |
| Peak diastolic strain rate (%/s) | 127.3±10.2 | 116.3±7.7 | 114.1±7.2 |
| Peak torsion (°/cm) | 2.3±0.2 | 1.9±0.2 | 1.9±0.2 |
| Peak twisting rate (°/s) | 54.9±3.0 | 51.5±4.9 | 50.1±3.9 |
| Peak untwisting rate (°/s) | −66.7±9.2 | −70.6±8.5 | −59.1±6.6 |
| Myocardial triacylglycerola (%fat/H2O) | 0.13±0.07 | 0.15±0.04 | 0.07±0.05 |
Data are mean ± SEM
By MRS
To convert SI values to SI units, multiply by 0.167. To convert AIRg to SI units, multiply by 6
Fig. 2.
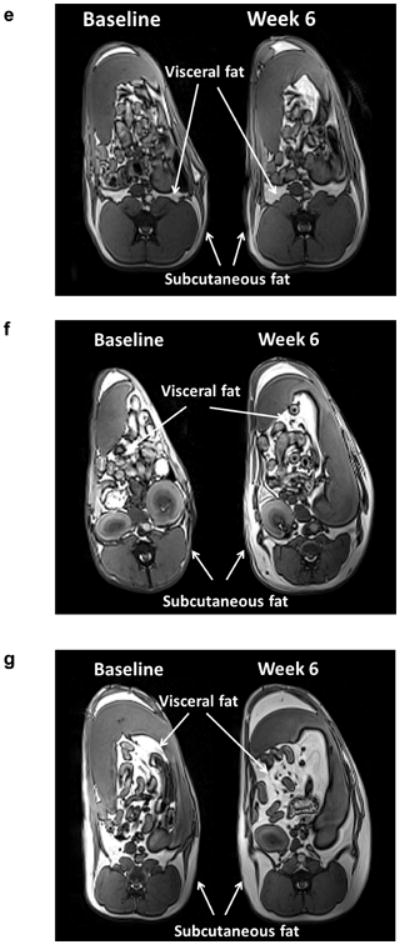
Effects of diet on (a) food intake and (b) weight gain over time in dogs in the control (black lines), salmon oil (grey dashed lines) and lard (grey solid lines) groups. Error bars are SEM. Dot plots showing the effects of diet on (c) visceral and (d) subcutaneous fat deposition. Data are reported as the percentage change (% Δ) from baseline level (BL). Horizontal black lines indicate the mean. *p<0.05 for diet vs baseline, effect of the condition; †p<0.05 for lard diet vs salmon oil diet, pairwise comparison based on mixed effects model. (e–g) MRI images of three representative dogs after 6 weeks of (e) control, (f) salmon oil or (g) lard diets. W, week
Table 2.
Effect of diet on metabolic, hemodynamic, and left ventricular indices.
| Variable | Combined baseline (n=26) | Lard diet (n=12) | Salmon oil diet (n=8) |
|---|---|---|---|
| Metabolic indices | |||
| Weight (kg) | 31.1±0.6 | 33.3±1.1* | 33.9±1.0* |
| Fasting glucose (mmol/l) | 5.3±0.1 | 5.2±0.6 | 5.3±0.1 |
| Fasting insulin (pmol/l) | 43.3±4.9 | 60.4±10.7* | 31.0±4.3 |
| SI ([mU/l]−1 min−1) | 6.9±0.6 | 3.9±0.3* | 7.0±0.8 |
| AIRg (mU/l × min) | 483.3±31.0 | 620.4±60.3† | 394.3±74.2*† |
| MRI fat compartmentalisation | |||
| Total body (cm3) | 801.9±19.0 | 879.9±37.3 | 838.9±26.5 |
| Visceral fat depot (cm3) | 89.3±6.5 | 148.8±15.2*† | 104.8±7.9*† |
| Subcutaneous fat depot (cm3) | 74.4±6.4 | 117.5±14.4* | 103.1±14.7* |
| Lean mass (cm3) | 638.2±11.5 | 611.7±17.5* | 631.0±15.7 |
| Hemodynamics | |||
| Systolic BP (mmHg) | 82±2 | 78±3 | 78±4 |
| Diastolic BP (mmHg) | 36±2 | 38±3 | 36±3 |
| Heart rate (beats/min) | 85±2 | 87±3 | 82±3 |
| Left ventricular morphology and global function | |||
| End-diastolic volume (ml) | 100.0±3.1 | 101.5±4.4 | 111.6±4.6 |
| Mass (g) | 91.8±2.7 | 86.2±3.0† | 108.2±6.3*† |
| Concentricity (g/ml) | 0.93±0.03 | 0.86±0.03 | 0.97±0.04 |
| Ejection fraction (%) | 43±1 | 39±2 | 42±1 |
| Circumferential strain and ventricular torsion | |||
| Peak circumferential strain (%) | −11.6±0.4 | −9.5±0.7* | −10.7±0.6 |
| Peak systolic strain rate (%/s) | −91.2±2.9 | −78.7±3.7 | −81.6±2.9 |
| Peak diastolic strain rate (%/s) | 118.1±4.7 | 105.2±7.3 | 110.1±5.5 |
| Peak torsion (°/cm) | 2.0±0.1 | 1.4±0.2* | 1.7±0.1 |
| Peak twisting rate (°/s) | 51.9±2.6 | 38.8±2.7* | 42.0±4.0 |
| Peak untwisting rate (°/s) | −66.2±4.8 | −59.9±8.1 | −75.7±10.0 |
| Myocardial triacylglycerola (%fat/H2O) | 0.15±0.03 | 0.15±0.06 | 0.01±0.01* |
Data are mean ± SEM
p<0.05 for diet vs baseline, effect of condition;
p<0.05 for lard vs salmon, pairwise comparison based on mixed effects model
By MRS
To convert SI values to SI units, multiply by 0.167. To convert AIRg to SI units, multiply by 6
Fig. 3.
Effects of diet on (a) SI and (b) AIRg. Data are the percentage change (% Δ) from baseline level (BL). Horizontal black lines indicate the mean. *p<0.05 for diet vs baseline, effect of the condition; †p<0.05 for lard vs salmon oil diet, pairwise comparison based on mixed effects model
Lard feeding impairs left ventricular cardiac function
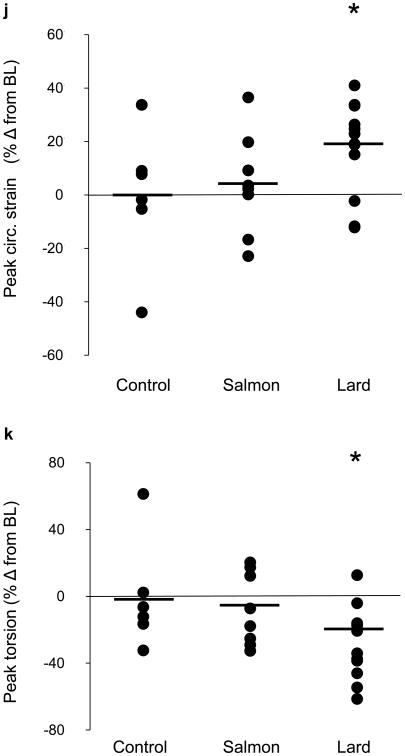
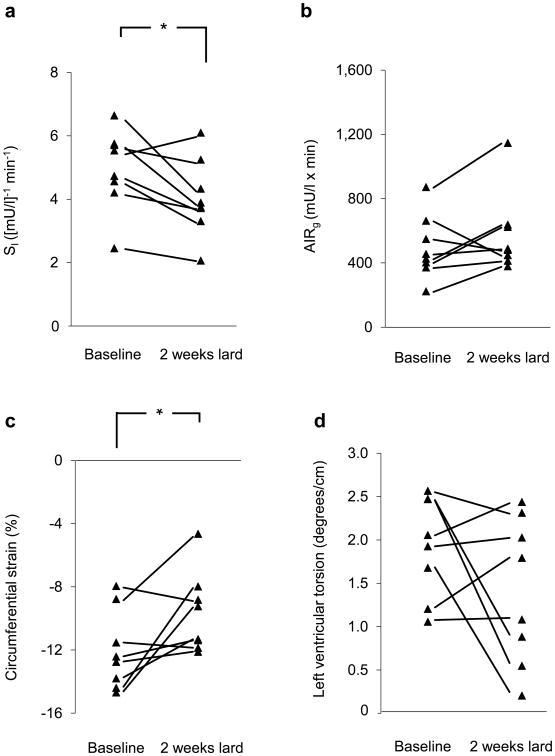
The major novel finding of this study was that acute lard feeding significantly reduced left ventricular function, as evidenced by both increased circumferential strain (i.e. worsening of tissue deformation; Fig. 4h) and impaired left ventricular torsion (Fig. 4i). These alterations in cardiometabolic function were induced rapidly and became apparent after as little as 2 weeks of lard feeding (Fig. 5a–d). The reduction in tissue deformation could not be explained by ectopic fat deposition in cardiomyocytes nor by any hemodynamic changes, as myocardial triacylglycerol content, heart rate and arterial BP remained unchanged from baseline to 6 weeks of lard feeding (Table 2). Lard feeding did not adversely affect left ventricular morphology, as we observed no changes in left ventricular end-diastolic volume, mass or concentricity (mass:volume ratio; Table 2). In contrast with lard feeding, salmon oil feeding did not induce any changes in left ventricular function (Table 2, Fig. 4). However, we did see a significant reduction in myocardial triacylglycerol levels after salmon oil feeding compared with baseline. We also observed an increase in LV mass with salmon oil feeding; however, this change was proportionate to a change in LV end-diastolic volume (p value, NS), probably reflecting healthy cardiac remodelling.
Fig. 4.
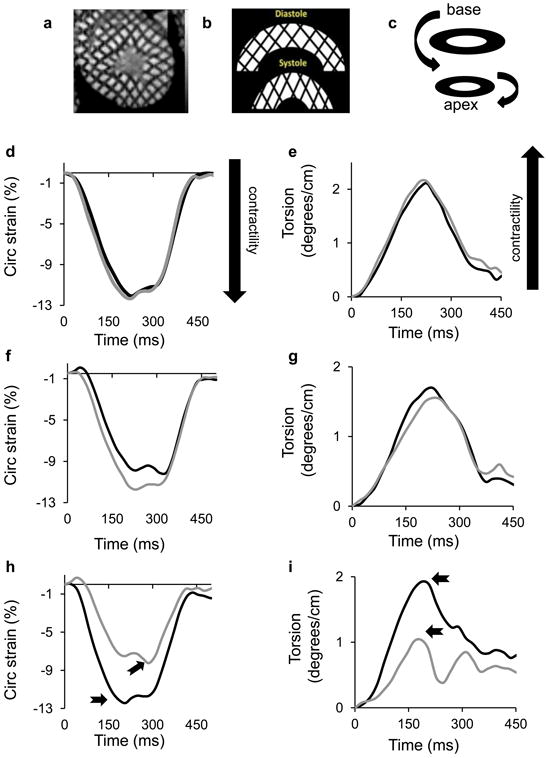
Effects of diet on cardiac function. (a) High resolution cardiac magnetic resonance tissue tagging image in the short-axis, midventricular orientation. (b) Illustrative deformation pattern of a short-axis tissue tagging image progressing from diastole to systole. Note the grid-shortening pattern in the circumferential direction representing circumferential strain. (c) Schematic representation of left ventricular torsion, illustrating basal to apical rotation. (d) Circumferential strain throughout the cardiac cycle in a representative dog at baseline (black line) and after 6 weeks of control diet feeding (grey line). (e) Left ventricular twisting pattern (torsion) throughout one cardiac cycle in a representative dog at baseline (black line) and after 6 weeks of control diet feeding (grey line). (f) Circumferential strain throughout the cardiac cycle in a representative dog at baseline (black line) and after 6 weeks of high-fat feeding with salmon oil (grey line). (g) Left ventricular twisting pattern (torsion) throughout one cardiac cycle in a representative dog at baseline (black line) and after 6 weeks of high-fat feeding with salmon oil (grey line). (h) Circumferential strain throughout the cardiac cycle in a representative dog at baseline (black line) and after 6 weeks of high-fat feeding with lard (grey line). Arrows show the peak circumferential strain. (i) Left ventricular twisting pattern (torsion) throughout one cardiac cycle in a representative dog at baseline (black line) and after 6 weeks of high-fat feeding with lard (grey line). Arrows show the peak torsion. Dot plots represent the effects of diet on (j) peak circumferential strain and (k) peak torsion. Data are reported as the percentage change (% Δ) from baseline level (BL). The horizontal black lines indicate the mean. *p<0.05 for diet vs baseline, effect of condition. Circ, circumferential
Fig. 5.
Effects of 2 weeks of lard feeding on (a) SI, (b) AIRg, (c) left ventricular circumferential strain and (d) peak left ventricular torsion in eight animals. *p<0.05 for baseline vs 2 weeks of lard feeding.
Relationship between insulin action and cardiac function
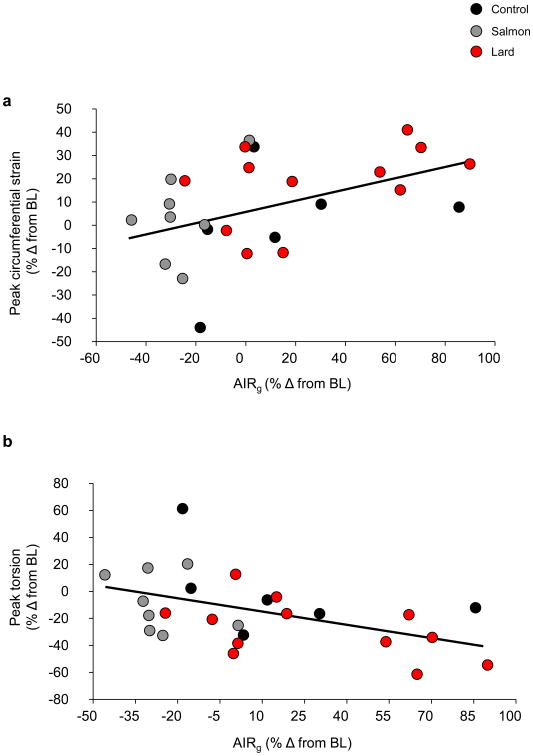
We sought to determine whether there was a relationship between left ventricular function and metabolic changes in the dietary groups. Though there was no direct relationship between cardiac function and SI, there was a significant correlation between left ventricular systolic function and AIRg, such that impairments in LV function (i.e. increased circumferential strain and reduced left ventricular torsion) were associated with increases in acute insulin secretion (LV circumferential strain: r= ±0.45, p=0.023; LV torsion: r= −0.48, p=0.013), suggesting a relationship between, or at least a common cause of, cardiac and metabolic impairments (Fig. 6a, b).
Fig. 6.
Scatter plots showing correlations between the change in AIRg and (a) the change in peak circumferential strain; r=±0.45; p=0.023 and (b) the change in peak torsion; r=−0.48; p=0.013 for all 26 animals. Black dots represent the control group, grey dots the salmon oil group and red dots the lard group. Data are reported as the percentage change (% Δ) from baseline level (BL). To convert AIRg to SI units, multiply by 6
Discussion
Left ventricular function and SI were impaired following acute feeding with a diet high in saturated fat (lard), which is our standard protocol to develop insulin resistance in this model. In sharp contrast, the impairments in SI as well as in cardiac function were completely absent when supplementing isocalorically with a diet high in PUFAs (salmon oil). These data highlight the importance of dietary composition on both metabolic and cardiac function.
The finding that lard feeding caused marked reductions in left ventricular tissue deformation but did not impair global ventricular function is striking but consistent with a growing body of literature. Kramer et al reported impairments in left ventricular strain and twist mechanics in a fat-fed rodent model of dietary obesity [18]. As in our study, these subclinical changes preceded any reduction in ejection fraction or gross morphological changes. Our data are also consistent with a growing body of cross-sectional clinical studies documenting early left ventricular strain abnormalities in the absence of global morphological or functional derangements [19–23]. We now build on these previous studies by reporting that the onset of left ventricular dysfunction is rapid—occurring as early as 2 weeks on a high-fat diet— and occurs in the face of modest, rather than drastic, weight gain. Rodent models of dietary obesity are often criticised for producing supraphysiologic changes in body weight; however, in our large animal model, the dogs gain a modest amount of weight on a high-fat diet, which more closely reflects human obesity.
The exact mechanism(s) responsible for the cardiac dysfunction observed in lard-fed dogs remains to be elucidated. Hypertension is commonly observed in obesity, and often develops in dogs fed a diet extremely high in fat [24–27]. However, in the present investigation we did not observe any changes in BP, possibly because the level of obesity achieved in our dogs was much lower than that described in studies in which hypertension was manifested [26, 27]. Cardiac steatosis is also regarded a potential mechanism for dysfunction in obesity and diabetes [28]. Recent MRI and spectroscopic analysis of rats fed a high-fat diet indicated that an accumulation of lipid in the myocardium was associated with impaired cardiac function [29]. Indeed, derangements in lipid metabolism due to accumulation of myocardial triacylglycerol can impair cardiac function and performance [28, 30–34]. However, we did not observe any increase in myocardial triacylglycerol in response to lard feeding, suggesting that its presence is not essential for impaired cardiac function in response to a high-fat diet. As discussed, the lack of steatosis may be a consequence of the modest weight gain observed in our animals compared with the more drastic obesity and ectopic lipid accumulation reported in rodent models fed a high-fat diet [34].
Hyperglycaemia and/or hyperinsulinaemia could lead to derangements in cardiac function [35]. While fasting glucose was unaffected by the lard diet, fasting insulin was increased in response to lard feeding. Although no direct relationship was found between altered cardiac function and increased fasting insulin, we cannot rule out the possibility that fasting hyperinsulinaemia plays a role in the alteration of heart muscle function. In addition, we observed a significant increase in early insulin response during the IVGTT in lard-fed animals only; this is consistent with our previous reports that hyperinsulinaemic compensation is a normal response to insulin resistance induced by a lard-fat diet [9]. Although traditionally considered a healthy response to acute insulin resistance, long-term hyperinsulinaemic compensation has been suggested to play a role in eventual beta cell failure and the loss of insulin secretory ability that occurs during diabetes disease progression [36]. Correspondingly, hyperinsulinaemia in conjunction with insulin resistance may lead to impairments in cardiac function due to reduced insulin signalling in the heart, mitochondrial function and metabolism of glucose and NEFAs [37]. More studies are required to improve our understanding of the mechanisms responsible for the present cardiac impairments.
By substituting lard for salmon oil in our traditional diet, we avoided both the impairment in SI and the derangements in cardiac tissue deformation. Insulin resistance induced by lard feeding may share a common aetiology with the cardiac dysfunction observed in the present investigation. Elevated circulating NEFAs are thought to induce cellular insulin resistance in metabolic tissues [38], even in the absence of ectopic fat. Specifically, elevated NEFAs can lead to insulin resistance in skeletal muscle by inhibiting glucose transport/phosphorylation and subsequently reducing glucose oxidation [39]. In addition, NEFA infusion induces insulin resistance and impairs mitochondrial function in the skeletal muscle of healthy human individuals [40]. Since mitochondrial fatty acid oxidation is responsible for nearly all of the total energy produced in cardiomyocytes, a reduction in mitochondrial function due to elevated NEFAs may represent a link between the metabolic and cardiac impairments observed in our present model. We previously showed that lard feeding in dogs leads to a drastic increase in circulating NEFAs levels at night [41], a phenomenon which also occurs during insulin resistance induced by sleep restriction in humans [42]. However, we did not measure nocturnal NEFAs in this study and therefore future studies are necessary to determine the role, if any, of NEFAs in the observed impairments in cardiac function. It remains important to focus on elevated nocturnal NEFA levels as a possible cause of the development of various metabolic defects, including cardiac ones.
Likewise, it is possible to speculate that salmon oil itself may be cardioprotective. Salmon oil contains nearly three times more PUFAs compared with lard, the majority of which come from the n-3 subclass that is thought to have protective properties with respect to cardiac function and outcomes [10]. Whether left ventricular function and SI would be preserved during high-fat feeding with lard plus an additional salmon oil supplementation is unknown and warrants further study.
As discussed, we observed an increase in AIRg with lard, but a surprising reduction with salmon oil. We previously suggested that the elevated nocturnal NEFA levels observed during lard feeding may play a role in signalling hyperinsulinaemic compensation during a high-fat diet [41]. In that sense, increased NEFAs may act as a double-edged sword—causing insulin resistance while signalling the appropriate compensatory beta cell response. While the salmon oil diet is not associated with insulin resistance or cardiac dysfunction, it may not provide the necessary signal to beta cells to upregulate insulin response. Future studies will be directed at identifying the signal responsible for insulin resistance, cardiac dysfunction and enhanced insulin secretion in the early stages of diet-induced obesity.
Limitations
The present investigation was limited to non-invasive measures of cardiac function. MRI is, however, the gold-standard imaging tool for both cardiac morphology and function, and tissue tagging is a superior predictor of outcomes in patients with cardiovascular disease [43, 44]. Our ability to detect subclinical changes in left ventricular function highlights the strength of this approach. Indeed, magnetic resonance tissue tagging provides an important window of opportunity to launch therapeutic interventions before a point of irreversible cardiomyopathy has been reached. The stability of the cardiac measurements in our control group provides further support for the use of this methodology, particularly under the present experimental conditions.
In the present investigation, torsion is reported as the gradient in twist between the LV base and apex, over a specific distance (i.e. between the base and apex). However, there is currently no universally accepted standard method for reporting torsional motion nor standard procedures for calculating it [45]. We chose to report torsion as twist per unit length because this takes the relative slice locations, which could have influenced our longitudinal results, into consideration. Other investigators have reported torsion as the shear angle [46] or as shear strain [47, 48], both of which are thought to more appropriately scale between hearts of different sizes (e.g. mouse vs human) and can be calculated at any point in the ventricle. These latter approaches are typically computed using locally developed software (e.g. Matlab environment) that is not accessible to the general community. In this investigation, we used a well-established, commercially available, US Food and Drug Administration approved software package to measure both circumferential strain and LV torsion, thus allowing our results to be compared with those of other studies using identical processing methods. This software does not compute shear strains and/or angles and therefore these data are not reported. Owing to technical limitations, we were unable to collect cardiac tissue samples during these studies, and thus were unable to investigate which specific molecular mechanisms such as increased inflammation, elevated reactive oxygen species or impaired mitochondrial function in cardiac tissue are responsible for the observed functional impairments after lard feeding. Future studies will need to address this specific limitation to examine the mechanisms by which lard, but not salmon oil, induces impairments in cardiac function.
In a well-established canine model of moderate obesity and insulin resistance, we have demonstrated that left ventricular function is impaired following lard feeding prior to any global cardiac function impairments. There is a growing appreciation of, as well as evidence for, subclinical heart disease and/or cardiac dysfunction in obese patients, and our findings add to the general understanding of prevalent pathology. Given the incidence of obesity and the lack of important studies investigating heart disease using cutting edge technology in both obese patients and animal models, our findings advance the understanding of the development of pre-clinical cardiac dysfunction in diet-induced obesity, and provide novel insights into the role that dietary fat composition plays on cardiac tissue deformation and metabolic outcomes.
Acknowledgments
We thank R. Thomas, Biomedical Sciences Department, Cedars-Sinai Medical Center, Los Angeles, CA, USA, for performing metabolic assays and the staff of both the Comparative Medicine Department and the Biomedical Imaging Research Institute, Cedars-Sinai Medical Center, for their assistance with and care for our animals. We also would like to thank R. B. Thompson, University of Alberta, Edmonton, AB, Canada, for the technical insight he provided on this manuscript.
Funding: This work was supported by National Institutes of Health grants DK29867 and DK27619 to RNB, a Branco Weiss Fellowship, awarded by the Society in Science and administered by the ETH Zürich to JLB, and grants from the Heart and Stroke Foundation of Canada and the Canadian Institutes for Health Research to MDN.
Abbreviations
- AIRg
Acute insulin response to glucose
- LV
Left ventricle
- MRS
Magnetic resonance spectroscopy
- PUFA
Polyunsaturated fatty acid
- SI
Insulin sensitivity
Footnotes
Some of these data were presented as a poster abstract at the American Diabetes Association 73rd Scientific Sessions, Chicago, 2013.
Duality of interest: The authors declare that there is no duality of interest associated with this manuscript.
Contribution statement: JLB, MDN, CMK, LSS and RNB contributed to the conception and design of the study; JLB, MDN, CMK, IAB, RLP, LS, EWS, DS, LSS and RNB were involved in the data collection, analysis and interpretation; and JLB, MDN and RNB were involved in drafting the manuscript. All authors reviewed/edited the manuscript and approved the final version. RNB is the guarantor of this work.
References
- 1.Go AS, Mozaffarian D, Roger VL, et al. Heart disease and stroke statistics 2014 update: a report from the American Heart Association. Circulation. 2014;129:e28–e292. doi: 10.1161/01.cir.0000441139.02102.80. [DOI] [PMC free article] [PubMed] [Google Scholar]
- 2.World Health Organization. Obesity and overweight (Fact sheet No 311) 2014. [Google Scholar]
- 3.Kim SPW. CB1 antagonism restores hepatic insulin sensitivity without normalization of adiposity in diet-induced obese dogs. American Journal of Physiology – Endocrinology and Metabolism. 2012;302:E1261–E1268. doi: 10.1152/ajpendo.00496.2011. [DOI] [PMC free article] [PubMed] [Google Scholar]
- 4.Kabir M, Stefanovski D, Hsu IR, et al. Large size cells in the visceral adipose depot predict insulin resistance in the canine model. Obesity. 2011;19:2121–2129. doi: 10.1038/oby.2011.254. [DOI] [PMC free article] [PubMed] [Google Scholar]
- 5.Stefanovski D, Richey JM, Woolcott O, et al. Consistency of the disposition index in the face of diet induced insulin resistance: potential role of FFA. PLoS ONE. 2011;6:e18134. doi: 10.1371/journal.pone.0018134. [DOI] [PMC free article] [PubMed] [Google Scholar]
- 6.Kolka CM, Harrison LN, Lottati M, Chiu JD, Kirkman EL, Bergman RN. Diet-induced obesity prevents interstitial dispersion of insulin in skeletal muscle. Diabetes. 2010;59:619–626. doi: 10.2337/db09-0839. [DOI] [PMC free article] [PubMed] [Google Scholar]
- 7.Richey JMW. Rimonabant prevents additional accumulation of visceral and subcutaneous fat during high-fat feeding in dogs. American Journal of Physiology – Endocrinology and Metabolism. 2009;296:E1311–E1318. doi: 10.1152/ajpendo.90972.2008. [DOI] [PMC free article] [PubMed] [Google Scholar]
- 8.Bergman RN. Lilly lecture 1989. Toward physiological understanding of glucose tolerance. Minimal-model approach. Diabetes. 1989;38:1512–1527. doi: 10.2337/diab.38.12.1512. [DOI] [PubMed] [Google Scholar]
- 9.Mittelman SD, Van Citters GW, Kim SP, et al. Longitudinal compensation for fat-induced insulin resistance includes reduced insulin clearance and enhanced beta-cell response. Diabetes. 2000;49:2116–2125. doi: 10.2337/diabetes.49.12.2116. [DOI] [PubMed] [Google Scholar]
- 10.Mozaffarian D, Wu JHY. Omega-3 fatty acids and cardiovascular disease: effects on risk factors, molecular pathways, and clinical events. Journal of the American College of Cardiology. 2011;58:2047–2067. doi: 10.1016/j.jacc.2011.06.063. [DOI] [PubMed] [Google Scholar]
- 11.Calder PC. (204) n-3 Fatty acids and cardiovascular disease: evidence explained and mechanisms explored. Clin Sci. 107:1–11. doi: 10.1042/CS20040119. [DOI] [PubMed] [Google Scholar]
- 12.van der Meer RW, Doornbos J, Kozerke S, et al. Metabolic imaging of myocardial triglyceride content: reproducibility of 1H MR spectroscopy with respiratory navigator gating in volunteers. Radiology. 2007;245:251–257. doi: 10.1148/radiol.2451061904. [DOI] [PubMed] [Google Scholar]
- 13.Szczepaniak LS, Dobbins RL, Metzger GJ, et al. Myocardial triglycerides and systolic function in humans: in vivo evaluation by localized proton spectroscopy and cardiac imaging. Magn Reson Med. 2003;49:417–423. doi: 10.1002/mrm.10372. [DOI] [PubMed] [Google Scholar]
- 14.Szczepaniak LS, Babcock EE, Schick F, et al. Measurement of intracellular triglyceride stores by H spectroscopy: validation in vivo. American Journal of Physiology – Endocrinology and Metabolism. 1999;276:E977–E989. doi: 10.1152/ajpendo.1999.276.5.E977. [DOI] [PubMed] [Google Scholar]
- 15.Abate N, Garg A, Coleman R, Grundy SM, Peshock RM. Prediction of total subcutaneous abdominal, intraperitoneal, and retroperitoneal adipose tissue masses in men by a single axial magnetic resonance imaging slice. The American Journal of Clinical Nutrition. 1997;65:403–408. doi: 10.1093/ajcn/65.2.403. [DOI] [PubMed] [Google Scholar]
- 16.Pacini G, Bergman RN. MINMOD: a computer program to calculate insulin sensitivity and pancreatic responsivity from the frequently sampled intravenous glucose tolerance test. Computer Methods and Programs in Biomedicine. 1986;23:113–122. doi: 10.1016/0169-2607(86)90106-9. [DOI] [PubMed] [Google Scholar]
- 17.Bergman RN, Ider YZ, Bowden CR, Cobelli C. Quantitative estimation of insulin sensitivity. American Journal of Physiology – Endocrinology and Metabolism. 1979;236:E667–E677. doi: 10.1152/ajpendo.1979.236.6.E667. [DOI] [PubMed] [Google Scholar]
- 18.Kramer S, Powell D, Haggerty C, et al. Obesity reduces left ventricular strains, torsion, and synchrony in mouse models: a cine displacement encoding with stimulated echoes (DENSE) cardiovascular magnetic resonance study. J Cardiovasc Magn Reson. 2013;15:109. doi: 10.1186/1532-429X-15-109. [DOI] [PMC free article] [PubMed] [Google Scholar]
- 19.Orhan AL, Uslu N, Dayi SU, et al. Effects of isolated obesity on left and right ventricular function: a tissue Doppler and strain rate imaging study. Echocardiography. 2010;27:236–243. doi: 10.1111/j.1540-8175.2009.01024.x. [DOI] [PubMed] [Google Scholar]
- 20.Wong CY, O'Moore-Sullivan T, Leano R, Byrne N, Beller E, Marwick TH. Alterations of left ventricular myocardial characteristics associated with obesity. Circulation. 2004;110:3081–3087. doi: 10.1161/01.CIR.0000147184.13872.0F. [DOI] [PubMed] [Google Scholar]
- 21.Barbosa MM, Beleigoli AM, de Fatima Diniz M, Freire CV, Ribeiro AL, Nunes MC. Strain imaging in morbid obesity: insights into subclinical ventricular dysfunction. Clin Cardiol. 2011;34:288–293. doi: 10.1002/clc.20907. [DOI] [PMC free article] [PubMed] [Google Scholar]
- 22.Saltijeral A, Isla LPd, Perez-Rodriguez O, et al. Early myocardial deformation changes associated to isolated obesity: a study based on 3D-wall motion tracking analysis. Obesity. 2011;19:2268–2273. doi: 10.1038/oby.2011.157. [DOI] [PubMed] [Google Scholar]
- 23.Tumuklu MM, Etikan I, Kisacik B, Kayikcioglu M. Effect of obesity on left ventricular structure and myocardial systolic function: assessment by tissue Doppler imaging and strain/strain rate imaging. Echocardiography. 2007;24:802–809. doi: 10.1111/j.1540-8175.2007.00484.x. [DOI] [PubMed] [Google Scholar]
- 24.Rocchini AP, Yang JQ, Smith MJ, Supiano MA. Serial changes in norepinephrine kinetics associated with feeding dogs a high-fat diet. The Journal of Clinical Hypertension. 2010;12:117–124. doi: 10.1111/j.1751-7176.2009.00230.x. [DOI] [PMC free article] [PubMed] [Google Scholar]
- 25.Tvarijonaviciute A, Ceron J, Holden S, et al. Obesity-related metabolic dysfunction in dogs: a comparison with human metabolic syndrome. BMC Veterinary Research. 2012;8:147. doi: 10.1186/1746-6148-8-147. [DOI] [PMC free article] [PubMed] [Google Scholar]
- 26.Lohmeier TE, Dwyer TM, Irwin ED, Rossing MA, Kieval RS. Prolonged activation of the baroreflex abolishes obesity-induced hypertension. Hypertension. 2007;49:1307–1314. doi: 10.1161/HYPERTENSIONAHA.107.087874. [DOI] [PubMed] [Google Scholar]
- 27.Rocchini AP, Yang JQ, Gokee A. Hypertension and insulin resistance are not directly related in obese dogs. Hypertension. 2004;43:1011–1016. doi: 10.1161/01.HYP.0000123073.48855.e9. [DOI] [PubMed] [Google Scholar]
- 28.McGavock JM, Lingvay I, Zib I, et al. Cardiac steatosis in diabetes mellitus: a 1H-magnetic resonance spectroscopy study. Circulation. 2007;116:1170–1175. doi: 10.1161/CIRCULATIONAHA.106.645614. [DOI] [PubMed] [Google Scholar]
- 29.Nagarajan V, Gopalan V, Kaneko M, et al. Cardiac function and lipid distribution in rats fed a high-fat diet: in vivo magnetic resonance imaging and spectroscopy. American Journal of Physiology – Heart and Circulatory Physiology. 2013;304:H1495–H1504. doi: 10.1152/ajpheart.00478.2012. [DOI] [PubMed] [Google Scholar]
- 30.Finck BN, Kelly DP. Peroxisome proliferator-activated receptor alpha (PPARalpha) signaling in the gene regulatory control of energy metabolism in the normal and diseased heart. Journal of Molecular and Cellular Cardiology. 2002;34:1249–1257. doi: 10.1006/jmcc.2002.2061. [DOI] [PubMed] [Google Scholar]
- 31.Finck BN, Han X, Courtois M, et al. A critical role for PPARalpha-mediated lipotoxicity in the pathogenesis of diabetic cardiomyopathy: modulation by dietary fat content. Proceedings of the National Academy of Sciences. 2003;100:1226–1231. doi: 10.1073/pnas.0336724100. [DOI] [PMC free article] [PubMed] [Google Scholar]
- 32.Lopaschuk GD, Kelly DP. Signalling in cardiac metabolism. Cardiovascular Research. 2008;79:205–207. doi: 10.1093/cvr/cvn134. [DOI] [PubMed] [Google Scholar]
- 33.McGavock JM, Victor RG, Unger RH, Szczepaniak LS. Adiposity of the heart*, revisited. 2006;144:517–524. doi: 10.7326/0003-4819-144-7-200604040-00011. [DOI] [PubMed] [Google Scholar]
- 34.Zhou YT, Grayburn P, Karim A, et al. Lipotoxic heart disease in obese rats: implications for human obesity. 2000;97:1784–1789. doi: 10.1073/pnas.97.4.1784. [DOI] [PMC free article] [PubMed] [Google Scholar]
- 35.Hunt SA, Abraham WT, Chin MH, et al. ACC/AHA 2005 Guideline Update for the Diagnosis and Management of Chronic Heart Failure in the Adult: A Report of the American College of Cardiology/American Heart Association Task Force on Practice Guidelines (Writing Committee to Update the 2001 Guidelines for the Evaluation and Management of Heart Failure): developed in collaboration with the American College of Chest Physicians and the International Society for Heart and Lung Transplantation: endorsed by the Heart Rhythm Society. Circulation. 2005;112:e154–e235. doi: 10.1161/CIRCULATIONAHA.105.167586. [DOI] [PubMed] [Google Scholar]
- 36.Prentki M, Nolan CJ. Islet beta cell failure in type 2 diabetes. J Clin Invest. 2006;116:1802–1812. doi: 10.1172/JCI29103. [DOI] [PMC free article] [PubMed] [Google Scholar]
- 37.Abel ED, O'Shea KM, Ramasamy R. Insulin resistance: metabolic mechanisms and consequences in the heart. Arteriosclerosis, Thrombosis, and Vascular Biology. 2012;32:2068–2076. doi: 10.1161/ATVBAHA.111.241984. [DOI] [PMC free article] [PubMed] [Google Scholar]
- 38.Boden G. Free fatty acids, insulin resistance, and type 2 diabetes mellitus. Proceedings of the Association of American Physicians. 1999;111:241–248. doi: 10.1046/j.1525-1381.1999.99220.x. [DOI] [PubMed] [Google Scholar]
- 39.Roden M, Price TB, Perseghin G, et al. Mechanism of free fatty acid-induced insulin resistance in humans. J Clin Invest. 1996;97:2859–2865. doi: 10.1172/JCI118742. [DOI] [PMC free article] [PubMed] [Google Scholar]
- 40.Chavez A, Kamath S, Jani R, et al. Effect of short-term free fatty acids elevation on mitochondrial function in skeletal muscle of healthy individuals. The Journal of Clinical Endocrinology & Metabolism. 2010;95:422–429. doi: 10.1210/jc.2009-1387. [DOI] [PMC free article] [PubMed] [Google Scholar]
- 41.Kim SP, Catalano KJ, Hsu IR, Chiu JD, Richey JM, Bergman RN. Nocturnal free fatty acids are uniquely elevated in the longitudinal development of diet-induced insulin resistance and hyperinsulinemia. American Journal of Physiology – Endocrinology And Metabolism. 2007;292:E1590–E1598. doi: 10.1152/ajpendo.00669.2006. [DOI] [PubMed] [Google Scholar]
- 42.Broussard J, Chapotot F, Abraham V, et al. Sleep restriction increases free fatty acids in healthy men. Diabetologia. 2015;58:791–798. doi: 10.1007/s00125-015-3500-4. [DOI] [PMC free article] [PubMed] [Google Scholar]
- 43.Cho GY, Marwick TH, Kim HS, Kim MK, Hong KS, Oh DJ. Global 2-dimensional strain as a new prognosticator in patients with heart failure. Journal of the American College of Cardiology. 2009;54:618–624. doi: 10.1016/j.jacc.2009.04.061. [DOI] [PubMed] [Google Scholar]
- 44.Stanton T, Leano R, Marwick TH. Prediction of all-cause mortality from global longitudinal speckle strain: comparison with ejection fraction and wall motion scoring. circulation Cardiovascular Imaging. 2009;2:356–364. doi: 10.1161/CIRCIMAGING.109.862334. [DOI] [PubMed] [Google Scholar]
- 45.Young AA, Cowan BR. Evaluation of left ventricular torsion by cardiovascular magnetic resonance. J Cardiovasc Magn Reson. 2012;14:49. doi: 10.1186/1532-429X-14-49. [DOI] [PMC free article] [PubMed] [Google Scholar]
- 46.Aelen FWL, Arts T, Sanders DGM, et al. Relation between torsion and cross-sectional area change in the human left ventricle. Journal of Biomechanics. 1997;30:207–212. doi: 10.1016/s0021-9290(96)00147-9. [DOI] [PubMed] [Google Scholar]
- 47.Thompson RB, Paterson I, Chow K, et al. Characterization of the relationship between systolic shear strain and early diastolic shear strain rates: insights into torsional recoil. American Journal of Physiology – Heart and Circulatory Physiology. 2010;299:H898–H907. doi: 10.1152/ajpheart.00353.2010. [DOI] [PMC free article] [PubMed] [Google Scholar]
- 48.Young AA, Imai H, Chang CN, Axel L. Two-dimensional left ventricular deformation during systole using magnetic resonance imaging with spatial modulation of magnetization. Circulation. 1994;89:740–752. doi: 10.1161/01.cir.89.2.740. [DOI] [PubMed] [Google Scholar]


