

Abstract
Aims: We wished to determine the efficacy of using urine as an analyte to screen for a broad range of metabolic products associated with multiple different types of inborn errors of metabolism (IEMs), using an automated mass spectrometry-based assay. Urine was compared with plasma samples from a similar cohort analyzed using the same assay. Specimens were analyzed using two different commonly utilized urine normalization methods based on creatinine and osmolality, respectively. Methods: Biochemical profiles for each sample (from both affected and unaffected subjects) were obtained using a mass spectrometry-based platform and population-based statistical analyses. Results: We identified over 1200 biochemicals from among 100 clinical urine samples and identified clear biochemical signatures for 16 of 18 IEM diseases tested. The two diseases that did not result in clear signatures, X-linked creatine transporter deficiency and ornithine transcarbamylase deficiency, were from individuals under treatment, which masked biomarker signatures. Overall the process variability and coefficient of variation for isolating and identifying biochemicals by running technical replicates of each urine sample was 10%. Conclusions: A single urine sample analyzed with our integrated metabolomic platform can identify signatures of IEMs that are traditionally identified using many different assays and multiple sample types. Creatinine and osmolality-normalized data were robust to the detection of the disorders and samples tested here.
Introduction
Metabolomics is the unbiased study of metabolic processes, in which a single sample is used to detect a broad range of small molecules (i.e., metabolites and biochemicals between 50 and 1500 Da). Through measuring these small molecules, metabolomics comprehensively characterizes phenotypes that can (Atwal et al., 2015; Miller et al., 2015) result from enzyme dysfunction either by abnormal protein structure or altered protein expression. This enzyme dysfunction results in a blocked pathway or use of an ancillary pathway, and the accumulation of metabolic intermediates or by-products in biological fluids and tissues. Diagnosis of inborn errors of metabolism (IEMs) often requires testing multiple types of samples (e.g., urine, plasma, cerebrospinal fluid), sometimes requiring multiple clinical tests. The potential power of metabolomics is in the ability to detect these intermediates and by-products from any array of conditions and biochemical families simultaneously from a single sample.
Urine contains numerous metabolites from different biochemical families with diverse chemical structures. Urine can be collected in a noninvasive manner compared to other biological sample types, and many biochemicals accumulate in urine due to their absorption from the circulation in the kidney and excretion through the urinary tract. The analysis of the quantity of these biochemicals can provide evidence for perturbations in various physiological processes and thereby serve as biomarkers of disease. Profiling of urine samples for IEMs has been characterized previously using urine organic acid tests, but these methods utilized a single chromatographic separation (Kuhara, 2005), or a relatively limited biochemical library (Janeckova et al., 2015).
IEMs are a heterogeneous set of diseases that can result in profound physiologic, cognitive, and physical abnormalities. Diagnosing these ailments in an efficient manner is paramount to timely initiating the appropriate treatment. Metabolomics offers the ability to screen a wide array of biochemicals representing diverse biochemical classes and metabolic pathways in a single sample rather than running multiple diagnostic tests that target a single class of molecules. As a result, using our metabolomic approach, many more molecules per assay are measured in a single clinical sample than can be detected using traditional IEM screens.
We recently demonstrated the utility of metabolomics to identify disease signatures in plasma for over 20 IEMs (Miller et al., 2015). Urine samples are indispensable for the diagnosis of some IEMs, for example, lysinuric protein intolerance (Sebastio et al., 2011). In addition to conditions traditionally diagnosed with urine-based assays, metabolomics of urine may also be useful to identify conditions typically detected using other sample types such as plasma, blood spots, or cerebrospinal fluid.
To evaluate the feasibility of urine metabolomics for detecting IEMs, we analyzed 100 urine samples with our metabolomic platform as follows: 34 samples from individuals diagnosed with an IEM, for which the operators were blinded to the diagnosis, and 66 samples from individuals not diagnosed with an IEM. The resulting data were analyzed for biochemical signatures of IEMs to identify the specific diseases and enriched biochemical signatures of each disease using two different normalizations, osmolality or creatinine.
Methods
Sample collection
All procedures were in accordance with the ethical standards of the U.S. Department of Health and Human Services and were approved by the Baylor College of Medicine Institutional Review Board. This study was approved with a waiver of informed consent.
Specimens used for metabolomics were collected from residual clinical samples in the clinical biochemical genetics laboratory. All plasma and urine samples were stored in −20°C for 1–9 months before metabolomic analysis. The plasma cohort was recently described (Miller et al., 2015). We examined the following 100 urine samples: 34 samples obtained from subjects diagnosed with an IEM and 66 obtained from subjects not diagnosed with an IEM. Thirty-six samples were from female patients (15 diagnosed with an IEM and 21 not diagnosed with an IEM) and 64 samples from male patients (19 diagnosed with an IEM and 45 not diagnosed with an IEM). The average age of all patients was 4.3 years of age. For females, the average age was 5.1 years with a range from 0 to 34. For males, the average age was 3.8 years with a range of 0–16 years of age.
Specimens were selected based on existing clinical samples in the Baylor College of Medicine Biochemical Genetics Laboratory with the goal of maximizing the diversity of diagnoses in our sample set. Clinical diagnoses were previously confirmed by standard clinical biochemical IEM assays and/or molecular genetic analyses in all cases; nearly all patients were undergoing clinical management for their disorder at the time of sampling. The undiagnosed/control patient specimens were obtained from retrospectively analyzed, discarded clinical samples sent for other testing performed in the biochemical genetics laboratory and were normal in that testing (e.g., amino acids, urine organic acids, disorders of creatine metabolism, and others). These samples were prescreened to remove individuals with any biochemical findings from clinical testing that were interpreted as evidence of an IEM or of total parenteral nutrition at the time of sampling.
Metabolomic analysis
Metabolomics was performed as described previously (Evans et al., 2009, 2014; Miller et al., 2015). Small molecules were extracted in an 80% methanol solution containing four standards (tridecanoic acid, 4-Cl-phenylalanine, 2-flurophenylglycine, and d6-cholesterol) used to monitor extraction efficiency. Clarified supernatant was split into five aliquots and dried under N2. For one aliquot, analytes were derivatized using bistrimethyl-silyl-trifluoroacetamide and analyzed on a Trace DSQ fast-scanning single–quadruple mass spectrometer (Thermo-Finnigan). Another aliquot was reconstituted in 50 μL of 6.5 mM ammonium bicarbonate, pH 8, for liquid chromatography mass spectrometry (LC/MS) analysis in negative ion mode (LCneg); another aliquot was reconstituted in 50 μL of 0.1% formic acid in water for LC/MS analysis in positive ion mode (LCpos); another aliquot was reconstituted in 100 μL 85/15 acetonitrile/water in 10 mM ammonium formate, pH 10.8 for LC/MS analysis in negative ion mode (LCpol) (Robinson et al., “A high pH HILIC method for high throughput profiling of polar metabolites,” unpublished data); the fifth aliquot was kept as a spare if needed. All reconstitution buffers contained instrument internal isotopic standards used to monitor performance and serve as retention time/index markers. Standards for negative ion mode analyses included d7-glucose, d3-methionine, d3-leucine, d8-phenylalanine, d5-tryptophan, Cl-phenylalanine, Br-phenylalanine, d15-octanoic acid, d19-decanoic acid, d27-tetradecanoic acid, and d35-octadecanoic acid. Standards for positive ion mode analyses included d7-glucose, fluorophenylglycine, d3-methionine, d4-tyrosine, d3-leucine, d8-phenylalanine, d5-tryptophan, d5-hippuric acid, Cl-phenylalanine, Br-phenylalanine, d5-indole acetate, d9-progesterone, and d4-dioctylpthalate. Standards for the polar method include d35-octadecanoic acid, d5-indole acetate, Br-phenylalanine, d5-tryptophan, d4-tyrosine, d3-serine, d3-aspartic acid, d7-ornithine, and d4-lysine. Internal standards were chosen based on their broad chemical structures, biological variety, and their elution spectrum on each of the arms of the platform. Chromatographic separation was completed using an ACQUITY UPLC (Waters) equipped with a Waters BEH C18 or HILIC column, followed by analysis with a Q-Exactive high-resolution mass spectrometer (Thermo-Finnigan) (Evans et al., 2014). Metabolites were identified by matching the ion chromatographic retention index, accurate mass, and mass spectral fragmentation signatures, with reference library consisting of more than 4000 entries created from authentic standard metabolites under the identical analytical procedure as the experimental samples (DeHaven et al., 2010). For ions that were not covered by the standards, additional library entries were added based on their unique ion signatures (chromatographic and mass spectral). After this, these ions could be routinely detected and quantified. These molecules are interrogated further to elucidate their structure and confirm their structures versus purified standards. At the time this article was written, none of the structurally unknown biochemicals had been elucidated.
To monitor quality control and the coefficient of variation for the performance of each batch, the median relative standard deviation was calculated for all spiked standards using median-scaled values. The median relative standard deviations were 4% and 10% for urine and plasma for the internal standards and endogenous biochemicals.
Creatinine and osmolality kit measurements
For osmolality measurement, 20 μL of urine was monitored using a Fiske 210 Osmometer (Advanced Instruments) according to the manufacturer's instructions. Osmolality was measured in a range from 0 to 2000 mOsm. If samples were outside that range, they were diluted appropriately to be in that range before data acquisition.
For targeted creatinine assessments, urine samples were acidified, and protein was precipitated using a 1% picric acid solution. Using a standard curve, creatinine quantitation was performed according to the manufacturer's instructions (Cayman Chemical Company, Cat No. 10005314).
Data analysis and statistics
Raw biochemical values from mass spectrometry analysis were first median scaled. Next, missing values were imputed with a value based on the minimum detected value, and finally, the data were natural log transformed. Imputation was based on a random uniform variable with range between 0.99 and 1.00 times the observed minimum. Urine values were normalized to creatinine or osmolality before median scaling. Z scores were calculated by comparing biochemical log-transformed, median-scaled values to the associated mean and standard deviation found in the undiagnosed population. All correlations given used the Pearson method.
Results
Overview of analyte findings of metabolomic profiling of urine samples
In total, we collected 34 specimens from patients with a confirmed IEM, as well as 66 specimens from patients tested for IEMs, but with normal results (Table 1). The sample set consisted of 18 different IEMs representing disorders of aromatic amino acid metabolism, branch-chain amino acid metabolism, fatty acid catabolism, nucleotide degradation, nitrogen homeostasis, and neurotransmitter metabolism. Disorders were represented by at least one unique sample or individual. Small-molecule analytes ranging in size from 50 to 1500 Da were extracted from urine and subjected to four separate chromatographic and mass spectrometry analyses. We detected 1201 biochemicals across these 100 urine samples (Supplementary Table S1; Supplementary Data are available online at www.liebertpub.com/gtmb).
Table 1.
List of Samples and Disorders Examined in This Study
| Disorder | No. of samples | Identifier | Age (years) | Sex |
|---|---|---|---|---|
| 3-Methylcrotonyl-CoA carboxylase deficiency | 1 | U326 | 0 | M |
| Adenosine deaminase deficiency | 1 | U314 | 1 | F |
| Adenylosuccinate lyase deficiency | 2 | U311 | 1 | M |
| U336 | 1 | F | ||
| Citrullinemia | 3 | U301 | 4 | F |
| U324 | 34 | F | ||
| U335 | 34 | F | ||
| Dihydropyrimidine dehydrogenase deficiency | 1 | U313 | 2 | F |
| Glutaric aciduria | 1 | U328 | 0 | M |
| Guanidinoacetate methyltransferase deficiency | 4 | U310 | 5 | M |
| U323 | 11 | F | ||
| U333 | 14 | F | ||
| U334 | 6 | M | ||
| Holocarboxylase deficiency | 3 | U302 | 4 | M |
| U303 | 4 | M | ||
| U305 | 5 | M | ||
| Isovaleric acidemia | 1 | U307 | 1 | M |
| Lesch-Nyhan or xanthinuria | 1 | U330 | 8 | M |
| Lysinuric protein intolerance | 1 | U325 | 6 | M |
| Medium chain acyl-CoA dehydrogenase deficiency | 2 | U304 | 2 | M |
| U306 | 1 | F | ||
| Methylmalonic acidemia | 2 | U315 | 0 | F |
| U317 | 0 | F | ||
| Molybdenum cofactor deficiency | 1 | U322 | 3 | F |
| Ornithine transcarbamylase deficiency | 2 | U318 | 1 | M |
| U327 | 1 | M | ||
| Succinic semialdehyde dehydrogenase deficiency | 1 | U316 | 2 | F |
| Tyrosinemia type 1 | 2 | U308 | 9 | F |
| U309 | 9 | F | ||
| X-linked creatine transporter deficiency | 5 | U332 | 2 | M |
| U312 | 9 | M | ||
| U329 | 7 | M | ||
| U320 | 8 | M | ||
| U319 | 2 | M | ||
| No metabolic disease | 66 | All others | Range 0–17 | 21F, 45M |
Biochemical signatures of inborn errors of metabolism
All 18 disorders included in this study have established urine-based assays that can be used to diagnose the associated inborn error of metabolism, but these methods are assays that interrogate single biochemical or chemical families (e.g., amino acids, acylcarnitines). To evaluate our metabolomic method, all samples were normalized to their respective osmolality measurements for Z-score analysis (Fig. 1 and Supplementary Table S1). As with the previous analysis of plasma samples (Miller et al., 2015), biochemicals were declared clinically relevant if their Z scores were >2 or <−2. Using this criterion, several disorders were successfully detected with our metabolomic method. Specific cases are described below.
FIG. 1.

Dot plot analysis for individual biochemicals for all subjects diagnosed with an IEM and compared to the control population. The graph to the right depicts all biochemicals detected across the study and graphed as a function of Z scores for each of the clinical samples. Each biochemical is grouped into their respective family designations (e.g., amino acids, carbohydrates, and lipids) Z scores increase for each of the biochemicals as you proceed to the right. The graphs on the left show increased resolution for the amino acid and nucleotide families, respectively, and indicate the diseases, which could be identified by increased Z scores of the respective biochemicals. Urea cycle disorders (e.g., citrullinemia) can be identified by multiple groups of biochemicals given the relationship of different biological pathways (urea cycle and pyrimidine metabolism). IEMs, inborn errors of metabolism.
Using this scoring metric, analyte perturbations within the pathway affected by the respective enzyme deficiency could be identified for several clinical cases (Fig. 2). The number of significantly altered analytes related to the diagnosis ranged from one metabolite in patients with X-linked creatine transporter deficiency, that is, increased creatine, to as many as 20 significant analyte perturbations that could be mapped directly up/downstream of the enzymatic defect in patients with holocarboxylase synthetase deficiency (Fig. 2). As with the analysis of plasma samples, groups of molecules, affected in the same pathway, revealed potential disease identities. Some individuals not diagnosed with an IEM did have molecules outside the −2 and 2 boundaries, but these did not show any specific groupings. It is also important to note that some of these molecules can be affected by processes such as circadian rhythm (Dallmann et al., 2012; Eckel-Mahan et al., 2012; Patel et al., 2012).
FIG. 2.

Biomarkers of IEMs in urine identified through global biochemical profiling. For each disease and biochemical listed, blue triangles represent each of the undiagnosed controls and red bars indicate the affected individuals diagnosed with that disease. The dotted lines represent the −2 and 2 Z-score cutoff for establishing relevance.
Not all samples from individuals diagnosed with an IEM showed elevated levels of characteristic biochemicals. For these individuals, treatment of the disease ameliorated disease signatures. For example, no subject diagnosed with ornithine transcarbamylase deficiency showed elevated levels of ornithine due to phenylbutyrate treatment. In addition, subjects diagnosed with X-linked creatine deficiency showed elevated signatures of creatine due to creatine supplementation therapy.
In addition to molecules representing disease signatures, treatment signatures could be identified in some of the subjects. For example, benzoate and 4-phenylbutyrate, compounds given to subjects with urea cycle defects to help reduce ammonia levels in the bloodstream and tissues, were detected in four samples as follows: U318, U324, U327, and U335. Samples U324 and U335 were collected from the same subject diagnosed with citrullinemia and samples U318 and U327 were collected from two subjects diagnosed with ornithine transcarbamylase deficiency. In cases where benzoate or phenylbutyrate itself did not indicate treatment, treatment could still be detected through metabolites of these two molecules. For example, U335 contained high levels of phenylacetylglutamine and other biochemicals such as hippurate that can be formed through a different mechanism linked to the metabolism of benzoate (Fig. 3). Treatment through medicinal or nutritional means will decrease molecular signatures of disease such as with the above-listed cases.
FIG. 3.
Biomarkers of citrullinemia and phenylbutyrate treatment. Biomarkers of disease (urea cycle and pyrimidine metabolism) and disease treatment (phenylbutyrate intervention) could be identified in a single urine sample.
IEM signatures in urine as a surrogate to plasma—intrasubject comparisons
Traditionally, one must use multiple sample types (e.g., analyze blood and urine) to gain confidence in identifying disease signatures. A metabolomic assay of a single sample could greatly simplify IEM screening, where multiple sample types and assays are the current diagnostic testing paradigm. The above results suggest that many IEMs typically assayed with multiple urine-based assays can be screened with the metabolomic method. We next sought to determine if we could use urine samples and this metabolomic assay to detect conditions normally screened with plasma-based assays. We compared biomarker analyses from urine and plasma samples obtained from the same subject and analyzed each sample for signatures of IEMs. Specific cases are described below.
Holocarboxylase synthetase deficiency is a disorder in which biotin-utilizing enzymes do not function properly. Four enzymes, acetyl-CoA carboxylase, methylcrotonyl-CoA carboxylase, propionyl-CoA carboxylase, and pyruvate carboxylase, require biotin for proper function. The inability of this enzyme to function properly affects fatty acid synthesis (acetyl-CoA carboxylase), branched-chain amino acid (leucine specific) catabolism (methylcrotonyl-CoA carboxylase), odd-chain fatty acid and sterol metabolism (propionyl-CoA carboxylase), and gluconeogenesis (pyruvate carboxylase). One subject diagnosed with holocarboxylase synthetase deficiency had a plasma sample and two urine samples analyzed through this analysis. The plasma sample contained eight molecules with Z scores >2 or <−2 consistent with the pathway perturbations associated with the genetic defect. The urine samples from that same individual identified 20 molecules (Table 2) associated with the defect. A potential explanation for the difference in biochemical signatures between the samples is that urine was acquired for the initial diagnosis, while the plasma sample was collected from the subject after the initiation of treatment, which likely dampened some signature biochemicals of the disease. In addition, a concentration effect could result in the accumulation of biochemicals/increased biochemical levels in urine versus plasma.
Table 2.
Comparison of Biomarkers of Holocarboxylase Deficiency from Urine (Osmolality Normalized) and Plasma Samples from the Same Subject
| Biomarker | Urine Z score (U302) | Plasma Z score (158) |
|---|---|---|
| β-Hydroxyisovalerate | 7.4a | 5.6a |
| 3-Methylcrotonylglycine | 6.3a | NS |
| 3-Hydroxypropanoate | 5.5a | 5.3a |
| β-Hydroxyisovaleroylcarnitine | 5.5a | 6.8a |
| 2-Methylcitrate | 5.3a | NS |
| Propionylglycine | 5.1a | 5.6a |
| 3-Hydroxyisobutyrate | 4.4a | ND |
| Lactate | 3.9a | NS |
| α-Hydroxyisovalerylcarnitine | 3.1a | 3a |
| 3-Hydroxy-2-ethylpropionate | 3.0a | NS |
| Isobutyrylglycine | 3.0a | NS |
| 3-Methyl-2-oxobutyrate | 2.9a | NS |
| 3-Methyl-2-oxovalerate | 2.7a | NS |
| 3-Hydroxy-2-methylbutyrate | 2.5a | ND |
| 4-Methyl-2-oxopentanoate | 2.5a | NS |
| Tiglylglycine | 2.2a | 1.6b |
| Isovalerylglycine | 2.2a | NS |
| α-Hydroxyisovalerate | 2.1a | 1.9b |
| 2-Hydroxy-3-methylvalerate | 2.0a | NS |
| Tiglylcarnitine | 1.9b | NS |
| α-Hydroxyisocaproate | −1.5c | NS |
| Succinylcarnitine | −1.8c | −3.1d |
| Malonylcarnitine | −4.0d | −2.4d |
| Propionylcarnitine | NS | 5.6a |
| Isovalerylcarnitine | NS | NS |
| Hydroxybutyrylcarnitine | NS | NS |
| Succinate | NS | NS |
| 2-Methylmalonylcarnitine | NS | −1.7c |
NS, Biochemical was detected in that specific matrix but was not statistically significant, Z score was −1.5 < Z < 1.5.
Z score ≥2.
1.5 < Z < 2.
−2 < Z < −1.5.
Z ≤ −2.
ND, not detected.
Another subject was diagnosed with lysinuric protein intolerance. Lysinuric protein intolerance is a disorder that causes an inability to transport lysine, arginine, and ornithine, thereby affecting their metabolism. Cells and tissues accumulate these molecules and are unable to effectively degrade them for energy production. Analyses of both plasma and urine identified eleven total molecules with significantly altered levels consistent with the affected genetic mutation (Table 3). In urine, three of these molecules showed increased levels compared to unaffected individuals, whereas four analytes showed decreased levels. In plasma, three molecules showed increased levels and five showed decreased levels. N6-acetyllysine was the top biomarker for urine and plasma. Several metabolic products of lysine metabolism, including N6-trimethyllysine, 5-(galactosylhydroxy)-l-lysine, and glutarylcarnitine, showed the largest decreases in urine, exemplifying the inability of the patient to metabolize lysine.
Table 3.
Comparison of Biomarkers of Lysinuric Protein Intolerance from Urine (Osmolality Normalized) and Plasma Samples from the Same Subject
| Biomarker | Urine Z score (U325) | Plasma Z score (135190) |
|---|---|---|
| N6-acetyllysine | 2.90a | 3.76a |
| N2-acetyllysine | 2.62a | ND |
| 2-Aminoheptanoate | 2.23a | 1.82b |
| 5-(Galactosylhydroxy)-l-lysine | −1.70c | ND |
| 3-Methylglutarylcarnitine | −1.90c | NS |
| N6-trimethyllysine | −2.85d | −3.09d |
| Glutarylcarnitine | −3.86d | −4.96d |
| Glutamine | NS | 2.91a |
| Arginine | NS | −3.47d |
| Ornithine | NS | −3.83d |
| Lysine | NS | −5.68d |
NS, Biochemical was detected in that specific matrix but was not statistically significant, Z score was −1.5 < Z < 1.5.
Z score ≥2.
1.5 < Z < 2.
−2 < Z < −1.5.
Z ≤ −2.
ND, not detected.
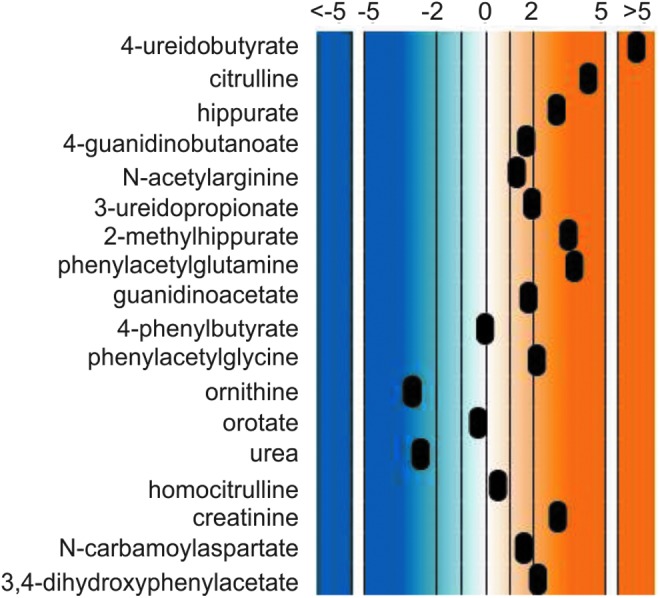
Another subject, diagnosed with citrullinemia, showed several changes associated with urea cycle metabolism, as well as pyrimidine biosynthesis and degradation (Fig. 4). The urea cycle and pyrimidine metabolism are linked through carbamoyl phosphate metabolism and genetic alterations in argininosuccinate synthase that result in citrullinemia and cause accumulation of metabolites linked to pyrimidine metabolism. N-carbamoylaspartate was not detected in plasma, but had a significantly elevated Z score in urine. For this specific sample comparison, the urine samples showed more significant changes in molecules associated with the urea cycle, whereas the plasma samples showed more significant changes in molecules associated with pyrimidine metabolism.
FIG. 4.

Biochemical map showing metabolic perturbations in urine from a patient diagnosed with citrullinemia. Red circles indicate biochemicals with positive Z scores and blue circles indicate biochemicals with negative Z scores. The diameters of the circles indicate the magnitude of the Z score. Pink circles represent biochemicals with Z score of 1.5 ≤ Z < 2.0, and light blue circles represent biochemicals with −2.0 < Z ≤ −1.5. Black circles represent other biochemicals in the pathway detected in the urine sample, but had Z scores of −1.5 < Z < 1.5. Gray circles represent biochemicals in the library but not detected. White circles are biochemicals not detected on the mass spectrometry platform.
Table 4 outlines potential biomarkers for citrullinemia in the urea cycle and pyrimidine metabolism, as well as markers associated with the treatment of the disease. Analysis of the urine sample identified 17 significantly altered analytes (14 increased, three decreased) and 16 analytes (all increased) in plasma. This subject was treated with phenylbutyrate and molecules linked to phenylbutyrate metabolism, including several that could be linked to gut microbiota metabolism, and showed increased levels due to the treatment.
Table 4.
Comparison of Biomarkers of Citrullinemia from Urine (Osmolality Normalized) and Plasma Samples from the Same Subject
| Pathway | Biomarker | Urine Z score (U324) | Plasma Z score (132845) |
|---|---|---|---|
| Urea cycle | Citrulline | 4.84a | 10.5a |
| N-acetylcitrulline | 7.43a | 6.11a | |
| Homocitrulline | 1.93a | 3.77a | |
| 4-Guanidinobutanoate | −2.01d | 2.35a | |
| N-acetylarginine | −1.53c | NS | |
| Guanidinoacetate | −3.47d | NS | |
| Ornithine | NS | NS | |
| Urea | −7.34d | NS | |
| Creatinine | 3.43a | NS | |
| N-carbamoylaspartate | 2.03a | ND | |
| Pyrimidine Metabolism | 3-Ureidopropionate | 3.89a | 6.84a |
| 4-Ureidobutyrate | 9.98a | 4.40a | |
| Orotate | 2.67a | 3.28a | |
| Uracil | 2.40a | 1.95b | |
| Uridine | NS | 4.44a | |
| 5,6-Dihydrouracil | 3.63a | 3.79a | |
| Orotidine | NS | 2.53a | |
| Phenylbutyrate treatment and phenylbutyrate metabolism | 4-Phenylbutyrate | 1,796,820a | 1,439,554a |
| 2-Phenylglycine | 1.83b | 7.64a | |
| Phenylacetate | ND | 6.16a | |
| 2-Hydroxyphenylacetate | NS | 2.01a | |
| 3-Hydroxyphenylacetate | NS | ND | |
| 4-Hydroxyphenylacetate | NS | NS | |
| 3,4-Dihydroxyphenylacetate | 2.91a | ND | |
| Phenylacetylglycine | 2.09a | 2.34a | |
| Phenylacetylglutamine | 3.15a | 5.51a | |
| Hippurate | −1.50c | NS | |
| 2-Methylhippurate | NS | ND | |
| 2-Hydroxyhippurate | ND | NS | |
| 4-Hydroxyhippurate | NS | NS |
NS, biochemical was detected in that specific matrix but was not statistically significant, Z score was −1.5 < Z < 1.5.
Z score ≥2.
1.5 < Z < 2.
−2 < Z < −1.5.
Z ≤ −2.
ND, not detected.
Normalization of urine samples for clinical analysis: creatinine and osmolality
To control for unwanted sources of variability, urine samples can be normalized by different factors, including creatinine or osmolality. Normalization can occur through preprocessing (diluted before data acquisition) or postprocessing (data normalized after data acquisition). Targeted analytical profiling and global profiling of creatinine showed a high level of correlation (Fig. 5A). Serial dilution of three independent urine samples resulted in the loss of detection of some biochemicals, but only at very large dilutions of the samples (Fig. 5B).
FIG. 5.

Creatinine and osmolality normalization of clinical urine samples. (A) Creatinine measurements obtained through global biochemical profiling and targeted assay analysis are plotted. (B) Urine from three donors was serially diluted at least four times and data obtained through global biochemical profiling. AU, arbitrary units.
To compare creatinine normalization and osmolality normalization, for urine samples, the data from the 100 urine samples described previously were adjusted for either parameter, and the Z scores for several biomarkers were compared. The comparison of osmolality-normalized data and creatinine data analyses revealed a high degree of agreement between the methods (Supplementary Table S3). Of the 1201 biochemicals detected in urine, 766 (63.7% of the total biochemicals) had correlation values of r > 0.9 when comparing the Z scores obtained from creatinine and osmolality-normalized data, 1000 (83.3%) had correlation values of r > 0.8, and 1114 (92.8%) had correlation values of r > 0.70. The molecules that showed correlation values of r < 0.7 did not represent any particular single structural class or biological family. 3-Hydroxymandelate and cadaverine, the two molecules with the lowest correlation levels, were present in 2 of the 100 samples. Several other molecules with r < 0.50 were detected in all or nearly all of the 100 samples. This agreement between the two analyses shows that while the normalization of the data may affect a small number of specific biochemicals, this normalization will not influence the majority of detected biomarkers and ability to identify IEMs through biochemical pathway analysis.
The osmolality-normalized and creatinine-normalized Z scores for all biochemicals detected in the study for each subject are outlined in Supplementary Tables S2 and S3, respectively. Examination of either set of analyses revealed consistent biomarkers of disease for the respective diagnoses, that is, the normalization did not affect the identification of any biomarker or group of markers for a given diagnosis. The exceptions to this were those disorders that affect urea cycle metabolism, which can affect creatinine formation and metabolism.
Discussion
The ability to analyze urine as a front-line specimen for screening of IEMs through metabolomics would provide a valuable means to efficiently, accurately, and rapidly identify and manage many IEMs (Campeau et al., 2008). In the cases analyzed in this study, urine and plasma biochemical profiles show good concordance. Recently, metabolomics showed high accuracy in identifying IEMs in plasma (Miller et al., 2015). In this study, we assessed the feasibility of using metabolomic evaluation of urine to assess IEMs that are typically screened using urine, as well as for those IEMs for which plasma-based screens are used clinically. Specifically, biochemical alterations detected in urine may be analyzed alongside plasma biochemical changes to get a more robust understanding of metabolic perturbations under diseased states.
The excretory system accumulates waste products, dead-end products of metabolism, and excess molecules from the circulation and governs the drive to keep plasma in a more homeostatically balanced state, which may contribute to differential biomarker availability (Tables 2–4). Hence, it seemed plausible that our sensitive metabolomic method would be able to detect disease signatures in the urine—even for conditions where the current diagnostic sample is plasma. A possible exception may be with the lipid family, as it showed the largest disparity between the two matrices. Plasma contained 292 molecules in the lipid superfamily, whereas urine contained 112 in the lipid superfamily (Supplementary Fig. S1 and Supplementary Table S4). Plasma contained several more free fatty acids, sphingomyelin-related metabolites (e.g., sphinganine, sphingosine, and sphingosine 1-phosphate), and lysolipids which, under normal physiologic conditions, are not absorbed and excreted through the urinary tract. Therefore, the use of urine to detect conditions where these metabolites are the only signatures of diseases may be limited. Another notable difference with urine was that it contained several methylated, sulfated, and acetylated compounds that are excreted through the urinary tract through specific recognition of transporters in the kidney.
One important consideration of the use of urine as a surrogate sample type for plasma is the well-established practice of normalization. There is rich debate about the appropriate method for normalization of urine samples (Morgenstern et al., 2003; Dieterle et al., 2006; Warrack et al., 2009; Godevithanage et al., 2010; Wagner et al., 2010; Ryan et al., 2011; Schrier, 2011; Veselkov et al., 2011; Kohl et al., 2012; Armstrong et al., 2013; Edmands et al., 2014; Curcio et al., 2015; Souza et al., 2015). Normalizing accounts for different variables such as hydration status of samples was by scaling the spectral data to the same virtual overall concentration. Urine creatinine is the most commonly used metric for normalizing data collected from urine samples. In this study, normalizing samples to creatinine or osmolality revealed very consistent results through biomarker identification (Supplementary Tables S1 and S2). We suspect that this lack of sensitivity to the normalization process is likely due to the large effect sizes observed with these conditions. This apparent robustness may be particularly important in IEMs where several disorders can impact creatinine metabolism.
Expanding the clinical validity and utility of urine-based metabolomics could greatly enhance the identification and management of IEMs for a number of reasons. Metabolomics can be utilized as a broad-based screening tool in association with other standard diagnostic tools to confirm diagnoses. Multiple assays and sample types can potentially be “collapsed” into a single sample and the single metabolomic “assay” (Fig. 6) as a first pass point for clinicians to reflex tests using these standard diagnostic assays. The sensitivity and breadth of the metabolomic method (as shown in this study with urine being a sufficient surrogate for plasma) may also circumvent the need to obtain invasive sample types such as cerebrospinal fluid (Atwal et al., 2015; Miller et al., 2015). This methodology will identify molecules between 50 and 1500 Da in molecular weight, and limitations for this method include the direct identification of larger molecules such as proteins, trace metal analysis, or cellular analysis. However, with these clinical measurements, the biochemical profile can create a more comprehensive view of a patient's health. The samples examined in this study were not matched plasma and urine samples. Utilizing matched plasma and urine samples, those obtained during the same clinical visit, for analysis may provide greater resolution into biomarkers of disease and treatment of IEMs. To this end, future work will examine additional diseases as well as monitoring treatment of those diseases through medicinal and nutritional intervention.
FIG. 6.

Metabolomics offers the potential to efficiently screen biological matrices such as urine to identify disease and treatment signatures and to refine further analyses to those tests necessary for making definitive diagnoses. (A) The traditional approach starts with a range of potential conditions. To arrive at a diagnosis, many different sample types and tests may be required. (B) The metabolomic method—as demonstrated in this work—offers the potential to screen a single sample type with the metabolomic method to derive the salient disease signature from multiple biochemicals.
In conclusion, this analysis combined with that of Miller et al. (2015) has identified biochemical signatures for over 30 IEMs and may support the use of metabolomics as a tool to screen and identify disease signatures of IEMs in clinical samples. In addition to its rich biochemical profile, urine is a biological matrix that can be obtained through noninvasive means compared to plasma, serum, and cerebrospinal fluid. Furthermore, it also supports the possibility of using urine more universally for screening—even for conditions typically assessed with other sample types. Thus, metabolomics may offer a route to collapse dozens of assays and multiple sample types into a metabolomic screen of a single urine sample.
Supplementary Material
Acknowledgment
This work was funded, in part, by the T32 GM07526-37 Medical Genetics Research Fellowship Program (M.J.M.).
Author Disclosure Statement
A.K., A.E., J.W., K.B., and L.M. are employees of Metabolon, Inc. and, as such, have affiliations with or financial involvement with Metabolon, Inc. The authors have no other relevant affiliations or financial involvement with any organization or entity with a financial interest in or financial conflict with the subject matter or materials discussed in the article apart from those disclosed. M.J.M., V.R.S., Q.S., and S.H.E. are employees of Baylor College of Medicine, which has a partnership with Baylor Miraca Genetics Laboratories that derives revenue from clinical testing.
References
- Armstrong LE, Johnson EC, Munoz CX, et al. (2013) Evaluation of Uosm:Posm ratio as a hydration biomarker in free-living, healthy young women. Eur J Clin Nutr 67:934–938 [DOI] [PubMed] [Google Scholar]
- Atwal PS, Donti TR, Cardon AL, et al. (2015) Aromatic l-amino acid decarboxylase deficiency diagnosed by clinical metabolomic profiling of plasma. Mol Genet Metab 115:91–94 [DOI] [PubMed] [Google Scholar]
- Campeau PM, Scriver CR, Mitchell JJ. (2008) A 25-year longitudinal analysis of treatment efficacy in inborn errors of metabolism. Mol Genet Metab 95:11–16 [DOI] [PubMed] [Google Scholar]
- Curcio R, Stettler H, Suter PM, et al. (2015) Reference intervals for 24 laboratory parameters determined in 24-hour urine collections. Clin Chem Lab Med 54:105–116 [DOI] [PubMed] [Google Scholar]
- Dallmann R, Viola AU, Tarokh L, et al. (2012) The human circadian metabolome. Proc Natl Acad Sci U S A 109:2625–2629 [DOI] [PMC free article] [PubMed] [Google Scholar]
- DeHaven CD, Evans AM, Dai H, et al. (2010) Organization of GC/MS and LC/MS metabolomics data into chemical libraries. J Cheminformatics 2:9–21 [DOI] [PMC free article] [PubMed] [Google Scholar]
- Dieterle F, Ross A, Schlotterbeck G, et al. (2006) Probabilistic quotient normalization as robust method to account for dilution of complex biological mixtures. Application in 1H NMR metabonomics. Anal Chem 78:4281–4290 [DOI] [PubMed] [Google Scholar]
- Eckel-Mahan KL, Patel VR, Mohney RP, et al. (2012) Coordination of the transcriptome and metabolome by the circadian clock. Proc Natl Acad Sci U S A 109:5541–5546 [DOI] [PMC free article] [PubMed] [Google Scholar]
- Edmands WM, Ferrari P, Scalbert A. (2014) Normalization to specific gravity prior to analysis improves information recovery from high resolution mass spectrometry metabolomic profiles of human urine. Anal Chem 86:10925–10931 [DOI] [PubMed] [Google Scholar]
- Evans AM, Bridgewater BR, Liu Q, et al. (2014) High resolution mass spectrometry improves data quantity and quality as compared to unit mass resolution mass spectrometry in high-throughput profiling metabolomics. Metabolomics 4:11000132 [Google Scholar]
- Evans AM, DeHaven CD, Barrett T, et al. (2009) Integrated, nontargeted ultrahigh performance liquid chromatography/electrospray ionization tandem mass spectrometry platform for the identification and relative quantificationof the small-molecule complement of biological systems. Anal Chem 81:6656–6667 [DOI] [PubMed] [Google Scholar]
- Godevithanage S, Kanankearachchi PP, Dissanayake MP, et al. (2010) Spot urine osmolality/creatinine ratio in healthy humans. Kidney Blood Press Res 33:291–296 [DOI] [PubMed] [Google Scholar]
- Janeckova H, Kalivodova A, Najdekr L, et al. (2015) Untargeted metabolomic analysis of urine samples in the diagnosis of some inherited metabolic disorders. Biomed Pap Med Fac Univ Palacky Olomouc Czech Repub 159:582–585 [DOI] [PubMed] [Google Scholar]
- Kohl SM, Klein MS, Hochrein J, et al. (2012) State-of-the art data normalization methods improve NMR-based metabolomic analysis. Metabolomics 8:146–160 [DOI] [PMC free article] [PubMed] [Google Scholar]
- Kuhara T. (2005) Gas chromatographic-mass spectrometric urinary metabolome analysis to study mutations of inborn errors of metabolism. Mass Spectrom Rev 24:814–827 [DOI] [PubMed] [Google Scholar]
- Miller MJ, Kennedy AD, Eckhart AD, et al. (2015) Untargeted metabolomic analysis for the screening of inborn errors of metabolism. J Inherit Metab Dis 38:1029–1039 [DOI] [PMC free article] [PubMed] [Google Scholar]
- Morgenstern BZ, Butani L, Wollan P, et al. (2003) Validity of protein-osmolality versus protein-creatinine ratios in the estimation of quantitative proteinuria from random samples of urine in children. Am J Kidney Dis 41:760–766 [DOI] [PubMed] [Google Scholar]
- Patel VR, Eckel-Mahan K, Sassone-Corsi P, et al. (2012) CircadiOmics: integrating circadian genomics, transcriptomics, proteomics and metabolomics. Nat Methods 9:772–773 [DOI] [PubMed] [Google Scholar]
- Ryan D, Robards K, Prenzler PD, et al. (2011) Recent and potential developments in the analysis of urine: a review. Anal Chim Acta 684:8–20 [DOI] [PubMed] [Google Scholar]
- Schrier RW. (2011) Diagnostic value of urinary sodium, chloride, urea, and flow. J Am Soc Nephrol 22:1610–1613 [DOI] [PMC free article] [PubMed] [Google Scholar]
- Sebastio G, Sperandeo MP, Andria G. (2011) Lysinuric protein intolerance: reviewing concepts on a multisystem disease. Am J Med Genet C Semin Med Genet 157C:54–62 [DOI] [PubMed] [Google Scholar]
- Souza AC, Zatz R, de Oliveira RB, et al. (2015) Is urinary density an adequate predictor of urinary osmolality? BMC Nephrol 16:46. [DOI] [PMC free article] [PubMed] [Google Scholar]
- Veselkov KA, Vingara LK, Masson P, et al. (2011) Optimized preprocessing of ultra-performance liquid chromatography/mass spectrometry urinary metabolic profiles for improved information recovery. Anal Chem 83:5864–5872 [DOI] [PubMed] [Google Scholar]
- Wagner BD, Accurso FJ, Laguna TA. (2010) The applicability of urinary creatinine as a method of specimen normalization in the cystic fibrosis population. J Cyst Fibros 9:212–216 [DOI] [PMC free article] [PubMed] [Google Scholar]
- Warrack BM, Hnatyshyn S, Ott KH, et al. (2009) Normalization strategies for metabonomic analysis of urine samples. J Chromatogr B Analyt Technol Biomed Life Sci 877:547–552 [DOI] [PubMed] [Google Scholar]
Associated Data
This section collects any data citations, data availability statements, or supplementary materials included in this article.