

Abstract
The nucleus contains the genetic blueprint of the cell and myriad interactions within this subcellular structure are required for gene regulation. In the current scientific era, characterization of these gene regulatory networks through biochemical techniques coupled with systems-wide “omic” approaches have become commonplace. However, these strategies are limited because they represent a mere snapshot of the cellular state. To obtain a holistic understanding of nuclear dynamics, relevant molecules must be studied in their native contexts in living systems. Live-cell imaging approaches are capable of providing quantitative assessment of the dynamics of gene regulatory interactions within the nucleus. We survey recent insights into what live-cell imaging approaches have provided the field of nuclear dynamics. In this review, we focus on interactions of DNA with other DNA loci, proteins, RNA, and the nuclear envelope.
Graphical Abstract
Introduction
Our DNA, the genetic blueprint of a cell, is housed within the nucleus. As such, the processes that take place within this cellular sub-structure ensure proper interpretation and regulation of the DNA code. This regulation is critical for controlling various aspects of biology including organismal development, cellular differentiation, proliferation, and maintenance. In recent decades, biochemical techniques have permitted dissection of the molecular and cellular interactions driving DNA regulation. However, often times these preparations require cellular fixation or destruction for observation and quantification. Recently, technical advancements in next-generation sequencing and mass spectrometry have enabled characterization of systems-wide “omic” level analyses of gene expression and translation, respectively. While these approaches are truly powerful in providing a comprehensive view of gene regulatory networks, they are limited in that they still only provide an isolated snapshot of gene regulation.
In our current era of scientific inquiry, we are capable of rapidly obtaining lists of important factors that drive a particular biological process. However, to truly gain a holistic understanding of function, these individual components should ideally be studied in the context of their native environments. Recent advancements in live-cell imaging approaches have paved a path to characterize biology in a dynamic and quantitative fashion through time and space. Our ability to make quantitative behavioral measurements of the nuclear components driving gene regulation synergizes perfectly with the development of computational models to describe biological dynamics. Ultimately, biochemical assays and fixed-cell analyses to study genomic regulation at particular time points have guided our current understanding of nuclear interactions. However, we can now use various modes of microscopy and fluorescent protein labeling to observe a wide range of nuclear dynamics in live cells or tissues in real time. As the field advances further, scientists will develop cutting edge strategies to observe nuclear interactions directly in living organisms to understand how disruptions in normal biology to explain certain disease states.
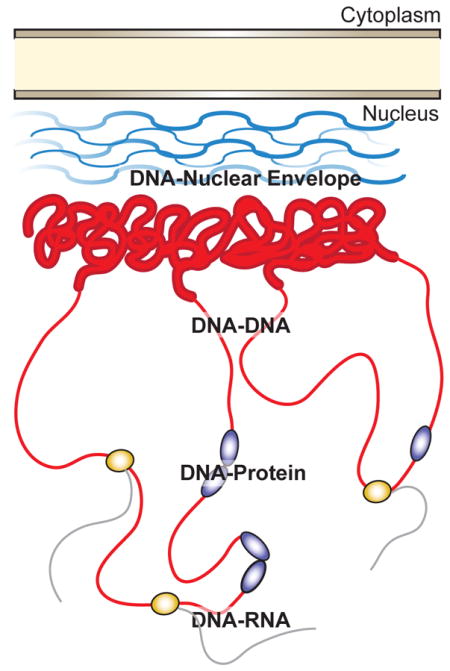
In this review, we will survey recent biological insights gained into the dynamics of nuclear processes through the application of live-imaging strategies. More specifically, we will focus on DNA as the central molecule and then explore its interactions with other DNA loci, regulatory proteins, RNA, and the nuclear envelope (Figure 1).
Figure 1. Overview of nuclear interactions surveyed through the application of live imaging approaches.

Transcriptionally silenced heterochromatic DNA (thick red lines) is associated with the nuclear envelope through interactions with the nuclear lamina (blue lines). Transcriptionally active DNA (thin red lines) is dynamically regulated through complex three-dimensional organization and through interactions with transcriptional regulators (purple circles). Actively transcribed regions permit binding of RNA polymerase (orange circle) and production of messenger RNA (black lines).
DNA-DNA interactions
Within the nucleus, genetic material is organized dynamically in a manner reflecting the needs of the cell. Actively transcribed regions of DNA, known as euchromatin, adopt an open conformation allowing for binding of transcriptional modulators [1]. Conversely, silenced inactive regions of the genome, known as heterochromatin, are more closely associated with nucleosome occupancy and higher order structure, rendering the genome inaccessible [2]. Gene regulatory elements called enhancers can be located thousands of kilobases away from their target promoters and can influence transcription through DNA folding and three-dimensional organization [3]. Additionally, during mitosis, DNA is organized into tightly packaged chromosomes to promote the fidelity of its replication and segregation into two daughter cells [4]. Characterizing how DNA fluidly transitions between these states is fundamental to understanding gene regulation and cellular physiology.
Our understanding of DNA dynamics has traditionally been inferred from fixed cell analyses. Techniques such as fluorescent in situ hybridization (FISH) [5] and chromosome conformation capture (3C) [6] have provided invaluable insights into the localization and interactions of different genomic loci, respectively. However, the obligate fixation step for these approaches limits one to defined time points. Live imaging approaches have been employed to visualize the dynamics of specific genomic elements directly in live cells across time. In this section we will review recent insights that have been made through assessment of various genomic loci interactions within the nucleus.
One strategy to visualize distinct genomic elements in living cells relies on indirectly observing their localization using fluorescently-labeled proteins that specifically recognize these loci [7]. This approach has recently been used to examine the dynamics of telomeres, structures essential for protecting chromosomal ends consisting of DNA repeats bound by several proteins. By generating GFP-fusions of two major telomeric binding proteins, TRF1 and TRF2, Wang et al. visualized the movement of telomeric repeats in a human bladder carcinoma cell line [8]. Time-lapse imaging revealed that the motility of individual telomeres within the same nucleus was extremely heterogenous compared to that of internal heterochromatic regions. Shorter telomeres exhibited increased motion and required energy from ATP hydrolysis. Interestingly, extending telomere length through overexpression of telomerase decreased telomere motility and rendered motion more homogenous. Furthermore, cells overexpressing a mutant telomerase leading to deprotection of telomere ends without changes in length resulted in increased motion while DNA damage, induced by treatment with methyl methanesulfonate, did not alter telomere motion. These data suggested a model where short, uncapped telomeres demonstrated increased motility and greater speed, which enabled them to sample more volume in the nucleus. As telomere shortening has been linked to genomic instability, understanding these rapid changes in telomere dynamics may provide additional insights into the progression of cancer [9].
A major drawback of strategies relying on overexpression of DNA binding protein fusions to visualize genomic loci is that care must be taken to ensure that ectopic levels of protein expression do not interfere with the biology studied, especially if the proteins expressed have biological activity. Even if knock-in strategies are employed, validation of fusion protein function is still necessary. Additionally, strategies relying on DNA binding protein localization as a readout of genomic position are limited in that the flexibility to target any genomic sequence is lacking. Circumventing some of these limitations, the Type II CRISPR (clustered regularly interspaced short palindromic repeats) system derived from Streptococcus pyogenes [10], has recently been repurposed for live-imaging of genomic loci. In this system, a mutant Cas9 protein lacking nuclease activity (dCas9) is fused to GFP and targeted to specific genomic loci by a small guide RNA (sgRNA) and a protospacer adjacent motif (PAM) [11]. The power of this system is the flexibility to theoretically target any genomic loci using specifically designed sgRNAs. Using sgRNAs targeting 5 to 15 kilobase pair stretches of the TTAGGG repeats found within telomeres, Chen et al. validated the use of this system and visualized telomere length and number in live human cells at efficiencies comparable with peptide nucleic acid (PNA) FISH [12]. Using this strategy to visualize telomere dynamics, Chen et al. also corroborated the finding that longer telomeres exhibited slower movement.
To illustrate the adaptability of the CRISPR system to image protein coding regions of the genome, Chen et al. next designed sgRNAs allowing recruitment of dCas9-GFP to both repetitive and non-repetitive elements of the MUC4 gene, which encodes a glycoprotein required to protect mucus in diverse epithelial tissues [12]. Time-lapse imaging revealed that MUC4 loci exhibited motion behaviors similar to telomeres where confined movement was observed at short (< 5 s) time scales while macroscopic movements were observed over longer durations. Furthermore, the dynamics of replicated MUC4 loci were observed during late S and G2 phases, indicating that paired MUC4 loci on sister chromatids often reached over 1 μm in distance which remained relatively constant over several hours. This suggests that these elements are stably dispersed along the genomic DNA. Finally, the reorganization of MUC4 loci was tracked during cell division. During prophase and metaphase, MUC4 puncta were localized near the ends of the chromosomes reflecting their genomic positions near telomeres. Separation of MUC4 puncta initiated at anaphase and mirrored each other at both poles of the microtubule spindle. Interestingly, this mirror-image relationship was maintained after daughter cell formation, illustrating the power of this technology to further study questions in mirror symmetry of initial chromosome packaging in individual daughter cells.
Recently, an orthogonal Cas9 system was developed from Staphyloccocus aureus, opening the door for simultaneous imaging of multiple genomic loci, which further expanded the versatility of Cas9-based technologies to live-image the dynamics and interactions of multiple genomic elements within the same nucleus [13]. Using this system, two genomic regions of the MUC4 locus were simultaneously imaged with the power to resolve genomic distances less than 300 kilobases apart. The development of these recent approaches provides researchers new tools to elucidate the interactions of DNA elements in a number of physiological contexts. Cas9-based imaging has proven a powerful tool to visualize these interactions in isolated cultured cells. It will be of interest to determine if these genetic labeling strategies will be of use to image these genomic transitions in model organisms. However, with any strategy relying on binding of a fluorescent reporter to indirectly visualize genomic loci, interpretation of the results must be made with caution as these imaging strategies must first rely on the openness and accessibility of chromatin to allow initial binding of reporter proteins. In furthering our understanding of how mistakes in DNA-DNA interactions can result in various disease states, CRISPR/Cas9 imaging has great potential to truly elucidate the mysteries of nuclear dynamics in vivo.
DNA-Protein interactions
To elicit control over any chromatin-templated process, proteins must interact with the genetic material. These proteins range from RNA polymerase and DNA polymerases to DNA-binding transcription factors (TFs) that act as repressors, activators, or architectural proteins [14–19]. Using biochemical assays such as chromatin immunoprecipitation (ChIP), coupled with next generation sequencing, high-content maps of protein-DNA interactions have been generated and the consensus sequences of many DNA binding domains have been characterized [20–22]. To understand how binding of regulatory proteins modulates genome function within cells, we must strive to study these interactions in their native cellular contexts. In this section, we will highlight recent studies illustrating how imaging approaches have generated important insights into the dynamics of TF oligomerization, localization, and DNA binding.
As a prerequisite for binding to DNA, transcription factors often form protein complexes with themselves or other binding partners. These interactions, however, are typically inferred from biochemical assays. To highlight the importance of examining transcription factor dynamics in living systems, we will examine how live-cell imaging approaches have yielded surprising insights into the requirement for glucocorticoid receptors (GR) oligomerization in transcriptional control. Without ligand, GRs primarily are localized to the cytoplasm. Ligand binding induces translocation of the GRs into the nucleus where they can regulate gene expression by directly interacting with DNA or by interacting with other transcription factors [23, 24]. Though their DNA binding interactions have been mapped previously [25], the requirement of GR oligomerization for DNA binding has remained unclear. It was commonly believed that GR homodimerization was an essential step for GR transcriptional regulation, but this relationship had not been fully characterized. Using the number and brightness method to model GR oligomerization state in cultured cells, Presman et al. examined the oligomerization dynamics of GRs and correlated this activity with transcriptional regulation [26]. Unexpectedly, they observed that GR monomeric versus dimeric states had minimal effect on transcriptional activity of target genes. These results have important implications in drug design strategies that focus on the identification of ligands to promote monomeric versus dimeric GR oligomerization states and challenge the functional relevance of GR oligomerization in transcriptional control. Ultimately, findings such as these need to be confirmed in a live organism since cultured cells have very different physiological environments compared to their native environment.
While biochemical assays are capable of demonstrating physical interaction between proteins and their target sequences, live-imaging approaches are necessary to quantify the dynamic properties of these protein-DNA interactions in their native systems. To directly monitor the dynamics of specific transcriptional modulators and their targeted loci in living cells, a common strategy begins with labeling the protein of interest with a fluorescent marker [7]. This strategy has been applied successfully to visualize the binding of heat shock factor (HSF) to DNA and its regulation of hsp70 transcription in the polytene nuclei of cultured Drosophila salivary glands. Polytene nuclei consists of oversized chromosomes derived from multiple rounds of endoreplication [27], thus facilitating the direct visualization of transcription factor-DNA interactions using conventional multiphoton microscopy [28]. Yao et al. monitored the dynamics of a HSF-EGFP reporter and observed that before heat shock, the fusion proteins localized to the nucleus [29,30]. In this state, fluorescence recovery after photobleaching (FRAP) assays revealed that HSF-EGFP exhibited rapid exchange at chromosomal loci. Interestingly, after heat shock, HSF-EGFP was found to translocate to distinct chromosomal loci and exhibited much slower exchange kinetics as determined by FRAP. Furthermore, by monitoring the localization of RNA Polymerase II as a readout of transcription, Yao et al. revealed that turnover or disassembly of the transcriptional activator was not required for subsequent rounds of hsp70 transcription. Ultimately, by using live Drosophila tissue these studies have revealed insights into the binding kinetics of HSF and transcriptional regulation of downstream target genes.
Gene regulation often involves the activities of multiple transcriptional regulators working in combination [31]. In contrast to the above example, single-molecule live-imaging approaches, along with computational modeling, are capable of revealing how these cascades are orchestrated in living systems. The pluripotency regulators SOX2 and OCT4 are master transcriptional regulators of embryonic stem cell-specific gene networks. Both factors are thought to bind to composite DNA elements that nucleate the assembly of an enhanceosome complex which regulates embryonic stem (ES) cell pluripotency [32]. Using both epi-illumination and Bessel plane illumination 2D single molecule tracking (SMT) and fast 3D SMT multifocus microscopy [33,34], Chen et al. developed kinetic models of SOX2 and OCT4 which were capable of quantifying search times for these factors in finding their respective binding sites and their residence times when bound to DNA [35,36]. Using 3T3 cell-lines that stably express a fluorescently tagged SOX2 and inducible OCT4, or vice versa, the binding interdependencies were ascertained. Intriguingly, OCT4 overexpression resulted in a modest increase in SOX2 residence time without affecting search time, suggesting that OCT4 primarily helps to stabilize SOX2 binding on DNA. Conversely, when SOX2 expression was induced, a considerable increase in both OCT4 residence and search time was observed. From these experiments, it was proposed that SOX2 and OCT4 follow a trial-and-error sampling method involving 3D diffusion and non-specific collisions before reaching their target binding sites. Additionally, these results support a model whereby SOX2 engages the DNA first to promote OCT4 binding. These results have revealed a detailed example of how using live imaging techniques can uncover intricate details of TF interactions with their binding sites on DNA.
While transcription factor networks have received much attention, the 3D spatial organization of regulatory elements within the nucleus and its influence on transcription activity have remained enigmatic. In recent work by Liu et al., lattice light-sheet microscopy, single molecule trafficking, and ChIP-exo, combined with numerical simulations, revealed the organization of SOX2-enhancer clusters in ES-cells [37]. SOX2 enhancer sites formed distinct 3D-clusters that were unique from heterochromatin domains but overlapped regions enriched with RNA polymerase II. While SOX2 is thought to search for its target sequences through a 3D-diffusion dominant model, enhancer clustering is thought to perhaps decrease global search efficiency but fine-tune TF search parameters in distinct local domains. These results illustrate the power of live-imaging approaches and computational models to reveal systems-level interactions between the DNA landscape and transcription factor dynamics.
DNA-RNA interactions
The central dogma of molecular biology, or the progression from DNA to RNA to protein, relies on the initiation of transcription. Transcription begins when transcriptional activators bind to gene regulatory elements allowing the recruitment of RNA polymerase II [38]. The result of transcription is the production of messenger RNA (mRNA) from the template DNA containing both exons and introns, which are protein-coding and non-protein coding elements, respectively. These nascent pre-mature transcripts then undergo splicing, where introns are removed from the mRNA sequence and exons are stitched together [39]. The variety of isoforms that can be generated through splicing from a single gene can augment the diversity of functions of the resulting proteins [39,40]. After splicing, the mature mRNA is exported from the nucleus, translated in the cytoplasm by ribosomes, and the resulting peptides are folded and assembled into functional units [41]. Understanding the details underlying this process is critical to paint a complete picture of how disruptions or mistakes during transcription can lead to disease states.
With the advent of next generation sequencing technologies, it is currently possible to catalog entire transcriptomes in a quantitative manner, even at single-cell resolution [42]. Hybridization strategies permit visualization of messenger RNA localization in single-cells [43]. However, these strategies are limited in that they only provide a snapshot of gene expression, as observations cannot be readily applied to living cells. In this section, we will review several examples that make use of MS2-dependent labeling strategies to tag a specific messenger RNA of interest [44] in order to provide insights into the dynamics of transcription and splicing.
The MS2 system is a powerfully versatile strategy for labeling RNAs with fluorescent proteins in living systems. The coat protein from the MS2 bacteriophage specifically binds to an RNA stem-loop structure of 19 nucleotides from the phage replicase gene [44]. Fusion of this MS2 coat protein to a fluorescent protein of interest allows labeling of any RNA containing multimers of the MS2 stem-loop motif. This strategy can be utilized across a number of organisms including bacteria, plants, and higher eukaryotic cells [45–49]. In comparison to strategies employing detection of RNAs using a fluorescently tagged RNA-binding protein [50,51], the MS2 system allows for increased detection specificity because only RNAs containing the stem loop motifs will be observed while RNA-binding proteins may recognize a plethora of RNA targets.
Prior to the development of the MS2 system, it had not been possible to visualize transcriptional activity of a single gene within eukaryotic cells. In 2006, Chubb et al. described the first application of the MS2 system to visualize transcriptional dynamics of the discoidin Ia (dscA) gene, a developmental regulator in Dictyostelium, a eukaryotic and phagotrophic bacterivore [52]. In this study, they used conventional fluorescence microscopy to visualize the integration of a cassette of 24 MS2 stem loops integrated into the endogenous dscA locus using GFP fused to the phage MS2 coat protein. Interestingly, these visualizations revealed the first account of eukaryotic transcriptional bursting kinetics, where pulses of gene activity were turned on and off at irregular intervals. Though the length and height of the pulses seemed to remain consistent during the development of the organism, there was strong variation in transcriptional pulse activity amongst a given population of cells. Cells that had previously undergone transcription seemed more likely to re-initiate transcription compared to naive cells initiating new transcription. Furthermore, computational algorithms were used to indicate synchronous transcription initiation in neighboring cells.
Recently, Suter et al. examined transcriptional bursting of several mammalian genes in living cells [53]. In addition to analyzing transgenic cell lines expressing labeled RNAs with the MS2 system, they also established gene trap cell lines using an alternate strategy to express short-lived luciferase protein derived from short-lived unstable mRNA. Their experiments were based on the principle that if both mRNA and protein products are short-lived, protein expression should reflect the transcriptional bursting kinetics. Using real-time bioluminescence recordings in single cells and mathematical modeling, they found that the dynamics and quantity of mRNA transcripts produced in individual mammalian genes exhibited unique, gene-specific bursting behaviors that could be altered by modulating the cis-regulatory DNA elements. Further experiments using recordings of transcriptional kinetics in living systems will provide additional insights into the systems-level organization of transcription.
In addition to revealing properties in the transcriptional process, the MS2 system has also been employed to observe how nascent RNAs are further processed and spliced into mature mRNAs. Schmidt et al. conducted a small-scale survey of 40 different introns in the human genome and found that most splicing events occurred co-transcriptionally [54]. They next developed a system to observe co-transcriptional splice kinetics by incorporating four repeats of the MS2 stem loops within the MINX intron, a synthetic sequence containing strong adenoviral splice signals. To increase the frequency of co-transcriptional splicing, the tagged MINX intron reporter was placed upstream of the Lac-Z gene. This intron reporter was then compared to constructs containing MS2 stem loops in exon 2 of the Lac-Z gene and to splice acceptor mutants, which were incapable of splicing. Comparison of the splicing dynamics of these constructs revealed that intron removal occurs on a timescale of minutes and computational modeling revealed that this likely occurs through several successive steps that are rate-limiting. These results suggest a kinetically controlled process where each pre-mRNA molecule is thought to require similar splice times. Thus, the MS2 system was an important advancement to understand how details of DNA-RNA interactions are critical in preparing the mRNA transcript for its final destination.
DNA-Nuclear envelope interactions
The nuclear envelope (NE) in eukaryotes is important to protect and store DNA, to prevent harmful materials from entering the nucleus, and to allow critical molecules, including mRNA or transcription factors, to enter or exit the nucleus [55]. Genetic mutations affecting the integrity of the NE have been linked to cancer. Therefore, elucidating NE-DNA interactions is crucial to advance our knowledge of cancer therapies [56]. Previous methods have revealed important physical components of the NE. Electron microscopy, for example, revealed an inner versus an outer nuclear membrane, now known to be two lipid bilayers, that were continuous with the endoplasmic reticulum [57]. From fixed cell analysis, the variation in the location of chromosomes relative to the nuclear envelope across species was observed. For example, yeast telomeres have been shown to congregate more around the periphery of the nucleus, whereas in mammals, the telomeres are located more centrally on average [58]. Additionally, it is suspected that there may exist higher levels of chromosome organization that involve interactions with the nuclear envelope, more specifically in the role of gene silencing [59]. Furthermore, it has also been proposed that lamina protein-DNA interactions play important roles in the formation of the NE itself [60]. Although much has been discovered about the NE and its role in transcription, chromosome organization, and cell division, visualizing the dynamics of DNA-NE interactions is required to detail the intricacies of these interactions. In this section, we will survey recent insights gained using live-cell imaging techniques to uncover the precise interactions between DNA and the NE in the areas of epigenetics and telomere biology.
Regions of the genome termed laminar associated domains (LADs) interact with the nuclear lamina (NL) and are enriched with repressed transcriptional activity [61,62]. Using imaging tools from static electron micrographs to high resolution light microscopy have revealed interactions between DNA loci and the NL [63,64]. However, only recently has live-imaging techniques been applied to discover how the LAD-NL interactions evolve overtime. Kind et al. applied a novel approach expressing a fusion protein containing the E. Coli DNA adenine methyltransferase (Dam) and Lamin B1 to synthetically label any DNA in molecular contact with the NL [65]. As these modifications are covalent, any genomic loci to ever interact with the NL will be labeled. Cleverly utilizing the ability of the DpnI restriction enzyme to recognize methylated DNA, DpnI truncation fusions with EGFP were co-expressed to recognize and label the covalently modified DNA. Using time-lapse imaging of their reporter constructs, the dynamics of LAD-interacting DNA were visualized, demonstrating that LADs at the nuclear periphery were primarily associated with heterochromatin, which is condensed and marked by H3K9me2, a repressive epigenetic marker. Additionally, the role of the H3K9 methyltransferase G9a was revealed as an important modulator of this process. Further analysis of LAD dynamics revealed that LAD positions are not inherited after cell division but are instead stochastically reshuffled. All in all, this study represents a beautiful example of the power of live-imaging approaches to elucidate complex systems-level interactions between the genome and nuclear lamina and further emphasizes the critical function of this structure in regulating gene expression.
While telomere dynamics have been visualized in living cells, as highlighted in a previous section, it is unclear how these structures behave during nuclear reassembly after mitosis. To visualize telomere mitotic behavior, Crabbe et al. labeled telomeres in living human cells with TRF1-EGFP and chromatin with histone H2B fused to the mCherry fluorescent protein [66]. Interestingly, telomeres seemed to localize to the nuclear periphery and interacted with the NL following mitosis. Quantification of subnuclear position demonstrated that almost half of all telomeres localize in this manner during the reassembly of the nuclear envelope. Using chromatin immunoprecipitation, it was then revealed that telomeres are physically anchored to the nuclear envelope during reassembly. The discovery of this telomere tethering mechanism highlights an interesting regulatory strategy that could impact on telomere-dependent processes including nuclear organization, cell division, and gene regulation.
Heterochromatin is prone to harmful double stranded breaks that have been associated with difficult repair. Interestingly, it has been recently shown that in order to repair these breaks, damaged regions localize near the nuclear lamina [67]. The reasons for this reorganization remain ambiguous, but perhaps the use of live imaging may further elucidate the mechanisms behind this process.
Conclusion
In this review, we surveyed recent insights into the dynamics of nuclear processes that could have only been gained through the integration of live-cell imaging approaches. The application of fluorescent protein labeling has made it possible to directly visualize protein dynamics and track mRNA behaviors in the nucleus. Further, based on recent advancements, it is likely that the advent of Cas9-dependent labeling strategies, which has made it possible to image the dynamics of any genomic element in various cellular contexts, will continue to provide novel insights into nuclear interactions. Though CRISPR/Cas9 labeling technologies have been more widely applied in cultured cells, we expect that future advancements will allow direct visualization of nuclear interactions in living tissues. Imaging techniques have already been successfully performed in live tissue, such as with the Drosophila salivary glands [27–30]. However, we need to be able to observe cellular dynamics in live, intact organisms in order to truly elucidate how various disruptions of nuclear processes can lead to cancers or other diseases. This is where we anticipate CRISPR/Cas9 will play a key role in future developments.
Although live imaging approaches are advancing our knowledge of cellular dynamics, they can be fraught with potential experimental artifacts due to technical limitations. An example of an important live imaging strategy that requires optimization for future advancements is the dCas9-GFP technique, which enables us to visualize important chromatin interactions, specific genetic loci, or telomere dynamics. The critical limitations of the CRISPR/Cas9 system we need to consider include irregularities in the specificity of the sgRNAs, blocked target sequences from chromosome folding, and discrepancies in CRISPR component delivery methods that depend on the organism [68]. The specificity of the sgRNAs to their target sequences is critical for proper alignment of the dCas9-GFP fused protein. This requirement can depend on the sgRNA sequence, locus, or dosage, all of which can independently change the searching efficacy of dCas9. Another issue involves understanding how chromosome folding can affect the efficiency of recognition of the sgRNA to the target sequence. Lastly, delivery methodologies of CRISPR components to live organisms, and the respective microscopy required for imaging in whole organisms, will be crucial in advancing our knowledge of nuclear and cellular dynamics in vivo. These limitations are currently preventing scientists from exploring answers to questions that can only be addressed in a whole organism system. Currently, observing nuclear dynamics in their native environment is difficult because of microscopy or imaging limitations. Therefore, this dCas9-GFP system is important to optimize for gene therapy purposes or potential chemotherapeutic methods.
Using both fixed and live imaging approaches, we are now able to uncover many nuclear processes, from interactions between different DNA loci, DNA and protein, DNA and RNA, or DNA and the nuclear envelope, as outlined in this review. We can observe snapshots of genome organization by using fixed approaches, such as FISH, and we can also observe localization and timing of protein-protein interactions using fluorescent labeling and time-lapse imaging. In the future, we will hopefully be able to observe nuclear dynamics within live organisms. Nevertheless, live-cell imaging methods will continue to provide a deeper understanding of the biology within the nucleus.
Acknowledgments
This work is supported by UCSF-IRACDA postdoctoral fellowship (A. P.), NIH T32 training grant and American Heart Association postdoctoral fellowship (J. A.), NIH Pathway to Independence Award, Edward Mallinckrodt Jr. Foundation, March of Dimes Basil O’Conner Scholar Award, American Heart Association, American Federation for Aging Research, Life Sciences Research Foundation, Program for Breakthrough Biomedical Research, UCSF Eli and Edythe Broad Center of Regeneration Medicine and Stem Cell Research, Resource Allocation Program, and Cardiovascular Research Institute (G. H.).
References
- 1.Gaspar-Maia A, Alajem A, Meshorer E, Ramalho-Santos M. Open chromatin in pluripotency and reprogramming. Nat Rev Mol Cell Biol. 2011 Jan;12(1):36–47. doi: 10.1038/nrm3036. [DOI] [PMC free article] [PubMed] [Google Scholar]
- 2.Saksouk N, Simboeck E, Déjardin J. Constitutive heterochromatin formation and transcription in mammals. Epigenetics Chromatin. 2015;8:3. doi: 10.1186/1756-8935-8-3. [DOI] [PMC free article] [PubMed] [Google Scholar]
- 3.Wittkopp PJ, Kalay G. Cis-regulatory elements: molecular mechanisms and evolutionary processes underlying divergence. Nat Rev Genet. 2012 Jan;13(1):59–69. doi: 10.1038/nrg3095. [DOI] [PubMed] [Google Scholar]
- 4.Antonin W, Neumann H. Chromosome condensation and decondensation during mitosis. Curr Opin Cell Biol. 2016 Jun;40:15–22. doi: 10.1016/j.ceb.2016.01.013. [DOI] [PubMed] [Google Scholar]
- 5.Volpi EV, Bridger JM. FISH glossary: an overview of the fluorescence in situ hybridization technique. BioTechniques. 2008 Oct;45(4):385–6. 388, 390. doi: 10.2144/000112811. passim. [DOI] [PubMed] [Google Scholar]
- 6.Dekker J, Rippe K, Dekker M, Kleckner N. Capturing chromosome conformation. Science. 2002 Feb 15;295(5558):1306–11. doi: 10.1126/science.1067799. [DOI] [PubMed] [Google Scholar]
- 7.Snapp E. Design and Use of Fluorescent Fusion Proteins in Cell Biology. Curr Protoc Cell Biol Editor Board Juan Bonifacino Al. 2005 Jul;CHAPTER(Unit – 21.4) doi: 10.1002/0471143030.cb2104s27. [DOI] [PMC free article] [PubMed] [Google Scholar]
- 8.Wang X, Kam Z, Carlton PM, Xu L, Sedat JW, Blackburn EH. Rapid telomere motions in live human cells analyzed by highly time-resolved microscopy. Epigenetics Chromatin. 2008 Oct 27;1:4. doi: 10.1186/1756-8935-1-4. [DOI] [PMC free article] [PubMed] [Google Scholar]
- 9.Artandi SE, DePinho RA. Telomeres and telomerase in cancer. Carcinogenesis. 2010 Jan;31(1):9–18. doi: 10.1093/carcin/bgp268. [DOI] [PMC free article] [PubMed] [Google Scholar]
- 10.Doudna JA, Charpentier E. The new frontier of genome engineering with CRISPR-Cas9. Science. 2014 Nov 28;346(6213):1258096. doi: 10.1126/science.1258096. [DOI] [PubMed] [Google Scholar]
- 11.Dominguez AA, Lim WA, Qi LS. Beyond editing: repurposing CRISPR-Cas9 for precision genome regulation and interrogation. Nat Rev Mol Cell Biol. 2016 Jan;17(1):5–15. doi: 10.1038/nrm.2015.2. [DOI] [PMC free article] [PubMed] [Google Scholar]
- 12.Chen B, Gilbert LA, Cimini BA, Schnitzbauer J, Zhang W, Li G-W, et al. Dynamic Imaging of Genomic Loci in Living Human Cells by an Optimized CRISPR/Cas System. Cell. 2013 Dec 19;155(7):1479–91. doi: 10.1016/j.cell.2013.12.001. [DOI] [PMC free article] [PubMed] [Google Scholar]
- 13.Chen B, Hu J, Almeida R, Liu H, Balakrishnan S, Covill-Cooke C, et al. Expanding the CRISPR imaging toolset with Staphylococcus aureus Cas9 for simultaneous imaging of multiple genomic loci. Nucleic Acids Res. 2016 May 5;44(8):e75. doi: 10.1093/nar/gkv1533. [DOI] [PMC free article] [PubMed] [Google Scholar]
- 14.Karin M. Too many transcription factors: positive and negative interactions. New Biol. 1990 Feb;2(2):126–31. [PubMed] [Google Scholar]
- 15.Harrison SC. A structural taxonomy of DNA-binding domains. Nature. 1991 Oct 24;353(6346):715–9. doi: 10.1038/353715a0. [DOI] [PubMed] [Google Scholar]
- 16.Sassone-Corsi P. Transcription Factors Responsive to cAMP. Annu Rev Cell Dev Biol. 1995;11(1):355–77. doi: 10.1146/annurev.cb.11.110195.002035. [DOI] [PubMed] [Google Scholar]
- 17.Latchman DS. Transcription-Factor Mutations and Disease. N Engl J Med. 1996 Jan 4;334(1):28–33. doi: 10.1056/NEJM199601043340108. [DOI] [PubMed] [Google Scholar]
- 18.Latchman DS. Transcription factors: An overview. Int J Biochem Cell Biol. 1997 Dec 1;29(12):1305–12. doi: 10.1016/s1357-2725(97)00085-x. [DOI] [PubMed] [Google Scholar]
- 19.Papavassiliou AG. Transcription factors: structure, function, and implication in malignant growth. Anticancer Res. 1995 Jun;15(3):891–4. [PubMed] [Google Scholar]
- 20.Cawley S, Bekiranov S, Ng HH, Kapranov P, Sekinger EA, Kampa D, et al. Unbiased Mapping of Transcription Factor Binding Sites along Human Chromosomes 21 and 22 Points to Widespread Regulation of Noncoding RNAs. Cell. 2004 Feb 20;116(4):499–509. doi: 10.1016/s0092-8674(04)00127-8. [DOI] [PubMed] [Google Scholar]
- 21.Valouev A, Johnson DS, Sundquist A, Medina C, Anton E, Batzoglou S, et al. Genome-Wide Analysis of Transcription Factor Binding Sites Based on ChIP-Seq Data. Nat Methods. 2008 Sep;5(9):829–34. doi: 10.1038/nmeth.1246. [DOI] [PMC free article] [PubMed] [Google Scholar]
- 22.Mundade R, Ozer HG, Wei H, Prabhu L, Lu T. Role of ChIP-seq in the discovery of transcription factor binding sites, differential gene regulation mechanism, epigenetic marks and beyond. Cell Cycle Georget Tex. 2014;13(18):2847–52. doi: 10.4161/15384101.2014.949201. [DOI] [PMC free article] [PubMed] [Google Scholar]
- 23.Aagaard MM, Siersbæk R, Mandrup S. Molecular basis for gene-specific transactivation by nuclear receptors. Biochim Biophys Acta. 2011 Aug;1812(8):824–35. doi: 10.1016/j.bbadis.2010.12.018. [DOI] [PubMed] [Google Scholar]
- 24.Tsai SY, Carlstedt-Duke J, Weigel NL, Dahlman K, Gustafsson JA, Tsai MJ, et al. Molecular interactions of steroid hormone receptor with its enhancer element: evidence for receptor dimer formation. Cell. 1988 Oct 21;55(2):361–9. doi: 10.1016/0092-8674(88)90059-1. [DOI] [PubMed] [Google Scholar]
- 25.Reddy TE, Pauli F, Sprouse RO, Neff NF, Newberry KM, Garabedian MJ, et al. Genomic determination of the glucocorticoid response reveals unexpected mechanisms of gene regulation. Genome Res. 2009 Dec;19(12):2163–71. doi: 10.1101/gr.097022.109. [DOI] [PMC free article] [PubMed] [Google Scholar]
- 26.Presman DM, Ogara MF, Stortz M, Alvarez LD, Pooley JR, Schiltz RL, et al. Live Cell Imaging Unveils Multiple Domain Requirements for In Vivo Dimerization of the Glucocorticoid Receptor. PLoS Biol [Internet] 2014 Mar 18;12(3) doi: 10.1371/journal.pbio.1001813. [cited 2016 Jun 16] Available from: http://www.ncbi.nlm.nih.gov/pmc/articles/PMC3958349/ [DOI] [PMC free article] [PubMed] [Google Scholar]
- 27.Berendes HD, Boyd JB. STRUCTURAL AND FUNCTIONAL PROPERTIES OF POLYTENE NUCLEI ISOLATED FROM SALIVARY GLANDS OF DROSOPHILA HYDEI. J Cell Biol. 1969 May 1;41(2):591–9. doi: 10.1083/jcb.41.2.591. [DOI] [PMC free article] [PubMed] [Google Scholar]
- 28.Two-photon laser scanning fluorescence microscopy | Science [Internet] [cited 2016 Jul 6]. Available from: http://science.sciencemag.org/content/248/4951/73.
- 29.Yao J, Munson KM, Webb WW, Lis JT. Dynamics of heat shock factor association with native gene loci in living cells. Nature. 2006 Aug 31;442(7106):1050–3. doi: 10.1038/nature05025. [DOI] [PubMed] [Google Scholar]
- 30.Yao J, Zobeck KL, Lis JT, Webb WW. Imaging transcription dynamics at endogenous genes in living Drosophila tissues. Methods San Diego Calif. 2008 Jul;45(3):233–41. doi: 10.1016/j.ymeth.2008.06.004. [DOI] [PMC free article] [PubMed] [Google Scholar]
- 31.Rizzino A. Sox2 and Oct-3/4: A Versatile Pair of Master Regulators that Orchestrate the Self-renewal and Pluripotency of Embryonic Stem Cells by Functioning as Molecular Rheostats. Wiley Interdiscip Rev Syst Biol Med. 2009;1(2):228–36. doi: 10.1002/wsbm.12. [DOI] [PMC free article] [PubMed] [Google Scholar]
- 32.Chen X, Xu H, Yuan P, Fang F, Huss M, Vega VB, et al. Integration of external signaling pathways with the core transcriptional network in embryonic stem cells. Cell. 2008 Jun 13;133(6):1106–17. doi: 10.1016/j.cell.2008.04.043. [DOI] [PubMed] [Google Scholar]
- 33.Gao L, Shao L, Higgins CD, Poulton JS, Peifer M, Davidson MW, et al. Noninvasive Imaging beyond the Diffraction Limit of 3D Dynamics in Thickly Fluorescent Specimens. Cell. 2012 Dec 7;151(6):1370–85. doi: 10.1016/j.cell.2012.10.008. [DOI] [PMC free article] [PubMed] [Google Scholar]
- 34.Planchon TA, Gao L, Milkie DE, Davidson MW, Galbraith JA, Galbraith CG, et al. Rapid three-dimensional isotropic imaging of living cells using Bessel beam plane illumination. Nat Methods. 2011 May;8(5):417–23. doi: 10.1038/nmeth.1586. [DOI] [PMC free article] [PubMed] [Google Scholar]
- 35.Chen J, Zhang Z, Li L, Chen B-C, Revyakin A, Hajj B, et al. Single-Molecule Dynamics of Enhanceosome Assembly in Embryonic Stem Cells. Cell. 2014 Mar 13;156(6):1274–85. doi: 10.1016/j.cell.2014.01.062. [DOI] [PMC free article] [PubMed] [Google Scholar]
- 36.Gebhardt JCM, Suter DM, Roy R, Zhao ZW, Chapman AR, Basu S, et al. Single Molecule Imaging of Transcription Factor Binding to DNA in Live Mammalian Cells. Nat Methods. 2013 May;10(5):421–6. doi: 10.1038/nmeth.2411. [DOI] [PMC free article] [PubMed] [Google Scholar]
- 37.Liu Z, Legant WR, Chen B-C, Li L, Grimm JB, Lavis LD, et al. 3D imaging of Sox2 enhancer clusters in embryonic stem cells. eLife. 2014;3:e04236. doi: 10.7554/eLife.04236. [DOI] [PMC free article] [PubMed] [Google Scholar]
- 38.Shandilya J, Roberts SGE. The transcription cycle in eukaryotes: from productive initiation to RNA polymerase II recycling. Biochim Biophys Acta. 2012 May;1819(5):391–400. doi: 10.1016/j.bbagrm.2012.01.010. [DOI] [PubMed] [Google Scholar]
- 39.Kornblihtt AR, Schor IE, Alló M, Dujardin G, Petrillo E, Muñoz MJ. Alternative splicing: a pivotal step between eukaryotic transcription and translation. Nat Rev Mol Cell Biol. 2013 Mar;14(3):153–65. doi: 10.1038/nrm3525. [DOI] [PubMed] [Google Scholar]
- 40.Tavares R, Wajnberg G, de Scherer NM, Pauletti BA, Cassoli JS, Ferreira CG, et al. Unveiling alterative splice diversity from human oligodendrocyte proteome data. J Proteomics. 2016 May 21; doi: 10.1016/j.jprot.2016.05.023. [DOI] [PubMed] [Google Scholar]
- 41.de Klerk E, Hoen PAC‘t. Alternative mRNA transcription, processing, and translation: insights from RNA sequencing. Trends Genet. 2015 Mar 1;31(3):128–39. doi: 10.1016/j.tig.2015.01.001. [DOI] [PubMed] [Google Scholar]
- 42.Wu AR, Neff NF, Kalisky T, Dalerba P, Treutlein B, Rothenberg ME, et al. Quantitative assessment of single-cell RNA-sequencing methods. Nat Methods. 2014 Jan;11(1):41–6. doi: 10.1038/nmeth.2694. [DOI] [PMC free article] [PubMed] [Google Scholar]
- 43.Jensen E. Technical review: In situ hybridization. Anat Rec Hoboken NJ 2007. 2014 Aug;297(8):1349–53. doi: 10.1002/ar.22944. [DOI] [PubMed] [Google Scholar]
- 44.Querido E, Chartrand P. Biology B-M in C, editor. Fluorescent Proteins. Vol. 85. Academic Press; 2008. Using Fluorescent Proteins to Study mRNA Trafficking in Living Cells; pp. 273–92. [cited 2016 Jun 16] Available from: http://www.sciencedirect.com/science/article/pii/S0091679X08850121. [DOI] [PubMed] [Google Scholar]
- 45.Bertrand E, Chartrand P, Schaefer M, Shenoy SM, Singer RH, Long RM. Localization of ASH1 mRNA particles in living yeast. Mol Cell. 1998 Oct;2(4):437–45. doi: 10.1016/s1097-2765(00)80143-4. [DOI] [PubMed] [Google Scholar]
- 46.Fusco D, Accornero N, Lavoie B, Shenoy SM, Blanchard J-M, Singer RH, et al. Single mRNA Molecules Demonstrate Probabilistic Movement in Living Mammalian Cells. Curr Biol. 2003 Jan 21;13(2):161–7. doi: 10.1016/s0960-9822(02)01436-7. [DOI] [PMC free article] [PubMed] [Google Scholar]
- 47.Golding I, Paulsson J, Zawilski SM, Cox EC. Real-time kinetics of gene activity in individual bacteria. Cell. 2005 Dec 16;123(6):1025–36. doi: 10.1016/j.cell.2005.09.031. [DOI] [PubMed] [Google Scholar]
- 48.Rook MS, Lu M, Kosik KS. CaMKIIalpha 3′ untranslated region-directed mRNA translocation in living neurons: visualization by GFP linkage. J Neurosci Off J Soc Neurosci. 2000 Sep 1;20(17):6385–93. doi: 10.1523/JNEUROSCI.20-17-06385.2000. [DOI] [PMC free article] [PubMed] [Google Scholar]
- 49.Zhang F, Simon AE. A novel procedure for the localization of viral RNAs in protoplasts and whole plants. Plant J Cell Mol Biol. 2003 Sep;35(5):665–73. doi: 10.1046/j.1365-313x.2003.01837.x. [DOI] [PubMed] [Google Scholar]
- 50.Brodsky AS, Silver PA. Pre-mRNA processing factors are required for nuclear export. RNA. 2000 Dec;6(12):1737–49. doi: 10.1017/s1355838200001059. [DOI] [PMC free article] [PubMed] [Google Scholar]
- 51.Takizawa PA, Vale RD. The myosin motor, Myo4p, binds Ash1 mRNA via the adapter protein, She3p. Proc Natl Acad Sci U S A. 2000 May 9;97(10):5273–8. doi: 10.1073/pnas.080585897. [DOI] [PMC free article] [PubMed] [Google Scholar]
- 52.Chubb JR, Trcek T, Shenoy SM, Singer RH. Transcriptional Pulsing of a Developmental Gene. Curr Biol. 2006 May 23;16(10):1018–25. doi: 10.1016/j.cub.2006.03.092. [DOI] [PMC free article] [PubMed] [Google Scholar]
- 53.Suter DM, Molina N, Gatfield D, Schneider K, Schibler U, Naef F. Mammalian Genes Are Transcribed with Widely Different Bursting Kinetics. Science. 2011 Apr 22;332(6028):472–4. doi: 10.1126/science.1198817. [DOI] [PubMed] [Google Scholar]
- 54.Schmidt U, Basyuk E, Robert M-C, Yoshida M, Villemin J-P, Auboeuf D, et al. Real-time imaging of cotranscriptional splicing reveals a kinetic model that reduces noise: implications for alternative splicing regulation. J Cell Biol. 2011 May 30;193(5):819–29. doi: 10.1083/jcb.201009012. [DOI] [PMC free article] [PubMed] [Google Scholar]
- 55.Hetzer MW The Nuclear Envelope. Cold Spring Harb Perspect Biol [Internet] 2010 Mar;2(3) doi: 10.1101/cshperspect.a000539. [cited 2016 Jul 6] Available from: http://www.ncbi.nlm.nih.gov/pmc/articles/PMC2829960/ [DOI] [PMC free article] [PubMed] [Google Scholar]
- 56.Broers JLV, Ramaekers FCS. The Role of the Nuclear Lamina in Cancer and Apoptosis. In: Schirmer EC, de las Heras JI, editors. Cancer Biology and the Nuclear Envelope [Internet] Springer; New York: 2014. pp. 27–48. [cited 2016 Jul 6] (Advances in Experimental Medicine and Biology). Available from: http://link.springer.com/chapter/10.1007/978-1-4899-8032-8_2. [DOI] [PubMed] [Google Scholar]
- 57.Watson ML. THE NUCLEAR ENVELOPE. J Biophys Biochem Cytol. 1955 May 25;1(3):257–70. doi: 10.1083/jcb.1.3.257. [DOI] [PMC free article] [PubMed] [Google Scholar]
- 58.Mekhail K, Moazed D. The nuclear envelope in genome organization, expression and stability. Nat Rev Mol Cell Biol. 2010 May;11(5):317–28. doi: 10.1038/nrm2894. [DOI] [PMC free article] [PubMed] [Google Scholar]
- 59.Guelen L, Pagie L, Brasset E, Meuleman W, Faza MB, Talhout W, et al. Domain organization of human chromosomes revealed by mapping of nuclear lamina interactions. Nature. 2008 Jun 12;453(7197):948–51. doi: 10.1038/nature06947. [DOI] [PubMed] [Google Scholar]
- 60.Ulbert S, Platani M, Boue S, Mattaj IW. Direct membrane protein–DNA interactions required early in nuclear envelope assembly. J Cell Biol. 2006 May 22;173(4):469–76. doi: 10.1083/jcb.200512078. [DOI] [PMC free article] [PubMed] [Google Scholar]
- 61.Peric-Hupkes D, Meuleman W, Pagie L, Bruggeman SWM, Solovei I, Brugman W, et al. Molecular Maps of the Reorganization of Genome-Nuclear Lamina Interactions during Differentiation. Mol Cell. 2010 May 28;38(4):603–13. doi: 10.1016/j.molcel.2010.03.016. [DOI] [PMC free article] [PubMed] [Google Scholar]
- 62.Kind J, van Steensel B. Genome–nuclear lamina interactions and gene regulation. Curr Opin Cell Biol. 2010 Jun;22(3):320–5. doi: 10.1016/j.ceb.2010.04.002. [DOI] [PubMed] [Google Scholar]
- 63.Belmont AS, Zhai Y, Thilenius A. Lamin B distribution and association with peripheral chromatin revealed by optical sectioning and electron microscopy tomography. J Cell Biol. 1993 Dec 15;123(6):1671–85. doi: 10.1083/jcb.123.6.1671. [DOI] [PMC free article] [PubMed] [Google Scholar]
- 64.Schermelleh L, Carlton PM, Haase S, Shao L, Winoto L, Kner P, et al. Subdiffraction Multicolor Imaging of the Nuclear Periphery with 3D Structured Illumination Microscopy. Science. 2008 Jun 6;320(5881):1332–6. doi: 10.1126/science.1156947. [DOI] [PMC free article] [PubMed] [Google Scholar]
- 65.Kind J, Pagie L, Ortabozkoyun H, Boyle S, de Vries SS, Janssen H, et al. Single-Cell Dynamics of Genome-Nuclear Lamina Interactions. Cell. 2013 Mar 28;153(1):178–92. doi: 10.1016/j.cell.2013.02.028. [DOI] [PubMed] [Google Scholar]
- 66.Crabbe L, Cesare AJ, Kasuboski JM, Fitzpatrick JAJ, Karlseder J. Human telomeres are tethered to the nuclear envelope during post-mitotic nuclear assembly. Cell Rep. 2012 Dec 27;2(6):1521–9. doi: 10.1016/j.celrep.2012.11.019. [DOI] [PMC free article] [PubMed] [Google Scholar]
- 67.Ryu T, Spatola B, Delabaere L, Bowlin K, Hopp H, Kunitake R, et al. Heterochromatic breaks move to the nuclear periphery to continue recombinational repair. Nat Cell Biol. 2015 Nov;17(11):1401–11. doi: 10.1038/ncb3258. [DOI] [PMC free article] [PubMed] [Google Scholar]
- 68.Chen B, Guan J, Huang B. Imaging Specific Genomic DNA in Living Cells. Annu Rev Biophys. 2016 Apr;45:1–23. doi: 10.1146/annurev-biophys-062215-010830. [DOI] [PMC free article] [PubMed] [Google Scholar]