Abstract
Background & objectives:
Surveillance of risk factors is important to plan suitable control measures for non-communicable diseases (NCDs). The objective of this study was to assess the behavioural, physical and biochemical risk factors for NCDs in Vellore Corporation and Kaniyambadi, a rural block in Vellore district, Tamil Nadu, India.
Methods:
This cross-sectional study was carried out among 6196 adults aged 30-64 yr, with 3799 participants from rural and 2397 from urban areas. The World Health Organization-STEPS method was used to record behavioural risk factors, anthropometry, blood pressure, fasting blood glucose and lipid profile. Multiple logistic regression was used to assess associations between risk factors.
Results:
The proportion of tobacco users (current smoking or daily use of smokeless tobacco) was 23 per cent in the rural sample and 18 per cent in the urban, with rates of smoking being similar. Ever consumption of alcohol was 62 per cent among rural men and 42 per cent among urban men. Low physical activity was seen among 63 per cent of the urban and 43 per cent of the rural sample. Consumption of fruits and vegetables was equally poor in both. In the urban sample, 54 per cent were overweight, 29 per cent had hypertension and 24 per cent diabetes as compared to 31, 17 and 11 per cent, respectively, in the rural sample. Physical inactivity was associated with hypertension, body mass index (BMI) ≥25 kg/m2, central obesity and dyslipidaemia after adjusting for other factors. Increasing age, male sex, BMI ≥25 kg/m2 and central obesity were independently associated with both hypertension and diabetes.
Interpretation & conclusions:
Diabetes, hypertension, dyslipidaemia, physical inactivity and overweight were higher in the urban area as compared to the rural area which had higher rates of smokeless tobacco use and alcohol consumption. Smoking and inadequate consumption of fruits and vegetables were equally prevalent in both the urban and rural samples. There is an urgent need to address behavioural risk factors such as smoking, alcohol consumption, physical inactivity and inadequate intake of fruits and vegetables through primary prevention.
Keywords: Diabetes, non-communicable diseases, obesity, risk factors, World Health Organization, STEPS
The burden of non-communicable diseases (NCDs) such as diabetes and coronary heart disease (CHD) is increasing both globally and in India1. The rising prevalence of behavioural and anthropometric risk factors for these lifestyle diseases is postulated to be the cause for the alarming increase of NCDs. Documenting the burden of disease and risk factors and monitoring trends through surveillance is recommended as part of the control measures for these diseases2. In a vast country like India, although the general trend indicates an increase in common adverse factors, there are regional differences as well, influenced by diet, culture, socio-economic status, etc. States such as Kerala and Tamil Nadu which have been performing higher in terms of health indicators such as reproductive and child health and have high indices of development, are possibly at higher risk of threats due to lifestyle diseases, with a study in Kerala showing rates of some risk factors to be similar to that in the United States3.
In view of the difficulties in comparing data from different studies using separate indicators and methods, the World Health Organization (WHO) has recommended the use of a standard methodology, the STEPS method4, to conduct periodic surveys of NCD-related risk factors. The use of standard indicators for reporting the results from such STEPS surveys has made comparisons across studies easier. One such national survey, which included Tamil Nadu, was the Integrated Disease Surveillance Project (IDSP) risk factor survey in 2007-20085. While behavioural and physical parameters were measured during the IDSP survey, biochemical parameters were not measured. Another nationally representative study was the Indian Council of Medical Research-India Diabetes (ICMR-INDIAB) study, which collected information on multiple risk factors but used capillary blood glucose for diagnosing diabetes6. Some other examples of similar surveys conducted in India with the STEPS methodology are the WHO-ICMR six-site survey and studies in Gujarat and Maharashtra3,7,8,9.
This study was aimed at assessing the prevalence of risk factors for NCDs among adults aged 30-64 yr in urban and rural areas of Vellore, Tamil Nadu, India, with a view to setting up a population which can be followed up in the future for surveillance. As a previous study had been carried out in this area in 1991-199410, the need was felt to review the trends of risk factors in this area. The primary objective was to estimate behavioural (use of tobacco, alcohol, physical activity, intake of fruits and vegetables), physical [body mass index (BMI), waist circumference (WC), blood pressure] and biochemical risk factors (fasting plasma glucose, lipid profile). The secondary objectives were to estimate associations between socio-demographic, behavioural, physical and biochemical risk factors.
Material & Methods
The study was conducted between June 2010 and December 2012 in nine villages of a rural block in Vellore district, Tamil Nadu, and in 48 wards of the Vellore Corporation using a cluster design. Nine villages were first selected by simple random sampling out of 23 villages in the same rural block, which had been surveyed in 1991-1994 for NCD risk factors. All individuals in the selected nine clusters (villages) aged 30-64 yr, identified by a household census listing survey, were invited to participate in the study.
In the urban area, 48 of the 60 clusters (wards) were selected from the four zones of the city by selecting the first 12 consecutive ward numbers in each zone. In each ward, one street was selected by simple random sampling from a list of numbered streets, and all the members belonging to the first 40 consecutive households in the street were invited to participate. The age group of 30-64 yr was chosen to enable comparison with the previous survey in this region and was similar to the recommended age for WHO-STEPS surveys (25-64 yr). The Tamil translation of the WHO-STEPS questionnaire4 was used.
Inclusion & exclusion criteria: All residents of the selected clusters – nine villages and 48 urban streets, whose age was between 30 and 64 yr, identified through a household listing survey, were considered eligible for the study. Those who were currently living away from the family (e.g., men in the army, household members staying elsewhere for work) were not included.
Definitions and methods: The definitions used in the analysis corresponding to the indicators of the WHO-STEPS analysis guide4 were as follows:
(i) Behavioural risk factors (STEP 1 variables): Ever use of alcohol, current smoking/use of smokeless tobacco (daily or less than daily), low physical activity as defined by the Global Physical Activity Questionnaire component of the WHO-STEPS questionnaire4 and <5 servings/day of fruits and vegetables (one serving = 80 g translated into different units of standard cups depending on the fruit or vegetable)4.
(ii) Physical measurements (STEP 2 variables): Overweight (BMI 25-29.9 kg/m2)11, obesity (BMI ≥30 kg/m2)11, abdominal obesity (WC ≥80 cm for women and ≥90 cm for men)12, hypertension [blood pressure (BP) ≥140/90 mm Hg or on medication]13.
(iii) Biochemical measurements (STEP 3 variables): Diabetes mellitus (fasting blood glucose, FBG ≥126 mg/dl or on medication)4, hypercholesterolaemia (total cholesterol ≥190 mg/dl or on medication), hypertriglyceridaemia (≥150 mg/dl or on medication) and low high-density lipoprotein (HDL) (<40 mg/dl for men and <50 mg/dl for women)4,14.
Metabolic syndrome was defined according to a recent joint definition of the International Diabetes Federation (IDF) and other organizations15 as the presence of at least three of the following five risk factors: systolic blood pressure ≥130 and/or diastolic ≥85 mm Hg (or on antihypertensive medication); WC ≥80 cm for women and ≥90 cm for men (population specific definition)12; triglycerides ≥150 mg/dl (or on medication); FBG ≥100 mg/dl (or on medication); HDL cholesterol <40 mg/dl in males and <50 mg/dl in females.
Height was measured using a SECA 213 stadiometer (Hamburg, Germany), weight using digital weighing machines (Essae, Bangalore, India, accuracy 0.01 kg, standardized periodically with standard weights), waist circumference by a flexible measuring tape and blood pressure using an automated monitor (Omron HEM 7080, Kyoto, Japan). Blood samples (10 ml) were collected after overnight fasting for at least eight hours. Plasma glucose was tested using the enzymatic calorimetric glucose oxidase-peroxidase method16, serum cholesterol and HDL using enzymatic colorimetric high-performance CHOD-PAP17 and triglycerides using colorimetric glycerol oxidase/peroxidase method18. Quality control for the biochemical tests was through the External Quality Assurance programme19.
Sample size: As this study was part of a larger study to estimate the prevalence of CHD, the sample size was calculated to estimate this rate. Assuming a prevalence of CHD to be six per cent in the urban area (based on a previous ICMR survey in the region, unpublished), with an error of six per cent, power 80 per cent, design effect of 1.1 and a non-response rate of 20 per cent, the sample size was 3000. For the rural area, assuming the rate of CHD as 1.7 per cent, error of 0.6 per cent, design effect of 2 and non-response rate of 25 per cent, the sample size was calculated to be 5000.
Quality and reliability of the data collected by trained social workers and field workers were checked through weekly checking of 10 per cent of the clinical forms by a co-investigator and periodic field visits to monitor interviews. Double data entry was done using EpiData version 3.1 (The EpiData Association, Odense, Denmark) and analyzed using SPSS 15.0 for Windows (SPSS Inc., Chicago, Illinois, USA). Frequencies of outcomes were calculated by age and sex groups. Adjustment for cluster sampling was done in calculating confidence intervals (CIs) for the main outcomes20. Chi-square test was used to compare proportions and t test for means. Associations between socio-demographic, behavioural, physical and biochemical risk factors were analyzed by multiple logistic regression.
The study was conducted after approval of the protocol from the Institutional Review Board and Ethics Committee of the Institution carrying out the project.
Results
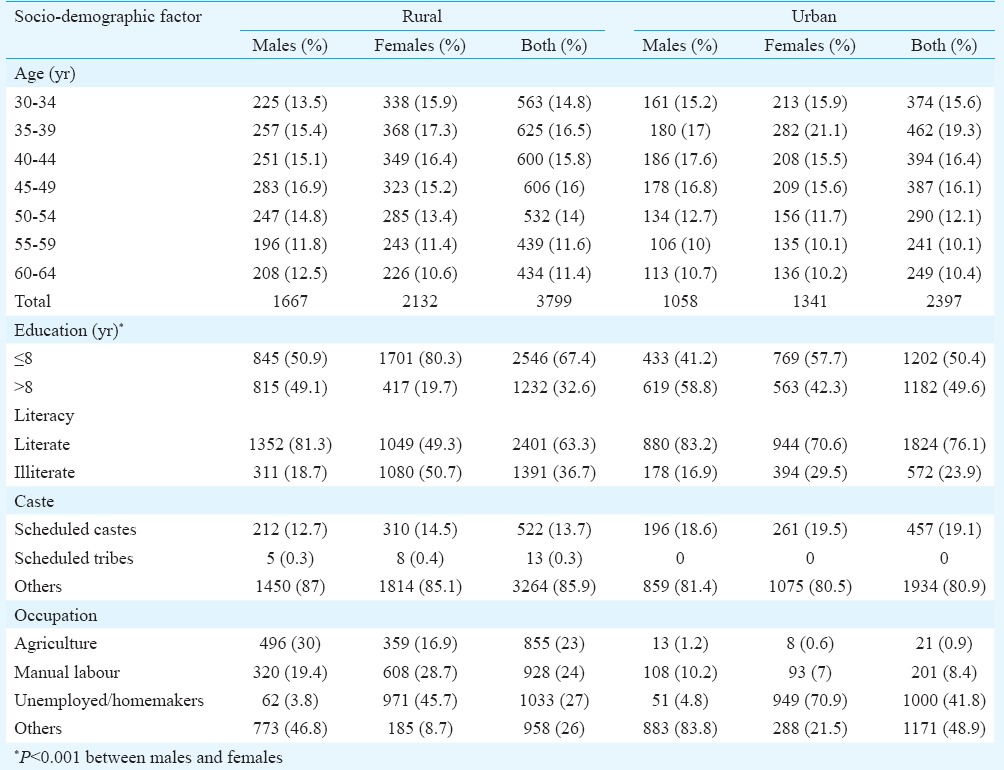
Of the 6196 participants interviewed, 3799 were from rural and 2397 from urban areas, constituting 83 and 77 per cent of the eligible population (defined as the population aged 30-64 yr), respectively. Biochemical results were available for 3095 rural and 1857 urban participants (response rates of 68 and 60%, respectively among eligible). While the age distribution of males and females was similar, females were more likely to be illiterate, less educated and widowed than males (Table I). The urban participants had greater education and a higher proportion of scheduled caste participants. Urban women were more likely to be homemakers than rural women. As compared to the general population in the rural area aged 30-64 yr, the sex distribution of the interviewed participants showed a slight skew towards females (males in the general population was 47% while they formed 44% of the interviewed group). This skew was more in the urban areas where males formed 49 per cent of the general population but only 44 per cent of the interviewed population. The literacy rates, as well as the distribution of religion and occupation of the study population were comparable to the general population in both rural and urban areas.
Table I.
Distribution of socio-demographic factors in the study population
The distribution of behavioural risk factors, abnormal physical measurements and biochemical risk factors is shown in Tables II and III and mean values in Table IV. Males were more likely to use tobacco and alcohol, have hypertension and high triglyceride values, whereas females were more likely to be inactive, overweight/obese, centrally obese and have low HDL (P<0.001). The proportion with BMI ≥25 kg/m2 was 45.4 per cent (95% CI: 40.8-49.9) among urban males and 61 per cent (95% CI: 56.9-65.1) among urban females, while it was 26.4 per cent (95% CI: 21.4-31.3) and 34.6 per cent (95% CI: 27.4-41.7) among rural males and females, respectively (Table II). Considering 23 kg/m2 as the cut-off for defining overweight, as suggested by the WHO for Asians14, 83.5 per cent rural males, 85 per cent rural females, 91 per cent urban males and 94.1 per cent of urban females were overweight (Table II).
Table II.
Distribution of behavioural and physical risk factors
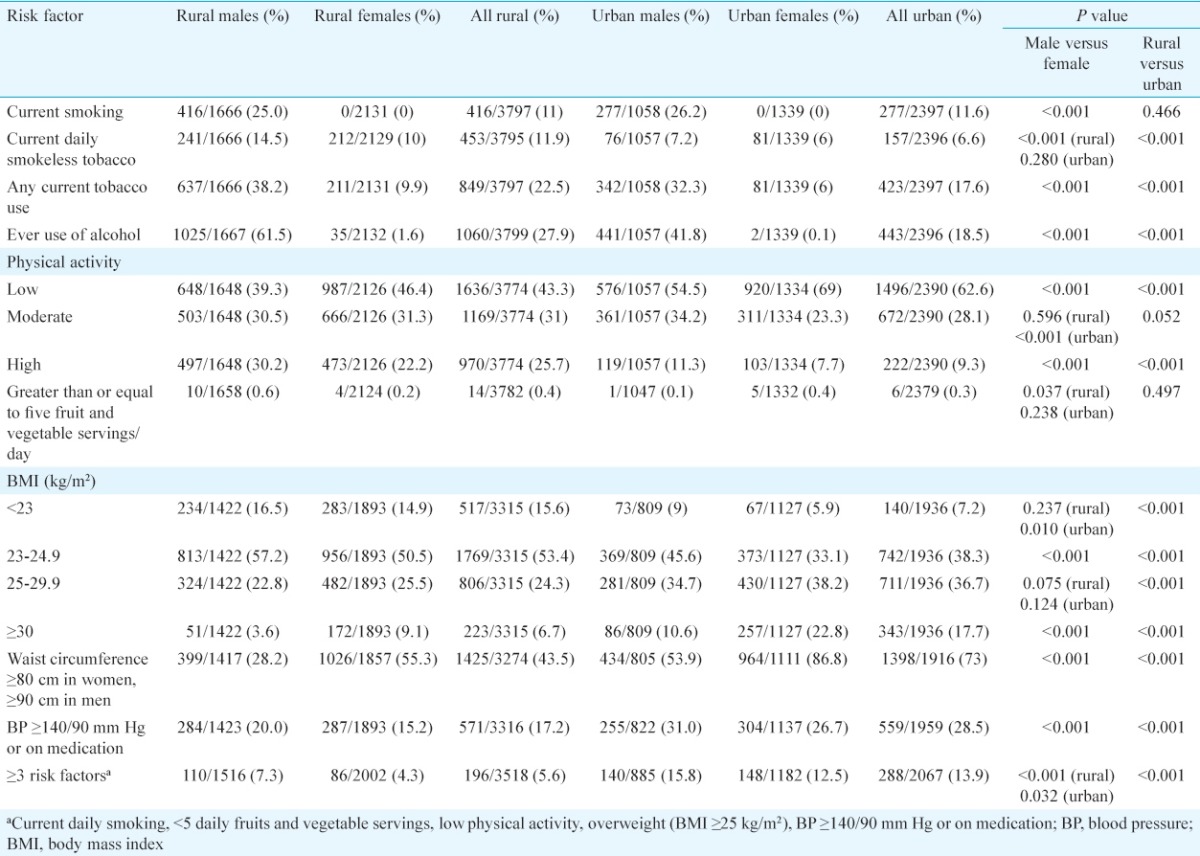
Table III.
Distribution of biochemical risk factors among rural and urban participants
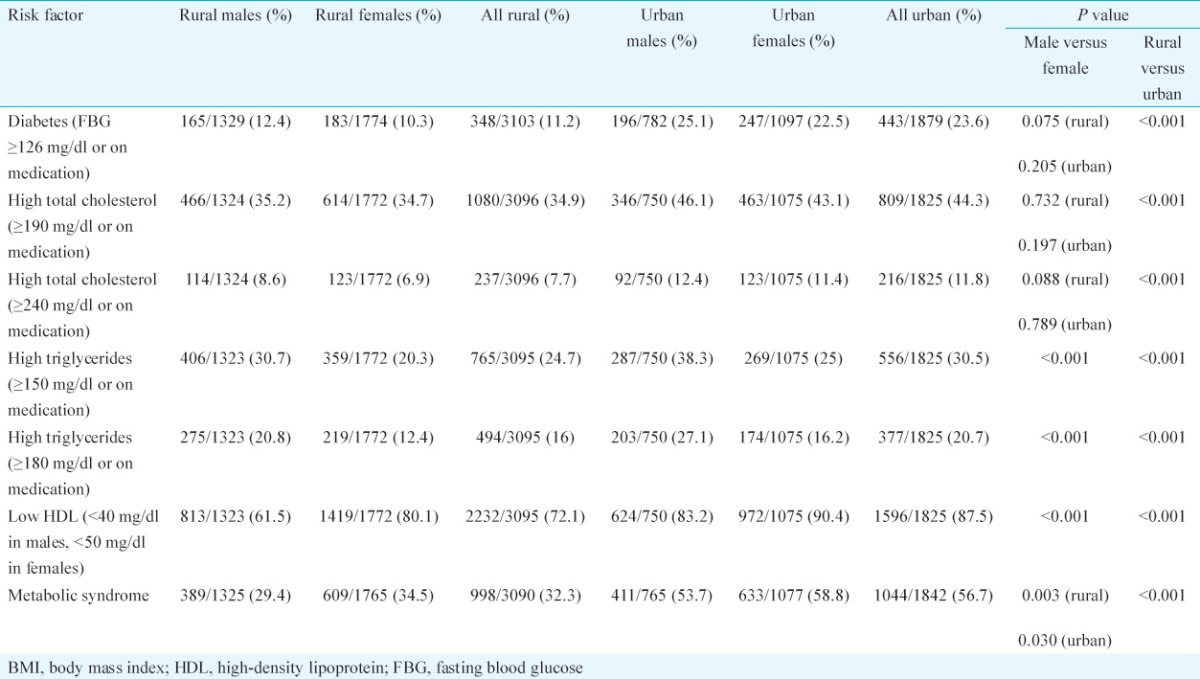
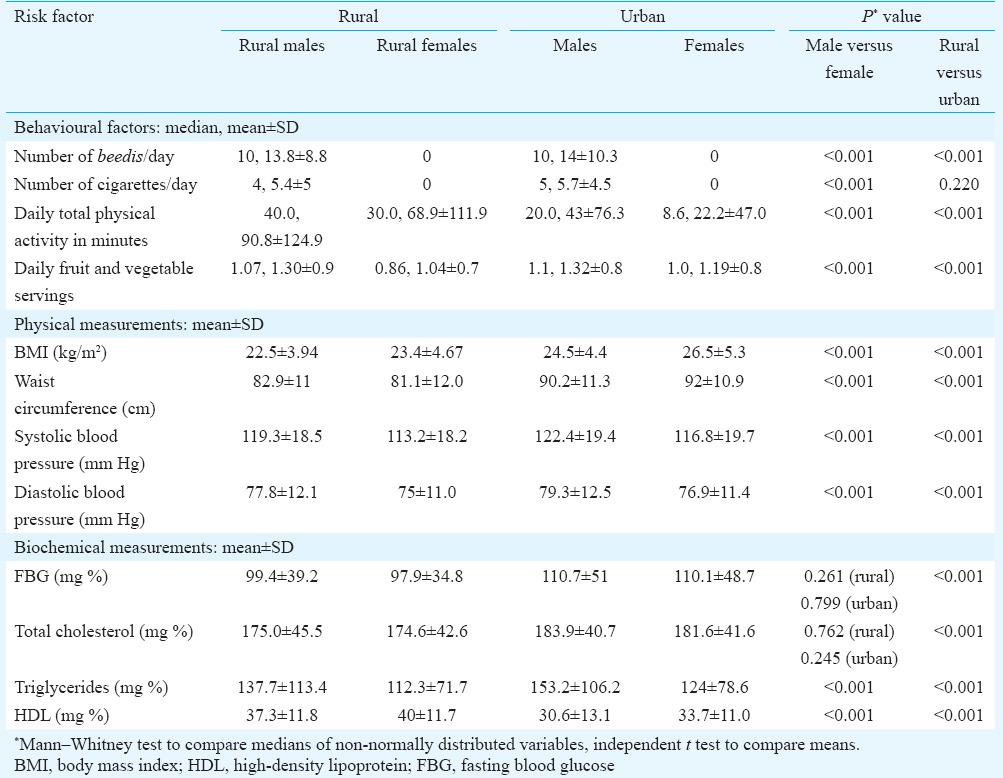
Table IV.
Comparison of mean values of risk factors
Comparing urban-rural differences, use of alcohol and tobacco was more common in the rural area, while obesity, abdominal obesity, hypertension, diabetes and abnormal cholesterol values were higher in the urban areas (Table II). The prevalence of hypertension among rural participants was 17.2 per cent (95% CI: 13.3-21.2) and among urban was 28.5 per cent (95% CI: 26.3-30.8), whereas diabetes rates among rural and urban participants were 11.2 per cent (95% CI: 8.5-13.9) and 23.6 per cent (95% CI: 21.2-25.9), respectively (Tables II and III). The proportion of persons who were already on treatment for hypertension was 5.1 per cent in the rural area and 14.5 per cent in the urban area, while 5.9 per cent in the rural and 15.3 per cent among the urban participants were on antidiabetic medication.
The proportion with total cholesterol ≥190 mg/dl or on medication was 34.9 per cent (95% CI: 27.9-41.8) in the rural area and 44.3 per cent (95% CI: 40.9-47.8) in the urban area. Only two males and seven females in the rural area (0.2%, 7/3096) were on treatment for dyslipidaemia, whereas in the urban area, 33 males and 32 females (3.6%, 65/1825) were on treatment. Among the rural participants, 16 per cent (95% CI: 13.5-18.5) had triglycerides ≥180 mg/dl as compared to 20.7 per cent (95% CI: 17.8-23.5) of the urban (Table III). The proportion with triglycerides ≥500 mg/dl was similar in both rural (0.8%) and urban areas (1%). Approximately, three-fourths of the participants had low HDL values (72.1% in the rural and 87.5% in the urban area).
Rural females had the lowest mean intake of fruits and vegetables while urban females had the least physical activity (Table IV). Urban participants had significantly higher mean BMI, waist circumference, blood pressure and biochemical parameters than the rural (Table IV).
Of those with hypertension in the rural area, only 37.7 per cent of males and 33.1 per cent of females were aware of having the condition, while only 30.8 per cent (28.5% males, 33.1% females) were on treatment. In the urban sample, awareness of hypertension was 54.5 per cent among males and 67.7 per cent among females, with only 54.5 per cent (45.1% males, 62.2% females) were taking medications. Similarly, of those with diabetes in the rural area, 72.1 per cent males and 64.5 per cent females were aware of it, while only 58 per cent (57.6% males, 58.5% females) were on medication. In the urban area, awareness of having diabetes was 76.5 per cent among males and 78.2 per cent among females, while 69.5 per cent (66.8% males, 71.7% females) were on medication.
While clustering of behavioural and physical risk factors (three out of five factors defined in the WHO-STEPS analysis guide: current daily smoking, less than five daily fruits and vegetable servings, low physical activity, BMI ≥25 kg/m2, blood pressure ≥140/90 mm Hg or on medication)4 was seen in 5.6 per cent of rural and 13.9 per cent of urban participants, metabolic syndrome was more common (32.3% rural and 56.7% urban, Tables II and III). Clustering of behavioural and physical risk factors was higher in males, while females were significantly more likely to have metabolic syndrome (Tables II and III).
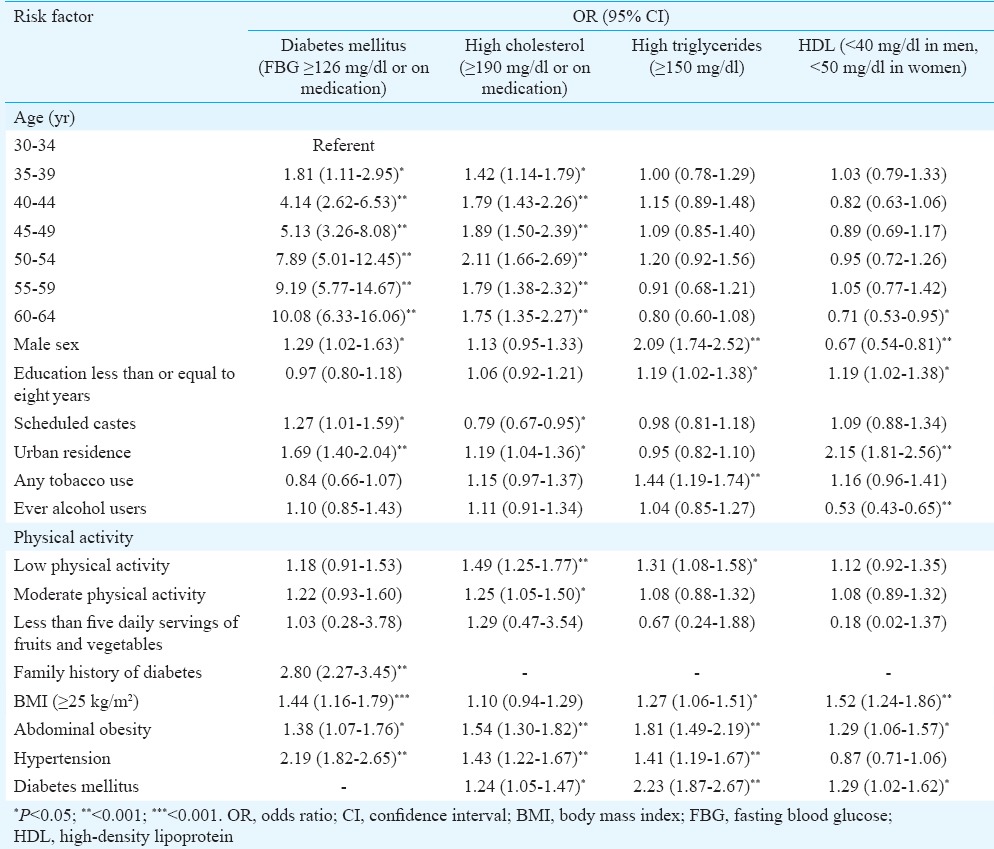
Multiple logistic regression revealed that hypertension was significantly associated with increasing age, male sex, urban residence, ever use of alcohol, scheduled caste status, low physical activity, BMI ≥25 kg/m2, central obesity and a family history of hypertension (Table V). Female sex, middle age (40-59 yr), urban residence, scheduled caste, education above 8th standard and low physical activity were associated with BMI ≥25 kg/m2 while tobacco users were less likely to be overweight, with similar results for central obesity (Table V). Diabetes was associated with increasing age, male sex, urban residence, scheduled caste, BMI ≥25 kg/m2, central obesity and family history but not with inactivity or dietary intake of fruits and vegetables (Table VI). Hypercholesterolemia was associated with increasing age, urban residence, low physical activity, abdominal obesity, diabetes and hypertension. Hypertriglyceridaemia and low HDL were not associated with age but were significantly associated with male sex, BMI ≥25 kg/m2 and education less than or equal to eight years (Table VI).
Table V.
Risk factors for hypertension, overweight and abdominal obesity: logistic regression
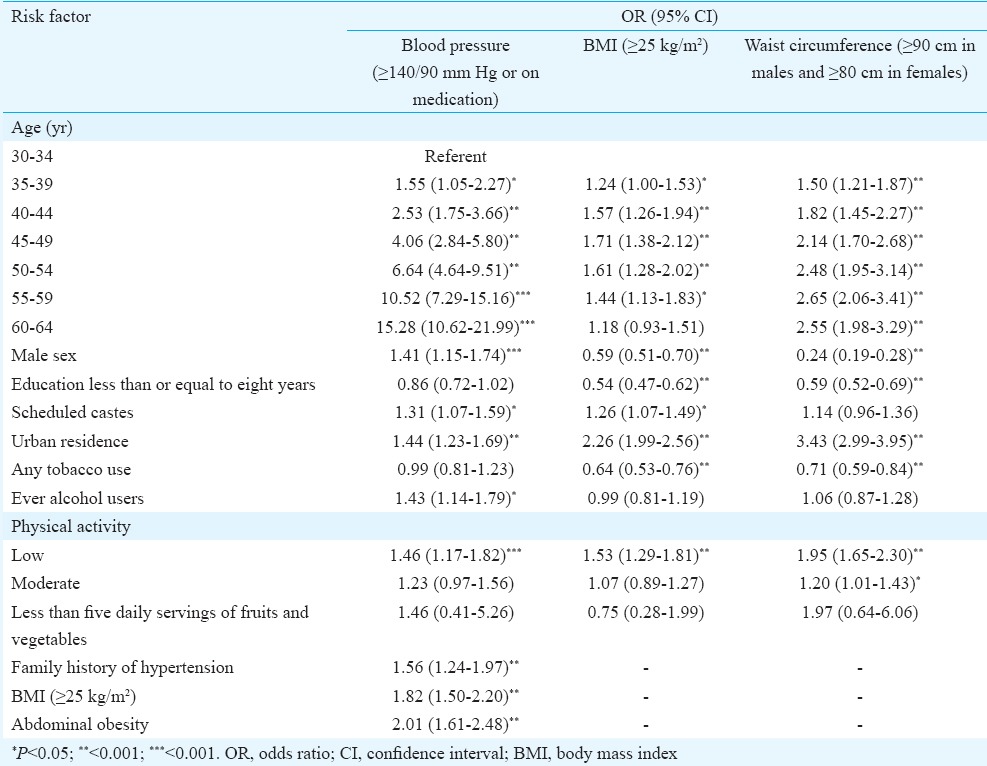
Table VI.
Risk factors for diabetes and dyslipidaemia: multiple logistic regression
Discussion
This cross-sectional survey conducted using the WHO-STEPS methodology provided data on risk factors for NCDs in Vellore, Tamil Nadu, India. The prevalence of tobacco use in men (32% in urban and 38% in rural areas) was similar to the rates in Tamil Nadu in the IDSP survey (29.8 and 40.2% in urban and rural areas)5 but less than the figures from a similar survey in Kerala (43% in urban and 45% in rural areas)3. The proportion of male ever users of alcohol in this study (61.5% rural, 41.8% urban) was much higher than the rates seen in Tamil Nadu in the IDSP survey (39.7% rural, 31.7% urban)5. The hypertension rates among adults 30-64 yr of age were 28 per cent in the urban area and 17 per cent in the rural area as compared to the pooled estimates of 33 and 25 per cent among adults ≥18 yr for India and 32 and 21 per cent specifically for south India21. A significant difference in hypertension was observed between urban and rural populations which was not seen in the IDSP survey5.
The prevalence of diabetes in this study from Vellore (11.2% rural, 23.6% urban) was higher than the results for Tamil Nadu in the multi-centric ICMR-INDIAB study (7.8% rural, 13.7% urban)22. The proportion of participants in the current study who reported being on treatment for diabetes (5.9% rural, 15.3% urban) was much higher than that reported in the 2007-2008 IDSP survey from Tamil Nadu (1.8% rural, 4.5% urban)5.
Awareness of the presence of diabetes and hypertension was lesser among rural participants than urban, with the likelihood of being on medication higher for those with diabetes and for females, the results being similar to the survey in Kerala3. The high prevalence of diabetes among both rural and urban participants in our study confirmed the higher rates among south Indian populations3,5.
The prevalence of overweight/obesity was high in both the rural and urban areas with a marked difference between the rural and urban areas, probably reflecting lifestyle differences and economic situation, as was seen by the higher risk among persons with higher education. In our study, 54 per cent were overweight/obese in urban Vellore, compared to 40 per cent in a multi-site survey from urban India23 and 36.9 per cent (men) and 38 per cent (women) worldwide24. As seen in most studies, overweight and obesity were more common in females, with 61 per cent of urban females in this study having a BMI of 25 kg/m2 or more. It is alarming that 40 per cent of rural participants and 70 per cent of urban participants were centrally obese, an important risk factor for diabetes and CHD. The rate of overweight and mean waist circumference in our study were higher than the rates reported in Tamil Nadu in the IDSP report5. This reflected the variations within a state, as the districts in these two surveys were different. The rates of hypercholesterolaemia in our study were higher than reported for Tamil Nadu from the ICMR-INDIAB; however, the rates of hypertriglyceridaemia and low HDL were similar25. Adjusting for other risk factors, male sex was significantly associated with high triglycerides and female sex with low HDL, as was also seen in the ICMR-INDIAB study25. We also found a significant urban-rural variation in hypercholesterolaemia, hypertriglyceridaemia and low HDL, which was not found in the multi-centric lipid study25.
Interestingly, scheduled caste status was found to be independently associated with diabetes, hypertension and diabetes, even after controlling for age, sex, education and residence. This points to the need for further confirmative and exploratory studies. The prevalence of metabolic syndrome in this study (32.3% rural, 56.7% urban) was higher than other studies in this region (36% among rural women in Thiruvallur using the modified National Cholesterol Education Program, the Adult Treatment Panel-III criteria with waist circumference cut-off 85 cm, 25.8% in Chennai according to the IDF criteria)26,27, comparisons being limited by the use of different criteria. One study among an industrial urban male population in Chennai28 which used criteria similar to the harmonized criteria15 showed a prevalence of 51.4 per cent, comparable to the prevalence in the urban sample in our study. The prevalence of metabolic syndrome in our urban sample was also higher than urban Orissa (33.5%)29, both studies used the same diagnostic criteria15.
The low consumption of fruits and vegetables in Tamil Nadu as compared to other States5 was confirmed in the present study with the lowest consumption seen in rural females. The high prevalence of physical inactivity (43.3% rural, 62.6% urban) in our study was comparable to the results from Tamil Nadu in the ICMR-INDIAB-5 study (55.4% rural, 71% urban)30.
The response rates in the study were higher for women, reflecting the attitude and motivation of women who were more willing to come for screening. However, this was not due to the process of random selection, as in both the rural and urban areas, all members of the selected households were recruited. The high prevalence of risk factors may also be influenced by a possible bias due to non-response. The generalizability of the results was restricted as only one rural block and one city in Tamil Nadu were studied.
In conclusion, the high prevalence of diabetes and hypertension along with the low awareness of individuals about their problems is worrisome. This needs to be effectively addressed by health care professionals. Health education regarding the need for screening should also be accompanied by primary prevention in the form of lifestyle interventions targeting diet, physical activity, smoking and alcohol in both rural and urban areas. Although there is some variation in prevalence estimates obtained from both across and within States in India using the WHO-STEPS method, all evidence points to the high burden of risk factors for NCDs, warranting further concerted efforts for prevention and control.
Footnotes
Conflicts of Interest: None.
References
- 1.World Health Organization. Non Communicable Diseases Country Profile. 2014. [accessed on October 24, 2016]. Available from: http://www.who.int/nmh/publications/ncd-profiles-2014/en/
- 2.Shah B, Mathur P. Surveillance of cardiovascular disease risk factors in India: the need and scope. Indian J Med Res. 2010;132:634–42. doi: 10.4103/0971-5916.73420. [DOI] [PMC free article] [PubMed] [Google Scholar]
- 3.Thankappan KR, Shah B, Mathur P, Sarma PS, Srinivas G, Mini GK, et al. Risk factor profile for chronic non-communicable diseases: results of a community-based study in Kerala, India. Indian J Med Res. 2010;131:53–63. [PubMed] [Google Scholar]
- 4.World Health Organization. STEPwise approach to surveillance (STEPS) [accessed on October 24, 2016]. Available from: http://www.who.int/chp/steps/en/
- 5.National Institute of Medical Statistics, Indian Council of Medical Research (ICMR), 2009, IDSP. Non-Communicable Disease Risk Factors Survey, Phase-I States of India, 2007-08. [accessed on October 24, 2016]. Available from: http://www.icmr.nic.in/final/IDSP-NCD%20Reports/Phase-1%20States%20of%20India.pdf .
- 6.Anjana RM, Pradeepa R, Deepa M, Datta M, Sudha V, Unnikrishnan R, et al. The Indian Council of Medical Research-India Diabetes (ICMR-INDIAB) study: methodological details. J Diabetes Sci Technol. 2011;5:906–14. doi: 10.1177/193229681100500413. [DOI] [PMC free article] [PubMed] [Google Scholar]
- 7.Deepa M, Pradeepa R, Anjana R, Mohan V. Noncommunicable diseases risk factor surveillance: experience and challenge from India. Indian J Community Med. 2011;36(Suppl 1):S50–6. doi: 10.4103/0970-0218.94709. [DOI] [PMC free article] [PubMed] [Google Scholar]
- 8.Bhagyalaxmi A, Atul T, Shikha J. Prevalence of risk factors of non-communicable diseases in a district of Gujarat, India. J Health Popul Nutr. 2013;31:78–85. doi: 10.3329/jhpn.v31i1.14752. [DOI] [PMC free article] [PubMed] [Google Scholar]
- 9.Bhardwaj SD, Shewte MK, Bhatkule PR, Khadse JR. Prevalence of risk factors for non-communicable disease in a rural area of Nagpur district, Maharashtra – A WHO STEP wise approach. Int J Biol Med Res. 2012;3:1413–8. [Google Scholar]
- 10.Oommen AM, Abraham VJ, George K, Jose VJ. Rising trend of cardiovascular risk factors between 1991-1994 and 2010-2012: A repeat cross sectional survey in urban and rural Vellore. Indian Heart J. 2016;68:263–9. doi: 10.1016/j.ihj.2015.09.014. [DOI] [PMC free article] [PubMed] [Google Scholar]
- 11.World Health Organization. Obesity: preventing and managing the global epidemic. Report of a WHO consultation (TRS894) Geneva: World Health Organization (WHO); 2000. [PubMed] [Google Scholar]
- 12.World Health Organization, Western Pacific Region, International Association for the Study of Obesity and the International Obesity Task Force. The Asia Pacific perspective: Redefining obesity and its treatment. 2000. [accessed on October 24, 2016]. Available from: http://www.wpro.who.int/nutrition/documents/docs/Redefiningobesity.pdf?ua=1 .
- 13.Chobanian AV, Bakris GL, Black HR, Cushman WC, Green LA, Izzo JL, Jr, et al. The Seventh Report of the Joint National Committee on Prevention, Detection, Evaluation, and Treatment of High Blood Pressure: the JNC 7 report. JAMA. 2003;289:2560–72. doi: 10.1001/jama.289.19.2560. [DOI] [PubMed] [Google Scholar]
- 14.World Health Organization. Prevention of Cardiovascular Disease. Guidelines for assessment and management of cardiovascular risk. Geneva: Switzerland; 2007. [accessed on October 24, 2016]. Available from: http://www.who.int/cardiovascular_diseases/publications/Prevention_of_Cardiovascular_Disease/en/ [Google Scholar]
- 15.Alberti KG, Eckel RH, Grundy SM, Zimmet PZ, Cleeman JI, Donato KA, et al. Harmonizing the metabolic syndrome: a joint interim statement of the International Diabetes Federation Task Force on Epidemiology and Prevention; National Heart, Lung, and Blood Institute; American Heart Association; World Heart Federation; International Atherosclerosis Society; and International Association for the Study of Obesity. Circulation. 2009;120:1640–5. doi: 10.1161/CIRCULATIONAHA.109.192644. [DOI] [PubMed] [Google Scholar]
- 16.Trinder P. Determination of glucose in blood using glucose oxidase with an alternative oxygen receptor. Ann Clin Biochem. 1969;6:24–7. [Google Scholar]
- 17.Siedel J, Hägele EO, Ziegenhorn J, Wahlefeld AW. Reagent for the enzymatic determination of serum total cholesterol with improved lipolytic efficiency. Clin Chem. 1983;29:1075–80. [PubMed] [Google Scholar]
- 18.Fossati P, Prencipe L. Serum triglycerides determined colorimetrically with an enzyme that produces hydrogen peroxide. Clin Chem. 1982;28:2077–80. [PubMed] [Google Scholar]
- 19.Geethanjalai FS, Fleming J, Swaminathan S, Selvakumar R. External quality assurance-role of ACBI/CMC scheme. Indian J Clin Biochem. 2006;21:211–2. doi: 10.1007/BF02913101. [DOI] [PMC free article] [PubMed] [Google Scholar]
- 20.Bennett S, Woods T, Liyanage WM, Smith DL. A simplified general method for cluster-sample surveys of health in developing countries. World Health Stat Q. 1991;44:98–106. [PubMed] [Google Scholar]
- 21.Anchala R, Kannuri NK, Pant H, Khan H, Franco OH, Di Angelantonio E, et al. Hypertension in India: a systematic review and meta-analysis of prevalence, awareness, and control of hypertension. J Hypertens. 2014;32:1170–7. doi: 10.1097/HJH.0000000000000146. [DOI] [PMC free article] [PubMed] [Google Scholar]
- 22.Anjana RM, Pradeepa R, Deepa M, Datta M, Sudha V, Unnikrishnan R, et al. Prevalence of diabetes and prediabetes (impaired fasting glucose and/or impaired glucose tolerance) in urban and rural India: phase I results of the Indian Council of Medical Research-INdia DIABetes (ICMR-INDIAB) study. Diabetologia. 2011;54:3022–7. doi: 10.1007/s00125-011-2291-5. [DOI] [PubMed] [Google Scholar]
- 23.Singh RB, Pella D, Mechirova V, Kartikey K, Demeester F, Tomar RS, et al. Prevalence of obesity, physical inactivity and undernutrition, a triple burden of diseases during transition in a developing economy. The Five City Study Group. Acta Cardiol. 2007;62:119–27. doi: 10.2143/AC.62.2.2020231. [DOI] [PubMed] [Google Scholar]
- 24.Ng M, Fleming T, Robinson M, Thomson B, Graetz N, Margono C, et al. Global, regional, and national prevalence of overweight and obesity in children and adults during 1980-2013: a systematic analysis for the Global Burden of Disease Study 2013. Lancet. 2014;384:766–81. doi: 10.1016/S0140-6736(14)60460-8. [DOI] [PMC free article] [PubMed] [Google Scholar]
- 25.Joshi SR, Anjana RM, Deepa M, Pradeepa R, Bhansali A, Dhandania VK, et al. Prevalence of dyslipidemia in urban and rural India: the ICMR-INDIAB study. PLoS One. 2014;9:e96808. doi: 10.1371/journal.pone.0096808. [DOI] [PMC free article] [PubMed] [Google Scholar]
- 26.Selvaraj I, Gopalakrishnan S, Logaraj M. Prevalence of metabolic syndrome among rural women in a primary health centre area in Tamil Nadu. Indian J Public Health. 2012;56:314–7. doi: 10.4103/0019-557X.106423. [DOI] [PubMed] [Google Scholar]
- 27.Deepa M, Farooq S, Datta M, Deepa R, Mohan V. Prevalence of metabolic syndrome using WHO, ATPIII and IDF definitions in Asian Indians: the Chennai Urban Rural Epidemiology Study (CURES-34) Diabetes Metab Res Rev. 2007;23:127–34. doi: 10.1002/dmrr.658. [DOI] [PubMed] [Google Scholar]
- 28.Kaur P, Radhakrishnan E, Rao SR, Sankarasubbaiyan S, Rao TV, Gupte MD. The metabolic syndrome and associated risk factors in an urban industrial male population in South India. J Assoc Physicians India. 2010;58:363–6, 371. [PubMed] [Google Scholar]
- 29.Prasad DS, Kabir Z, Dash AK, Das BC. Prevalence and risk factors for metabolic syndrome in Asian Indians: a community study from urban Eastern India. J Cardiovasc Dis Res. 2012;3:204–11. doi: 10.4103/0975-3583.98895. [DOI] [PMC free article] [PubMed] [Google Scholar]
- 30.Anjana RM, Pradeepa R, Das AK, Deepa M, Bhansali A, Joshi SR, et al. Physical activity and inactivity patterns in India – Results from the ICMR-INDIAB study (Phase-1) [ICMR-INDIAB-5] Int J Behav Nutr Phys Act. 2014;11:26. doi: 10.1186/1479-5868-11-26. [DOI] [PMC free article] [PubMed] [Google Scholar]


