

Abstract
Neurodegenerative diseases are a heterogeneous group of disorders that are characterized by the progressive dysfunction and loss of neurons. Here, we distil and discuss the current state of modeling in the area of neurodegeneration, and objectively compare the gaps between existing clinical knowledge and the mechanistic understanding of the major pathological processes implicated in neurodegenerative disorders. We also discuss new directions in the field of neurodegeneration that hold potential for furthering therapeutic interventions and strategies.
BACKGROUND
Neurodegenerative diseases (ND) are complex disorders that result in progressive degeneration and death of nerve cells. As neurons deteriorate, symptoms such as difficulties with movement (ataxias, dyskinesias, and akinesias) and mental function (dementias) begin to manifest and progressively worsen. These debilitating conditions are incurable and exert a tremendous burden upon affected individuals, their families, and on society as a whole. Moreover, the incidence of these disorders is increasing with life expectancies in both developed and developing countries. Hence, there is now an urgent need for novel therapies to either halt or reverse the progression of these disorders.
To date, numerous molecular and cellular events contributing to these disorders have been elucidated. However, since neurodegeneration is a complex heterogeneous process, the molecular mechanisms underlying its initiation or propagation are still not very well characterized, despite the availability of extensive data and both in vitro and animal models. Furthermore, mounting evidence suggests that many ND conditions overlap at multiple levels,1, 2 i.e., they share similar dysfunctional phenotypes. For example, many neurodegenerative diseases are associated with the occurrence of disease‐specific misfolded aggregated proteins and peptides in damaged neurological tissues. It is still unclear whether the formation of aggregates is the cause or consequence of neurodegeneration, which raises the question of whether blocking this aggregation therapeutically would be beneficial or harmful? This increasingly recognized clinical and pathological overlap across different ND disorders has not only made the clinical diagnoses of these conditions difficult, but has also hampered the development of drugs that could broadly halt neuronal loss in humans.3, 4
The lack of information regarding the relative importance of contributing molecular components and processes within existing knowledge is the major obstacle in the systems‐level understanding of these complex disorders. This is reflected in the difficulties with clinical diagnosis and drug development. Systems modeling provides a means to integrate existing knowledge about these processes as a sequence of events, and is used to elucidate complex and dynamic crosstalk between multiple biological processes. Therefore, the systems modeling approach is being used to investigate the molecular and cellular mechanisms involved in the pathophysiology of complex multietiological diseases; it is increasingly being used to better characterize, understand, and predict pharmacological modulation of biological targets in a quantitative manner.5, 6, 7 Furthermore, pharmaceutical industries rigorously prioritize a model‐informed drug discovery and development (MID3) framework, for prediction and extrapolation, aimed at improving the quality, efficiency, and cost‐effectiveness of decision‐making.
Considering the complex heterogeneity of neurodegeneration, efforts on a systems‐level understanding of the disease using mathematical modeling approaches are being undertaken. The available models of neurodegeneration, developed at different biological scales, provide insights into the mechanisms underlying the pathogenicity involving multiple pathways. With a particular focus on Alzheimer's (AD) and Parkinson's (PD) disease, we collected 89 mathematical models from the literature, developed over the past two decades, which describe different aspects of neurodegeneration in AD and PD. Besides analyzing the model space in neurodegeneration, we also encoded several of these models using the standard model description language: Systems Biology Markup Language (SBML). These models can be accessed from BioModels,8, 9 a public repository containing models of biological and biomedical processes.
The mechanisms elucidated from these models, combined with understanding gained from the literature and other resources on neurodegeneration, enables us to highlight the gap between existing clinical or experimental knowledge and the mechanistic description of the processes underlying it. This gap in the existing knowledge and the mechanistic understanding allows us to probe into the mechanisms that are not well characterized and in the process expand the current knowledgebase of ND modeling. This work, the first comprehensive review in the field, aims to provide an information resource, forming a base for further development of integrated models for describing ND processes. We also discuss new avenues for research and conclude by addressing open challenges in the field.
BIOLOGY OF NEURODEGENERATION AND ASSOCIATED MATHEMATICAL MODELS
Neurodegeneration is a complex multifactorial disease and several reviews discuss the molecular processes involved in the initiation and progression of the disease.1, 2 Mizuno et al.10 and Fujita et al.11 have integrated the molecular processes associated with AD and PD from the literature, and have generated comprehensive interaction maps for AD (AlzPathway) and PD (PDMap), respectively. In this analysis, we review 89 mathematical models that describe the molecular mechanisms underlying the pathogenesis of AD and PD, or in general neurodegenerative disorder. The models were collected by simple keyword search in reference literature databases such as PubMed and Europe PMC. We used combinations of complex, generic, and specific terms associated with mathematical modeling, neurodegeneration and disease mechanism to capture the ND related models from the literature.
In this section, we briefly discuss the molecular processes involved in different aspects of ND pathology and describe the few selected mathematical models that are developed to understand the mechanism underlying these pathological processes. The entire list of 89 models, their purpose for development, and their mechanistic descriptions are detailed in the Supplementary Material (Table SI1). We discovered that for certain aspects of ND, where there is substantial experimental knowledge on molecular processes, the mechanistic understanding is lacking. The gap between experimental/clinical knowledge and mechanistic description is discussed in later sections.
PROTEIN AGGREGATION
Neurodegeneration is often associated with the accumulation of disease‐specific misfolded aggregated proteins in different areas of the aging brain, causing cell death and inflammatory damage. This phenomenon is the outcome of several dysregulated molecular processes including protein cleavage, folding, and clearance. Dysregulation of amyloid precursor protein (APP) cleavage causes Aβ (β‐amyloid) aggregation in AD, which is believed to have neurotoxic effects. APP cleavage kinetics, Aβ clearance, and the Aβ aggregation process in AD have been extensively studied using mathematical models.12, 13, 14 Another prominent feature in AD is Tauopathy, which is the accumulation of hyperphosphorylated Tau proteins; excessive Tau phosphorylation affects microtubule‐mediated transport within neurons, resulting in aggregation of Tau as pathological neurofibrillary tangles in the somatodendritic compartment. The regulation of Tau phosphorylation and the conditions that lead to Tau protein aggregation have been mechanistically investigated by various groups.15, 16, 17, 18
The hallmark of PD is the formation of intracellular inclusion bodies composed of α‐synuclein (α‐Syn). When α‐Syn levels are high, they tend to misfold and aggregate into fibrils, protofibrils, and eventually Lewy bodies. The interplay between oxidative stress and α‐Syn kinetics,19 failure of α‐Syn degradation machinery causing α‐Syn aggregation,20 α‐Syn transport in axons under normal and diseased state,21 and various other factors regulating α‐Syn aggregation in PD have all been studied using mathematical models.22, 23
Protein aggregates are also featured in other neurodegenerative diseases: Pick bodies are prevalent in Pick's disease, nuclear aggregates appear in Huntington's disease (HD), modified prion protein accumulates in Creutzfeldt‐Jacob disease, and superoxide dismutase accumulates in familial amyotrophic lateral sclerosis (ALS).
The counter mechanism to handle protein aggregates involves the use of clearance processes such as protein refolding, degradation, or transport across the blood–brain barrier. These clearance operations have been found to be impaired under ND conditions. The misfolded aggregates are not only resistant to degradation but also disrupt proteasome function, which is illustrated in Figure 5 a. The mechanisms underlying the dysregulation of clearance processes in AD, PD, and in other ND have been investigated using mathematical models.19, 20, 24, 25, 26
Figure 5.

Mechanistic description of aggregation and APP breakdown in ND: Potential future direction. (a) The “fibril organization” process is well characterized using mathematical models: Here, we represent the formation of protein aggregation in three stages, native proteins→misfolded proteins→aggregated proteins for AD, ND in general, and PD. The mechanism of formation of 1) Aβ aggregates specific to AD (pink panel); 2) amyloid aggregates (i.e., proteins that can form aggregates) in ND conditions in general (light green panel); and 3) α‐Syn aggregates specific to PD (light yellow panel) are represented as SBGN Process Description. The aggregates are resistant to degradation and disrupt proteasome function, which is illustrated as a thin arrow and inhibition curve, respectively. The detailed biological description of the individual processes and the corresponding model references are in Box 1. (b) Certain aspects of the “APP breakdown” process lack mechanistic knowledge. The transmembrane protein APP can be processed through four different routes: 1) it may remain at the cell surface; 2) be internalized and recycled or degraded; 3) cleaved via the nonamyloidogenic α‐pathway; 4) or cleaved via the amyloidogenic β‐pathway. The reactions are illustrated as SBGN Activity Flows. Modeled events are colored in green. The components that are colored red illustrate the gap between the experimental knowledge and the mechanistic understanding. In other words, red denotes the phenomenon for which the mechanism of action is unclear. The detailed biological description with associated references is in Box 2.
METABOLISM, CELLULAR STRESS, AND NEUROTRANSMISSION
In the brain, glucose metabolism is the primary energy source for neurons. Dysregulation of the energy metabolism process has been implicated to play a key role in neuronal death. A mathematical model formulated to study the role of α‐ketoglutarate dehydrogenase complex in neuronal energy metabolism suggests that it has a strong influence on energy metabolism in neurons via ATP and reactive oxygen species (ROS) generation.27 Several models that describe the mechanism of dysregulation in neuronal energy metabolism,28 and metabolic balance in the brain that includes the activation of glycogen breakdown in astrocytes during sensory stimulation,29 suggest that the control of energy metabolism and transport processes is critical in the metabolic behavior of cerebral tissue.
Oxidative stress is another key process involved in neurotoxicity. Oxidative stress is closely linked with mitochondrial energy metabolism and is known to favor the amyloid peptide aggregation process in neurons. The mechanism underlying the basic mitochondrial processes such as energy metabolism, free‐radical generation, specific interactions of disease‐related proteins with mitochondria, or its dysfunction leading to generation of oxidative stress have been investigated using mathematical models.19, 30, 31, 32 Additionally, oxidative stress and various other cellular insults trigger the apoptotic pathway in neurons leading to cell death,11 and these processes have been extensively studied using mathematical models to determine the key elements of apoptotic machinery in ND.26, 33, 34, 35 Ion homoeostasis and synaptic transmission are two key operations in regulating the electrochemical stimulation of neurons. These two processes are interrelated and also directly influenced by energy metabolism. Several models have been developed to understand the role of ion homoeostasis and synaptic transmission in ND.36, 37, 38
GENETICS AND CELL CROSSTALK
Studies on the underlying mechanisms of aberrant ND processes also reveal a genetic component to the disease. Increasing evidence is emerging about the role of genetic factors, such as apolipoprotein E (ApoE) allele variation, in the disease pathology. The interplay between the effects of variations in the ApoE allele and the inflammation dynamics in AD has been studied using a mathematical model, which suggests that a late onset peak of Aβ in the ApoE4 case lead to localized neuronal loss, which could be improved by application of short‐term proinflammatory mediators.39 Chronic activation of the brain immune cell, microglia, is believed to impair survival‐related processes leading to decreased protein synthesis and cellular energy, which affect neurotransmitter concentrations and neuronal activity in general. Dunster et al.40 developed a mathematical model to understand the inflammatory process by studying the crosstalk between neutrophils and macrophages. The model suggested that the therapeutic manipulation of the rate of macrophage phagocytosis could aid in reducing inflammation, but that it may depend on the neutrophil apoptosis. Along these lines, the mechanisms underlying the aggregation of microglia and formation of local accumulation of chemicals observed in AD senile plaques have been investigated to understand the inflammation‐associated pathology in AD.41 Inflammatory activation of microglia plays a key role in the progression of neurodegeneration. Proctor et al. and Puri et al. have formulated mathematical models that postulate microglia as a potential target for the prevention and treatment of AD.34, 35
SIGNALING NETWORKS
Over the years, experimental investigations on understanding ND pathology implicated several abberant signaling pathways as being involved in neurodegeneration (supporting references are provided in Supplementary Information SI‐3):
Mitogen‐activated protein kinase (MAPK) signaling induces hyperphosphorylation of Tau proteins via APP cleavage processing.
Tau protein aggregation is also induced by mTOR (mammalian target of rapamycin) signaling via the autophagy process. Neurotrophin signaling activates receptors (p70/Trk), triggering cyclic AMP‐response element binding (CREB), a transcriptional factor involved in synaptic plasticity.
CREB is also activated by other signals such as oxidative stress and β‐secretase.
Activated JAK2/STAT3 pathway has been shown to protect neurons from Aβ toxicity in AD.
The insulin signaling pathway is responsible for glucose metabolism and is a key process in ND. Neurons are sensitive to glucose metabolism and a disruption in this process can be toxic.
Retinoic acid signaling pathways are also reported to be involved in ND pathogenesis.
Melanocortin signaling can influence synaptic plasticity and is known to be deregulated in AD.
Despite the availability of significant experimental evidences on the role of signaling networks in ND pathology, there are currently no efforts invested in the mechanistic understanding using mathematical models in the context of ND.
LIPID‐RELATED PROCESSES AND CELL SURVIVAL MECHANISMS
Other factors involved in ND pathology have been identified within lipid pathways, metabolic processes, and generic cell survival processes (supporting references are provided in Supplementary Information SI‐3):
Ceramide, a lipid second messenger induces Aβ aggregation in AD.
Arachidonic acid, a free fatty acid triggers neurotoxicity through several mechanisms—by inducing apoptosis, generating oxidative stress, and promoting Tau polymerization.
Membrane microdomains called lipid rafts are rich in cholesterol and sphingolipids. These lipid rafts in neurons are known to influence Aβ production, aggregation, and toxicity in AD.
The cell cycle is also known to influence ND pathology; Aβ activates a noncanonical DNA replication pathway that triggers p53‐dependent apoptosis in AD.
The extracellular matrix is another component known to influence genesis, survival, migration, and toxicity in neurons.
Vitamin K‐dependent proteins such as Gas6 are known to regulate several functions of glial cells and neurons including chemotaxis, myelination, and potentially cell death.
The c‐Jun N‐terminal kinases (JNKs) induce neuronal death by triggering apoptosis in ND diseases.
In spite of abundant experimental knowledge, there are no mathematical models formulated to understand the underlying mechanism of the above processes.
LANDSCAPE OF MODELS DESCRIBING ND PROCESSES
The molecular biology of neurodegeneration has been extensively studied, providing detailed information about the key players involved, and the systems‐level understanding of these key players using predictive mathematical models is also rapidly increasing. This encourages a consolidated analysis of the two knowledge sources, where comparison between the existing mathematical models and available knowledge of ND processes may lead to valuable insights.
We constructed a landscape of ND‐related molecular processes using the mechanisms described in our collection of 89 models (Figure 1). To link the molecular processes described in different models, we referred to the AlzPathway10 and the PDMap,11 the knowledge‐driven inter‐ and intracellular molecular interaction map of AD and PD, respectively. The objectives of generating this model landscape map are 3‐fold. First, we wanted to obtain an overview of the coverage of mathematical models describing the processes underlying neurodegeneration. Second, we wished to identify patterns in the description of processes involved in neurodegeneration through mathematical modeling, which project the potential scope in the field. Third, this visualization could serve as a reference map for researchers to guide future work. To the best of our knowledge, this is the first attempt to collectively analyze the mathematical models describing different aspects of ND processes, and this may aid in focusing activities on untouched areas and in building composite models in the field of neurodegeneration.
Figure 1.

Model space in neurodegeneration—model landscape map. Cellular and molecular processes of ND that are described in our collection of 89 models are presented here. It is an abstract representation of the processes involved, i.e., only important mechanisms of each process are shown for better visualization. Boundaries of subcellular organelles are represented as solid lines, cell boundaries as thick solid lines, and the blood–brain barrier as thick dashed lines. The 15 biological processes associated with ND that the models describe are in capital bold red font. The models falling under each of these processes are displayed as numbers (from 1 to 89) and are listed on the right; the bibliographic reference numbers to these models are within square brackets. The density of distribution of models belonging to each process is illustrated as color gradients (gradient definition is provided in the figure). An interactive version of this map is available from the ND specific page of BioModels8.
To generate the landscape (Figure 1), neurodegeneration‐related molecular processes were categorized into 15 different functional modules using the mechanisms described in our model collection. Owing to spatial constraints, we represent only the core regulations of the molecular processes, limited to important components. The models are formulated based on the assumption that cellular processes are modular in nature, allowing convenient classification of the models into different categories based on Gene Ontology biological processes: “inflammatory response,” “intercellular signaling,” “oxidative metabolism,” “energy metabolism,” “apoptosis,” “ion homoeostasis,” “synaptic transmission,” “blood–brain barrier transport,” “protein degradation,” “protein refolding,” “fibril organization,” “Tauopathy,” “APP breakdown,” “microtubule‐based transport,” and “genetics.” The models are distributed in the map based on the processes they describe. Each process is colored with an intensity that is proportional to the number of models in that module.
The consensus clinical indication of neurodegeneration is misfolding, aggregation, and accumulation of disease‐specific proteins in the brain, resulting in neuronal apoptosis. This is reflected in modeling studies (Figure 1), where several groups attempted to understand the mechanism underlying “fibril organization.” While the proteins that misfold are disease‐specific, they may have a common mechanism of formation of these fibrils, and hence, this has been extensively investigated. Mechanisms of neuron stimulation and ROS generation, grouped under “oxidative stress” and “synaptic transmission,” respectively, are the next most highly studied ND processes. On the contrary, “microtubule‐based transport,” “protein refolding,” “intercellular signaling,” and “genetics” have fewer models.
Mathematical models in biology include several features such as molecular entities considered, theoretical/empirical approach, and source of empirical data, which dictate their complexity, robustness, and biological validity. To summarize the complexity and validity of the 89 ND models in our list, we generated a model‐process interaction network (Figure 2 a). We observe a range of distinct properties across the 89 models including processes modeled, number of molecular components considered, and empirical calibration. Models in the network can be divided into two classes: those involving multiple ND processes (shared models) and those dedicated to a single process (exclusive models). The “fibril organization,” “APP breakdown,” and “synaptic transmission” processes have the most exclusive models. This may be due to the fact that these processes are specifically aberrant in ND and deserve closer attention to study the underlying mechanisms and their kinetics. Also, “fibril organization” has the highest number of exclusive models, most of which have been calibrated with empirical data from human cells/tissues, which indicates the high robustness and biological validity of these models. The models belonging to this category are relatively simple and small, with fewer molecular entities; owing to the fact that the fibrillation mechanism in ND is known to involve only a few molecules that are specific to the type of the ND condition. By analyzing the shared models, we observed varied degrees of association between the different ND processes (Figure 2 b). The association between “fibril organization,” “protein degradation,” and “oxidative stress” processes are frequent. In contrast, processes such as “microtubule‐based transport” and “protein refolding” are less studied in combination with other ND processes. Details of the ND processes and their associations in the 89 models are provided in Supplementary Table SI1.
Figure 2.

Model‐process network in ND. (a) The 89 models describing the 15 different ND‐related processes are presented as a network graph using Cytoscape 3.4. The models and processes are represented as circles and diamonds, respectively. The size of the circle reflects the model size, i.e., the number of molecular components. Theoretical models (no empirical data) are colored yellow. Models validated using human and nonhuman data are colored pink and green, respectively. The size of the diamond (process) reflects the number of models belonging to that process. Each model is connected to the process(es) it describes. (b) Number of shared models between processes. This illustrates the degree of association between different processes. The data used in these figures are provided in Supplementary Table SI1.
Among the 89 mathematical models that we considered in this analysis, 51 models are exclusive, i.e., they are built to describe a particular ND process. We wanted to investigate if there were any redundant efforts in describing the same mechanism. In order to perform this analysis, we chose to analyze the molecular components of the exclusive models of “fibril organization,” “APP breakdown,” and “synaptic transmission,” as these processes have the most exclusive models (Figure SI2). The rationale for considering only the exclusive models is to analyze each process separately. The results show that models studying exclusively the “APP breakdown” process have high redundancy (more overlap), while models exclusively investigating “synaptic transmission” are more unique in their molecular entities. The “fibril organization” process show only moderate model redundancy despite having more exclusive models and the model structure being very small. This is because: “fibril organization” being the major clinical indication of diverse ND, the mechanism of fibril formation has been studied for different molecules, e.g., Aβ, α‐Syn, etc., and their variants.
In summary, we infer that the 89 models in our list are specific (with certain degree of overlap) in their size (number of molecular entities included), nature of study (theoretical/empirical), empirical data source (human/nonhuman), and process studied (exclusive/shared). Taken together, this indicates the varied degrees of mechanistic insights gained using these models on different aspects of neurodegeneration, the integration of which can potentially be a step forward to understand ND pathology.
EVOLVING HETEROGENEOUS NATURE OF ND MODELS
The expanding knowledge of ND mechanisms and the consequent growing model numbers in neurodegeneration has resulted in a wide range of diverse data. A holistic analysis of ND mathematical models is required to obtain insights into modeling trends. To determine the nature, evolution, and pattern of mathematical modeling in describing ND processes, we investigated several aspects of the available ND models. This includes their chronology, pathology studied, study organism, modeling methods, and tools used. Supplementary Table SI1 provides this information for each of the models included in our analysis.
An analysis of model chronology illustrates that the mathematical modeling of neurodegeneration has become more heterogeneous with respect to the processes described (Figure 3 a). One of the earliest models of neurodegeneration in 1986 described only the “synaptic transmission” mechanism. By 2000, there were six processes, which include “synaptic transmission,” “apoptosis,” “ion homoeostasis,” “fibril organization,” “oxidative stress,” and “APP breakdown.” This addition of new processes to ND disorders indicates the emergence of new knowledge in the domain during the intervening period and hence the modeling studies to understand the underlying mechanisms. To date (2016), the mechanistically studied molecular processes of neurodegeneration fall under 15 biological processes. This count may increase in the years to come.
Figure 3.

Evolving heterogeneous nature of ND models. (a) This plot shows the chronological evolution of mathematical models describing different ND processes developed over the past two decades in 5‐year increments. The size of the transparent bubble at each timepoint is proportional to the number of the models present at that time. The colored bubbles within represent different processes that have models and their size indicates the number of models describing the associated process. The number in brackets adjacent to each process indicates the total number of models describing the process. (b) This heat map shows a comparison between the 15 processes and the diseases for which the mechanisms are described using models. As this review is focused on AD and PD, our model collections are biased towards AD and PD models. There are three categories of diseases, AD, PD, and other ND. “Other ND” includes generic ND conditions (not specific to any particular disease), HD, prion disease, and ALS. The absolute model numbers are shown in red within the boxes. (c) This stacked bar chart depicts the diversity of the taxonomies, software and modeling approaches used in describing ND models (Supplementary Material Table SI1). The vertical axis represents the percentage of each component while the absolute numbers are indicated within brackets. ODE, Ordinary Differential Equations; SDE, Stochastic Differential Equations; PDE, Partial Differential Equations; FBA, Flux Balance Analysis.
Among the 15 ND processes upon which the models are classified (Figure 3 b), the majority have been studied in the context of AD. While this review discusses mathematical modeling of neurodegeneration with a particular focus on AD and PD, we also consider models that study generic ND mechanism such as protein aggregation and ion homoeostasis. This has resulted in the inclusion of a few other ND disorders including prion disease, HD, and ALS. Bearing in mind the interest of this study, we used only three disease categories: “AD,” “PD,” and “other ND.” Generic models and those models describing the mechanisms that underlie diseases other than AD and PD are thus grouped under “other ND.” Our results show that several processes are modeled in the context of AD, with “APP breakdown” and “fibril organization” being the most‐studied mechanisms. For PD, the most extensively investigated mechanisms are “fibril organization” and “oxidative stress.” “Fibril organization,” the consensus clinical indication of most ND, is also the most extensively studied process in the “other ND” category.
Next, we analyzed the statistics of ND model attributes (Figure 3 c). Model studies include validating experiments on several organisms including human, mouse, rat, hamster, monkey, dog, and cat. Experiments in these organisms are reported as being of different biological scales including in vitro, cell culture, tissues, in vivo, and clinical. The majority of available model parameters are taken from experiments performed in human (Homo sapiens). However, we observe that more than half of the modeling studies are theoretical, and therefore without empirical validation. Together, these factors define the complexity, robustness, and validity of the models of ND. A visual representation of this information is provided in Figure 2 a. Among the various modeling approaches used, we found that ordinary differential equations (ODEs) were the predominant technique. In terms of software implementations, MatLab (MathWorks, Natick, MA) was found to be the most‐used software to solve those equations.
MATHEMATICAL MODELS AND DRUG TARGETS IN ND: PROMISING SCOPE
Mathematical modeling facilitates a systems‐level understanding of biological networks. This holistic approach helps to study the relationship between different components and also to perform qualitative and quantitative analysis of the system. Such comprehensive studies can be quite useful for clinical purposes to identify drug targets or understand off‐target drug effects. The integration of systems biology with pharmacodynamics/pharmacokinetics has led to the emergence of a quantitative systems pharmacology (QSP) approach,5, 7 which permits an understanding of the mechanism of dynamic interactions between drug(s) and a biological system. Furthermore, systems biology studies can fuel the drug repositioning process where novel scope is identified for existing drugs.
Bearing in mind the potential role of mathematical modeling in drug discovery and development, a comparative analysis was performed between the drug‐targets of ND and the processes that have mathematical models. This study informs us about correlations, gaps, and scope for mathematical models in the clinical domain of ND. Information on drugs for ND was obtained from ChEMBL using Human Disease Ontology (DOID) terms. Diseases listed as child terms of “neurodegeneration” in DOID were searched against ChEMBL to fetch the available drugs corresponding to these diseases. A total of 166 clinical drugs targeting 10 ND were retrieved from ChEMBL (Figure 4 a). The drug types include small molecules, proteins, enzymes, and antibodies. The complete list of drug‐target‐disease information is available from Supplementary Table SI1.
Figure 4.
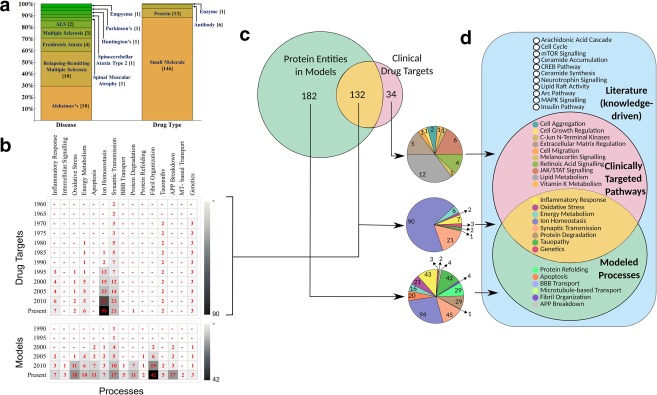
Mathematical models and drug targets in ND. (a) Available drugs for 10 ND conditions obtained from ChEMBL. The stacked bar charts show the distribution of drug type and their target diseases (Supplementary Material Table SI1). (b) Chronological (vertical axis, 5‐year increments) evolution of drug targets discovered in the pathways of the 15 processes that have mathematical models. The two heat maps provided here illustrate the evolution of drug targets and mathematical models against the 15 ND processes, respectively. Cumulative values are displayed in red within the boxes. (c) This section illustrates the relationship between the protein molecules incorporated in the models and drug targets to investigate if there is an overlap. The Venn diagram shows the overlap between the former and latter, and the mutually exclusive sets of molecules that have mathematical models and that are known drug targets. In all, 132 protein molecules belonging to eight ND processes that are already a known target of ND have their pathways described using mathematical models. The pie charts below indicate the process distribution of the unique and overlapping regions (absolute values displayed) of the protein molecules. (d) This Venn diagram shows the comparison of ND processes from the literature (knowledge‐driven) (blue), models (green), and drug‐targets (red).
Analyses show that mathematical models and clinical drugs for ND have chronologically evolved in separate ways. We compared the molecular processes of neurodegeneration that have known drug targets in the corresponding pathways with those that have mechanistic models. Temporal distribution of the former and latter shows different evolution patterns between the processes (Figure 4 b). An obvious difference is the inception—clinical drugs for ND that have been available since 1959, while mathematical models emerge only from 1986. There are significantly fewer mathematical models than clinical drugs for ND. The “ion homoeostasis” process has increasingly been targeted for treating ND patients, i.e., it has the highest number of clinical drugs. This is not surprising, as in general “ion homoeostasis” is an often targeted process in the treatment of most diseases. The next significantly targeted process is “synaptic transmission,” where drugs are administered to regulate the signaling between neurons. Conversely, “fibril organization” is a well characterized mechanism, followed by “oxidative stress” and “synaptic transmission” according to the model space of ND. An interesting similarity between drug‐targeted and modeled ND processes is that historically, “synaptic transmission” was an initial and significant area of interest.
For several clinically targeted ND processes we did not find mathematical models in our list of 89 models. We investigated whether there was an overlap between the drug targets for ND and the molecular entities that have been included in ND models (Figure 4 c). The results show that there exists a range of processes including certain signaling pathways, Jun/Fos transcription, lipid, and vitamin‐K metabolism and cell aggregation, growth, migration that have clinical drugs, but our list does not have models describing these mechanisms in the context of ND. We acknowledge that there are generic models, or models described in other cell types available for some of these processes. However, we do not consider them for our analysis as they do not describe mechanism in brain cells or the dynamics of ND pathology. Note that most of these processes such as cell growth, migration, and extracellular matrix regulation are fundamental for cell survival and we speculate that this may be a reason for not exploring them in an ND context. The physiological roles of these processes in ND pathogenesis have been discussed in the “Biology of neurodegeneration and associated mathematical models” section. On the other hand, we did not find any drugs for some molecular processes that are well characterized using mathematical models (Figure 4 b,c). For example, our query did not fetch any drug from ChEMBL for “fibril organization,” despite it being the consensus clinical indication of most ND, and for which the underlying mechanism are extensively investigated using mathematical models.
Finally, we performed a 3‐way comparative analysis with the available literature on experimental and clinical studies against the processes that have been mechanistically described using mathematical models, and against the processes for which there are approved drugs (Figure 4 d). While no conclusions can be drawn solely based on abundance of publicly available models, it is interesting to note that there is partial overlap between the three knowledge domains. Several processes such as JNK signaling and vitamin K metabolism have been targeted by clinical drugs for ND, but have no mathematical models. On the other hand, Arc pathway and CREB pathway are empirically known to be involved in ND but have not been considered in modeling studies. The current state of mismatch between literature information, mathematical modeling, and clinical drugs may indicate scope for integrating the three knowledge bases to achieve a more complete mechanistic understanding of ND pathogenesis. Alzpathway10 and PDMap11 have developed a knowledge‐driven interaction map for AD and PD, respectively. This comprehensive interaction map can be used as a reference to build mathematical models of processes that have not been investigated so far. Quantitatively analyzing these processes for their role in ND may provide new insights into the pathology of the disease. Furthermore, such studies may aid in the discovery of novel drug targets for ND.
DISCUSSION AND FUTURE DIRECTIONS
The unprecedented and rapidly growing amount of data from in vitro, in vivo, and clinical studies, at the molecular, physiological, and clinical levels, has opened up new horizons in biomedical research. Mathematical modeling plays a vital role in utilizing these large‐scale, multilevel datasets and generating predictive hypotheses, potentially providing significant insights into the mechanism of complex multietiological diseases and drug action. The last two decades have witnessed an exponential increase, both in the number and complexity of models that describe ND processes. The abstract model landscape map (Figure 1), that we have constructed by integrating the mechanisms described in the 89 ND models available in the literature to date, provides an overview of the evolution of models describing heterogeneous ND processes.
To effectively use the growing mathematical models in the literature, it is essential to have a comprehensive repository of models, where the models are verified and stored in standard formats such as SBML. As a part of this work, most models considered for analysis were also encoded in SBML, curated to verify simulated results, and deposited in BioModels,9 a public repository of mathematical models of biological and biomedical systems. The models and the interactive model landscape map (Figure 1) can be accessed from the dedicated ND page.8 This page will be updated on a regular basis as new models in this domain are submitted.
A comparative analysis of existing experimental or clinical knowledge vs. mathematical models developed to understand ND processes has provided key insights into the nature of research in the field. Chronological investigations of models developed over the last two decades (Figure 3 a) shows that the approach of mathematical modeling in ND has evolved from studying single or a few processes in the 1990s to as many as 15 diverse molecular processes today. This development may indicate the realization that ND is a multifactorial disorder, i.e., as the knowledge of molecular and cellular events contributing to ND expanded, more mathematical models may have been formulated to understand the underlying mechanisms. The model landscape map (Figure 1), generated by integrating the mechanism described in our collection of 89 models, clearly illustrates that there are some processes that are densely populated while others are sparse. Furthermore, Figure 2 a depicts the varying complexities and robustness of the models in each process. These multiple factors indicate the different levels of knowledge we have of ND processes. The low degree of mechanistic understanding of certain processes may be due in part to the lack of experimental data and/or of effort in that domain, or of the lack of integration of mathematical models with existing experimental knowledge. For example, Figure 5 b suggests that several steps of the APP breakdown process have not been mechanistically studied using mathematical models. Moreover, this process shows high model redundancy (Figure SI2). Thus, a future direction in understanding APP breakdown mechanism may be to model unknown phenomenon and use well‐characterized existing mechanistic models for integration. The model landscape map (Figure 1) and the model‐process network (Figure 2 a) suggest the need for more mechanistic models to describe certain aspects of ND.
Our analyses of existing models suggest several directions for further investigation by the community. The model coverage of ND processes is heterogeneous, as can be seen in Figure 1 . For instance, there are plenty of models describing the mechanism of “fibril organization” in AD (Aβ), PD (α‐Syn), and in general all ND (amyloid protein) (Figure 5 a). All components involved in this process are mechanistically well characterized. In contrast, there are several domains that have few or no mathematical models at all. Cell aggregation, cell cycle, and signaling pathways such as mTOR, MAPK, and insulin are some of the examples. Diverting attention to these areas may yield a better picture of ND pathogenesis.
Another potentially fruitful approach in ND modeling could be in the construction of unified models. The availability of several models within the same category now permits systematic comparative analysis of the mechanisms described. This may pave the way to develop unified models for each category. As mentioned earlier, “fibril organization” is an exemplary process that has been well characterized with numerous models (Figure 5 a). Relevant models of fibril organization may be integrated to formulate a generic fibril organization process model. Since fibril organization is dysregulated in several ND diseases, this generic unified model may be tailored to suit any specific disease of interest. On the other hand, processes such as “APP breakdown” have empirical knowledge that has not been used to understand the mechanistic insights using mathematical models (Figure 5 b). For example, low‐density lipoprotein receptor‐related protein‐1 (LRP1) is known to be involved in APP β‐secretase cleavage pathway regulating Aβ production and degradation, but the mechanism of action is still not very clear. In such cases, additional modeling effort is needed before the conception of a unified model. Boxes 1 and 2 elaborate the molecular processes illustrated as Systems Biology Graphical Notation (SBGN) Process diagram for “fibril organization” (Figure 5 a) and as the SBGN Activity Flow for “APP breakdown” (Figure 5 b), respectively. When generic models are available for each category, amalgamating them to assemble a complete ND model could be the next promising step. The associations between the different processes (Figure 2 b) in the 89 models illustrate the closely related ND mechanisms, which may serve as a guide for model integration. The follow up of our study will be to formulate unified models for each ND‐related molecular process and eventually merge them to form a whole modular model.
One aim of systems‐level studies is to generate useful insights into clinical targets. MID3 is increasingly given greater priority within the pharmaceutical industry, since it has a greater potential for decision making. The comparative analysis (Figure 4 c) of available literature knowledge on experimental and clinical studies against the processes that have mathematical models and known drugs has given several insights for future directions. There still exist molecular processes that have experimental evidence for their involvement in the initiation or progression of ND, but the underlying mechanism is not clear. Analyzing these processes for their role in ND using mechanistic models may provide new insights into the pathology of the disease. There are certain processes that are mechanistically well characterized and have no drugs targeting the process and vice versa. This mismatch may be due to the fact that mathematical model formulation relies on biological knowledge, while drug development depends on factors such as safety, efficacy, and side effects. “Fibril organization” is a good example of a well‐studied process (Figure 5 a) with no clinically approved drugs. Ongoing efforts spanning several years have attempted to block Aβ protein as a therapeutic strategy for AD. Recently, researchers have succeeded in developing an antibody—Aducanumab—that can curb Aβ aggregation and slow cognitive decline. Such instances are excellent examples of achieving clinical goals via thorough mechanistic understanding of ND processes.
Another avenue for exploration would be to expand the region of intersection in Figure 4 c, i.e., in the direction of molecular entities that are already a known target and for which mechanistic models are available. An interesting question to ask is what would be the impact of the drugs on a biological system. The development of QSP models by integrating mathematical models with drug action kinetics may provide insights into drug action at a systems level. These models derive their predictive power by replacing the classical view of one‐drug‐one‐target with a paradigm where one drug can interact with a complex network, or multiple drugs can bind to a single target, both of which are a source of clinical side effects. Such QSP models for ND can potentially shed light on side effects and drug toxicity, by following exposure and effect on non‐targeted organs. A QSP model describing the inhibition of the APP breakdown process has identified compensating mechanisms for drug action in the system. Another QSP model of ND predicted the success rates of clinical trials of several drugs. Furthermore, recent studies discuss the need for integrative mechanistic modeling and QSP modeling of AD to provide knowledge for drug discovery programs, target validation, and optimization of clinical development (supporting references are provided in Supplementary Information SI‐3). This corroborates our idea about unifying and integrating ND models to generate clinically relevant QSP models.
CONCLUSION
The growing experimental knowledge and clinical indications of ND have expanded the field of study vastly, thereby making the systems‐level understanding of the disease more challenging. Mathematical models provide fresh insight into biological systems, by suggesting, for example, how connections between local interactions between systems components have wider biological effects. Although there are several mathematical models that describe different aspects of ND, there still exists a gap. Continued efforts on the mechanistic description of neurodegeneration are instrumental in uncovering the interplay between basic biological components associated with neurodegeneration. We believe that the modeling of untouched ND‐related processes and integration with available models is the best way forward to coalesce upon a complete mechanistic understanding of neurodegeneration. This would result in improving clinical diagnosis, therapeutic interventions, and strategies. We believe that our review will form a strong base for developing an integrated modeling framework for the neurodegenerative disease processes.
Box 1. Fibril Organization.
A common characteristic of neurodegenerative diseases is the presence of intracellular and extracellular aggregates, such as senile plaques and neurofibrillary tangles, of otherwise soluble proteins. An SBGN illustration of the aggregation process specific to AD (pink panel), PD (light yellow panel) and in general ND (light green panel), is shown in the Figure 5a. This figure was generated using the mechanistic details synthesised from the models discussed below. Destabilization of native protein conformation is believed to be the key driving force in protein aggregation. The misfolded aggregates are not only resistant to degradation, but also disrupt proteasome function. This is illustrated as a thin arrow and inhibition curve, respectively.
Generic Amyloid Fibrillation: Primarily, partially folded amyloid intermediates have increased aggregation propensity. They tend to assemble as toxic fibrillar structures, which may in turn associate into mature amyloid inclusions. Several mathematical models have been proposed to explain the protein aggregation process in ND:
Stochastic nucleation and fibril dynamics, for instance, have been modelled using a two‐step reaction mechanism 42, 43, 44, 45, 46, 47 and validated with empirical data 48.
A micelle intermediate on the pathway of protein aggregation has been described using mathematical models 49, 50.
Furthermore, models of inhibiting end‐blocking drugs have also been formulated for describing the protein aggregation process 51, 52, 53.
Alzheimer's Disease (AD) – Aβ Fibrillation: Deposits of toxic species of Aβ, such as oligomers, fibrils, senile plaques and neuro fibrillary tangles (NFT) in the brain are characteristic of AD. The mechanism of formation of Aβ fibrils has been modelled by several groups:
Kinetics of Aβ aggregation has been described using mathematical models 12, 13, 14, 39, 54, 55.
Activated microglia increases the production of Aβ through the secretion of Interleukin‐1 (IL‐1) whilst quiescent microglia helps to maintain Aβ production within a healthy range. Neuroinflammation associated with AD has been quantitatively investigated 41.
The transcription factor p53, when present in high levels, increases the activity of the protein kinase GSK3β leading to enhanced production of Aβ 16.
Sequestration of zinc (Zn) by Aβ deposits triggers Aβ aggregation, which promotes plaque formation 15.
Experimentally introduced anti‐Aβ antibodies in the brain have shown to reduce Aβ plaque levels. Models have been formulated to study the effect of immunisation against Aβ 34, 56.
Parkinson's Disease (PD) ‐ α‐Syn Fibrillation: A central hallmark of PD is the formation of intracellular inclusions composed of α‐Syn, a 140 amino acid pre‐synaptic protein. Several factors that regulate α‐Syn aggregation in PD have been investigated for mechanistic understanding:
Redox active metal ions, such as Iron (Fe) and Copper (Cu), are known to enhance nucleation and elongation of α‐Syn. Bharathi et al., (2008) 22 studied the effect of metal ion on α‐Syn aggregation kinetics using a mathematical model.
Overexpression of the protein deglycase DJ‐1 has been shown to reduce α‐Syn dimerization. Buchel et al., (2013) 24 developed a mathematical model to investigate this mechanism.
Dopamine (DA) slows the conversion of α‐Syn aggregates from protofibrils to fibrils, leading to the accumulation of soluble oligomers. Several computational models have been formulated to study the role of DA metabolism in α‐Syn aggregation 19, 24, 57, 58, 59.
Parkin, synphilin and ubiquitin (Ub) are essential components of the Lewy Bodies and are studied in an integrative model by Sass et al. (2009) 59.
The role of reactive oxygen species (ROS) in α‐Syn misfolding via a positive feedback loop has been investigated using the model developed by Cloutier et al. (2012) 30.
Impaired proteasomes disrupt the protein degradation process, which in turn favours the α‐Syn aggregation mechanism 23.
The transport of α‐Syn in axons plays an important role in α‐Syn aggregation and PD pathology. Spatial dynamics of α‐Syn within axons has been studied recently 20, 21.
Box 2. APP breakdown.
The amyloid cascade hypothesis posits that the deposition of the Aβ peptide in the brain is a central event in AD pathology. According to this hypothesis, the overproduction of Aβ is a key step and triggers the disease process. The 4‐kDa polypeptide Aβ results from the sequential cleavage of APP and is believed to play an important role in synaptic activity, but considered neurotoxic when reaching high concentration. The transmembrane protein APP can be processed through four different routes as described in Figure 5b: 1) it may either remain at the cell surface, 2) be internalised and recycled or degraded, 3) cleaved via the non‐amyloidogenic α‐pathway, or 4) cleaved via the amyloidogenic β‐pathway. Accordingly, the membrane secretase‐mediated cleavage of APP is a key process in understanding Aß formation and accumulation. Three different secretases are involved in the two‐step splitting of APP: α‐secretase, β‐secretase, and γ‐secretase. The α‐secretase initially cleaves APP allowing the generation of nonamyloidogenic C83 intermediates. Following this, β‐secretase acts to generate amyloidogenic C99 intermediates. Both reactions generate soluble nontoxic amyloid precursor protein fragments (sAPP) that are released to the extracellular space. Subsequently, C83 and C99 amyloid intermediates are processed by γ‐secretase complex to p3 fragment and Aβ, respectively. There are several steps and molecular components involved in APP breakdown mechanism, which has been reported in the literature. In Figure 5b, we illustrate the gap between the molecular events that are well characterized using mathematical models (green), and those that have experimental evidence but lack mechanistic details (red). If this gap is filled with the development of mathematical models, new insights about AD pathology in the context of APP cleavage can be elucidated. Supporting references are provided in Supplementary Information SI‐3.
Mechanisms investigated using mathematical models [green in Figure 5b]:
Presenilins (a subunit of γ‐secretase) are not only required for proteolytic processing/trafficking of APP, but also for a set of several transmembrane proteins. Several studies have investigated the dynamics of the different amyloid species under the effect of γ‐secretase modulators 13, 60, 61, 62.
Sortilin‐related proteins (SORLA) inhibit APP breakdown by interacting with them and limiting amyloidogenic proteolysis. SORLA dynamics have been modelled in AD 63, 64, 65.
Cholesterol is shown to inhibit β‐secretase activity thereby decreasing the production of Aβ. The role of cholesterol on amyloidogenic processing has been investigated 39.
A decrease in acetylcholine (ACh) concentration causes an increase in the synthesis of APP and favours the processing of APP by the β‐pathway 66, 67.
Mechanisms that are unclear – need of mathematical models [red in Figure 5b]:
APP intracellular domain, co‐product of the enzymatic reaction mediated by γ‐secretase, is found to play an important genetic regulatory role.
LRP1 is involved in the degradation of Aβ and also in the regulation of Aβ production by directly binding to APP, β‐secretase, and γ‐secretase.
Notch proteins cleaved by the enzyme γ‐secretase can regulate gene expression by activating transcription.
Supporting information
Supplementary information accompanies this paper on the CPT: Pharmacometrics & Systems Pharmacology website (http://psp-journal.com)
SI‐1 ‐ Table SI1: List of models describing ND processes. The information provided in this spreadsheet was used to generate Figure 2 and Figure 3. Sheet 1 – ND Model Summary: The 89 ND models considered in this review, along with the processes and mechanism they describe is listed here; Sheet 2 – Molecular entities in ND Models: The protein molecular entities used in the models with their UniProt Ids and the processes in which they are involved in, is list listed here; Sheet 3 – ND Drug‐Targets: The ChEMBL target and drug information for 10 ND conditions is listed here. Sheet 4 ‐ Model_Process_Network: The various features of models – process studied, number of modeled components, theoretical/empirical are presented here. Sheet 5 ‐ Shared_Models_Matirx: The number of shared models between the 15 different species is listed here.
SI‐2 – Figure SI2: Model redundancy in ND‐related processes. The model‐process network of ND is shown in (B). The different heat maps illustrate the overlap of model entities in the exclusive models of ‘fibril organisation’ (A), ‘APP breakdown’ (C) and ‘Synaptic transmission’ (D), respectively. Model redundancy is derived from the degree of overlap between model components of exclusive models.
SI‐3: Supplementary References (S1‐S54)
Acknowledgments
The first two authors contributed equally to this work. This review was written as part of BioModels' targeted curation of literature‐based models and EU AgedBrainSYSBIO Project. We thank the AgedBrainSYSBIO consortium members for their comments on this work. We thank M. Glont and T. Nguyen for technical support. We thank V.R. Knight‐Schrijver for his help in text mining and retrieval of literature‐based ND‐specific models.
Conflict of Interest
The authors declare that they have no conflicts of interest.
Funding
This work received support from the European Commission (EU) (AgedBrainSYSBIO, 305299; EUROACCIO 2014 – Leonardo Da Vinci Project), the Biotechnology and Biological Sciences Research Council (BBSRC) (BioModels, BB/J019305/1; BBS/E/B/000C0419), and the core funding from the European Molecular Biology Laboratory (EMBL).
Author Contributions
A.J.V., T.M.V., and V.C. designed the study, analyzed the results, and wrote the article. A.L.V. and T.M.V. performed the collection, curation, and analysis of models. N.J. contributed in the writing of the article. C.L. provided technical support. N.L.N. and H.H. contributed to valuable comments and suggestions. A.L.V. and T.M.V. contributed equally to the paper and they are joint first authors.
References
- 1. Ahmed, R.M. et al Neuronal network disintegration: common pathways linking neurodegenerative diseases. J Neurol Neurosurg Psychiatry. (2016); e‐pub ahead of print. [DOI] [PMC free article] [PubMed] [Google Scholar]
- 2. Bossy‐Wetzel, E. , Schwarzenbacher, R. & Lipton, S.A. Molecular pathways to neurodegeneration. Nat Med. 10 (suppl.), S2–S9 (2004). [DOI] [PubMed] [Google Scholar]
- 3. Avila, J. Common mechanisms in neurodegeneration. Nat Med. 16, 1372 (2010). [DOI] [PubMed] [Google Scholar]
- 4. Haass, C. Initiation and propagation of neurodegeneration. Nat Med. 16, 1201–1204 (2010). [DOI] [PubMed] [Google Scholar]
- 5. Agoram, B.M. & Demin, O. Integration not isolation: arguing the case for quantitative and systems pharmacology in drug discovery and development. Drug Discov Today 16, 1031–1036 (2011). [DOI] [PubMed] [Google Scholar]
- 6. van der Graaf, P.H. & Benson, N. Systems pharmacology: bridging systems biology and pharmacokinetics‐pharmacodynamics (PKPD) in drug discovery and development. Pharm Res. 28, 1460–1464 (2011). [DOI] [PubMed] [Google Scholar]
- 7. Vicini, P. & van der Graaf, P.H. Systems pharmacology for drug discovery and development: paradigm shift or flash in the pan? Clin Pharmacol Ther. 93, 379–381 (2013). [DOI] [PubMed] [Google Scholar]
- 8.BioModels: Neurodegenerative disease models. <http://www.ebi.ac.uk/biomodels-main/agedbrain/>; <http://www.ebi.ac.uk/biomodels-main/NDModels-map/>.
- 9. Juty, N. et al BioModels: content, features, functionality, and use. CPT Pharmacometrics Syst Pharmacol. 4, e3 (2015). [DOI] [PMC free article] [PubMed] [Google Scholar]
- 10. Mizuno, S. et al AlzPathway: a comprehensive map of signaling pathways of Alzheimer's disease. BMC Syst Biol. 6, 52 (2012). [DOI] [PMC free article] [PubMed] [Google Scholar]
- 11. Fujita, K.A. et al Integrating pathways of Parkinson's disease in a molecular interaction map. Mol Neurobiol. 49, 88–102 (2014). [DOI] [PMC free article] [PubMed] [Google Scholar]
- 12. Craft, D.L. , Wein, L.M. & Selkoe DJ. A mathematical model of the impact of novel treatments on the A beta burden in the Alzheimer's brain, CSF and plasma. Bull Math Biol. 64, 1011–1031 (2002). [DOI] [PubMed] [Google Scholar]
- 13. Das, R. et al Modeling effect of a gamma‐secretase inhibitor on amyloid‐beta dynamics reveals significant role of an amyloid clearance mechanism. Bull Math Biol. 73, 230–247 (2011). [DOI] [PubMed] [Google Scholar]
- 14. Qosa, H. et al Differences in amyloid‐beta clearance across mouse and human blood‐brain barrier models: kinetic analysis and mechanistic modeling. Neuropharmacology 79, 668–678 (2014). [DOI] [PMC free article] [PubMed] [Google Scholar]
- 15. Craddock, T.J. et al The zinc dyshomeostasis hypothesis of Alzheimer's disease. PLoS One 7, e33552 (2012). [DOI] [PMC free article] [PubMed] [Google Scholar]
- 16. Proctor, C.J. & Gray, D.A. GSK3 and p53 — is there a link in Alzheimer's disease? Mol Neurodegener. 5, 7 (2010). [DOI] [PMC free article] [PubMed] [Google Scholar]
- 17. Yuraszeck, T.M. et al Vulnerabilities in the tau network and the role of ultrasensitive points in tau pathophysiology. PLoS Comput Biol. 6, e1000997 (2010). [DOI] [PMC free article] [PubMed] [Google Scholar]
- 18. Koon, Y.L. , Koh, C.G. & Chiam, K.H. Computational modeling reveals optimal strategy for kinase transport by microtubules to nerve terminals. PLoS One 9, e92437 (2014). [DOI] [PMC free article] [PubMed] [Google Scholar]
- 19. Cloutier, M. & Wellstead, P. Dynamic modelling of protein and oxidative metabolisms simulates the pathogenesis of Parkinson's disease. IET Syst Biol. 6, 65–72 (2012). [DOI] [PubMed] [Google Scholar]
- 20. Kuznetsov, I.A. & Kuznetsov, A.V. What can trigger the onset of Parkinson's disease — A modeling study based on a compartmental model of alpha‐synuclein transport and aggregation in neurons. Math Biosci. 278, 22–29 (2016). [DOI] [PubMed] [Google Scholar]
- 21. Kuznetsov, I.A. & Kuznetsov, AV. Mathematical models of alpha‐synuclein transport in axons. Comput Methods Biomech Biomed Engin. 19, 515–526 (2016c). [DOI] [PubMed] [Google Scholar]
- 22. Bharathi, P. , Nagabhushan, P. & Rao, K.S. Mathematical approach to understand the kinetics of alpha‐synuclein aggregation: relevance to Parkinson's disease. Comput Biol Med. 38, 1084–1093 (2008). [DOI] [PubMed] [Google Scholar]
- 23. Sneppen, K. , Lizana, L. , Jensen, M.H. , Pigolotti, S. & Otzen, D. Modeling proteasome dynamics in Parkinson's disease. Phys Biol. 6, 036005 (2009). [DOI] [PubMed] [Google Scholar]
- 24. Buchel, F. et al Parkinson's disease: dopaminergic nerve cell model is consistent with experimental finding of increased extracellular transport of alpha‐synuclein. BMC Neurosci. 14, 136 (2013). [DOI] [PMC free article] [PubMed] [Google Scholar]
- 25. Krohn, M. et al Cerebral amyloid‐beta proteostasis is regulated by the membrane transport protein ABCC1 in mice. J Clin Invest. 121, 3924–3931 (2011). [DOI] [PMC free article] [PubMed] [Google Scholar]
- 26. Proctor, C.J. & Lorimer, I.A. Modelling the role of the Hsp70/Hsp90 system in the maintenance of protein homeostasis. PLoS One 6, e22038 (2011). [DOI] [PMC free article] [PubMed] [Google Scholar]
- 27. Berndt, N. , Bulik, S. & Holzhutter, H.G. Kinetic modeling of the mitochondrial energy metabolism of neuronal cells: the impact of reduced alpha‐ketoglutarate dehydrogenase activities on ATP production and generation of reactive oxygen species. Int J Cell Biol. 2012, 757594 (2012). [DOI] [PMC free article] [PubMed] [Google Scholar]
- 28. Poliquin, P.O. , Chen, J. , Cloutier, M. , Trudeau, L.E. & Jolicoeur, M. Metabolomics and in‐silico analysis reveal critical energy deregulations in animal models of Parkinson's disease. PLoS One 8, e69146 (2013). [DOI] [PMC free article] [PubMed] [Google Scholar]
- 29. Cloutier, M. , Bolger, F.B. , Lowry, J.P. & Wellstead, P. An integrative dynamic model of brain energy metabolism using in vivo neurochemical measurements. J Comput Neurosci. 27, 391–414 (2009). [DOI] [PubMed] [Google Scholar]
- 30. Cloutier, M. , Middleton, R. & Wellstead, P. Feedback motif for the pathogenesis of Parkinson's disease. IET Syst Biol. 6, 86–93 (2012). [DOI] [PubMed] [Google Scholar]
- 31. Guillaud, F. , Drose, S. , Kowald, A. , Brandt, U. & Klipp, E. Superoxide production by cytochrome bc1 complex: a mathematical model. Biochim Biophys Acta. 1837, 1643–1652 (2014). [DOI] [PubMed] [Google Scholar]
- 32. Vali, S. et al Integrating glutathione metabolism and mitochondrial dysfunction with implications for Parkinson's disease: a dynamic model. Neuroscience 149, 917–930 (2007). [DOI] [PubMed] [Google Scholar]
- 33. Fussenegger, M. , Bailey, J.E. & Varner, J. A mathematical model of caspase function in apoptosis. Nat Biotechnol. 18, 768–774 (2000). [DOI] [PubMed] [Google Scholar]
- 34. Proctor, C.J. , Boche, D. , Gray, D.A. & Nicoll, JA. Investigating interventions in Alzheimer's disease with computer simulation models. PLoS One 8, e73631 (2013). [DOI] [PMC free article] [PubMed] [Google Scholar]
- 35. Puri, I.K. & Li, L. Mathematical modeling for the pathogenesis of Alzheimer's disease. PLoS One 5, e15176 (2010). [DOI] [PMC free article] [PubMed] [Google Scholar]
- 36. Culmone, V. & Migliore, M. Progressive effect of beta amyloid peptides accumulation on CA1 pyramidal neurons: a model study suggesting possible treatments. Front Comput Neurosci. 6, 52 (2012). [DOI] [PMC free article] [PubMed] [Google Scholar]
- 37. Good, T.A. & Murphy, R.M. Effect of beta‐amyloid block of the fast‐inactivating K+ channel on intracellular Ca2+ and excitability in a modeled neuron. Proc Natl Acad Sci U S A. 93, 15130–15135 (1996). [DOI] [PMC free article] [PubMed] [Google Scholar]
- 38. Rowan, M.S. , Neymotin, S.A. & Lytton, W.W. Electrostimulation to reduce synaptic scaling driven progression of Alzheimer's disease. Front Comput Neurosci. 8, 39 (2014). [DOI] [PMC free article] [PubMed] [Google Scholar]
- 39. Kyrtsos, C.R. & Baras, J.S. Studying the role of ApoE in Alzheimer's disease pathogenesis using a systems biology model. J Bioinform Comput Biol. 11, 1342003 (2013). [DOI] [PubMed] [Google Scholar]
- 40. Dunster, J.L. , Byrne, H.M. & King, J.R. The resolution of inflammation: a mathematical model of neutrophil and macrophage interactions. Bull Math Biol. 76, 1953–1980 (2014). [DOI] [PubMed] [Google Scholar]
- 41. Luca, M. , Chavez‐Ross, A. , Edelstein‐Keshet, L. & Mogilner, A. Chemotactic signaling, microglia, and Alzheimer's disease senile plaques: is there a connection? Bull Math Biol. 65, 693–730 (2003). [DOI] [PubMed] [Google Scholar]
- 42. Auer, S. & Kashchiev, D. Insight into the correlation between lag time and aggregation rate in the kinetics of protein aggregation. Proteins 78, 2412–2416 (2010). [DOI] [PubMed] [Google Scholar]
- 43. Auer, S. , Ricchiuto, P. & Kashchiev, D. Two‐step nucleation of amyloid fibrils: omnipresent or not? J Mol Biol. 422, 723–730 (2012). [DOI] [PubMed] [Google Scholar]
- 44. Crespo, R. , Rocha, F.A. , Damas, A.M. & Martins, P.M. A generic crystallization‐like model that describes the kinetics of amyloid fibril formation. J Biol Chem. 287, 30585–30594 (2012). [DOI] [PMC free article] [PubMed] [Google Scholar]
- 45. Kamihira, M. , Naito, A. , Tuzi, S. , Nosaka, A.Y. & Saito, H. Conformational transitions and fibrillation mechanism of human calcitonin as studied by high‐resolution solid‐state 13C NMR. Protein Sci. 9, 867–877 (2000). [DOI] [PMC free article] [PubMed] [Google Scholar]
- 46. Lee, C.C. , Nayak, A. , Sethuraman, A. , Belfort, G. & McRae, GJ. A three‐stage kinetic model of amyloid fibrillation. Biophys J. 92, 3448–3458 (2007). [DOI] [PMC free article] [PubMed] [Google Scholar]
- 47. Pallitto, M.M. & Murphy, R.M. A mathematical model of the kinetics of beta‐amyloid fibril growth from the denatured state. Biophys J. 81, 1805–1822 (2001). [DOI] [PMC free article] [PubMed] [Google Scholar]
- 48. Morris, A.M. , Watzky, M.A. , Agar, J.N. & Finke, RG. Fitting neurological protein aggregation kinetic data via a 2‐step, minimal/“Ockham's razor” model: the Finke‐Watzky mechanism of nucleation followed by autocatalytic surface growth. Biochemistry 47, 2413–2427 (2008). [DOI] [PubMed] [Google Scholar]
- 49. Hingant, E. et al A micellar on‐pathway intermediate step explains the kinetics of prion amyloid formation. PLoS Comput Biol. 10, e1003735 (2014). [DOI] [PMC free article] [PubMed] [Google Scholar]
- 50. Prigent, S. et al An efficient kinetic model for assemblies of amyloid fibrils and its application to polyglutamine aggregation. PLoS One 7, e43273 (2012). [DOI] [PMC free article] [PubMed] [Google Scholar]
- 51. Martins, P.M. True and apparent inhibition of amyloid fibril formation. Prion 7, 136–139 (2013). [DOI] [PMC free article] [PubMed] [Google Scholar]
- 52. Masel, J. & Jansen, V.A. Designing drugs to stop the formation of prion aggregates and other amyloids. Biophys Chem. 88, 47–59 (2000). [DOI] [PubMed] [Google Scholar]
- 53. Vazquez, J.A. Modeling of chemical inhibition from amyloid protein aggregation kinetics. BMC Pharmacol Toxicol. 15, 9 (2014). [DOI] [PMC free article] [PubMed] [Google Scholar]
- 54. Bertsch, M. , Franchi, B. , Marcello, N. , Tesi, M.C. & Tosin, A. Alzheimer's disease: a mathematical model for onset and progression. Math Med Biol. (2016) [Epub ahead of print]. [DOI] [PubMed] [Google Scholar]
- 55. Edelstein‐keshet, L. & Spiros, A. Exploring the formation of Alzheimer's disease senile plaques in silico. J Theor Biol. 216, 301–326 (2002). [DOI] [PubMed] [Google Scholar]
- 56. Proctor, C.J. , Pienaar, I.S. , Elson, J.L. & Kirkwood, T.B. Aggregation, impaired degradation and immunization targeting of amyloid‐beta dimers in Alzheimer's disease: a stochastic modelling approach. Mol Neurodegener. 7, 32 (2012). [DOI] [PMC free article] [PubMed] [Google Scholar]
- 57. Ouzounoglou, E. et al In silico modeling of the effects of alpha‐synuclein oligomerization on dopaminergic neuronal homeostasis. BMC Syst Biol. 8, 54 (2014). [DOI] [PMC free article] [PubMed] [Google Scholar]
- 58. Raichur, A. , Vali, S. & Gorin, F. Dynamic modeling of alpha‐synuclein aggregation for the sporadic and genetic forms of Parkinson's disease. Neuroscience 142, 859–870 (2006). [DOI] [PubMed] [Google Scholar]
- 59. Sass, M.B. , Lorenz, A.N. , Green, R.L. & Coleman, RA. A pragmatic approach to biochemical systems theory applied to an alpha‐synuclein‐based model of Parkinson's disease. J Neurosci Methods. 178, 366–377 (2009). [DOI] [PubMed] [Google Scholar]
- 60. Ortega, F. , Stott, J. , Visser, S.A. & Bendtsen, C. Interplay between alpha‐, beta‐, and gamma‐secretases determines biphasic amyloid‐beta protein level in the presence of a gamma‐secretase inhibitor. J Biol Chem. 288, 785–792 (2013). [DOI] [PMC free article] [PubMed] [Google Scholar]
- 61. Svedruzic, Z.M. , Popovic, K. & Sendula‐Jengic, V. Modulators of gamma‐secretase activity can facilitate the toxic side‐effects and pathogenesis of Alzheimer's disease. PLoS One 8, e50759 (2013). [DOI] [PMC free article] [PubMed] [Google Scholar]
- 62. Walsh, R. Are improper kinetic models hampering drug development? PeerJ. 2, e649 (2014). [DOI] [PMC free article] [PubMed] [Google Scholar]
- 63. Alcantara, J.H. , Lao, A.R. & Ruivivar, LA. Stability analysis of the ODE model representation of amyloidogenic processing in Alzheimer's disease in the presence of SORLA. Mol Biosyst. 12, 1468–1477 (2016). [DOI] [PubMed] [Google Scholar]
- 64. Lao, A. , Schmidt, V. , Schmitz, Y. , Willnow, T.E. & Wolkenhauer, O. Multi‐compartmental modeling of SORLA's influence on amyloidogenic processing in Alzheimer's disease. BMC Syst Biol. 6, 74 (2012). [DOI] [PMC free article] [PubMed] [Google Scholar]
- 65. Schmidt, V. et al Quantitative modelling of amyloidogenic processing and its influence by SORLA in Alzheimer's disease. EMBO J. 31, 187–200 (2012). [DOI] [PMC free article] [PubMed] [Google Scholar]
- 66. Ehrenstein, G. , Galdzicki, Z. & Lange, GD. The choline‐leakage hypothesis for the loss of acetylcholine in Alzheimer's disease. Biophys J. 73, 1276–1280 (1997). [DOI] [PMC free article] [PubMed] [Google Scholar]
- 67. Ehrenstein, G. , Galdzicki, Z. & Lange, GD. A positive‐feedback model for the loss of acetylcholine in Alzheimer's disease. Ann N Y Acad Sci. 899, 283–291 (2000). [DOI] [PubMed] [Google Scholar]
- 68. Alvarez‐Martinez, M.T. et al Dynamics of polymerization shed light on the mechanisms that lead to multiple amyloid structures of the prion protein. Biochim Biophys Acta. 1814, 1305–1317 (2011). [DOI] [PubMed] [Google Scholar]
- 69. Ambert, N. et al Computational studies of NMDA receptors: differential effects of neuronal activity on efficacy of competitive and non‐competitive antagonists. Open Access Bioinform. 2, 113–125 (2010). [DOI] [PMC free article] [PubMed] [Google Scholar]
- 70. Aubert, A. & Costalat, R. A model of the coupling between brain electrical activity, metabolism, and hemodynamics: application to the interpretation of functional neuroimaging. Neuroimage 17, 1162–1181 (2002). [DOI] [PubMed] [Google Scholar]
- 71. Aubert, A. & Costalat, R. Interaction between astrocytes and neurons studied using a mathematical model of compartmentalized energy metabolism. J Cereb Blood Flow Metab. 25, 1476–1490 (2005). [DOI] [PubMed] [Google Scholar]
- 72. Aubert, A. & Costalat, R , Magistretti PJ, Pellerin L. Brain lactate kinetics: modeling evidence for neuronal lactate uptake upon activation. Proc Natl Acad Sci U S A. 102, 16448–16453 (2005). [DOI] [PMC free article] [PubMed] [Google Scholar]
- 73. Best, J.A. , Nijhout, H.F. & Reed, MC. Homeostatic mechanisms in dopamine synthesis and release: a mathematical model. Theor Biol Med Model. 6, 21 (2009). [DOI] [PMC free article] [PubMed] [Google Scholar]
- 74. Clarke, G. et al A one‐hit model of cell death in inherited neuronal degenerations. Nature 406, 195–199 (2000). [DOI] [PubMed] [Google Scholar]
- 75. Drion, G. , Massotte, L. , Sepulchre, R. & Seutin, V. How modeling can reconcile apparently discrepant experimental results: the case of pacemaking in dopaminergic neurons. PLoS Comput Biol. 7, e1002050 (2011). [DOI] [PMC free article] [PubMed] [Google Scholar]
- 76. Francis, F. , Garcia, M.R. & Middleton, R.H. A single compartment model of pacemaking in dissasociated substantia nigra neurons: stability and energy analysis. J Comput Neurosci. 35, 295–316 (2013). [DOI] [PubMed] [Google Scholar]
- 77. Grange, S. , Holford, N.H. & Guentert, T.W. A pharmacokinetic model to predict the PK interaction of L‐dopa and benserazide in rats. Pharm Res. 18, 1174–1184 (2001). [DOI] [PubMed] [Google Scholar]
- 78. Iljina, M. et al Kinetic model of the aggregation of alpha‐synuclein provides insights into prion‐like spreading. Proc Natl Acad Sci U S A. 113, E1206–1215 (2016). [DOI] [PMC free article] [PubMed] [Google Scholar]
- 79. Kuznetsov, I.A. & Kuznetsov, A.V. What mechanisms of tau protein transport could be responsible for the inverted tau concentration gradient in degenerating axons? Math Med Biol. (2016); e‐pub ahead of print. [DOI] [PubMed] [Google Scholar]
- 80. Kyrtsos, C.R. Of mice and math: a systems biology model for Alzheimer's disease: University of Maryland; 2011. [Google Scholar]
- 81. Kyrtsos, C.R. & Baras, JS. Modeling the role of the glymphatic pathway and cerebral blood vessel properties in Alzheimer's disease pathogenesis. PLoS One 10, e0139574 (2015). [DOI] [PMC free article] [PubMed] [Google Scholar]
- 82. Lomasko, T. , Clarke, G. & Lumsden, C.J. One‐hit stochastic decline in a mechanochemical model of cytoskeleton‐induced neuron death I: cell‐fate arrival times. J Theor Biol. 249, 1–17 (2007). [DOI] [PubMed] [Google Scholar]
- 83. Lomasko, T. , Clarke, G. & Lumsden, C.J. One‐hit stochastic decline in a mechanochemical model of cytoskeleton‐induced neuron death II: transition state metastability. J Theor Biol. 249, 18–28 (2007). [DOI] [PubMed] [Google Scholar]
- 84. Lomasko, T. & Lumsden, C.J. One‐hit stochastic decline in a mechanochemical model of cytoskeleton‐induced neuron death III: diffusion pulse death zones. J Theor Biol. 256, 104–116 (2009). [DOI] [PubMed] [Google Scholar]
- 85. Macdonald, A. & Pritchard, D. A mathematical model of Alzheimer's disease and the Apoe gene. Astin Bulletin 30, 69–110 (2000). [Google Scholar]
- 86. McAuley, M.T. et al A mathematical model of aging‐related and cortisol induced hippocampal dysfunction. BMC Neurosci. 10, 26 (2009). [DOI] [PMC free article] [PubMed] [Google Scholar]
- 87. Morris, A.M. & Finke, R.G. Alpha‐synuclein aggregation variable temperature and variable pH kinetic data: a re‐analysis using the Finke‐Watzky 2‐step model of nucleation and autocatalytic growth. Biophys Chem. 140, 9–15 (2009). [DOI] [PubMed] [Google Scholar]
- 88. Porenta, G. A computer model of neuronal pathways in the basal ganglia. Comput Methods Programs Biomed. 22, 325–331 (1986). [DOI] [PubMed] [Google Scholar]
- 89. Proctor, C.J. et al Modelling the actions of chaperones and their role in ageing. Mech Ageing Dev. 126, 119–131 (2005). [DOI] [PubMed] [Google Scholar]
- 90. Proctor, C.J. , Tangeman, P.J. & Ardley, H.C. Modelling the role of UCH‐L1 on protein aggregation in age‐related neurodegeneration. PLoS One 5, e13175 (2010). [DOI] [PMC free article] [PubMed] [Google Scholar]
- 91. Proctor, C.J. , Tsirigotis, M. & Gray, D.A. An in silico model of the ubiquitin‐proteasome system that incorporates normal homeostasis and age‐related decline. BMC Syst Biol. 1, 17 (2007). [DOI] [PMC free article] [PubMed] [Google Scholar]
- 92. Qi, Z. , Miller, G.W. & Voit, E.O. Computational systems analysis of dopamine metabolism. PLoS One 3, e2444 (2008). [DOI] [PMC free article] [PubMed] [Google Scholar]
- 93. Reed, M.C. et al A mathematical model of glutathione metabolism. Theor Biol Med Model. 5, 8 (2008). [DOI] [PMC free article] [PubMed] [Google Scholar]
- 94. Romani, A. et al Computational modeling of the effects of amyloid‐beta on release probability at hippocampal synapses. Front Comput Neurosci. 7, 1 (2013). [DOI] [PMC free article] [PubMed] [Google Scholar]
- 95. Steckmann, T. , Awan, Z. , Gerstman, B.S. & Chapagain, P.P. Kinetics of peptide secondary structure conversion during amyloid beta‐protein fibrillogenesis. J Theor Biol. 301, 95–102 (2012). [DOI] [PubMed] [Google Scholar]
- 96. Sugaya, K. & Matsubara, S. Quantitative connection between polyglutamine aggregation kinetics and neurodegenerative process in patients with Huntington's disease. Mol Neurodegen. 7, 20 (2012). [DOI] [PMC free article] [PubMed] [Google Scholar]
- 97. Tamagnini, F. et alAltered intrinsic excitability of hippocampal CA1 pyramidal neurons in aged PDAPP mice. Front Cell Neurosci. 9, 372 (2015). [DOI] [PMC free article] [PubMed] [Google Scholar]
- 98. Tang, M.Y. , Proctor, C.J. , Woulfe, J. & Gray, D.A. Experimental and computational analysis of polyglutamine‐mediated cytotoxicity. PLoS Comput Biol. 6, (2010). [DOI] [PMC free article] [PubMed] [Google Scholar]
- 99. Tiveci, S. , Akin, A. , Cakir, T. , Saybasili, H. & Ulgen, K. Modelling of calcium dynamics in brain energy metabolism and Alzheimer's disease. Comput Biol Chem. 29, 151–162 (2005). [DOI] [PubMed] [Google Scholar]
- 100. Wang, Y.J. , Lin, M.W. , Lin, A.A. & Wu, S.N. Riluzole‐induced block of voltage‐gated Na+ current and activation of BKCa channels in cultured differentiated human skeletal muscle cells. Life Sci. 82, 11–20 (2008). [DOI] [PubMed] [Google Scholar]
Associated Data
This section collects any data citations, data availability statements, or supplementary materials included in this article.
Supplementary Materials
Supplementary information accompanies this paper on the CPT: Pharmacometrics & Systems Pharmacology website (http://psp-journal.com)
SI‐1 ‐ Table SI1: List of models describing ND processes. The information provided in this spreadsheet was used to generate Figure 2 and Figure 3. Sheet 1 – ND Model Summary: The 89 ND models considered in this review, along with the processes and mechanism they describe is listed here; Sheet 2 – Molecular entities in ND Models: The protein molecular entities used in the models with their UniProt Ids and the processes in which they are involved in, is list listed here; Sheet 3 – ND Drug‐Targets: The ChEMBL target and drug information for 10 ND conditions is listed here. Sheet 4 ‐ Model_Process_Network: The various features of models – process studied, number of modeled components, theoretical/empirical are presented here. Sheet 5 ‐ Shared_Models_Matirx: The number of shared models between the 15 different species is listed here.
SI‐2 – Figure SI2: Model redundancy in ND‐related processes. The model‐process network of ND is shown in (B). The different heat maps illustrate the overlap of model entities in the exclusive models of ‘fibril organisation’ (A), ‘APP breakdown’ (C) and ‘Synaptic transmission’ (D), respectively. Model redundancy is derived from the degree of overlap between model components of exclusive models.
SI‐3: Supplementary References (S1‐S54)