

Abstract
Global profiling of xenobiotics in human matrices in an untargeted mode is gaining attention for studying the environmental chemical space of the human exposome. Defined as the study of a comprehensive inclusion of environmental influences and associated biological responses, human exposome science is currently evolving out of the metabolomics science. In analogy to the latter, the development and applications of high resolution mass spectrometry (HRMS) has shown potential and promise to greatly expand our ability to capture the broad spectrum of environmental chemicals in exposome studies. HRMS can perform both untargeted and targeted analysis because of its capability of full- and/or tandem-mass spectrum acquisition at high mass accuracy with good sensitivity. The collected data from target, suspect and non-target screening can be used not only for the identification of environmental chemical contaminants in human matrices prospectively but also retrospectively. This review covers recent trends and advances in this field. We focus on advances and applications of HRMS in human biomonitoring studies, and data acquisition and mining. The acquired insights provide stepping stones to improve understanding of the human exposome by applying HRMS, and the challenges and prospects for future research.
Graphical abstract
1. Untargeted analysis of biomarkers of exposure to environmental organic chemicals: the human exposome perspective for multiplexed biomonitoring
Over 120 million unique organic and inorganic compounds are currently listed on the Chemical Abstracts Service (CAS) Registry (CAS, 2016). However, only about 85,000 manufactured or processed chemicals, including imports, are currently registered under the Toxic Substances Control Act with the United States Environmental Protection Agency (EPA, 2016). Moreover, about 30,000 of these chemicals are widely used in consumer products (Muir and Howard, 2006, Howard and Muir, 2010). Humans are constantly exposed to these chemicals, which can reach different body tissues via exposure through diet, the environment, or the use of consumer products. Human biomonitoring programs monitor several matrices such as blood and urine for a limited number of exposure biomarkers and chemicals. Currently, only ~250 chemicals are monitored through a targeted analytical regimen (CDC, 2015). This limitation and concerns over the unknown risk of human exposure and health effects to the 120 million chemicals currently listed on the CAS registry has led to the emergence of the discipline of untargeted analysis. The constant generation and release of new chemicals and substitutes for both industrial and consumer purposes keep the analytical scientists a step behind their detection in biomonitoring studies as standards have to be made available for targeted analysis. Hence, virtually all studies in environmental health have focused on one, or at most, a few candidate chemicals or metabolites which may cause disease or disorders in humans. While there are strengths to such an approach, including biologic plausibility and clear a priori hypotheses, there are also limitations to selecting only a few chemicals in a single study.
The definition of the ‘Exposome’ is debated and will continue to evolve, but it is accepted that this concept should encompass “the life-course environmental exposures (including lifestyle factors), from the prenatal period onwards” (Wild, 2005). A comprehensive study of the exposome incorporates environmental exposures and associated biological responses including environmental chemicals, diet, behavior, and endogenous processes (Miller and Jones, 2014, Miller, 2014, Dennis et al., 2016a). Human exposome science aims to measure life-course environmental exposures (including lifestyle factors), from the prenatal period onwards (Wild, 2005). It is important to consider that the exposome includes not only external exposures but also internal factors (e.g. inflammation, infection, and the microbiome) (Rappaport and Smith, 2010, Miller and Jones, 2014). The power of measuring the internal environmental chemical space of the human exposome as a tool to evaluate health risks is increasingly recognized across several scientific domains (Wild, 2005, Wild, 2012, Wild et al., 2013, Nakamura et al., 2014, Bijlsma and Cohen, 2016, Kortenkamp et al., 2007, Rappaport, 2011). The blood exposome was the first effort directed towards incorporating literature data for about 1,600 exo- and endogenous chemicals to identify associated metabolic pathways and disease etiologies (Rappaport et al., 2014). Other emerging exposome approaches that consider measuring organic chemicals with distinct features are (a) the tooth exposome that utilizes a novel bio-matrix (Andra et al., 2015), (b) volatolomics that use a specific physical fraction ( e.g. exhaled breath or volatile organic compounds pool) (Pleil and Stiegel, 2013, Broza et al., 2014), and (c) the pregnancy exposome that relies on collective data from multiple matrices and multiple prenatal and birth sampling points (Robinson et al., 2015).
The holistic approach of simultaneous detection, characterization, and quantitation of tens of thousands of chemicals, metabolites, and other small molecules using high resolution mass spectrometry (HRMS) is revolutionary since it reveals the differences in exposures between life stages within and between individuals. The applications of HRMS are many and varied in human health studies. A comprehensive review of the use of HRMS in studies of exogenous xenobiotics, endogenous metabolites and biomolecules from an exposome perspective is not possible. Only a snapshot of the vast amount of work and applications will be presented here as an analytical primer. The present review will focus on HRMS applications covering the environmental chemical space of the human exposome, with a particular emphasis on its use in multiplexed biomonitoring. The HRMS applications provided in this review are primarily relevant to human exposures to environmental chemicals and biomonitoring, but we have included studies on endogenous metabolites and other biomarkers of effect to chemical exposures when examples of primary relevance were unavailable. The review also draws parallels between the applications of HRMS used in forensic toxicology (Ojanpera et al., 2012, Ibáñez et al., 2014), water quality monitoring (Hernández et al., 2014, Leendert et al., 2015, Gosetti et al., 2016), food safety (Hernández et al., 2011a), and environmental (Petrovic and Barcelo, 2006) and clinical sciences (Yin and Xu, 2014). Suggested additional reading material are the notable review articles on HRMS applications in the ‘omics’ era in general (Madji Hounoum et al., 2016, Ghaste et al., 2016) (Rathahao-Paris et al., 2016) (Schrimpe-Rutledge et al., 2016) and the exposome in particular (Jones, 2016, Athersuch, 2015, Athersuch, 2012, Athersuch and Keun, 2015, Siroux et al., 2016). A large number of reviews on HRMS strategies are found in the literature but none adequately represent studies on characterizing the environmental chemical space in human matrices. A recent review summarized the latest and potential advances in metabolomics methods in relation to HRMS applications in untargeted human biomonitoring studies (Dennis et al., 2016b). The present review supplements the metabolomics-based reviews and covers various aspects, including sample preparation, HRMS types and applications, and data acquisition and mining features that are used in studying human exposures to environmental chemicals. Moreover, it is intended to provide comprehensive information on the MS strategies in unknowns’ identification.
2. Advances in analytical tools for profiling the environmental chemicals space of the human exposome
Exposome analyses are typically based on the high-throughput capacity of advanced mass spectrometry technology. Analyzing bio-matrices for the totality of exposures to organic pollutants is (a) to assess a fraction of the vast and complex internal chemical milieu made of exogenous sources and endogenous responses (Athersuch and Keun, 2015), and (b) a component of the top-down approach for scaling the human exposome (Rappaport, 2011). Advances in high-resolution mass spectrometers (MS), such as Fourier-transform MS (Soltow et al., 2013), hybrid ion trap-orbitrap MS (Jamin et al., 2014), quadrupole time-of-flight MS (Diaz et al., 2012, Fan et al., 2014), allow increased metabolic detection (Athersuch, 2012) and capture a wider, untargeted chemical space in the exposome (Athersuch, 2015) (Rappaport, 2012).
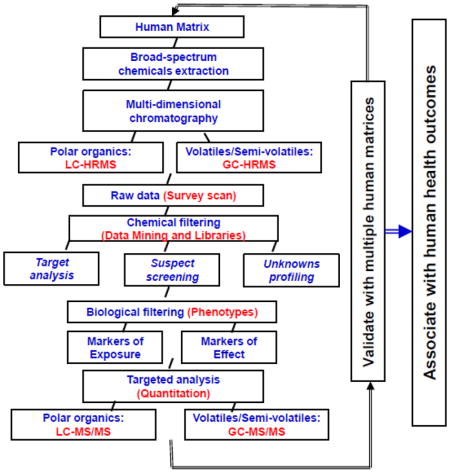
Using the analysis of small molecules and metabolites as an example, Figure SI-1 shows a proposed workflow for the analysis, identification, quantification, and integration of the exposome into health studies. The generic approach is two-fold: first to apply untargeted, or “discovery”, methods that employ high resolution mass spectrometry (HRMS) detection after liquid chromatography (LC) or gas chromatography (GC) separation to generate large datasets of full mass spectra, and secondly, mass fragmentation of organic compounds and biomolecules affected by environmental exposures. Accurate mass identification of specific compounds, library searching for mass-matching and metabolite fingerprinting, all combined with data mining through a number of statistical approaches, including chemometrics and bioinformatics, are used to identify markers that can then become targeted analytes. Accurate-mass measurements and a detailed study of the fragmentation together with the use of reference standards are used to confirm and quantify these specific markers, which can then be studied in relation to specific health outcomes.
Tackling the exposome requires state-of-the-art analytical techniques and tools (Jones, 2016, Rager et al., 2016). Exposome studies involve multidisciplinary approach requiring efforts from exposure scientists, epidemiologists, clinicians, statisticians, bioinformaticians, and analytical chemists. Next in line are advances in separation techniques, detection tools, high-resolution instrumentation features, data acquisition and data mining. In this review, the focus is on the analytical tools and techniques that are useful to acquire information relevant to exposome studies.
2.1. High resolution mass spectrometry
High-resolution mass spectrometers (HRMS) such as Fourier transform ion cyclotron resonance (FT-ICR), orbitrap, and time-of-flight (TOF) are primarily used for full-scan MS. These MS can be combined to yield tandem analyzers such as hybrid ion trap/orbitrap (LTQ-Orbitrap) and quadrupole time-of-flight (QqTOF), that provide both full-scan MS and MS/MS to obtain accurate mass of both precursor and product ions for more confident and accurate compound identification. These instruments typically use ion sources such as electrospray ionization (ESI), atmospheric pressure chemical ionization (APCI), or matrix-assisted laser desorption ionization (MALDI). HRMS can be assessed by the following properties: (i) Mass accuracy, a mass error measurement derived from the ratio of difference (between measured and theoretical) to the theoretical m/z value, (ii) Mass resolution, the ability to differentiate molecular features with nearly equal m/z and derived from the full width at half-maximum (FWHM), (iii) Scan speed, the time required for completing the scanning over a range of m/z values, and (iv) Dynamic range, the range over which ion intensities are linear with analyte concentrations for a suite of m/z covering the entire experimental chemical space. In general, HRMS offers a mass accuracy in the range between 100 ppb for peptides on a FT-ICR and 5 ppm for an ion trap (IT)-TOF, mass resolving power in the range between 10,000 FWHM defined at m/z 1000 for IT-TOF and 6,000,000 FWHM at m/z 100 on a 9.4 tesla FT-ICR, scan speed in the range between 8 Hz on a LTQ-Orbitrap and 100 Hz on a TripleTOF, and a dynamic range between 5–40,000 m/z on a TripleTOF and 20–100,000 m/z on a quadrupole-ion mobility-TOF hybrid instrument (Lin et al., 2015, Scigelova et al., 2011).
2.1.1. Fourier transform ion cyclotron resonance MS
FT-ICR MS was applied for profiling the human exposome and identified molecular features belonging to a suite of environmental chemical classes such as flame retardants, herbicides, insecticides, plasticizers, etc. in human plasma (Soltow et al., 2013). However, this technology is not generally used for the biomonitoring of environmental chemicals in human matrices due to cost and user feasibility limitations. Double-focusing high resolution mass spectrometer (DFHRMS) is a variation that combines both electric and magnetic fields for controlling the ions path. GC-DFHRMS was used in a targeted mode for the human biomonitoring of polychlorinated biphenyls in hair (Barbounis et al., 2012), dioxins in serum (Patterson et al., 2011) and persistent organic pollutants in dried blood spot (Ma et al., 2014). Magnetic field mass analyzers are primarily used in multiple reaction monitoring (MRM) or selective ion mode (SIM) for targeted analysis of a few compounds, and are gradually been displaced by orbitrap and TOF systems that can perform untargeted analysis.
2.1.2. Orbitrap MS
The Orbitrap offers the advantages of high resolution and mass accuracy without the need for a superconducting magnet as in the case of FT-ICR MS. Hybrid trap mass spectrometers that combine ion trap and Orbitrap offer high sensitivity in a full scan and was used for broad screening of environmental chemicals in human urine (Plassmann et al., 2015) and pesticides metabolites in human urine in an exposome study (Jamin et al., 2014). Orbitraps have comparatively slow data acquisition rates and are less suitable to detect sharp peaks generated by fast UHPLC systems (Perry et al., 2008).
2.1.3. Time-of-flight MS
TOF MS allows all ions to be acquired with no lower or upper mass cut-off limits and hence provides high accuracy across the mass range. An advancement in TOF MS is the development of a hybrid quadrupole QqTOF that utilizes sequential fragmentation (MSn) to fragment a given analyte, select a particular product ion of the analyte, and repeat the process multiple times to generate additional product ion accurate mass spectra features, which improves structure elucidation and molecular feature identification capabilities. The distinct advantages of a QqTOF are fast acquisition rate, wide mass range and high ion transmission efficiency. A hybrid between TOF and ion trap mass analyzers was released as an IT-TOF, which can retain ions in the acceleration chamber for multi-stage mass spectrometry (MSn) and switch polarity at a high speed (Liu, 2012). Among all the currently available HRMS platforms, TOF-MS and QqTOF MS are the most widely used systems for studying human exposures to environmental chemicals from an exposome perspective (Table 1), as detailed in the later section.
Table 1.
Overview of the current studies assessing human exposures to environmental organic contaminants based on targeted and untargeted analysis using time-of-flight mass spectrometry.
| # | Study Reference (alphabetical) |
Scope of the environmental exposures studied |
Human matrix |
Targeted approach |
Untargeted analysis | Hybrid/ “All-in-one” approach |
Analytical Instrumentation |
|
|---|---|---|---|---|---|---|---|---|
| Knowns with reference standards |
Suspects screening |
Unknowns screening |
Targeted knowns with reference standards and untargeted suspects/ unknowns screening |
|||||
| 1 | Andra et al. (2015) | Prenatal and early childhood exposures to environmental contaminants | Teeth | ✓ | ✓ | ✓ | ✓ | LC-QqTOF MS |
| 2 | Baduel et al. (2015) | Broad spectrum environmental contaminants | Breast milk | ✓ | ✓ | ✓ | ✓ | LC-QqTOF MS |
| 3 | Bouchard et al. (2009) | Polycyclic aromatic hydrocarbons exposure | Urine | ✓ | LC-TOF MS | |||
| 4 | Carrizo et al. (2015) | Exposure to polycyclic aromatic hydrocarbons | Saliva and urine | ✓ | ✓ | ASAP-QqTOF MS | ||
| 5 | Cequier et al. (2014) | Exposure to organophosphate pesticides | Urine | ✓ | LC-QqTOF MS | |||
| 6 | Cequier et al. (2015) | Pesticides (organophosphate) exposure | Urine | ✓ | LC-QqTOF MS | |||
| 7 | Chittamma et al. (2013) | In utero exposure to drugs | Umbilical cord | ✓ | LC-TOF MS | |||
| 8 | Cortejade et al. (2016) | Multi-residue environmental contaminants | Urine | ✓ | LC-QqTOF MS | |||
| 9 | Diaz et al. (2012) | Multiple classes of organic contaminants | Urine | ✓ | ✓ | ✓ | LC-QqTOF MS | |
| 10 | Eom et al. (2014) | Polyfluorinated compounds | Plasma | ✓ | LC-TOF MS | |||
| 11 | Focant et al. (2004) | Exposure to persistent organic compounds | Serum and Milk | ✓ | GC x GC-ID-TOF MS | |||
| 12 | Hernandez et al. (2009b) | Environmental exposures to persistent organic chemicals | Breast adipose | ✓ | ✓ | GC-TOF MS | ||
| 13 | Kazda et al. (2004) | Polybromiated diphenyl ethers | Milk | ✓ | GC-TOF MS | |||
| 14 | Marchese et al. (2004) | Exposures to benzene, toluene, xylene and styrene | Urine | ✓ | LC-QqTOF MS | |||
| 15 | Marin et al. (2014) | Neonatal drug exposure | Umbilical cord | ✓ | ✓ | ✓ | ✓ | LC-TOF MS |
| 16 | McMahen et al. (2015) | Passive exposures to insecticides | Urine and serum | ✓ | LC-TOF MS | |||
| 17 | Megson et al. (2015) | Polychlorinated biphenyl congeners | Serum | ✓ | GC x GC-TOF MS | |||
| 18 | Pragst et al.(2013) | Children passive exposure to illegal drugs from parents abuse | Hair | ✓ | LC-QqTOF MS | |||
| 19 | Ristimaa et al. (2010) | In utero exposure to illegal drugs | Meconium | ✓ | LC-TOF MS | |||
| 20 | Rotander et al. (2015) | Fluorinated surfactants exposure in firefighters | Serum | ✓ | ✓ | ✓ | ✓ | LC-QqTOF MS |
| 21 | Fan et al. (2014) | General exposure to pesticides | Serum | ✓ | ✓ | ✓ | GC-QqTOF MS | |
| 22 | Swinton et al. (2011) | Smoking exposure | Urine | ✓ | LC-QqTOF MS | |||
| 23 | Taira et al. (2013) | Neonicotinoid pesticides exposure | Urine | ✓ | LC-TOF MS | |||
| 24 | Wang et al. (2014a) | Antibiotics exposure | Urine | ✓ | ✓ | ✓ | LC x LC-QqTOF MS | |
| 25 | Wang et al. (2015) | Antibiotics body burden | Urine | ✓ | LC-QTOF MS | |||
| 26 | Wu et al. (2012) | Exposure to triclosan from pharmaceuticals/personal care products | Serum | ✓ | ✓ | ✓ | LC-QqTOF MS | |
| 27 | Yamaguchi et al. (2012) | Pesticide exposure | Plasma | ✓ | ✓ | LC-QqTOF MS | ||
2.2. Sample preparation and separation
Pre-analytical steps such as collection, handling, and storage protocols of human samples are crucial for data quality and influence the outcomes of biomonitoring and exposome analysis (Dennis et al., 2016b). Standard operating protocols are critical for exposome data quality, but are lacking particularly in case of human matrices (Go et al., 2015). The sample preparation protocol and analyte separation technique selected can be a major determinant in defining which part of the exposome is captured.
2.2.1. Sample extraction and clean-up
Generally, extraction of a wide range of chemical classes using a single sample preparation protocol that is as broad as possible is ideal. Practically, a chemical profiling approach should involve minimal sample preparation to achieve unbiased analysis and better reproducibility. However, sample clean-up and pre-concentration of analytes is preferred to remove interfering matrix components and for trace analysis. Since human samples obtained in clinical, exposure and epidemiological studies are usually limited in volume, it is essential to follow an effective sample clean-up procedure. Homogenization is a required pre-extraction step for preparing soft and hard tissues such as breast adipose (Hernández et al., 2009b, Hernandez et al., 2005, Medina et al., 2008), umbilical cord (Marin et al., 2014), meconium (Ristimaa et al., 2010) and teeth (Andra et al., 2015). Protein precipitation of serum (Fan et al., 2014) and urine (McMahen et al., 2015), and enzymatic deconjugation of meconium (Ristimaa et al., 2010) and urine (Wang et al., 2014a) were sometimes included as a clean-up and pre-concentration step, respectively. In the case of urine analysis, there is a trend towards a dilute-and-shoot approach (Diaz et al., 2012) or absence of any treatment(Cequier et al., 2014) (Cortejade et al., 2016) (Carrizo et al., 2015). While this approach is suitable for metabolomics studies looking at endogenous metabolites that occur at relatively higher concentrations(Rappaport et al., 2014), this is not widely used for the untargeted analysis of low-level xenobiotics in human matrices due to matrix interferences.
C urrently, the most common sample preparation protocols for the analysis of environmental chemicals and their metabolites in human matrices are liquid-liquid (LLE) and/or solid-phase extractions (SPE). Different extraction solvent and sorbent combinations are available depending on the study objectives. When analyzing human samples with GC-HRMS methods, typically SPE with various polymer sorbents such as Oasis HLB ((Focant et al., 2004, Wang et al., 2014a, Wang et al., 2015, Sandau et al., 2003, Sjodin et al., 2004), Strata Silica (Hernández et al., 2009b) and C18 (Megson et al., 2013, Megson et al., 2015) (Fan et al., 2014) were used to cover a range of persistent organic pollutants. Interestingly, an HPLC cleanup on a silica column was used and the collected ethyl acetate fractions were pre-concentrated and injected into the GC-HRMS for analyzing anthropogenic chemical contaminants in human breast adipose tissue (Hernández et al., 2009b). For LC-HRMS methods, typically SPE with CEREX ‘hpspe’ THC column (Chittamma et al., 2013), Oasis HLB (McMahen et al., 2015), and ISOLUTE HCX mixed-mode sorbent (Ristimaa et al., 2010) or a LLE with acetonitrile (Rotander et al., 2015), methanol (Wu et al., 2012), ethyl acetate and tert-butyl methyl ether mixture (Yamaguchi et al., 2012), and hexane (Bouchard et al., 2009) were applied. These extractions largely capture a range of chemicals across the polarity spectrum. Taira et al. ((Taira et al., 2013)) used a combination of neutral, acidic, and basic SPE for profiling 27 metabolites of neonicotinoid pesticides in human urine. Specific SPE conditions were applied to retain and extract acidic neonicotinoid metabolites such as AM-2, IM-1, CM-1, basic ones such as AM-6, IM-10, and neutrals such as CM-2, CM-7, etc. (Taira et al., 2013). Similarly, Swinton et al. (Swinton DJ., 2011) used Oasis HLB and MCX mixed-mode cartridges for extracting nicotine and its metabolites in human urine. A supported LLE with ISOLUTE products was applied for extracting drugs and metabolites from umbilical cord (Marin et al., 2014), while LLE with ethanol, hexane and diethyl ether mixture followed by gel permeation chromatography with a Bio Beads S-X3 column was used for extracting PBDEs in human milk (Kazda et al., 2004). A sequential LLE and SPE protocol was applied for human plasma clean-up for perfluorinated compounds using acetonitrile extraction followed by a C18 concentration (Eom et al., 2014), and urine extraction for aromatics using a water and acid mixture followed by clean-up on an Oasis HLB cartridge (Marchese et al., 2004). An emerging area of biological sample preparation is the use of direct immersion solid phase micro-extraction for in vivo sampling and pre-concentration (Bessonneau et al., 2015) and in-vial dual extraction for small sample volumes (Whiley et al., 2012) that are currently used in metabolomics applications but are yet to be explored for studying the environmental chemical space of the human exposome. A multi-omics compatible sample preparation protocol was applied on tooth bio-matrix to achieve a wide coverage of biomarkers of exposure to environmental chemicals and bio-molecular responses of effect (Andra et al., 2015). Sample preparation steps involved in the targeted and untargeted analysis of environmental chemicals in human matrices using TOF- or QqTOF MS are detailed in Tables 2 and 3, respectively. These sample preparation procedures can also be used for analysis with other HRMS tools.
Table 2.
Analytical method features of the 12 studies that applied time-of-flight mass spectrometry methods for the targeted analysis of environmental organic chemical contaminants and their metabolites in human matrices.
| Study # | Targeted analytes (i) Number of analytes (ii) Type of analytes |
(i) Bio- matrix (ii) Sample volume |
(i) Sample treatment (ii) Internal standards (ISTDs number and name of the labeled compounds) |
(i) Analytical method (ii) LC or GC column (iii) Ionization mode |
(i) LOD (ii) LOQ |
(i) Detection rate [number and/or (%)] (ii) Concentration range |
Study reference [and reference to the original analytical method given in parenthesis where available] (chronological order) |
|---|---|---|---|---|---|---|---|
| 1 | (i) 10 (ii) Metabolites of polycyclic aromatic hydrocarbons: 1-OH-benz[a]anthracene, 3-OH-benz[a]anthracene, 3-OH-chrysene, 6-OH-chrysene, 3-OH-fluoranthene, 1-OH-pyrene (OHP), pyrene 1,6-dione, pyrene 1,8-dione, 1-Naphthol, 2-Naphthol |
(i) Urine (ii) 5.0 mL |
(i) Liquid-liquid extraction and enzymatic hydrolysis (ii) 5 deuterated ISTDs: 1-OHP-d9, 1-naphthol-d8, and 2-naphthol-d7 13C labeled: 3-hydroxyflouranthene-13C6 and 6-hydroxychrysene-13C6 |
(i) UPLC-TOF MS (Acquity and LCT Premier, Waters) (ii) C8 reverse-phase column (100 mm x 2.1 mm x 1.7 μm) (iii) ESI-negative ion mode |
(i) 0.005–0.04 μg/L (ii) 0.015–0.12 μg/L |
(i) Exposed group (n = 73), and control group (n = 71). N = 699, and detection varied between 48% and 100% (ii) Geometric mean concentrations of: 1-OH-pyrene: 0.025 to 0.058 μmol/mol of creatinine Pyrene 1,6- and 1,8-diones: 0.014 to 0.056 μmol/mol of creatinine 1-Naphthol: 0.629 to 1.75 μmol/mol of creatinine 2-Naphthol: 1.37 to 2.56 μmol/mol of creatinine |
Bouchard et al. (2009) |
| 2 | (i) 6 (ii) Organo-phosphate metabolites: di-n-butyl phosphate (DNBP), diphenyl phosphate (DPHP), bis(2-butoxyethyl) phosphate (BBOEP), bis(2-chloroethyl) phosphate (BCEP), bis(1-chloro-2-propyl) phosphate (BCPP) and bis(1,3-dichloro-2-propyl) phosphate (BDCIPP). |
(i) Urine (ii) 1.5 mL |
(i) No pre-concentration. Centrifugation and supernatant collection. (ii) 4 deuterated ISTDs: DPHP-d10, BCEP-d8, BDCIPP-d10, BBOEP-d4 |
(i) UPLC-QqTOF MS (Xevo G2-S QTOF Waters) (ii) Acquity UPLC BEH C18 column (50 mm x 2.1 mm x 1.7 μm, pH 2–12, Waters) (iii) ESI (negative). |
(i) n.a. (ii) Range between 0.10 ng mL−1 (DPHP) and 0.60 ng mL−1 (BBOEP) [Method limits of quantification, MLQ]. |
(i) N = 84 (42 mother-child pairs), and detection range between (a) 14% (DNBP) and 100% (DPHP) [children]; and (b) 0% (BBOEP) -100% (DPHP) [corresponding mothers]. (ii) (a) Range between <MLQ (DNBP, BBOEP) and 1.1 ng mL−1 GM (DPHP) [children]; and (b) <MLQ (DNBP, BBOEP) – 0.57 ng mL−1 GM (DPHP) [corresponding mothers]. |
Cequier et al. (2014) |
| 3 | (i) 4 (ii) Organo-phosphate metabolites: di-n-butyl phosphate (DNBP), diphenyl phosphate (DPHP), bis(2-butoxyethyl) phosphate (BBOEP), and bis(1,3-dichloro-2-propyl) phosphate (BDCIPP). |
(i) Urine (ii) 1.5 mL |
(i) No pre-concentration. Centrifugation and supernatant collection. (ii) 4 deuterated ISTDs: DPHP-d10, BCEP-d8, BDCIPP-d10, BBOEP-d4 |
(i) LC-QqTOF MS (Xevo G2-S QTOF Waters) (ii) Acquity UPLC BEH C18 column (50 mm x 2.1 mm x 1.7 μm, pH 2–12, Waters) (iii) ESI (negative). |
(i) Range between 0.10 ng mL−1 (DPHP) and 0.60 ng mL−1 (BBOEP) [Method limits of detection, MLD]. [[NOTE: Same information was given as MLQ in Cequier et al., 2013]]. (ii) n.a. |
(i) N = 54 children, 112 samples, and 48 mothers, 244 samples. Detection in the range between (a) 15% (DNBP) and 97% (DPHP) [children]; and (b) <1% (BBOEP) - 97% (DPHP) [corresponding mothers]. (ii) (a) Range between <MLD (DNBP) and 3.2 ng mL−1 Mean (DPHP) [children]; and (b) <MLD (DNBP, BBOEP) – 1.2 ng mL−1 Mean (DPHP) [corresponding mothers]. |
Cequier et al. (2015) |
| 4 | (i) 38 (ii) Pesticides (12): carbendazim, imazalil, cyprodinil, ethylene thiourea, 2-phenylphenol, diuron, linuron, methamidophos, methomyl, acephate, dimethoate and omethoate. Parathion metabolite (1): O,O-diethyl thiophosphate potassium. Veterniary drugs (7): marbofloxacin, difloxacin, danofloxacin, enrofloxacin, clorsulon, dicyclanil and levamisole Parabens (5): propylparaben, butylparaben, methylparaben, ethylparaben and isopropylparaben. UV filter (1): cyasorb UV9 Plastic additive (1): bisphenol A Surfactants (2): perfluorooctonic acid and sodium dodecylbenzenesulfonate Substances used in daily routines (9): tributyl phosphate, 4′-hydroxyacetophenone, dibutylphosphate, bis(2-ethylhexyl) phosphate, perfluoropentanoic acid, undecafluorohexanoic acid, perfluorononanoic acid, 4-hydroxybenzoic acid and heptafluorobutyric acid |
(i) Urine (ii) n.a. |
(i) No pre-concentration. (ii) n.a |
(i) UHPLC-QqTOF MS ( UHPLC Ultimate 3000, Thermo Scientific and micrOTOF Q II, Bruker Daltonics) (ii) XSelect CSH reversed phase (2.1 x 100 mm; 3.5 mm, Waters) column for separations in positive ion mode. Kinetex reversed phase (2.1 x 100 mm; 2.6 mm, Phenomenex) column for separation in negative ion mode. (iii) ESI (positive and negative ion mode) |
(i) 2.2–46.0 ng mL−1 (ii) 4.3–113.2 ng mL−1 |
(i) N = 17 urine samples; and 4 out of 38 targets were detected (tributylphosphate, sodium dodecyl benzenesulfonate,4-hydroxy benzoicacid and O,O-diethyl thiophosphate potassium) (ii) n.a. |
Cortejade et al. (2016) |
| 5 | (i) 2 (ii) Polyfluorinated compounds: perfluorooctanoate (PFOA) and perfluorooctane sulfonate (PFOS) |
(i) Plasma (ii) 5.0 mL |
(i) Sequential LLE and SPE (C18). (ii) 1 structural analog as a surrogate: tridecafluoroheptanoic acid (PFHpA) |
(i) LC-TOF MS (Agilent HP 1100 HPLC, LECO Unique TOF MS) (ii) C18 column (150 mm x 2.0 mm x 5 μm, Shiseido UG 120V) (iii) ESI (negative). |
(i) n.a. (ii) Range between 0.4 ng mL−1 (PFOA) and 0.6 ng mL−1 (PFOS). |
(i) N = 183 plasma samples. (ii) (a) Residents mean PFOA between 0.79 ng mL−1 (metropolitan) and 2.19 ng mL−1 (industrial area); and (b) residents mean PFOS between 2.47 ng mL−1 (metropolitan) and 6.57 ng mL−1 (industrial area). |
Eom et al. (2014) |
| 6 | (i) 59 (ii) Polybrominated diphenyl ethers, polybrominated and polychlorinated biphenyls, and organochlorine pesticides: 2,2′,5-TriCB; 2,4′,4-TriCB; 2,4′,6-TriCB; 2,2′,3,5′-TetraCB; 2,2′,4,5′-TetraCB; 2,2′,5,5′-TetraCB; 2,3′,4,4′-TetraCB; 2,3′,4′,5-TetraCB; 2,4,4′,5-TetraCB; 2,2′,3,4,5′-PentaCB; 2,2′,4,4′,5-PentaCB; 2,2′,4,5,5′-PentaCB; 2,3,3′,4,4′-PentaCB; 2,2′,3,4′,6-PentaCB; 2,3,3′,5,5′-PentaCB; 2,3′,4,4′,5-PentaCB; 2,2′,3,3′,4,4′-HexaCB; 2,2′,3,4,4′,5′-HexaCB; 2,2′,3,4′,5,5′-HexaCB; 2,2′,3,4′,5′,6-HexaCB; 2,2′,3,5,5′,6-HexaCB; 2,2′,4,4′,5,5′-HexaCB; 2,3,3′,4,4′,5-HexaCB; 2,3,3′,4,4′,5′-HexaCB; 2,3,3′,4,4′,6-HexaCB; 2,3′,4,4′,5,5′-HexaCB; 2,2′,3,3′,4,4′,5-HeptaCB; 2,2′,3,3′,4,5,5′-HeptaCB; 2,2′,3,3′,4′,5,6-HeptaCB; 2,2′,3,3′,5,5′,6-HeptaCB; 2,2′,3,4,4′,5,5′-HeptaCB; 2,2′,3,4,4′,5,6-HeptaCB; 2,2′,3,4′,5,5′,6-HeptaCB; 2,3,3′,4,4′,5,5′-HeptaCB; 2,2′,3,3′,4,4′,5,5′-OctaCB; 2,2′,3,3′,4,4′,5,6-OctaCB; 2,2′,3,3′,4,4′,5′,6-OctaCB; 2,2′,3,3′,4,5,5′,6-OctaCB; 2,2′,3,4,4′,5,5′,6-OctaCB; 2,2′,3,3′,4,4′,5,5′,6-NonaCB; 2,2′,3,3′,4,5,5′,6,6′-NonaCB; 2,2′,3,3′,4,4′,5,5′,6,6′-DecaCB; 1,2,3,4-TCDD; 2,2′,4-TriBDE; 2,4′,4-TriBDE; 2,2′,4,4′-TetraBDE; 2,3′,4,4′-TetraBDE; 3,3′,4,4′-TetraBDE; 2,2′,3,4,4′-PentaBDE; 2,2′,4,4′,5-PentaBDE; 2,2′,4,4′,6-PentaBDE; 2,2′,4,4′,5,5′-HexaBDE; 2,2′,4,4′,5,5′-HexaBB; 2,2′,4,4′,5,6′-HexaBDE; HCB; β–HCH; γ-HCH; Heptachlor epoxide; Oxychlordane; t-nonachlor; Dieldrin; o,p′–DDT; p,p′–DDT; Mirex; and p,p′-DDE |
(i) Serum and Milk (ii) 4 mL serum, and 1 g milk |
(i) Solid phase extraction (two-layered custom-made SPE cartridge, 3 mL, packed with 100 mg of silica and 1000 mg of sulfuric acid silica.) (ii) 21 PCB ISTDs with 13C12-labeled PCBs; 8 BDE ISTDs with 13C12-labeled BDEs; 1 BB ISTD with 13C12 BB-153; and other ISTDs with 13Cn-labeled compounds such as 13C6-HCB; 13C6-β-HCH; 13C6-γ-HCH; 13C12-Dieldrib; 13C10-Mirex; 13C12-2,4′-DDT; 13C12-4,4′-DDT; 13C12-4,4′-DDE; etc. |
(i) GC x GC (2D-GC)-ID-TOF MS (ii) First dimension column (1D) : DB-1 100% dimethylpolysiloxane (1.2 m x 0.10 mm i.d., 0.25 μm film thickness, J&W Scientific). Second dimension column (2D) : High temperature HT-8 (8% Phenyl)-polycarboranesiloxane (1.2 m x 0.10 mm i.d., 0.10 μm film thickness, SGE, Austin, TX). (iii) Electron capture negative ionization |
(i) Instrument detection limits : 0.5–10 pg μL−1 ; Method detection limits range : 1–15 pg μL−1 (ii) n.a. |
(i) 15 serum samples and 13 milk samples ; ~100% detection (ii) Mean range for all analytes : 0.1–200 pg g−1 fresh weight serum and 0.4–493.5 ng g−1 lipid in milk. |
Focant et al. (2004) [Sandau et al. (2003), Sjodin et al.(2004)] |
| 7 | (i) 10 (ii) Polybrominated diphenyl ethers: BDE 28, BDE 47, BDE 49, BDE 66, BDE 85, BDE 99, BDE 100, BDE 153, BDE 154, and BDE 183 |
(i) Milk (ii) 10 mL |
(i) LLE followed by gel permeation chromatography (ii) PCB 112 |
(i) GC-TOF MS (ii) DB-XLB capillary (30 m x 0.25 mm i.d., 0.1 μm film thickness, Agilent). (iii) Negative chemical ionization |
(i) TOF-MS analyzer: 0.002–0.005 ng g−1 lipid weight (ii) n.a. |
(i) 103 samples, BDE-47: 100% detection; BDE 99, 100 and 153: 60% detection; BDE 49, 66, 85, 154 and 183: ~20% detection; and BDE 28: ~7% detection. (ii) Mean: 0.08–0.86 ng g−1 lipid weight |
Kazda et al. (2004) |
| 8 | (i) 6 (ii) Metabolites of benzene, toluene, xylene and styrene: trans,trans-muconic acid, hippuric acid, o-, m-, and p-methyl hippuric acid and phenylglyoxilic acid |
(i) Urine (ii) 0.5 mL |
(i) LLE followed by SPE (ii) n.a |
(i) LC-QqTOF MS (ii) Alltima (150 mm x 1 mm i.d x 3 μm) C18 RP column (Alltech) (iv) ESI-negative ion mode |
(i) 1–45 ng mL−1 (ii) 3–136 ng mL−1 |
(i) 8 samples, trans,trans-muconic acid: 100% detection (ii) 65–216 μg g−1 creatinine |
Marchese et al. (2004) |
| 9 | (i) 209 (ii) Polychlorinated biphenyls: 84 congeners were detected including the European Union 7 indicator congeners (EC7): CB-28, CB-52, CB-101, CB-118, CB-138, CB-153, CB-180. |
(i) Serum (ii) 1.5 g |
(i) SPE (C18) (ii) 20 PCB 13C12 ISTDs (CIL-EC-5367 CDC PCB Spiking Standard): 13C12 PCB-28,-52,-101,-123,-118,-114,-153,-105,-178,-138,-128,-167,-156,-157,-180,-170,-189,-194,-206, and -209. |
(i) GC x GC (2D-GC)-TOF MS (ii) 1st dimension column: Rtx-PCB (60 m x 0.18 mm x 0.18 μm) and 2nd dimension column Rxi-17 Sil MS (1.5 m x 0.18 mm x 0.18 μm); TOF-MS (LECO)]. (iii) Electron impact (EI). |
(i) Range between 1 ng mL−1 (PCB-18, -28, -52, -66, and -95) and 50 ng mL−1 (PCB-169, -170, -180, -191, -194, -195, -205, -206, -208, and -209). (ii) n.a. |
(i) 100% [for the sum of 7 indicator congeners (ΣEC7)]. (ii) 11 – 350 ng g−1 serum (1.2 – 39 μg g−1 lipid) [for ΣEC7]. |
Megson et al. (2015) [Megson et al. (2013)] |
| 10 | (i) 7 classes (ii) Methadone, cocaine, heroin, amphetamines and/or ecstasy, cannabinoids, diazepam or nordazepam, and benzodiapenes and their metabolites and degradation products |
(i) Hair (ii) 20 mg |
(i) Liquid-liquid extraction (ii) 5 deuterated ISTDs: D3-THC, D3-CBN, D3-CBD, D3-THC-COOH, D9-THC-COOH |
(i) LC-QqTOF MS (ii) Eclipse XDB-C18 5 μm, 3 x 150 mm (Agilent) (iii) ESI–positive ion mode |
For basic drugs and benzodiazepines (i) 0.001–0.005 ng mg−1 (ii) 0.002–0.007 ng mg−1 For Cannabinoids: (i) THC–0.003 ng mg−1, CBN–0.004 ng mg−1, and CBD 0.004 ng mg−1 (ii) THC–0.01 ng mg−1, CBN–0.01 ng mg−1, and CBD 0.1 ng mg−1 For 11-Nor-9-carboxy-D9-tetrahydrocannabinol: (i) 0.038 pg mg−1 (ii) 0.18 pg mg−1 |
(i) 149 samples, Cannabinoids total : 37.5% detection ; methadone total : 24.2 % detection ; heroin : 29.5% detection ; cocaine : 49.0% detection ; amphetamine and/or ecstasy : 4% detection ; and diazepam or nordazepam : 6% detection. (ii) Methadone : LOQ-2.16 ng mg−1 ; acetylmorphine : LOQ-11.1 ng mg−1 ; cocaine : LOQ-17.8 ng mg−1 ; amphetamine : LOQ-3.29 ng mg−1 ; and D9-tetrahydro-cannabinol : LOQ-0.72 ng mg−1. |
Pragst et al. (2013) |
| 11 | (i) 3 (ii) Tobacco metabolites : nicotine (NIC), cotinine (COT), and trans-3′-hydroxycotinine (3-OHCOT) |
(i) Urine (ii) 50 μL |
(i) Solid phase extraction (Oasis HLB and MCX mixed mode cartridges). (ii) 3 deuterated ISTDs: NIC-D3; COT-D3; 3-OHCOT-D3. |
(i) LC-QqTOF MS (ii) Discovery HS F5 column (100 mm x 4.6 mm x 3 μm, Supleco); 1260 HPLC (Agilent Technologies, Inc.) (iii) ESI (positive and negative). |
(i) Range between 0.5 ng mL−1 (NIC and COT) and 5.0 ng mL−1 (3-OHCOT). (ii) Range between 1.0 ng mL−1 (NIC and COT) and 7.8 ng mL−1 (3-OHCOT). |
(i) n.a. (ii) n.a. |
Swinton et al. (2011) |
| 12 | (i) 18 (ii) Antibiotics : 5 macrolides, 2 β-lactams, 3 tetracyclines, 4 quinolones, and 4 sulfonamides Macrolides: azithromycin, clarithromycin, erythromycin, roxithromycin, tylosin β-lactams: ampicillin, cefaclor Tetracyclines: oxytetracycline, chlortetracycline, tetracycline Quinolones: ofloxacin, ciprofloxacin, enrofloxacin, norfloxacin Sulfonamides: sulfamethazine, trimethoprimd, sulfamethoxazole, sulfadiazine |
(i) Urine (ii) 1.0 mL |
(i) SPE [Oasis 96-well HLB, 60 mg/ 2 mL, Waters] (ii) 12 isotopically labeled ISTDs: tetracycline-d6; ciprofloxacin-d8; enrofloxacin-d5; azithromycin-d3; sulfadiazine-13C6; sulfamethoxazole-d4; trimethoprim-d3; clarithromycin-n-methyl-d3, ofloxacin-d3, sulfamethazine-d4, erythromycin-13C, d3, and 4-MU-13C4. |
(i) UPLC x UPLC (2D-LC)-QqTOF MS (ii) Trapping column: XBridge C18 (30 mm x 2.1 mm x 10 μm) (Waters); and Separation column: HSS T3 (100 mm x 2.1 mm x 1.8 μm) (Waters). (iii) ESI (both positive and negative mode). |
(i) 0.04–1.99 ng mL−1 (ii) 0.14–6.65 ng mL−1 |
(i) 1064 school children urine samples, all antibiotics: 58% detection. (ii) All antibiotics: 0.1–42,689 ng mL−1 |
Wang et al. (2015) [Wang et al. (2014a)] |
Table 3.
Analytical characteristics of 8 studies that applied time-of-flight mass spectrometry for the untargeted analysis of environmental organic chemical contaminants and their metabolites in human matrices.
| Study # | Screeni ng type |
(i) Chemical class and compound s of study interest (number of analytes) (ii) Human exposure source/ route in the study |
(i) Human bio- matrix (ii) Sample volume or mass (iii) Sample size |
Analytical instrumenta tion |
(i) Sample pretreatment (ii) extraction and clean-up method (iii) ISTDs (number/name of the labeled compounds) |
(i) LC or GC system (ii) LC or GC column (iii) Sample injection volume (iv) LC or GC conditions (v) Flow rate (vi) Run time (min) |
(i) MS system (ii) MS ionization mode (iii) MS resolving power (iv) MS mass range (v) Other notes |
MS Software (prediction / post data treatment) |
Confirmed compounds |
Tentatively- identified compounds |
Study reference [and reference to the original analytical method given in parenthesi s where available] (chronolog ical order) |
|---|---|---|---|---|---|---|---|---|---|---|---|
| 1 | Suspect and unknowns screening | (i) Polycyclic aromatic hydrocarbons (PAHs), their nitro-and oxo-derivatives. (n = 31) (ii) Smoker versus non-smoker |
(i) Saliva and urine (ii) Few drops on the glass rod (iii) N=4 (saliva = 2, urine =2) |
ASAP-QqTOF MS | (i) No sample pretreatment and/or extraction. (ii) The atmospheric solids analysis probe (ASAP) was directly dipped into the raw sample (without any preparation/extraction). (iii) 2 deuterated ISTDs: Acenaphthene-d10 and benzo[a]pyrene-7,8-d2 |
(i) No LC or GC (chromatography-free approach) (ii) n.a. (iii) n.a. (iv) n.a. (v) n.a. (vi) 3.0 min MS acquisition time. |
(i) Xevo G2 QqTOF (Waters Corporation, Manchester, UK). (ii) Atmospheric pressure chemical ionization. (iii) >22,500 full width at half maximum (FWHM). (iv) up to 100,000 m/z. (v) (a) Acquisition in a full scan mode from 70 to 800 amu with 1s scan time (to cover all PAH, nitro-PAH and oxo-PAH standards), and (b) lock mass analyte: leucine-enkephalin at 2 ng mL−1 [(MH)+: 556.2771 Da]. |
MassLynx software (Waters Corporation). | PAHs: acenaphthene m/z 154.0782, phenanthrene/anthracene m/z 178.0782, benzo[a]anthracene/chrysene m/z 228.0782 (in both saliva and urine from smoker but not in non-smoker) | (i) Nitro-PAHs: 9-nitro anthracene m/z 223.0633 (smoker saliva). (ii) Oxo-PAHs: 1,4-naphthalenedione m/z 158.0368 (smoker urine). |
Carrizo et al. (2015) |
| 2 | Suspect screening | (i) Drugs of abuse (illegal drugs) (n = 1). (ii) In utero exposure to Marijuana from mother’s drug abuse |
(i) Umbilical cord. (ii) 1 ± 0.1 g. (iii) N = 16 |
LC-TOF MS | (i) (a) Pulverize the tissue, (b) add cold MeCN while vortex, (c) mix and centrifuge, (d) collect supernatant for SPE. (ii) (a) SPE [CEREX hpspe THC SPE columnS; SPEware, Inc.], (b) condition with MeOH and H2O, (c) elution for both acidic and basic analyte with a mixture of C6H14 and CH3COOC2H5 (50:50, v/v); and a mixture of C6H14, CH3COOC2H5 and CH3COOH (90:10:2, v/v/v), (d) extract evaporation (N2, 40°C), and (e) reconstitution in a mixture of MeOH and H2O (75:25, v/v). (iii) n.a. |
(i) 1260 HPLC (Agilent Technologies, Inc.). (ii) Poroshell 120 C8 column (100 mm x 3.0 mm x 2.7 μm) (Agilent Technologies Inc.). (iii) 40 μL (iv) Column temp: 55°C; Mobile phase [A]: HCOONH4 (5 mM, pH 3.5); and [B]: MeOH (in isocratic mode at 25% A and 75% B). (v) 0.5 mL min−1. (vi) 10.0 min (run) and 1.0 min (post-run) |
(i) 6230 TOF (Agilent Technologies, Inc.)]. (ii) ESI (positive and negative–fats polarity switching, 1700 amu, 2 GHz, extended dynamic range). (iii) n.a. (iv) 105–1000 amu. (v) Reference masses (positive mode): Purine m/z 121.050873, HP-921 m/z 922.009798; mass tolerance ± 25 ppm; retention time tolerance ± 0.1 min. |
MassHunter Qualitative Analysis software B.05.001 (Agilent Technologies, Inc.). | 11-nor-delta-9-carboxy-tetrahydrocannabinol (THC-COOH) | n.a. | Chittamma et al. (2013) |
| 3 | Suspect and unknowns screening | (i) Persistent and anthropogenic contaminants [N = 112 compounds with 24 knowns (pre- and post-target analytes) and 11 non-target analytes. (ii) General exposures in the environment.. |
(i) Breast adipose tissue. (ii) 0.1–0.5 g. (iii) N = 42 samples from 21 patients. Two matrices per patient: adipose breast tissue and tumor fragment. |
GC-TOF MS | (i) (a) Add internal standards; (b) tissue homogenize with anhydrous Na2SO4; (c) extraction with CH3(CH2)4CH3; (d) vortex, filter, and evaporation (N2); and (e) reconstitution with n-CH3(CH2)4CH3. (ii) I: (a) HPLC cleanup using a silica column; (b) collect eluting fraction between 1 and 17 min. using a n-CH3(CH2)4CH3 mobile phase (eluate A) and between 4–17 min. in a different run using a n-CH3(CH2)4CH3 /CH3COOC2H5 (95:5, v/v) mobile phase (eluate B). II: (a) SPE [Strata silica, 1 mg, Phenomenex]; (b) elute with CH3(CH2)4CH3; (c) evaporation (N2, 40°C) and reconstitution in CH3(CH2)4CH3. (iii) 3 isotopically labeled surrogates: hexachlorobenzene (HCB)-13C6; p,p′ - DDE-d8; and β-endosulfan-d4 |
(i) 6890N GC (Agilent Technologies, Inc.). (ii) HP-5MS capillary column (30 m x 0.25 mm x 0.25 μm) (J & W Scientific). (iii) 1 μL (splitless injection). (v) 1 mL min−1 (Helium). (v) >30.0 min. |
(i) TOF MS, GCT (Waters). (ii) Electron ionization (EI) mode. (iii) 8500 FWHM (at m/z 612). (iv) Scan range: 50–650 m/z. (v) Heptacosa (m/z 218.9856) as a mass calibrator and lock mass analyte. |
(i) TargetLynx, (ii) MassLynx, and (iii) ChromaLynx. |
(i) PCB 28; PCB 101; PCB 114; PCB 118; PCB 123; PCB 138; PCB 153; PCB 156; PCB 157; PCB 167; PCB 180; PCB 189; (ii) Hexachlorobenzene (HCB) (iii) β-hexachlorocyclohexane (β-HCH) (iv) 1,1-Dichloro-2,2-bis(p-chlorophenyl) ethylene (p,p′-DDE) (v) dichloro-diphenyldichloroe thane (p,p′-DDD) (vi) dichloro-diphenyltrichloroethane (p,p′-DDT) (vii) oxychlordane (viii) trans-nonachlor (ix) Mirex (x) naphthalene (xi) phenanthrene (xii) fluoranthene (xiii) Pyrene. |
(i) PCB 4Cl (ii) PCB 5Cl (iii) PCB 7Cl (isomer 1) (iv) PCB 7Cl (isomer 2) (v) PCB 7Cl (isomer 3) (vi) PCB 8Cl (vii) 3,5-di-tert-butyl-4-hydroxy-toluene (BHT) (viii) 3,5-di-tertbutyl-4-hydroxybenzaldehyde (BHT-CHO) (ix) dimethylnaphthalene (x) 2-methyl naphthalene (xi) N-butyl benzenesulfonamide (N-BBSA). |
Hernandez et al. (2009b) [Hernandez et al. (2005), Medina et al. (2008)] |
| 4 | Unknowns screening | (i) Fipronil insectide metabolites (n = 7). (ii) Likely exposures from contact with pets, and indoor or outdoor application of insecticide. |
(i) Urine and Serum (ii) 5–12 mL (urine) and 200 μL serum (iii) N = 96 |
HPLC-TOF MS | [I] Urine: (i) Precipitation with MeCN (1 mL). (ii) (a) SPE cartridge [Oasis HLB, 6 cc, Waters]; (b) condition with MeOH (5 mL) and H2O (5 mL); (c) wash with H2O and MeCN mixture (95:5, 5 mL); (d) elution with MeCN (5 mL); (e) evaporation with N2 (40°C); (f) reconstitution with CH3COONH4 (50:50, 10mM). (iii) 1/ fluoride: Fipronil des-F3. [II] Serum: (i) Precipitation with MeCN (2 mL) and centrifugation. (ii) (a) SPE cartridge [Oasis HLB, 3 cc, Waters]; (b) condition with MeOH (3 mL) and H2O (3 mL); (c) step c-f same as above. (iii) 1 fluoride ISTD: Fipronil des-F3. |
(i) 1100 HPLC (Agilent Technologies, Inc.). (ii) Luna C18 column (50 mm x 3 mm x 5 μm) (Phenomenex, Inc.), and a guard column (Phenomenex, Inc.). (iii) n.a. (iv) Column temp: 30°C; Mobile phase [A]: MeOH and H2O mixture (5:95 v/v) with HCOONH4 buffer (0.4mM); and [B]: MeOH and H2O mixture (95:5 v/v) with HCOONH4 buffer (0.4mM). (v) 0.2 mL min−1. (vi) 18.0 min. |
(i) 6210 TOF MS (Agilent Technologies, Inc.). (ii) ESI (negative). (iii) n.a. (iv) n.a. (v) Mass accuracy drift was monitored by purine (m/z = 119.0363) and hexakis (1H, 1H, 3H-tetrafluoroprop oxy) phosphazene [m/z 966.0007] using dual-ESI sprayer. |
Mass Profiler Software | (i) Fipronil sulfone (M1); (ii) ring opened hydroxyl amine intermediate (M2); (iii) hydroxyl amine metabolite (M3); (iv) sulfonated conjugate (M5); and (v) glucuronidated conjugate (M6) |
(i) Nitroso metabolite (M4); and (ii) imine metabolite (M7) |
McMahen et al. (2015) |
| 5 | Suspect screening | (i) Prescribed and illicit drugs (screened compounds, N=77) (ii) Fetal exposure from pregnant mother’s abuse of drugs. |
(i) Meconium (ii) 2 g. (iii) N = 209 meconium samples. |
HPLC-TOF MS | (i) (a) Add internal standards; (b) add methanol, vortex and sonicate for homogenization; (c) centrifugation and supernatant collection; (d) two separate methanolic extracts (supernatant) are collected for the (d-i) opioids/amphetamines/other drugs analysis and (d-ii) TCH-COOH analysis, (e) add HCl/MeOH mixture (20 mM) to minimize amphetamine evaporation; (f) supernatants are evaporated to dryness (N2) and reconstituted with phosphate buffer (0.1 M, pH 6.0), vortex and sonicate; and (g) enzymatic hydrolysis with β-glucuronidase (46°C, 16h). (ii) SPE for amphetamines/opioid s/other drugs: (a) SPE cartridge [ISOLUTE HCX, mixed-mode, 10 mg, 10 mL, International Sorbent Technologies Varian]; (b) enzymatically hydrolyzed fraction treated with phosphate buffer (0.1 M, pH 6.0); (c) SPE cartridges conditioned with MeOH, followed by H2O and 0.1 M phosphate buffer; (d) washed sequentially with 0.1 M phosphate buffer (pH 6.0)/CH3COOH/MeOH/CH3COOC2H5-CH3(CH2)4CH3 (25:75, v/v); (e) basic fraction eluted with CH3COOC2H5-NH4OH (98:2, v/v); (f) evaporated (N2) and reconstituted in MeCN and 10 mM CH3COONH4 (with 0.1% HCOOH, pH 3.2) (1:15, v/v). (iii) 8 deuterated ISTDs: morphine-d3, codeine-d3, buprenorphine-d4, norbuprenorphine-d3, amphetamine-d5, methamphetamine-d5, MDMA-d5, THC–COOH-d3 |
(i) 1100 LC (Agilent Technologies, Inc.). (ii) Luna PFP (2) (100 mm x 2.0 mm x 3.0 μm) (Phenomenex ), and PFP guard column (4.0 mm x 2.0 mm) (Phenomenex). (iii) 10 μL (iv) Column temp: 40°C; Mobile phase [A]: CH3COONH 4 (2 mM) with CH3COOH (0.1% v/v); and [B]: MeOH. (v) 0.3 mL min−1. (vi) 20.0 min. (sample run), 8.0 min. (equilibration), and 28.0 min. (total run time). |
(i) micrOTOF (Bruker Daltonics). (ii) ESI (positive). (iii) Nominal resolution: 10,000 (iv) Scan range: 50–800 m/z (v) NaOH (10 mM) in C3H7OH/0.2%HCOOH (1:1, v/v) solution infusion for mass scale calibration. |
(i) Bruker Daltonics HyStar 3.2, (ii) micrOTOF control 2.2 software, (iii) Bruker Daltonics TargetAnalysis 1.1., and (iv) DataAnalysis 3.4 software. |
77 compounds primarily belonging to the following classes: (i) local anesthetics, (ii) tobacco metabolites, (iii) opioids, (iv) stimulants, (v) hypnotics and sedatives, (vi) antidepressants, (vii) antipsychotics, and (viii) cannabis metabolites. | n.a. | Ristimaa et al. (2010) [Pelander et al. (2008)] |
| 6 | Suspect screening | (i) Neonicotinoid pesticides metabolites (screened analytes, N=57). (ii) Possible neonicotinoid insecticide poisoning. |
(i) Urine (ii) 1.0 mL (iii) N = 10 (patient, n =3; and negative controls, n = 7). |
UPLC-TOFMS | (i) Centrifugation and filtration (0.45 μm). (ii) (a) SPE cartridge [Plexa, 30 mg, 40 μm, Varian]; (b) neutral SPE: wash with H2O (1 mL) and extraction with MeCN (500 μL); (c) concentration and reconstitution with 5% MeCN and H2O mixture with 0.1% HCOOH; (d) acidic SPE: HCOOH (2.5 μL); and (e) basic SPE: 25% NH4OH (20 μL). (iii) Fipronil as ISTD. |
(i) Acquity UPLC (Waters). (ii) HSS T3 column (2.1 mm x 50 mm x 1.8 μm, 100°A) (Waters). (iii) 10 μL (iv) Mobile phases: H2O and MeCN with 0.1% HCOOH. (v) 0.4 mL min−1. (vi) 8.0 min. |
(i) LCT Premier™ XE orthogonal acceleration time-of-flight MS (Waters). (ii) Both ESI positive and negative mode. (iii) n.a. (iv) Mass detection range: 50–1000 m/z (v) n.a. |
(i) metaProfiling, and (ii) metaComparing Software. |
Metabolites of (i) acetamiprid [n = 12]; (ii) imidacloprid [n = 11]; (iii) clothianidin [n = 13]; (iv) chloropyridinyl neonicotinoid [n = 10]; (v) imidacloprid and clothianidin [n = 1]; and (vi) clothianidin and thiamethoxam [n = 10]. | n.a. | Taira et al. (2013) |
| 7 | Suspect screening | (i) Triclosan (TCS) and metabolites (n=1+3=4) (ii) General exposure from the use of pharmaceutical and personal care products. |
(i) Serum (ii) 0.25 mL (iii) N = 100 samples |
UHPLC-QqTOF MS | (i) Vortex and homogenization. (ii) (a) LLE [HCOOH (10% w/w in H2O); MeOH]; (b) centrifugation, supernatant collection and concentration; and (c) residue reconstitution [MeCN and H2O (1:1)], centrifugation and supernatant analysis. (iii) 1 stable carbon-13 labeled isotope ISTD: 13C12-TCS. |
(i) 1290 LC (Agilent Technologies, Inc.). (ii) Zorbax-Extend C18 (50 mm x 2.1 mm x 1.8 μm) (Agilent Technologies, Inc.). (iii) 5 μL (iv) Column temp: 40°C; Mobile phase [A]: HCOOH (0.001% v/v) and 1 mM HCOONH4 in H2O; and [B]: HCOOH (0.001% v/v) and 1 mM HCOONH4 in MeCN (95%) and H2O (5%). (v) 1.0 mL min−1. (vi) 5.0 min. |
(i) 6540 UHD Accurate-Mass QqTOF MS (Agilent Technologies, Inc.). (ii) ESI (negative), with Jet Stream Thermal Gradient Focusing Technology. (iii) n.a. (iv) Accurate mass scan range: 100–1700 m/z (v) Internal reference masses with m/z 119.0363 (C5H4N4) and 966.0007 (C19H20F24N3O 8P3) |
MassHunter: (i) Data Acquisition Software, and (ii) Metabolite ID version B.02.00 (Agilent Technologies, Inc.). |
(i) TCS; (ii) Sulfonated TCS; (iii) Hydroxylated sulfonated TCS; and (iv) Glucuronidated TCS. | n.a. | Wu et al. (2012) |
| 8 | Suspect and unknowns screening | (i) Tolfenpyrad (TFP) pesticide and metabolites (n=1+5=6) (ii) Pesticide poisoning. |
(i) Plasma (ii) 0.10 mL (iii) N = 1 person. |
HPLC-QqTOF MS | (i) Add aqueous K2HPO4 (0.5 mol L−1) (ii) (a) LLE [add MBTE (1:1 v/v)]; (b) vortex, centrifugation, supernatant collection; (c) repeat step i and iia; (d) supernatant pooling and evaporation (N2, 40°C); and (e) residue reconstitution [MeCN and H2O (1:1)]. (iii) n.a. |
(i) 1200 LC (Agilent Technologies, Inc.). (ii) Zorbax Eclipse Plus C18 (100 mm x 2.1 mm x 1.8 μm) (Agilent Technologies, Inc.). (iii) 5 μL (iv) Column temp: 40°C; Mobile phase [A]: CH3COONH 4 (10 mmol L−1) with CH3COOH (0.1% v/v); and [B]: MeCN. (v) 0.2 mL min−1. (vi) ~25.0 min. |
(i) 6540 QqTOF-MS (Agilent Technologies, Inc.). (ii) ESI (positive). (iii) 15,000 FWHM at m/z 322. (iv) Scan range: 100–1100 m/z. (v) Real time lock mass correction was performed with purine (m/z 121.0509; 10 mmol L−1) and hexakis (m/z 922.0098; 2 mmol L−1). |
Mass Profiler Software | (i) TFA; (ii) 4-[4-[(4-chloro-3-ethyl-1-methylpyrazol-5-yl) carbonyl-aminomethyl] phenoxy] benzoic acid (PTCA). | (i) Hydroxy TFA; (ii) Dehydro TFA; (iii) Hydroxy PTCA. | Yamaguchi et al. (2012) |
MeOH: methanol; MeCN: acetonitrile; HCOOH: formic acid; HCOONH4: ammonium formate; NH4OH: ammonium hydroxide; CH3COOH: acetic acid; CH3COONH4: ammonium acetate; H2O: water; K2HPO4: potassium phosphate dibasic; CH3COOC2H5: ethyl acetate; CH 3(CH2)4CH3: hexane; Na2SO4: sodium sulfate; (NH4)2SO4: ammonium sulfate; CH2Cl2: dichloromethane; NaOH: sodium hydroxide; C6H14: hexane; C3H7OH: 2-propanol
2.2.2. Ultra-high performance liquid chromatography (UHPLC)
Ultra-high performance liquid chromatography (UHPLC, popular as UPLC) uses sub-2μm stationary phase particles in a chromatography column and withstands high solvent flow rate and high pressure in the range of 6,000–19,000 psi. This enables (i) reduced peak width, (ii) shorter analytical run times, (iii) increased peak capacity, (iv) better ionization, and (v) reduced mass spectral overlap, leading to improved structure determination and confirmation (Denoroy et al., 2013). UHPLC offers increased resolution and sensitivity but fast-scanning detectors are needed to match the faster chromatography (Kaufmann, 2014). This is ideal for separation of analytes in complex matrices such as breast milk (Baduel et al., 2015) and tooth extracts (Andra et al., 2015). Besides enhanced sensitivity, UHPLC offers superior performance compared to HPLC for specific metabolites classes. For example, biomarkers of exposure and stress in diesel engine exhaust-exposed workers were assessed by analyzing urine samples for mono-hydroxylated polycyclic aromatic hydrocarbons with HPLC and etheno-DNA adducts A and C with UHPLC coupled with mass spectrometer detection techniques (Shen et al., 2016a). Trends in the UHPLC applications were reviewed recently (Fekete et al., 2014) and applied to environmental chemicals in human matrices (Diaz et al., 2012, Rotander et al., 2015, Taira et al., 2013, Wang et al., 2014a, Wu et al., 2012). UHPLC has been widely used in other applications such as food (Frenich et al., 2014) and water analysis (Hernández et al., 2014), and metabolism studies (Spaggiari et al., 2014, Zhao and Li, 2014).
2.2.3. Multi-dimensional comprehensive chromatography
Two dimensional (2D) liquid or gas chromatography methods improve separation and resolution of compounds compared to one dimensional LC or GC for analyzing complex human matrices. Comprehensive 2D methods transfer all the eluates from first dimension to the second for further resolution, while heart-cutting 2D methods transfer only a part of fractions separated in first dimension. Wider coverage of the chemical space is obtained when two columns of different phase material are used to separate analytes with different properties such as polar and non-polar species (Groskreutz et al., 2012). For example, the number of resolved compounds with the same functional groups, such as dioxins, furans, biphenyls, and benzenes belonging to the polychlorinated chemicals family, increased due to the increased selectivity and sensitivity of separation afforded by 2D GC ((Focant et al., 2004, Organtini et al., 2014, Muscalu et al., 2015). A 2D-GC separation has been used to study human exposures to persistent organic compounds in serum and milk (Focant et al., 2004) and polychlorinated biphenyl congeners in serum (Megson et al., 2015). Similarly, 2D-LC was applied for urinary antibiotics separation to study children exposures (Wang et al., 2014a). The work of several groups highlights advances in the applications of 2D-LC or GC coupled to mass spectrometry in metabolomics research that overlaps the endogenous biochemical space of the human exposome (Willmann et al., 2015, Marney et al., 2014).
2.2.4. New chromatography column phases
Reversed-phase (RP) LC columns are in wide use for the analysis of non-polar and medium-polar xenobiotics. Charged and polar chemicals that are not retained on RPLC are separated on hydrophilic interaction chromatography (HILIC) and pentafluorophenyl (PFP) columns. Aqueous normal-phase and ion-exchange columns are also used to complement RPLC coverage. HILIC serves either as a complementary or alternative solution to reversed-phase columns to retain and separate polar and charged analytes. Phosphorus-based amino acid herbicides such as glyphosate, glufosinate, and bialaphos are extremely polar, hydrophilic and amphoteric in nature and are difficult to separate on the conventional reversed-phase or ion-exchange columns. An Obelisc N LC column in the HILIC mode was used for simultaneous separation of these herbicides and their major metabolites namely aminomethylphosphonic acid and 3-methylphosphinicopropionic acid in human serum (Yoshioka et al., 2011). However, HILIC is not widely used in human exposure analysis. A PFP column that exhibits hybrid stationary phase characteristics was used in a mixed-mode chromatography method and operated under both RPLC and HILIC conditions for SAMHSA-5 illicit drugs panel in urine (Clyde et al., 2015). Strategically combining RPLC, HILIC and PFP columns can capture and elute a wide range of both polar and hydrophilic metabolites in human matrices, covering a wider spectrum of the environmental organics chemical space (Tang et al., 2014, Alvarez-Segura et al., 2016, Shi et al., 2015). To achieve ideal results in a 2D-chromatography analysis, it is essential that the first and second columns are made of orthogonal phases enabling differing separations. In a 2D-LC setup, a RPLC x HSS T3 column combination was used for antibiotics analysis in childrens’ urine (Wang et al., 2014a). While in a 2D-GC setup, a non-polar phase DB-1column and a carbonate phase HT-8 column was used orthogonally for separation of polybrominated diphenyl ethers, polybrominated and polychlorinated biphenyls, and organochlorine pesticides in human serum and breast milk (Focant et al., 2004). Applications of orthogonal or combined chromatography columns has been limited for analyzing exogenous and environmental chemicals in human matrices but is expected to grow. Capillary electrophoresis has gained popularity for the bioanalysis of nucleic acids, proteins, lipids, carbohydrates, and metabolites (Mischak et al., 2009) and forensics (Kohler et al., 2013) and is pending exploration for the analysis of biomarkers of exposure to environmental chemicals.
2.2.5. Chromatography-less separation
Advanced mass spectrometry platforms can profile and screen complex mixtures without chromatography. Examples are flow-injection (FI), direct analysis in real time (DART), desorption electrospray ionization (DESI), laser-ablation electrospray ionization (LAESI), and atmospheric solids analysis probe (ASAP) and open probe (OP) fast gas chromatography. Examples of applications are recreational drug screening using FI (Alechaga et al., 2015), small molecule quantitation in plasma without sample preparation and chromatographic separation using DART (Zhao et al., 2008), lipid characterization in biological samples using DESI (Eberlin et al., 2011), metabolite screening in bodily fluids using LAESI (Nemes and Vertes, 2007), polycyclic aromatic hydrocarbons in human saliva and urine using ASAP (Carrizo et al., 2015), and illegal drugs using OP fast gas chromatography (Amirav et al., 2014).
3. Applications of time-of-flight mass spectrometry for studying human exposures to environmental chemicals: leads to studying the human exposome
Applications of TOF- or QqTOF MS to detect and quantify chemicals and metabolites include targeted and non-targeted approaches (Ibáñez et al., 2008, Cortés-Francisco et al., 2011, Nurmi et al., 2012). Table 1 presents studies using LC-TOF MS or LC-QqTOF MS for studying human exposures to a broad spectrum of environmental chemicals (Baduel et al., 2015, Cortejade et al., 2016, Diaz et al., 2012, Andra et al., 2015), and specifically for polycyclic aromatic hydrocarbons (Bouchard et al., 2009, Marchese et al., 2004), pesticides/insecticides (Cequier et al., 2014, McMahen et al., 2015, Taira et al., 2013, Yamaguchi et al., 2012), drugs (Chittamma et al., 2013, Pragst et al., 2013, Ristimaa et al., 2010, Marin et al., 2014), polyfluorinated chemicals (Eom et al., 2014, Rotander et al., 2015), environmental tobacco smoke (Swinton DJ., 2011), antibiotics (Wang et al., 2015, Wang et al., 2014a), and personal care products (Wu et al., 2012). GC-TOF MS or GC-QqTOF MS was primarily applied for studying human exposures to persistent organic chemicals (Hernández et al., 2009b, Kazda et al., 2004, Focant et al., 2004, Megson et al., 2015, Fan et al., 2014). Trends in the GC-HRMS applications were reviewed recently ((Hernández et al., 2011a, Hernández et al., 2012)), and applied to metabolites in human and rat urine (Mardal et al., 2016) and environmental chemicals in food (Portolés et al., 2014b, Nácher-Mestre et al., 2014), water (Nácher-Mestre et al., 2011, Portolés et al., 2014a) and packaging material (Onghena et al., 2015, Cherta et al., 2015). These GC-HRMS approaches can be applied for studying the volatiles and non-polar chemicals space of the human exposome with sensitivity and limits of detection in the range between higher pico-molar to lower micro-molar concentrations (Smolinska et al., 2014, Macherone, 2013). In general, three approaches are considered in TOF- or QqTOF MS screening methods (Figure SI-2); depending on the study objectives, compounds fall into (i) targeted analysis (with available chemical characterization in databases and reference standards), (ii) suspect screening (with a priori information from literature and available chemical characterization in databases, but no reference standards), and (iii) unknowns profiling (with neither a priori information nor chemical characterization in databases or reference standards) (Hernández et al., 2014).
3.1. Targeted analysis
In targeted analysis, monitored compounds are already known and standards are available. The analytes are pre-selected prior to full-scan MS acquisition and are screened based on mass accuracy, retention time, isotopic pattern, and/or MS/MS transitions. A hybrid TOF (for example, QqTOF) offers data-dependent MS/MS trigger when a target ion listed is detected in the full-scan MS mode. This approach helps to quantify chemicals occurring at trace levels but is limited by covering only a small number of target analytes per run per sample. QqTOF MS was applied to the targeted quantification of 38 compounds of human exposure interest in urine, which included pesticides, veterinary drugs, UV filters, plastic additives, surfactants, and consumer and personal care products (Cortejade et al., 2016). Identification of the target analytes was based on comparison of the (i) isotopic pattern between theoretical and experimental spectra, (ii) retention time between analyte and a corresponding standard (±0.1 min), and (iii) mass error between theoretical and measured accurate mass (≤5 ppm). Table 2 presents the key analytical features of the studies that applied TOF- or QqTOF MS methods to the targeted analysis of organic contaminants in human matrices.
3.2. Non-targeted analysis
Non-targeted analysis involves detection and identification of chemicals and metabolites for which reference chemical standards are currently unavailable. The major limitation in its application is that it is not possible to confirm from the outset whether a tentatively identified compound present in the sample is real and whether a compound of interest that is actually present in the sample will be detected because of the several steps where it could get suppressed, unionized, or poorly recovered. The other notable limitation is that the untargeted findings are biased by the sample extraction procedure (for example, LLE versus SPE), analytical separation technique (GC versus LC versus direct injection), column chromatography (RP versus HILIC), ionization method (positive versus negative mode in ESI and electron impact versus chemical ionization in GC), and mass analyzer (TOF versus FT-ICR MS) used.
3.2.1. Biased non-targeted analysis/Suspect screening
An intermediate approach between targeted and a true non-targeted analysis is suspect screening or the biased non-targeted analysis (Hernández et al., 2014), when the elemental composition, formula, and structure can be predicted and identified but confirmation with reference standards is not possible. The approach generally consists of the following steps: (i) automatic screening that consists of compound extraction based on molecular features and filter algorithms, and (ii) identification based on mass fragmentation and confirmation by database search. With respect to the 14 studies that used suspect screening, a suite of human matrices were screened for suspect environmental contaminants varying from about 1 illegal drug in umbilical cord from in utero exposure (Chittamma et al., 2013), up to almost 140 anthropogenic persistent organic contaminants in breast adipose tissue from general environmental exposures (Hernández et al., 2009b). LC-TOF MS was applied to screen up to 75 suspect compounds in meconium from in utero exposure, including the following classes: (i) local anesthetics, (ii) tobacco smoke, (iii) opioids, (iv) stimulants, (v) hypnotics and sedatives, (vi) antidepressants, (vii) antipsychotics, and (viii) cannabis (Ristimaa et al., 2010). A broad range suspect screening was also achieved with GC-TOF MS which covered persistent organics in breast adipose belonging to the following classes: (i) persistent organic pollutants such as polybrominated diphenyl ethers, polychlorinated biphenyls, organochlorine pesticides, (ii) pesticides such as different herbicides, insecticides, fungicides, (iii) polyaromatic hydrocarbons, and (iv) alkylphenols (Hernández et al., 2009b).
3.2.2. Unbiased non-targeted analysis/Unknowns profiling
Unknowns or the unbiased non-targeted analysis begins with screening all chemicals and metabolites without any prior information (Hernández et al., 2014), and is usually performed after targeted and suspect screening. Typical workflows include the following steps: (i) systematic examination of the chromatogram in total ion count (TIC) mode, (ii) application of a suite of chemometric data treatment and processing protocols to significantly reduce the data by filtering (detailed in Section 4), (iii) inspection of individual chromatographic peaks of interest in an extracted ion count (EIC) mode to extract mass spectra from the full-scan MS, (iv) assignment of possible compound formulas based on the MS/MS spectra for ions of interest, and (v) comparing the findings against mass spectral databases and libraries to determine and confirm the structure. The main limitations of non-targeted screening are (i) deconvolution of high signal intensity peaks that are not necessarily of study relevance but more likely of interfering matrix ions, (ii) limited understanding of the MS/MS fragmentation procedures, (iii) success of identification depends on the availability of chemical libraries and databases, and (iv) a laborious and time-consuming task when the unknowns of study relevance occur at trace concentrations in the human samples. Despite the usefulness of HRMS for screening unknowns, it is suggested to use complementary resources such as nuclear magnetic resonance (NMR) or an authentic reference standard for structure confirmation. Though a powerful tool for structural confirmation, NMR applications for the unknowns’ confirmation in biological and environmental matrices are limited by poor sensitivity (Markley et al., 2017). Unknowns screening has been performed to identify novel metabolites of fipronil insecticide in urine and serum (McMahen et al., 2015) and tolfenpyrad pesticide in plasma (Yamaguchi et al., 2012). Table 3 presents the key analytical features of the studies that applied TOF- or QqTOF MS methods to the non-targeted analysis of organic contaminants in human matrices.
3.3. The “All-in-One” approach
A combination of suspected and non-targeted qualitative screenings with quantitative targeted analysis is gaining support as an “all-in-one” approach (Hernández et al., 2014). Merging untargeted and targeted mass spectrometry methods for studying the metabolome and lipidome are reviewed by Fiehn’s group (Cajka and Fiehn, 2016). With this approach qualitative screening and quantitation can be performed simultaneously giving a fast overview and wide coverage of chemicals. Such a method is particularly helpful in studying human exposures and multiplexed biomonitoring, where a quick distinction of positive findings above detection limits can inform target selection for characterization, identification, and quantitation using the same acquisition in a subsequent analysis. Andra et al. evaluated the performance of UHPLC-QqTOF MS in a hybrid approach for the identification of environmental contaminants in teeth, a novel bio-matrix to study prenatal exposures ((Andra et al., 2015)). The method was satisfactory for target analysis of bisphenol A, five phthalate metabolites (of 13 targeted) and three tobacco metabolites in the majority of time-specific dentine fractions from five children with information about retention times using reference standards. A three-step identification was used for suspect screening, molecular feature extraction (step 1), formula generation (step 2), and batch recursive processing (step 3), to improve the quality of the identified target list and reduce the number of manual interpretations. The compounds identified from suspect screening included structural analogs of bisphenol A, parabens, UV filters (benzophenones), polyfluorinated compounds, and pesticides. More than 10,000 molecular features were classified as unknowns in the untargeted screening for further identification and confirmation study. Similarly, Diaz et al. (Diaz et al., 2012) applied UHPLC-QqTOF MS for elucidation of organic contaminants in human urine. For target analysis, a retention time filter was applied. In this study, the applied three-step screening involved feature detection and deconvolution with set rejection parameters for peak width, baseline noise, and low and high energy function (step 1), accurate mass scoring with a set number of ions and intensity, and low and high precision tolerance (step 2), and matching with theoretical and empirical mass spectra libraries (step 3). The filtered candidate list was subjected to MS/MS for confirmation. Rotander et al. ((Rotander et al., 2015)) identified novel fluorinated surfactants in fire fighters sera using an information-dependent acquisition combining full MS survey scan and data-dependent MSn scans using a 300 counts per second intensity threshold, 30 to 950 Da mass range, a 10 ppm mass tolerance, and programmed to monitor 12 candidate ions per cycle. XIC Manager was used for target compounds identification, while PeakView and Formula Finder software were used for structural confirmation of the unknowns. Other examples of the application of the hybrid “all-in-one” approach for studying broad spectrum environmental chemicals in human matrices are (Baduel et al., 2015), (Marin et al., 2014), (Rotander et al., 2015), (Fan et al., 2014), and (Wang et al., 2014a). The list of confirmed compounds in a targeted mode, and tentatively identified compounds in a suspect screening in these studies are provided in Table 4.
Table 4.
Analytical characteristics of 7 studies that applied time-of-flight mass spectrometry in a hybrid mode for the analysis of environmental organic chemical contaminants and their metabolites in human matrices.
| Study # | Screeni ng type |
(i) Chemical class and compound s of study interest (number of analytes) (ii) Human exposure source/ route in the study |
(i) Human bio- matrix (ii) Sample volume or mass (iii) Sample size |
Analytical instrumenta tion |
(i) Sample pretreatment (ii) extraction and clean-up method (iii) ISTDs (number/na me of the labeled compounds) |
(i) LC or GC system (ii) LC or GC column (iii) Sample injection volume (iv) LC or GC conditions (v) Flow rate (vi) Run time (min) |
(i) MS system (ii) MS ionization mode (iii) MS resolving power (iv) MS mass range (v) Other notes |
MS Software (prediction/ post data treatment) |
Confirmed compounds |
Tentatively- identified compounds |
Study reference [and reference to the original analytical method given in parenthesi s where available] (chronolog ical order) |
|---|---|---|---|---|---|---|---|---|---|---|---|
| 1 | Target, suspect and unknowns screening: “All-in-ones” approach | (i) Broad-range environmental chemicals (N = a large number). (ii) Prenatal and early childhood exposures. |
(i) Teeth (ii) ~5–25 mg (obtained from micro-meter sectioning of teeth using advanced microscopy and related tools). (iii) N = 5 deciduous teeth from children |
UHPLC-QqTOF MS | (i) (a) Add internal standards; (b) vortex; (c) extraction of acidic fraction analytes using CH3COOH in MeCN; (d) extraction of basic fraction analytes using NaOH; (e) extraction of neutral fraction analytes using MeCN; and (f) pool the three fractions. (ii) (a) SPE [Polymeric sorbent Strata X-C, 30 mg/1 mL, Phenomenex]; (b) conditioned with MeOH; (c) washed with acidified H2O; (d) eluted with HCl in MeCN for acidic and neutral fraction analytes, and NH4OH in MeCN for basic fraction analytes MeOH; and (e) evaporation (N2) and reconstitution with MeCN. (iii) 15 isotopically labeled ISTDs: Monomethyl phthalate-13C4; Monoethyl phthalate-13C4; Mono-n-butyl phthalate-13C4; Mono(2-ethylhexyl) phthalate-13C4; Mono(2-ethyl-5-carboxypentyl ) phthalate-13C4; Mono(2-ethyl-5-hydrohexyl) phthalate-13C4; Mono(2-ethyl-5-oxohexyl) phthalate -13C4; Monobenzyl phthalate-13C4; Mono(3-carboxypropy l) phthalate-13C4; mono-n-octyl phthalate-13C4; Mono-isononylphthalate-13C4; Bisphenol A-13C4; Nicotine-D4; Cotinine-D3; Hydroxycotinine-D3. |
(i) 1290 Infinity UHPLC (Agilent Technologies, Inc.). (ii) Zorbax Eclipse Plus RRHD C18 (100 mm x 2.1 mm x 1.8 μm) (Agilent Technologies, Inc.). (iii) 10 μL (iv) Column temp: 35°C; Mobile phase [A]: CH3COONH4 in H2O (5 mM); and [B] MeCN. (v) 0.2 mL min−1. (vi) 11.1 min. (sample run), 3.0 min. (post-run/equilibration), and 14.1 min. (total run time). |
(i) 6550 iFunnel QqTOF MS with Jet Stream electrospray ionization (Agilent Technologies, Inc.). (ii) ESI (both positive and negative mode). (iii) Mass resolution: >40,000. (iv) Extended dynamic range up to 1700 m/z. (v) (a) Reference mass correction: 2 points at m/z 121.0508 and 922.0098 in the positive mode, and 119.0360 and 1033.9881 in the negative mode; (b) Mass accuracy: <1 ppm in MS and <2 ppm in MS/MS mode; and (c) scan speed: 50 spectra second−1 in MS and 33 spectra second−1 in MS/MS mode. |
MassHunter Qual and MassHunter Profinder with the following features: (a) Personal Compound Database; (b) Find by Formula; (c) Molecular Feature Extraction; (d) Batch Recursive Feature Extraction | (a) ESI negative mode: Bisphenol A; Monomethyl phthalate; Monoethyl phthalate; Mono-n-butyl phthalate; Monobenzyl phthalate; Mono (2-ethylhexyl) phthalate. (b) ESI positive mode: Nicotine, Cotinine, Hydroxycotinine. |
(a) Structural analogs of bisphenol (bisphenol S, bisphenol F, bisphenol AP); (b) parabens (methyl, ethyl, propyl, butyl and benzyl); (c) UV filters (benzophenone-1 and 3); (d) poly-flourinated compounds (pentadecafluorooctanoic acid, perfluorooctanesulfonic acid); (e) pesticides (diethyl dithiophosphate, dimethylphosphate, 2,4-dichlorophenol); and (f) dioxin. |
Andra et al. (2015) |
| 2 | Target, suspect and unknowns screening: “All-in-ones” approach | (i) Polar environmental chemical contaminants such as pesticides (n = 9) and personal care products (PPCPs) (n = 17). (ii) General exposures in a general population. |
(i) Breast milk (ii) 3 g (iii) Volunteer primiparous mothers (n= 4) and a pool breast milk from a different set of 10 mothers. |
UHPLC-QqTOF MS | (i) Add internal standards mixture at 1 μg/mL (ii) (a) LLE [MeCN (100%)]; (b) extraction with a mixture of anhydrous MgSO4 and NaCl; (c) add ceramic homogenizer and vigorous shaking; (d) centrifugation, collect supernatant, and freezing out step at −20°C for at least 4 hours to yield fat precipitation at low temperatures. (iii) 2 stable oxygen-18 and carbon-13 labeled ISTDs: 18O2-PFHxS and 13C8-PFOS. 8 deuterated ISTDs: atenolol-d7, atrazine-d5, caffeine-d3, carbamazepine-d10, chlorpyrifos-d10, diazinon-d10, diclofenac-d4 and metolachlor-d6. Injection standard: diuron-d6. |
(i) Nexera X2 UHPLC (Shimadzu). (ii) XDB-C18 (4.6 mm × 50 mm x 1.8 μm) for negative mode and XDB-C18 (2.1 mm × 100 mm x 1.8 μm) for negative mode (Agilent Technologies) (iii) 10 μL (ESI–ve) and 5 μL (ESI +ve). (iv) Column temp: 45°C (ESI–ve) and 50°C (ESI +ve). Mobile phases (ESI - ve) [A]: MeOH in MilliQ H2O (1%); and [B] MilliQ H2O in MeOH (10%) with CH3COONH4 (5 mM) in both. Mobile phases (ESI +ve) [A]: MilliQ H2O and [B]: MeOH with HCOOH (0.1%) in both. (v) 0.6 mL min−1 (ESI –ve) and 0.4 mL min−1 (ESI +ve). (vi) 12.0 min (ESI–ve) and 16.6 min (ESI +ve). |
(i) Triple TOF-5600 (AB Sciex). (ii) ESI (negative and positive mode). (iii) 30,000 FWHM at m/z 956. (iv) Full scan range: 100–950 m/z (MS mode) and 30–950 m/z (MS/MS mode). (v) Calibration in polypropylene gly-col. |
(i) PeakView with IDA, (ii) XIC Manager, and (iii) MS Library tools (AB Sciex). |
(i) PPCPs: Acesulfame, Acetaminophen, Alprazolam, Atenolol, Caffeine, Carbamazepine, Codeine, Diazepam, Diclofenac, Fluoxetine, Furosemide, Hydrochlorothiazide, Naproxen, Sulfadiazine, Sulphamethoxazole, Temazepam, Trimethroprim. (ii) Pesticides: Atrazine, DEET, Diazinon, Diuron, Malathion, Metolachlor, Simazine, Terbuconazole, Terbuthylazine, |
Theobromine and Theophylline (Caffeine metabolites), Acetaminophen sulphate (Paracetamol metabolite), Methyl Paraben (Preservative), Methyl Paraben Sulphate (Preservative metabolite), Propyl Paraben (Preservative), Propyl Paraben Sulphate (Preservative metabolite), Ethyl Paraben (Preservative), TCEP (Flame retardant), PFOS (Fluorosurfactant), PFOS (Fluorosurfactant), 4-hydrox y-Chlorothalonil (Chloro-thalonil/fungicide transformation product) | Baduel et al. (2015) |
| 3 | Target and suspects screening | (i) A very large number of organic contaminants in environment [N = ~1000] (ii) General exposure |
(i) Urine (ii) n.a. (iii) N = 10 |
LC-QqTOFMS | (i) Dilute and shoot (ii) No extraction /clean-up (iii) n.a. |
(i) Acquity UPLC (Waters) (ii) Acquity C18 BEH analytical column (150 mm x 2.1 mm x 1.7 μm) (Waters) (iii) 50 μL (iv) 0.3 mL min−1 (v) 18 min. |
(i) Hybrid quadrupole orthogonal acceleration -time-of-flight with an orthogonal Z-spray lockspray electrospray interface (Q-oaTOF) (Waters) (ii) ESI (positive and negative) (iii) ~10,000 (FWHM) (iv) 50–1000 m/z (v) Calibrant: imazalil (m/z 297.0561); and lock mass analyte: leucine enkephalin |
(i) MassLynxv 4.1. (ii) ChromaLynx XS: non-target (Deconvolution and library search) and target analysis. |
(i) Gabapentin; (ii) Paracetamol; (iii) Risperidone; (iv) Amphetamine; (v) Benzoylecgonine; (vi) Cocaethylene; (vii) Cocaine; (viii) NorBenzoylecgonine | (i) Nicotine; (ii) NorCocaethylene; (iii) NorCocaine | Diaz et al. (2012) |
| 4 | Target, suspect and unknowns screening: “All-in-ones” approach | (i) Illegal drugs (N = 68) that include sedatives or hypnotics (n = 27), opioids (n = 26), stimulants (n = 12, and others (n = 3). (ii) In utero and neonatal exposures to drugs from mothers’abuse (passive exposure) |
(i) Umbilical cord (ii) 1 g (iii) N = 299 |
LC-QqTOFMS | (i) Homogenization. (ii) (a) Extract with water containing 0.1% Triton X-100 in a blender; (b) supported liquid extraction on columns [CH3COOC2 H5: C3H7OH, 90:10, v/v]; (c) eluate evaporation (N2); and (d) reconstitution with wáter:metanol (90:10, v/v). (iii) 4 deuterated ISTDs: morphine-D3, diazepam-D5, phenobarbital -D5, and benzoylecgonine-D5 |
(i) 1260 HPLC (Agilent Technologies, Inc.). (ii) Poroshell C18 column (100 mm x 2.1 mm x 2.7 μm) (Agilent Technologies, Inc.). (iii) n.a. (iv) n.a. (v) 0.5 mL min−1. (vi) n.a. |
(i) 6230 TOF MS (Agilent Technologies, Inc.). (ii) ESI (positive and negative mode). (iii) n.a. (iv) n.a. (v) n.a. |
MassHunter Qualitative Analysis software (Agilent Technologies, Inc.). | (i) Methamphetamine; (ii) Amphetamine; (iii) Benzoylecgonine; (iv) Cocaine; (v) m-OH-Benzoylecgonine; (vi) Codeine; (vii) Hydrocodone; (viii) Dihydrocodeine ; (ix) Morphine; (x) Hydromorphone ; (xi) Oxycodone; (xii) Oxymorphone; (xiii) Methadone; (ix) EDDP; (x) Meperidine; (xi) N-Desmethyltramadol; (xii) Norpropoxyphene; (xiii) Alprazolam; (xiv) α-OH-alprazolam; (xv) Clonazepam; (xvi) 7-Aminoclonazep am; (xv) Diazepam; (xvi) Nordiazepam; (xvii) Midazolam; (xviii) α-OH-midazolam | (i) Fentanyl; (ii) Tramadol; (iii) Oxazpam; (iv) Temazepam; (v) Zolpidem | Marin et al. (2014) |
| 5 | Target, suspect and unknowns screening: “All-in-ones” approach | (i) Fluorinated surfactants (n=2+3+4 =9) (ii) Occupational exposure in firefighters |
(i) Serum (ii) 0.2 mL (iii) Exposure group (firefighters, n = 20), and control group (non-exposed people, n = 19). |
UHPLC-QqTOF MS | (i) Add mass-labeled internal standards. (ii) (a) LLE [MeCN (100%)]; (b) ultrasonication; (c) vortex, centrifugation, and evaporation (N2); and (d) reconstitution with CH3COONH4 in H2O (5 mM). (iii) 2 stable oxygen-18 and carbon-13 labeled ISTDs: 18O2-PFHxS and 13C8-PFOS. |
(i) Nexera X2 UHPLC (Shimadzu). (ii) Gemini-NX C18 (2.0 mm x 50 mm x 3.0 μm) (Shimadzu). (iii) 10 μL (iv) Column temp: 45°C; a Phenomenex isolator column was used to delay solvent-derived background elution; Mobile phase [A]: MeOH in H2O (1%); and [B] H2O in MeOH (10%) with CH3COONH4 (5 mM) in both. (v) 0.6 mL min−1. (vi) 12.0 min. |
(i) Triple TOF-5600 (AB Sciex). (ii) ESI (negative). (iii) 30,000 FWHM at m/z 403.1122 (sulfinpyrazone, C23H20N2OS 3). (iv) Full scan range: 100–950 m/z (MS mode) and 30–950 m/z (MS/MS mode). (v) Calibration in MS/MS mode with C6H5O (m/z 93.0344), C6H5O5 (m/z 125.0067), C10H8NO (m/z 158.0611), C17H13N2O2 (m/z 277.0983), and C23H20N2OS 3 (m/z 403.1122). |
(i) Analyst TF 1.6, (ii) PeakView, (iii) MultiQuant, and (iv) MarkerView Software (AB Sciex). | (i) perfluoro-octanesulfonic acid (PFOS); (ii) perfluoro-hexanesulfonic acid (PFHxS) | (i) perfluoro-pentanesulfonic acid (PFPeS); (ii) perfluoro-heptanesulfonic acid (PFHpS); (iii) perfluoro-nonanesulfonic acid (PFNS); (iv) Cl-PFOS; (v) ketone-PFOS; (vi) ether-PFHxS; (vii) Cl-PFHxS | Rotander et al. (2015) |
| 6 | Target and suspect screening | (i) Pesticides (N=50) (ii) General exposures in the environment. |
(i) Serum (ii) 2.0 mL (iii) Maternal and umbilical cord sera. |
GC-QqTOFMS | (i) (a) Vortex and homogenized; (b) serum mixed with saturated (NH4)2SO4; (c) vortex and refrigerated for protein precipitation; and (d) centrifugation and supernatant collection for SPE. (ii) (a) SPE [Bond Elut C18, 200 mg, 3 mL, Agilent Technologies, Inc.]; (b) conditioning with CH2Cl2, MeOH and H2O; (c) connect with a tandem SPE cartridge with similar pre-conditioning; (d) elution with CH2Cl2; (e) evaporation (N2) and reconstitution with n-CH3(CH2)4C H3, vortex and save for GC-QTOF/MS analysis. (iii) n.a. |
(i) 7200 GC (Agilent Technologies, Inc.). (ii) DB-35MS capillary column (30 m x 0.25 mm) (Agilent Technologies, Inc.). (iii) 1 μL (splitless injection). (iv) 1.5 mL min−1 (Helium). (v) 46.3 min. |
(i) 7200 QqTOF MS (Agilent Technologies, Inc.). (ii) Electron ionization (EI) mode. (iii) 13500 FWHM. (iv) Scan range: 50–600 m/z. (v) Perfluoro-tributylamine as a daily MS calibrant. |
(i) MassHunter Acquisition B.06; (ii) MassHunter Qualitative/Quantitative Analysis B.05. | (i) Biphenyl; (ii) Pentachlorobenzene; (iii) Hexachlorobenzene; (iv) trans-Chlordane; (v) p,p′-DDE; and (vi) Triphenylphosphate | (i) Chlorpyrifosmethyl; (ii) Chlorothalonil | Fan et al. (2014) |
| 7 | Target and suspect screening | (i) Antibiotics (N=88 that include 14 target and 74 post-target screened antibiotics) (ii) General use and exposure to antibiotics in school children. |
(i) Urine (ii) 1.0 mL (iii) N = 60 school children (32 boys and 28 girls). |
UPLC x UPLC (2D-LC)-QqTOF MS | (i) (a) Spike with internal standards; (b) buffer with CH3COONH4 (1.0 M, pH 5.0); (c) enzymatic hydrolysis with β-glucuronidase (100,000 or more units per mL); and (d) vortex and incubated in a water bath (overnight, 37°C). (ii) (a) SPE [Oasis 96-well HLB, 60 mg/2 mL, Waters]; (b) conditioned with MeOH and H2O; (c) washed sequentially with H2O and 30% MeOH-H2O; (d) elution with MeOH; and (e) evaporation (N2) and reconstitution with 20% MeOH-H2O. (iii) 9 isotopically labeled ISTDs: tetracycline-d6; ciprofloxacin-d8; enrofloxacin-d5; azithromycin-d3; sulfadiazine-13C6; sulfamethoxazole-d4; trimethoprim-d3; chloramphenicol-d5; and 4-MU-13C4. |
(i) Two identical Acquity UPLC (Waters). (ii) Trapping column: XBridge C18 (30 mm x 2.1 mm x 10 μm) (Waters); and Separation column: HSS T3 (100 mm x 2.1 mm x 1.8 μm) (Waters). (iii) 200 μL (iv) Mobile phase [A]: MeOH; and [B] MeOH and H2O with 0.1% HCOOH. (v) 0.3 mL min−1. (vi) 13.0 min. |
(i) SYNAPT G2 with an orthogonal Z-spray ESI mode (Waters Micromass). (ii) ESI (both positive and negative mode). (iii) n.a. (iv) MS and MS/MS range: 50–1200 Da in centroid mode. (v) (a) Mass calibration with a mixture of NaOH (0.05 mM) and HCOOH (5%) (1:1, v/v) and diluted with MeCN/H2O (80:20, v/v) (dilution factor: 25); and (b) a leucine-enkephalin solution as a lock mass for real time calibration of mass axis. |
ChromaLynx XS (version 4.1) for post-target screening. | (i) Ampicillin; (ii) Cefoperazone; (iii) Ciprofloxacin; (iv) Enrofloxacin; (v) Chlortetracycline; (vi) Oxytetracycline; (vii) Tetracycline; (viii) Azithromycin; (ix) Clarithromycin; (x) Tylosin; (xi) Sulfadiazine; (xii) Sulfamethoxazole; (xiii) Trimethoprim; (xiv) Chloramphenicol; (xv) sulfadimidine; and (xvi) cefaclor. | (i) Linomycin; (ii) sulfacetamide; (iii) doxycycline; (iv) sparfloxacin | Wang et al. (2014a) |
MeOH: methanol; MeCN: acetonitrile; HCOOH: formic acid; HCOONH4: ammonium formate; NH4OH: ammonium hydroxide; CH3COOH: acetic acid; CH3COONH4: ammonium acetate; H2O: water; K2HPO4: potassium phosphate dibasic; CH3COOC2H5: ethyl acetate; CH 3(CH2)4CH3: hexane; Na2SO4: sodium sulfate; (NH4)2SO4: ammonium sulfate; CH2Cl2: dichloromethane; NaOH: sodium hydroxide; C6H14: hexane; C3H7OH: 2-propanol
4. High resolution data extraction features for scaling the environmental chemical space of the human exposome
Some of the basic principles for interpreting HRMS data for organic compounds in environmental and biological matrices are discussed by Pleil’s group (Pleil and Isaacs, 2016). The following sections provide a detailed outlook on the application of data-acquisition and interpretation tools with relevant examples from human exposure studies (Figure 1). This section is built on parallels applied in drug metabolites profiling and identification (Zhu et al., 2011, Ma and Chowdhury, 2013, Xie et al., 2012, Ma and Chowdhury, 2007), food contaminants screening (Lehotay et al., 2015), environmental analysis (Hernández et al., 2011a, Hernández et al., 2014, Bletsou et al., 2015), illegal drug testing (Thevis et al., 2013), and fruits and vegetables screening (Gomez-Ramos et al., 2013).
Figure 1.

Data acquisition and mining workflow typically followed for untargeted analysis using a LC- or GC-HRMS platform.
4.1. Data-acquisition
Identification and characterization of the suspected compounds and unknowns is a challenging process. The application of smarter data acquisition tools and features is required to increase success with detecting and confirming compounds from the mass spectral profile obtained in a single run. Summarized in Table SI-1 are data acquisition and mining features used in the untargeted and hybrid QqTOF MS based approaches applied in human exposure studies.
4.1.1. Data-dependent acquisition
This acquisition is information-dependent and requires pre-set criteria in selecting and monitoring precursor ions of interest to further subject these to MS/MS fragmentation for confirmation. Typically, the sample analysis begins with full-scan MS acquisition. When an analyte of interest appears in the run and is recognized by the data software based on pre-determined criteria, the instrument switches from full-scan to MS/MS mode to acquire product ion mass spectra and returns to full-scan survey mode. Triggers can be dependent on ion intensity, accurate mass inclusion, isotope pattern, pseudo-neutral loss, or mass defect criteria, and are discussed below.
4.1.1.1. Isotope pattern-dependent acquisition
Halogen-containing molecules possess specific isotope signatures that can be exploited for identification in the mass spectrometric analysis. Software detects the chemicals and metabolites with unique isotopic patterns in full-scan MS and initiates MS/MS automatically. For example, chemicals and metabolites containing Cl or Br will exhibit ion pairs with m/z difference of 1.99705 Da or 1.99795 Da, respectively. The isotope features include an intensity ratio of about 3:1 or 1:1 for Cl- or Br-containing molecular features. The approach is very helpful for detecting isotope-labeled compounds containing 2H-, 13C-, 15N-, 18O-, etc., which are used as internal standards or surrogates during sample preparation. This approach is also useful for metabolite detection with isotopes and does not require prior knowledge of their nature or accurate mass (Zhu et al., 2009, Lim et al., 2008, Yan and Caldwell, 2005, LeBlanc et al., 2010). This approach was applied in the detection of seven metabolites of fipronil insecticide that retained isotopic signatures of fluorine and chlorine atoms that ranged between 2 and 6 atoms, and characteristic spacing between the 35Cl (75.77%) and 37Cl (24.23%) isotopes and spectral pattern of the metabolites with 2 Cl atoms (McMahen et al., 2015). Another application was the identification of Cl-PFOS, an unknown transformation product of polyfluorinated alkyl substances (PFAS) in human serum by the presence of the O3SCl− fragment (m/z 114.9261, Δppm = −0.7 ppm) in the QqTOF MS/MS acquisition (Rotander et al., 2015). Other examples of the use of isotope filters include the untargeted identification of a plastic additive N-butyl benzenesulfonamide in adipose tissue based on the isotope prediction filtering (i-FIT) for sulfur (Hernández et al., 2009a), fungicide metabolite chlorothalonil-4-hydroxy compound in breast milk based on the characteristic isotopic profile of the three Cl atoms (MS Δppm = 0.5 ppm, MS/MS Δppm = 5.6 ppm) (Baduel et al., 2015), and hydroxy metabolites of tolfenpyrad and 4-[4-[(4-chloro-3-ethyl-1-methylpyrazol-5-yl)carbonylaminomethyl] phenoxy]benzoic acid in plasma based on Cl isotope pattern (Yamaguchi et al., 2012). The limitation is when the isotope pattern is changed or removed during chemical transformation and metabolism resulting in misinterpretation or complete loss of information.
4.1.1.2. Ion intensity-dependent acquisition
Ion intensity is used as a threshold to initiate MS/MS acquisition for the generation of sequential product ions. This approach does not require a priori information on the precursors’ m/z values, and is particularly suitable for the identification of new metabolites from in vitro and in vivo experiments where exposures are controlled or known in humans. For example, ion intensity filters such as a threshold of 500 counts per second was applied for confirmation of pesticides, and pharmaceutical and personal care products in breast milk (Baduel et al., 2015) with a minimum intensity as a percent of the largest peak in a predefined mass range applied for tentative identification of organic contaminants in urine samples (Diaz et al., 2012). Other examples of this approach are the use of (i) intensity ratios of representative ions for identification of 50 pesticides in serum (Fan et al., 2014), (ii) ratio of intensity of the isotopic molecular ions for the detection of triclosan and its glucuronidated, sulfonated and hydroxylated sulfonated metabolites that displayed a 27:27:9:1 isotope ratio for the [M-H]−, [M+2-H]−, [M+4-H]− and [M+6-H]− ions, respectively (Wu et al., 2012), and (iii) characterization of a flame retardant and plastics additive, 2-ethylhexyl diphenyl phosphate (EHDPHP), based on the sum of the ion intensities of its metabolites, mono hydroxylated-, keto-, di hydroxylated-, one keto- and one hydroxyl-, glucuronide-forms that were in the ratio of 37:21:19:13:4.5 in human liver microsomes, which are considered potential biomarkers of exposure to monitor in human urine (Ballesteros-Gomez et al., 2014). This approach can be challenging to apply to lower intensity metabolites and is limited to the preferential MS/MS acquisition of high-intensity endogenous matrix ions in biological specimens. Additionally, use of multiple data mining tools to differentiate MS/MS data for chemicals and/or metabolites resulting from exposure versus non-exposure sources is required.
4.1.1.3. Accurate-mass precursor inclusion list-dependent acquisition
Accurate masses of the expected or suspected chemicals and metabolites are included as pre-screen criteria to generate MS/MS scans. While acquiring the full-scan MS information, the software will screen for the accurate masses included in the list and performs MS/MS when detected and only if they are within a defined mass tolerance range and above a certain intensity threshold. Similarly, precursor ion filter triggers MS/MS acquisition when a pre-set ion mass is detected within a set mass defect range in the full-scan MS. This approach is particularly useful to increase the probability of detecting known and suspected trace level chemicals and metabolites in human matrices but is not suitable for obtaining MS/MS on the unknowns not included in the list. For example, high accurate masses extraction was performed for the characterization of low- and high-polarity metabolites of triclosan in serum (Wu et al., 2012) and perfluorooctanesulfonic acid and other perfluoroalkyl acids in human serum (Rotander et al., 2015). Precursor ion information was used for the detection of five metabolites of tolfenpyrad pesticide metabolites in plasma (Yamaguchi et al., 2012). However, false identifications occurred despite the use of accurate masses in the case of four antibiotics - lincomycin, sulfacetamide, doxycycline, and sparfloxacin in urine (Wang et al., 2014a). In another case, Taira et al ((Taira et al., 2013) did not detect the parent neonicotinoids 6-chloronicotinic acid and 2-chlorothiazole-5-carboxylic acid with precursor ion information applied, while their metabolites 2-[(6-chloropyridine-3-carbonyl)amino] acetic acid and 2-[(2-methylsulfanyl-1,3-thiazole-5-carbonyl) amino]acetic acid were detected in the study of human urine samples.
4.1.1.4. (Pseudo) neutral loss-dependent acquisition
Neutral loss is suitable for the identification of parent ions that lose a neutral mass during MS/MS fragmentation. This is useful for chemicals and metabolites with functional groups such as -OH and -NH2 that yield 17.0033 and 16.0193 mass unit difference. Moreover, neutral losses of isobaric functional groups such as N2 (28.0067), CH2CH2 (28.0318), and CO (27.9955) with very similar m/z values are able to be differentiated (Nielen et al., 2007). Pseudo neutral loss mimics neutral loss in a sense that full-scan MS is performed with two different collision energies in sequence and neutral loss ion pairs monitored between the low and high collision energy scans. When such neutral losses are identified and within a mass tolerance threshold, the specific precursor ions in the low collision energy full-scan MS are subjected to MS/MS at a higher collision energy. This approach has shown potential value in proteome analysis and particularly for the identification of phosphorylated and N-glycosylated sites on proteins (Hsiao and Urlaub, 2010). The advantages of this approach are the collection of MS and auto MS/MS spectra for each specimen and no requirement of prior knowledge on precursor ions. However, it might require multiple scans with multiple collision energies to overcome the missed fragmentation patterns for each precursor ion. Unknowns in perfluoroalkyl compounds class were identified in serum by their distinct neutral loss of –CF2 functional group with m/z 50 (Rotander et al., 2015). Other applications of neutral loss filtering are monitoring the loss of one or two water molecules ([M-H2O+H]+, [M-2H2O+H]+) in the identification of anabolic steroids that form adducts with mobile phase such as methanol and acetonitrile (Diaz et al., 2012), and a water molecule loss from glucuronide conjugates of 2-ethylhexyl diphenyl phosphate (Ballesteros-Gomez et al., 2014). Notable applications are to detect metabolites from phase II detoxification pathways that show characteristic neutral loss of 176.0321 for glucuronide conjugates, 129.0426 for glutathione conjugates, and 79.9568 for sulfate conjugates (Wu et al., 2010; Yao et al., 2016).
4.1.1.5. Mass defect-dependent acquisition
Mass defect is the difference between the exact mass and the nominal mass of a compound. In a conventional sense, the mass of carbon (12C) is set at 12.0000 Da and for the rest of the elements it is either slightly above or below their integral values. For example, the exact mass of hydrogen (1H) and oxygen (16O) are 1.007825 Da and 15.994910 Da, resulting in mass defects of 0.007825 Da and −0.00509 Da, respectively. This feature helps to discriminate molecular features of interest from matrix and background ions because of differences in their elemental compositions and respective mass defects. When such a filter is applied to full-scan MS, precursor ions that fall under a defined mass defect window trigger MS/MS acquisitions. Multiple mass defects have been applied to identify different classes of phase II conjugates, dealkylation, hydrolysis and other metabolites of physiological relevance simultaneously (Campbell and Le Blanc, 2012, Zhang et al., 2009, Zhang et al., 2008). However, the absolute mass defect approach falls short for higher molecular weight compounds where the possible number of elemental formulas is large and respective errors can be high. Relative mass defect, a new approach that normalizes absolute mass defect to an ion’s mass (Stagliano et al., 2010), was applied to identify novel glycosylated sesquiterpenoid plant metabolites (Ekanayaka et al., 2015). The mass defect filter offers high selectivity for chemical and metabolite detection in human matrices. For example, a characteristic mass defect of −1.00729 Da ion for fluorine and chlorine atoms was applied for detecting fipronil insecticide metabolites in human serum and urine (McMahen et al., 2015). Similarly, in the case of halogenated flame retardants a mass defect of −0.0461 Da was used for the detection of tris(chloroethyl) phosphate and 1.1534 Da for 1,2,4,5-tetrabromo-3, 6-bis(2,3,4,5,6-pentabromophenoxy)-benzene (Ionas et al., 2015).
4.1.1.6. Background subtraction and noise reduction acquisition
Spectra from a control sample are used for background subtraction from study specimens. Noise reduction of interfering masses helps to detect chemicals of interest that are otherwise suppressed among the predominant housekeeping endogenous metabolites in an unprocessed mass spectrum. This approach does not require prior knowledge of the molecular features or the mass defects of the study analytes, and is suitable for all types of chemicals and metabolites analysis. However, this is less sensitive and selective compared to other data acquisition methods. Dynamic background subtraction filters such as 12 scans offset to minimize background ions count, a subtraction multiplication factor of 2 to cover variations in background ions intensity, and minimum peak widths for retention time (5 scans) and spectra (0.01 Da) are used for peak finding (Baduel et al., 2015). Chemical background was reduced by applying micro- or narrow-window extracted ion chromatograms while detecting anthropogenic contaminants in breast adipose tissues (Hernández et al., 2009b). Another example is where different mass extraction windows of 1, 10, 100, and 1000 mDa were applied to reduce background noise and increase signal-to-noise for the piperonyl butoxide pesticide in maternal and umbilical cord sera (Fan et al., 2014).
4.1.1.7. Adducts and/or product-ion filter
Predicted adducts and/or products ion lists helps to detect the MS/MS fragments of interest and identify the precursors that can generate them at a noticeable intensity. This approach is opposite to precursor ion filtering. For example, perfluoroalkyl sulfonates yield characteristic product ions such as SO3− (m/z 80) and FSO3− (m/z 99) that were used in conjunction with other product ions such as (CnF2nSO3)−, (CnF2n+1)−, and (CnF2n-1SO3)− for detecting unknown metabolites in human serum (Rotander et al., 2015). Structural confirmation of a suite of suspected pesticides in human serum was possible based on product ion information (Fan et al., 2014). Adducts knowledge was applied in studying anabolic steroids (Diaz et al., 2012) and insecticides in human urine (McMahen et al., 2015), and drugs (Marin et al., 2012) and fluorinated surfactants in serum or plasma (Rotander et al., 2015).
4.1.2. Data-independent acquisition
This acquisition is independent of information and hence easy to perform (Tiller et al., 2008). The approach relies on both collision-induced dissociation spectra generated from varied collision energies and post-acquisition data processing software. The fragment ion information is generated in a non-specific manner and without a priori knowledge. The data-independent acquisition features MSE, all-ion fragmentation and MS/MSALL are discussed below.
4.1.2.1. MSE approach
MSE is the simultaneous acquisition of mass spectra at low and high collision energy without a priori precursor ion selection (Hernández et al., 2011b). The low energy (LE) acquisition minimizes fragmentation and conserves intact molecular ions to obtain information pertaining to the parent molecule and adducts. The high energy (HE) acquisition promotes fragmentation and the generated accurate mass fragment ions helps structural elucidation and tentative identification where reference standards are unavailable. This approach yields information on both protonated or deprotonated parent molecule and corresponding fragment ions in a single acquisition. In addition, MSE not only conserves information on adducts and multimers but also isotope patterns thus enabling retrospective analysis of previously acquired data (Hernández et al., 2015b). MSE has been the first approach for untargeted discovery workflows using QqTOF. Since the approach does not utilize true MS/MS acquisition, it is difficult to capture trace level compounds that are overshadowed by co-eluting matrix components. MSE was applied for urine analysis with successful confirmation of about 95% of the suspected compounds where reference standards were not available (Diaz et al., 2012). Similarly, this approach of concurrent acquisition of MS and non-specific MS/MS scans was applied for untargeted screening of antibiotics and detection of trimethoprim in human urine (Wang et al., 2014a). The MSE approach has been widely used in environmental applications (Hernández et al., 2012), and to discover metabolites and transformation products (Kinyua et al., 2015, Hernández et al., 2015a, Ibáñez et al., 2016, Pozo et al., 2015).
4.1.2.2. All-ion fragmentation
This approach is useful for Orbitraps where a wide range of precursor ions are selected in a full-scan MS and subjected to non-selective, all-ion fragmentation in the collision cell. Cell voltages are increased so that the fragment ions are sent to the Orbitrap where product ion generation and analysis occurs with MS2 and MS3 scans. This results in the generation of fragment ions free from matrix and interfering ions. All-ion fragmentation acquisition using LTQ-Orbitrap was used in clinical applications for identifying drugs (Henry et al., 2012), endogenous steroids (Franke et al., 2011), fatty acids (Li and Franke, 2011b), and DNA methylation products (Li and Franke, 2011a). This is a generic method to generate non-selective MS/MS spectra in the higher energy collisional dissociation of Orbitrap instruments. The limitations are that no selection on the precursor ions can be made. A combination with multiple data mining tools to search for compounds is also required. This approach is suitable for high-throughput compound identification in a discovery mode.
4.1.2.3. MS/MSALL with SWATH acquisition
This approach is useful for triple TOF analyzers where full-scan MS is stepped at pre-defined precursor ion windows that span across the entire mass range and transfer all ions in those windows into the collision cell for MS/MS acquisition. The SWATH (Sequential Window Acquisition of all Theoretical Mass Spectra) feature improves selectivity and sensitivity by the application of multiple sequential full-scan precursor ion windows in a very narrow width and as low as 20 Da. Acquired data is large and complex, making the data mining challenging and requiring multiple software tools for the detection and confirmation of compounds. However, this approach is very suitable for high-throughput identification of unknowns. This is a generic method to generate non-selective MS/MS spectra in triple TOF systems. SWATH was applied for toxicological studies (Arnhard et al., 2015). SWATH was compared with both information-dependent acquisition and MSAll approaches in metabolite profiling and identification using UHPLC-QqTOF MS (Zhu et al., 2014).
4.2. Data mining
HRMS data is highly complex with a large number of measurements on a vast number of molecular features, and requires a series of steps for interpretation that can be challenging. Typically, the general workflow involves (i) extraction of molecular features, (ii) data treatment and statistical analysis, and (iii) structure identification and confirmation. Detailed reviews on this topic are available here (Yi et al., 2016, Gorrochategui et al., 2016), and briefly discussed below in the context of HRMS data mining for interpreting the environmental chemical space in human matrices.
4.2.1. Molecular features extraction
Molecular features extraction from a HRMS profiling data set involves peak detection, peak alignment, and peak picking. The first step in HRMS software uses an Extracted Ion Chromatogram (EIC or XIC) or Extracted Mass Chromatogram (EMC) for spectral information display. Peaks from background noise and co-eluting peaks along with the extracted ions of interest are included within the same retention time window (Andra et al., 2015) (Pragst et al., 2013) (Pelander et al., 2008). The MS/MS filters that were described in the above section are also applicable for full-scan MS data reduction. For example, features such as mass defects, isotope patterns, accurate mass and ion intensities were used to filter full scan data for characterizing tricresyl phosphate isomers in aircraft engine lubricants that are linked to aerotoxic syndrome in aircraft crew (Megson et al., 2016) and halogenated persistent organics in an electronics recycling facility’s dust (Ubukata et al., 2015). Typically, each molecular feature extracted from the raw HRMS data file has its own accurate mass and measured m/z values, and a characteristic retention time but with small differences between samples. Hence, peak alignment is required to directly compare the unique molecular features in different samples. This was used to automatically adjust minor variations in mass and retention times and to ensure identical perfluorniated chemicals are compared accurately across the case-control serum samples in a study of firefighters (Rotander et al., 2015). The outcome of these efforts will result in data reduction to an extent where there are several thousands of molecular features still remaining. Some of the features belong to the same chemical, such as ion adducts with sodium, ammonium, or acetate ions with varying charge states, ions of the isotopes, and ions formed in the ionization source from gas-phase interactions and dissociations (Zeng et al., 2014). Such a data set with redundant ion information for each molecular feature makes the HRMS data interpretation more complex, and hence a data reduction step with statistical tools is essential to group closely relevant molecular features.
4.2.2. Data pretreatment and analysis
Normalization, scaling, and transformation are three approaches of data pretreatment commonly performed to make the data suitable for statistical analysis (Bijlsma et al., 2006, Warrack et al., 2009). Data normalization adjusts differences between samples for a given molecular feature, and is considered as a within chromatograms or row-wise correction (Ejigu et al., 2013). Normalization can be chemistry- or numerical-based, or both. The former involves use of one or more isotope labeled internal standards prior to or after sample extraction, whose response is used for determining the optimal normalization for each molecular feature of interest. For example, in the identification of novel per- and polyfluorinated compounds in human serum, HRMS data was normalized using an internal standard peak area (13C4 PFOS) and total area sums (Rotander et al., 2015). The latter approach involves the use of a pooled QC sample across the batch and applies computational models to correct the abundance deviation of a molecular feature in a sample according to its performance in the neighboring QC run using a locally estimated scatterplot smoothing (LOESS) method (Shen et al., 2016b). Data scaling and transformation compares molecular features within and between samples, and is considered a between chromatograms or column-wise correction (van den Berg et al., 2006). Scaling does a fold difference adjustment between molecular features by converting raw data into concentration differences based on a scaling factor (Khalheim, 1985). Transformation applies non-linear conversions to the raw data based on the log or power transformation. Data pretreatment approaches correct the raw data for non-equal variance uncertainty within and between molecular features across a batch of samples (Kvalheim et al., 1994). Following the data pretreatment steps, statistical methods such as univariate and/or multivariate methods are applied to differentiate not only the fold changes in molecular features, chemicals, and biomarkers of interest but also to distinguish control versus exposure groups, and disease sub-types (Ren et al., 2015). Principle Component Analysis (PCA) was applied to distinguish polychlorinated biphenyls exposure groups (Megson et al., 2015) and Volcano plot and fold change were used to classify fluorinated compound exposure groups (Rotander et al., 2015). Statistical tools for HRMS data analysis have been reviewed elsewhere (Yi et al., 2016, Gorrochategui et al., 2016).
4.2.3. Chemical identification
Unknowns’ identification process is constantly evolving. The generated molecular features are typically screened against small molecule library databases (Yin and Xu, 2014). Chemical Analysis Working Group of the Metabolomics Standards Initiative (MSI) has laid out guidelines for the identification of chemicals and metabolites based on four levels: definitive identification with an authentic standard (level 1), putative identification at metabolite-specific (level 2) and class-specific stage (level 3), and the remaining are considered as unknowns (level 4) (Creek et al., 2014). The European Directive 2002/657/EC provides similar criteria for compound identification but based on the analytical instrumentation used (Directive, 2002). However, since these standards were set prior to the emergence of HRMS technologies, there have been discussions and efforts to address and revise the guidelines in response to the increasing complexity and challenges in unknowns’ identification in a non-targeted analysis (Schrimpe-Rutledge et al., 2016). Computational tools are essential to interpret the multi-stage mass spectrometry diagnostic ions and product fragments, and to piece fragments together to derive the precursor compound. Key articles that discuss several approaches for structure elucidation of both polar and non-polar molecules are suggested here (Scheubert et al., 2013, Hufsky et al., 2014). A popular approach is the combined use of an in silico fragmentation algorithm coupled with a mass spectral database search such as MetFrag combined with Mass-Bank (Wolf et al., 2010), Metabolite Identification via Database Searching (MIDAS) (Wang et al., 2014b) and High-throughput AutoMation of Mass Frontier (HAMMER) (Zhou et al., 2014). Example biomonitoring studies that utilized HRMS and in silico tools for structure confirmation are the analysis of environmental chemicals in breast milk (Baduel et al., 2015) and non-targeted and unknown perfluoroalkyl compounds in serum (Rotander et al., 2015). However, a limitation of this combinatorial approach is that the fragmentation rules relating to both organic and gas-phase chemistry are not completely taken into account. To address this, the Critical Assessment of Small Molecule Identification initiative encouraged chemists to evaluate and improve their automated annotation workflows (Schymanski and Neumann, 2013, Nishioka et al., 2014).
5. Future perspectives
This section highlights opportunities to develop and incorporate advances in separation and detection sciences into studying the environmental chemical space of the human exposome in the short and medium term.
-
HRMS in multiplexed biomonitoring: A major advantage of using HRMS in human biomonitoring is the retrospective analysis of full MS data, which helps to search for environmental chemicals that were newly identified or for which new information becomes available even years after sample analysis and data generation. This is possible without the need for new sample analysis. Time trends analysis of non-targeted data in epidemiological studies will help to identify peaks of interest that show an increase or decrease with time, and thus help to prioritize the number of compounds for structural characterization and confirmation to include in follow-up studies. Time-trends in HRMS data was applied in other areas of science for prioritizing peaks of interest (Gago-Ferrero et al., 2015, Plassmann et al., 2016). Similarly, a list of masses of interest can be generated by comparing cohorts with and without a certain chemical exposure or health outcome, or between environmental and occupational exposure. Another way of developing the list is to identify environmental chemicals of human toxicology relevance by performing non-targeted analysis of a fraction or mixture in an effect-directed analysis approach (Plassmann et al., 2015). The limitation of HRMS in biomonitoring studies is the inability to detect compounds at low levels, especially in complex human matrices. Hence, the development of sample preparation protocols with enhanced extraction and sensitivity for trace level chemicals are needed (Dennis et al., 2016b) and in particular those that are multi-omics compatible for incorporating several classes of chemicals into a multiplex biomonitoring approach.
A well-designed metabolomics experiment with HRMS analysis can be applied to monitor both endogenous metabolites and environmental chemicals in human matrices simultaneously. For example, a range of environmental chemicals belonging to flame retardants (triethylphosphate), tobacco (cotinine), herbicides (chlorsulfuron), and insecticides (chlorobenzoic acid) were detected along with metabolism biomarkers of energy (glucose), renal activity (creatinine, urate), and stress (cortisol) in the plasma of 157 healthy adults (Go et al., 2015). Other metabolomics studies have also looked at environmental chemicals in the same sample and analysis (Soltow et al., 2013, Edmands et al., 2015). Such a multiplex analysis captures both exo- and endogenous biomarkers in human health studies. Applications of HRMS to find associations between biomarkers of exposure and effect are discussed (Walker et al., 2016a). For example, anthracene concentrations in human sera were found to be significantly correlated with 24 and 18 adduct masses of polycyclic aromatic hydrocarbons metabolites from HRMS analysis coupled with HILIC and RP chromatography, respectively (Walker et al., 2016b). Other examples of relevance are in regards to the untargeted biomonitoring of pesticides exposure in humans (Roca et al., 2014) (Jamin et al., 2014). Recommendations on HRMS applications in internal exposure assessment were previously discussed (Dennis et al., 2016b). These support the use of HRMS to assess human exposures to multiple chemical classes simultaneously and estimate their body burden in a multiplexed biomonitoring approach.
-
HRMS in sequencing the human exposome: Exposome science, as a hypothesis generating approach, is expected to open a critical door that will greatly increase our understanding of the associations between exposures from external, internal, and non-specific sources and human health outcomes (Athersuch, 2012). In studying the human exposome, the researcher is confronted with substantial complexity. Small molecule and metabolite profiling is gaining popularity as a first approach to study the chemical space of the exposome (Athersuch, 2012, Athersuch, 2015, Athersuch and Keun, 2015). This is because with HRMS one can detect both the chemical of exposure and the biomarkers of biological response such as metabolites to a better extent compared to LRMS (Jones, 2016). Untargeted approaches for studying human exposures to chemicals are not considered hypothesis-driven in regards to the biological mechanism involved and/or affected by the chemical exposure (Rappaport et al., 2014). However, multiplex biological assays were recently combined with MS for the identification of molecules having a biological response and biomarkers of health relevance in an effect-directed approach. For example, gene reporter assays combined with LC-HRMS for determining bioactive estrogenic and anti-estrogenic compounds in environmental water samples (Jonker et al., 2015), cell-based reporter gene assays combined with LC-MS for studying metabolites of the human histamine H4 receptor ligands (Nijmeijer et al., 2012), and a multiplatform approach for protein biomarkers discovery using SOMAscan, a multiplexed aptamer-based technique, and LC-MS (Billing et al., 2016, McArdle et al., 2016). By looking at biological response molecules it can drive future studies on the biological systems affected by exposures (Rappaport, 2012) (Dennis et al., 2016a).
Now it is well known that >80% of human diseases are linked to environmental exposures (Rappaport, 2016, Cui et al., 2016). Routine analysis of human matrices for biomarkers of clinical health in conjunction with biomarkers of exposure to environmental chemicals may identify sub-populations susceptible to health risk through environmental-wide association studies (Patel et al., 2010, Lind et al., 2013). Hence, the exposome concept is gaining support for inclusion in epidemiological studies (Vineis et al., 2016, DeBord et al., 2016, Lopez de Maturana et al., 2016, Andra et al., 2016). However, the chemical space of the human exposome is estimated to have >400,000 environmental chemicals with >200,000 molecular features or ions that are yet to be characterized in human matrices analyzed with HRMS (Uppal et al., 2016). This space is known as the ‘dark matter of the exposome’. To tackle this issue, the Clinical Biomarkers Laboratory at Emory University is applying high-resolution metabolomics to analyze over 20,000 biological specimens using rigorous standard operating procedures (Go et al., 2015) and has obtained more than 100,000 molecular features for which accurate mass, retention time, and ion intensity information were collected. Development of such a reference database will enable retrospective analysis of human exposures and help interpret the human exposome (Uppal et al., 2016, Grondin et al., 2016). The use of high-resolution metabolomics to study the human exposome in multiple ways is outlined by Jones (Jones, 2016). Despite the advantage of giving a wide coverage of the metabolome, and endo- and exogenous compounds, no single HRMS method covers all the chemical and molecule-classes of interest (small molecules versus proteins). While metals cannot be measured by HRMS, organometallics (Bouatra et al., 2013) and metal-bound biomolecular adducts with DNA and proteins that are indicative of a biological response to a metal or other inorganic chemical exposures can be detected (Meier et al., 2016, Hemeryck et al., 2016). The overall challenges for environmental chemical analysis in studying the human exposome, and the opportunities for understanding metabolome-wide associations with environment, exposures, and health effects were discussed recently (Jones, 2016).
6. Conclusion
HRMS provides opportunities to screen target, suspect, and non-target molecular features with improved sensitivity, selectivity, reliability and robustness. Intelligent workflows that are either data dependent or data independent acquisitions are becoming available to combine non-targeted and targeted analyses in a single method that includes triggering MS/MS scans on precursor or product ions for a suite of molecular features that are above threshold intensities. Moreover, HRMS offers a unique opportunity for retrospective analysis of full-scan only MS and/or the MS/MS data, which enables one to return to the chromatograms and look for emerging chemicals and contaminants even years after the initial sample analysis. This feature comes as a great advantage to human biomonitoring programs.
Despite the high resolution and accuracy of HRMS, reliable structure characterization and elemental formula assignment of the detected compounds remain a challenge. This requires advanced software workflows and chemical libraries to match fast and huge data acquisitions. The main challenge in non-targeted screening is when the compounds of relevance occur at trace levels and their ions are masked by high intensity interfering matrix ions. It is also important to integrate alternative approaches for increasing the success of tentative identification such as knowledge on structure-property relationships for improved chromatography retention and mass spectrometry ionization efficiencies and use of complementary techniques such as nuclear magnetic resonance. Such efforts are becoming more valuable in the field of metabolomics and are required for studying the exposome. In years to come, HRMS is likely to become a major technology for monitoring body burdens to a suite of environmental chemicals and contaminants at several life stages.
The field of human exposome science is in a continuum of development to build upon the knowledge and success from searching the metabolome, in a comparative fashion, with the ultimate goal to widen our understanding on the associations between human exposures and health outcomes from an epidemiological perspective. With this review contribution describing the role of HRMS in the untargeted analysis of environmental chemical exposures, we hope to have provided the research community an analytical perspective for joining the call to action–sequencing the exposome (Jones, 2016).
Supplementary Material
Highlights.
Human biomonitoring is limited by the number of chemicals analyzed in a targeted approach.
High-resolution mass spectrometry (HRMS) can be used to monitor a broad-spectrum of environmental chemicals and markers of biological response in human matrices.
Advances in data acquisition workflows accelerate the untargeted profiling of the environmental chemical space in the human exposome.
Intelligent data mining filters and tools are constantly evolving to characterize unknown compounds.
High throughput simultaneous identification and quantitation of new chemicals and metabolites is becoming feasible with HRMS.
Acknowledgments
This work is supported by National Institutes of Environmental Health Sciences grant 1U2CES026561-01 Sub-Project ID: 5593.
Footnotes
Conflicts of interest
The authors have no conflicts of interest.
Publisher's Disclaimer: This is a PDF file of an unedited manuscript that has been accepted for publication. As a service to our customers we are providing this early version of the manuscript. The manuscript will undergo copyediting, typesetting, and review of the resulting proof before it is published in its final citable form. Please note that during the production process errors may be discovered which could affect the content, and all legal disclaimers that apply to the journal pertain.
References
- ALECHAGA É, MOYANO E, GALCERAN MT. Wide-range screening of psychoactive substances by FIA–HRMS: identification strategies. Analytical and Bioanalytical Chemistry. 2015;407:4567–4580. doi: 10.1007/s00216-015-8649-7. [DOI] [PubMed] [Google Scholar]
- ALVAREZ-SEGURA T, TORRES-LAPASIÓ JR, ORTIZ-BOLSICO C, GARCÍA-ALVAREZ-COQUE MC. Stationary phase modulation in liquid chromatography through the serial coupling of columns: A review. Analytica Chimica Acta. doi: 10.1016/j.aca.2016.03.040. [DOI] [PubMed] [Google Scholar]
- AMIRAV A, KESHET U, ALON T, FIALKOV AB. Open Probe fast GC–MS—Real time analysis with separation. International Journal of Mass Spectrometry. 2014;371:47–53. doi: 10.1002/jms.3941. [DOI] [PubMed] [Google Scholar]
- ANDRA SS, AUSTIN C, ARORA M. The tooth exposome in children’s health research. Curr Opin Pediatr. 2016;28:221–7. doi: 10.1097/MOP.0000000000000327. [DOI] [PMC free article] [PubMed] [Google Scholar]
- ANDRA SS, AUSTIN C, WRIGHT RO, ARORA M. Reconstructing pre-natal and early childhood exposure to multi-class organic chemicals using teeth: Towards a retrospective temporal exposome. Environ Int. 2015;83:137–45. doi: 10.1016/j.envint.2015.05.010. [DOI] [PMC free article] [PubMed] [Google Scholar]
- ARNHARD K, GOTTSCHALL A, PITTERL F, OBERACHER H. Applying ‘Sequential Windowed Acquisition of All Theoretical Fragment Ion Mass Spectra’ (SWATH) for systematic toxicological analysis with liquid chromatography-high-resolution tandem mass spectrometry. Anal Bioanal Chem. 2015;407:405–14. doi: 10.1007/s00216-014-8262-1. [DOI] [PubMed] [Google Scholar]
- ATHERSUCH T. Metabolome Analyses in Exposome Studies: Profiling Methods for a Vast Chemical Space. Arch Biochem Biophys. 2015 doi: 10.1016/j.abb.2015.10.007. [DOI] [PubMed] [Google Scholar]
- ATHERSUCH TJ. The role of metabolomics in characterizing the human exposome. Bioanalysis. 2012;4:2207–2212. doi: 10.4155/bio.12.211. [DOI] [PubMed] [Google Scholar]
- ATHERSUCH TJ, KEUN HC. Metabolic profiling in human exposome studies. Mutagenesis. 2015 doi: 10.1093/mutage/gev060. [DOI] [PubMed] [Google Scholar]
- BADUEL C, MUELLER JF, TSAI H, GOMEZ RAMOS MJ. Development of sample extraction and clean-up strategies for target and non-target analysis of environmental contaminants in biological matrices. J Chromatogr A. 2015;1426:33–47. doi: 10.1016/j.chroma.2015.11.040. [DOI] [PubMed] [Google Scholar]
- BALLESTEROS-GOMEZ A, ERRATICO CA, EEDE NV, IONAS AC, LEONARDS PE, COVACI A. In vitro metabolism of 2-ethylhexyldiphenyl phosphate (EHDPHP) by human liver microsomes. Toxicol Lett. 2014;232:203–212. doi: 10.1016/j.toxlet.2014.11.007. [DOI] [PubMed] [Google Scholar]
- BARBOUNIS EG, TZATZARAKIS MN, ALEGAKIS AK, KOKKINAKI A, KARAMANOS N, TSAKALOF A, TSATSAKIS AM. Assessment of PCBs exposure in human hair using double focusing high resolution mass spectrometry and single quadrupole mass spectrometry. Toxicol Lett. 2012;210:225–31. doi: 10.1016/j.toxlet.2011.07.031. [DOI] [PubMed] [Google Scholar]
- BESSONNEAU V, BOYACI E, MACIAZEK-JURCZYK M, PAWLISZYN J. In vivo solid phase microextraction sampling of human saliva for non-invasive and on-site monitoring. Anal Chim Acta. 2015;856:35–45. doi: 10.1016/j.aca.2014.11.029. [DOI] [PubMed] [Google Scholar]
- BIJLSMA N, COHEN MM. Environmental Chemical Assessment in Clinical Practice: Unveiling the Elephant in the Room. Int J Environ Res Public Health. 2016:13. doi: 10.3390/ijerph13020181. [DOI] [PMC free article] [PubMed] [Google Scholar]
- BIJLSMA S, BOBELDIJK I, VERHEIJ ER, RAMAKER R, KOCHHAR S, MACDONALD IA, VAN OMMEN B, SMILDE AK. Large-scale human metabolomics studies: a strategy for data (pre-) processing and validation. Anal Chem. 2006;78:567–74. doi: 10.1021/ac051495j. [DOI] [PubMed] [Google Scholar]
- BILLING AM, BEN HAMIDANE H, BHAGWAT AM, COTTON RJ, DIB SS, KUMAR P, HAYAT S, GOSWAMI N, SUHRE K, RAFII A, GRAUMANN J. Complementarity of SOMAscan to LC-MS/MS and RNA-seq for quantitative profiling of human embryonic and mesenchymal stem cells. J Proteomics. 2016;150:86–97. doi: 10.1016/j.jprot.2016.08.023. [DOI] [PubMed] [Google Scholar]
- BLETSOU AA, JEON J, HOLLENDER J, ARCHONTAKI E, THOMAIDIS NS. Targeted and non-targeted liquid chromatography-mass spectrometric workflows for identification of transformation products of emerging pollutants in the aquatic environment. TrAC Trends in Analytical Chemistry. 2015;66:32–44. [Google Scholar]
- BOUATRA S, AZIAT F, MANDAL R, GUO AC, WILSON MR, KNOX C, BJORNDAHL TC, KRISHNAMURTHY R, SALEEM F, LIU P, DAME ZT, POELZER J, HUYNH J, YALLOU FS, PSYCHOGIOS N, DONG E, BOGUMIL R, ROEHRING C, WISHART DS. The human urine metabolome. PLoS One. 2013;8:e73076. doi: 10.1371/journal.pone.0073076. [DOI] [PMC free article] [PubMed] [Google Scholar]
- BOUCHARD M, NORMANDIN L, GAGNON F, VIAU C, DUMAS P, GAUDREAU E, TREMBLAY C. Repeated measures of validated and novel biomarkers of exposure to polycyclic aromatic hydrocarbons in individuals living near an aluminum plant in Quebec, Canada. J Toxicol Environ Health A. 2009;72:1534–49. doi: 10.1080/15287390903129481. [DOI] [PubMed] [Google Scholar]
- BROZA YY, ZURI L, HAICK H. Combined volatolomics for monitoring of human body chemistry. Sci Rep. 2014;4:4611. doi: 10.1038/srep04611. [DOI] [PMC free article] [PubMed] [Google Scholar]
- CAJKA T, FIEHN O. Toward Merging Untargeted and Targeted Methods in Mass Spectrometry-Based Metabolomics and Lipidomics. Anal Chem. 2016;88:524–45. doi: 10.1021/acs.analchem.5b04491. [DOI] [PubMed] [Google Scholar]
- CAMPBELL JL, LE BLANC JCY. Using high-resolution quadrupole TOF technology in DMPK analyses. Bioanalysis. 2012;4:487–500. doi: 10.4155/bio.12.14. [DOI] [PubMed] [Google Scholar]
- CARRIZO D, DOMENO C, NERIN I, ALFARO P, NERIN C. Atmospheric pressure solid analysis probe coupled to quadrupole-time of flight mass spectrometry as a tool for screening and semi-quantitative approach of polycyclic aromatic hydrocarbons, nitro-polycyclic aromatic hydrocarbons and oxo-polycyclic aromatic hydrocarbons in complex matrices. Talanta. 2015;131:175–84. doi: 10.1016/j.talanta.2014.07.034. [DOI] [PubMed] [Google Scholar]
- CAS. CAS REGISTRY - The gold standard for chemical substance information. Chemical Abstracts Service. American Chemical Society; Columbus, OH, USA: 2016. [Accessed: 21 September 2016]. Available: https://www.cas.org/content/chemical-substances. [Google Scholar]
- CDC. Fourth National Report on Human Exposure to Environmental Chemicals Updated Tables. Department of Health and Human Services, Centers for Disease Control and Prevention; 2015. [Accessed: 21 September 2016]. Available: http://www.cdc.gov/biomonitoring/pdf/FourthReport_UpdatedTables_Feb2015.pdf. [Google Scholar]
- CEQUIER E, MARCE RM, BECHER G, THOMSEN C. A high-throughput method for determination of metabolites of organophosphate flame retardants in urine by ultra performance liquid chromatography-high resolution mass spectrometry. Anal Chim Acta. 2014;845:98–104. doi: 10.1016/j.aca.2014.06.026. [DOI] [PubMed] [Google Scholar]
- CEQUIER E, SAKHI AK, MARCE RM, BECHER G, THOMSEN C. Human exposure pathways to organophosphate triesters - a biomonitoring study ofmother-child pairs. Environ Int. 2015;75:159–165. doi: 10.1016/j.envint.2014.11.009. [DOI] [PubMed] [Google Scholar]
- CHERTA L, PORTOLÉS T, PITARCH E, BELTRAN J, LÓPEZ FJ, CALATAYUD C, COMPANY B, HERNÁNDEZ F. Analytical strategy based on the combination of gas chromatography coupled to time-of-flight and hybrid quadrupole time-of-flight mass analyzers for non-target analysis in food packaging. Food Chemistry. 2015;188:301–308. doi: 10.1016/j.foodchem.2015.04.141. [DOI] [PubMed] [Google Scholar]
- CHITTAMMA A, MARIN SJ, WILLIAMS JA, CLARK C, MCMILLIN GA. Detection of in utero marijuana exposure by GC-MS, ultra-sensitive ELISA and LC-TOF-MS using umbilical cord tissue. J Anal Toxicol. 2013;37:391–4. doi: 10.1093/jat/bkt052. [DOI] [PubMed] [Google Scholar]
- CLYDE C, BLAKE S, OBRIEN S, IGWILO I, LURIE IS. Application of mixed-mode ultra high performance liquid chromatography to forensic drug analysis. Analytical Methods. 2015;7:9763–9772. [Google Scholar]
- CORTEJADE A, KISS A, CREN C, VULLIET E, BULETE A. Development of an analytical method for the targeted screening and multi-residue quantification of environmental contaminants in urine by liquid chromatography coupled to high resolution mass spectrometry for evaluation of human exposures. Talanta. 2016;146:694–706. doi: 10.1016/j.talanta.2015.06.038. [DOI] [PubMed] [Google Scholar]
- CORTÉS-FRANCISCO N, FLORES C, MOYANO E, CAIXACH J. Accurate mass measurements and ultrahigh-resolution: Evaluation of different mass spectrometers for daily routine analysis of small molecules in negative electrospray ionization mode. Analytical and Bioanalytical Chemistry. 2011;400:3595–3606. doi: 10.1007/s00216-011-5046-8. [DOI] [PubMed] [Google Scholar]
- CREEK DJ, DUNN WB, FIEHN O, GRIFFIN JL, HALL RD, LEI Z, MISTRIK R, NEUMANN S, SCHYMANSKI EL, SUMNER LW, TRENGOVE R, WOLFENDER JL. Metabolite identification: are you sure? And how do your peers gauge your confidence? Metabolomics. 2014;10:350–353. [Google Scholar]
- CUI Y, BALSHAW DM, KWOK RK, THOMPSON CL, COLLMAN GW, BIRNBAUM LS. The Exposome: Embracing the Complexity for Discovery in Environmental Health. Environ Health Perspect. 2016;124:A137–40. doi: 10.1289/EHP412. [DOI] [PMC free article] [PubMed] [Google Scholar]
- DEBORD DG, CARREON T, LENTZ TJ, MIDDENDORF PJ, HOOVER MD, SCHULTE PA. Use of the “Exposome” in the Practice of Epidemiology: A Primer on -Omic Technologies. Am J Epidemiol. 2016;184:302–14. doi: 10.1093/aje/kwv325. [DOI] [PMC free article] [PubMed] [Google Scholar]
- DENNIS KK, AUERBACH SS, BALSHAW DM, CUI Y, FALLIN MD, SMITH MT, SPIRA A, SUMNER S, MILLER GW. The Importance of the Biological Impact of Exposure to the Concept of the Exposome. Environ Health Perspect. 2016a doi: 10.1289/EHP140. [DOI] [PMC free article] [PubMed] [Google Scholar]
- DENNIS KK, MARDER E, BALSHAW DM, CUI Y, LYNES MA, PATTI GJ, RAPPAPORT SM, SHAUGHNESSY DT, VRIJHEID M, BARR DB. Biomonitoring in the Era of the Exposome. Environ Health Perspect. 2016b doi: 10.1289/EHP474. [DOI] [PMC free article] [PubMed] [Google Scholar]
- DENOROY L, ZIMMER L, RENAUD B, PARROT S. Ultra high performance liquid chromatography as a tool for the discovery and the analysis of biomarkers of diseases: a review. J Chromatogr B Analyt Technol Biomed Life Sci. 2013;927:37–53. doi: 10.1016/j.jchromb.2012.12.005. [DOI] [PubMed] [Google Scholar]
- DIAZ R, IBANEZ M, SANCHO JV, HERNANDEZ F. Target and non-target screening strategies for organic contaminants, residues and illicit substances in food, environmental and human biological samples by UHPLC-QTOF-MS. Analytical Methods. 2012;4:196–209. [Google Scholar]
- DIRECTIVE IC. 96/23/EC concerning the performance of analytical methods and the interpretation of results. Off J Eur Communities. 2002;221:8–36. [Google Scholar]
- EBERLIN LS, FERREIRA CR, DILL AL, IFA DR, COOKS RG. Desorption electrospray ionization mass spectrometry for lipid characterization and biological tissue imaging. Biochim Biophys Acta. 2011;1811:946–60. doi: 10.1016/j.bbalip.2011.05.006. [DOI] [PMC free article] [PubMed] [Google Scholar]
- EDMANDS WM, FERRARI P, ROTHWELL JA, RINALDI S, SLIMANI N, BARUPAL DK, BIESSY C, JENAB M, CLAVEL-CHAPELON F, FAGHERAZZI G, BOUTRON-RUAULT MC, KATZKE VA, KUHN T, BOEING H, TRICHOPOULOU A, LAGIOU P, TRICHOPOULOS D, PALLI D, GRIONI S, TUMINO R, VINEIS P, MATTIELLO A, ROMIEU I, SCALBERT A. Polyphenol metabolome in human urine and its association with intake of polyphenol-rich foods across European countries. Am J Clin Nutr. 2015;102:905–13. doi: 10.3945/ajcn.114.101881. [DOI] [PubMed] [Google Scholar]
- EJIGU BA, VALKENBORG D, BAGGERMAN G, VANAERSCHOT M, WITTERS E, DUJARDIN JC, BURZYKOWSKI T, BERG M. Evaluation of normalization methods to pave the way towards large-scale LC-MS-based metabolomics profiling experiments. Omics. 2013;17:473–85. doi: 10.1089/omi.2013.0010. [DOI] [PMC free article] [PubMed] [Google Scholar]
- EKANAYAKA EA, CELIZ MD, JONES AD. Relative mass defect filtering of mass spectra: a path to discovery of plant specialized metabolites. 2015;167:1221–32. doi: 10.1104/pp.114.251165. [DOI] [PMC free article] [PubMed] [Google Scholar]
- EOM J, CHOI J, KIM J, KIM Y. A Survey of Exposure Level and Lifestyle Factors for Perfluorooctanoate and Perfluorooctane Sulfonate in Human Plasma from Selected Residents in Korea. International Journal of Environmental Research and Public Health. 2014;11:7231–7241. doi: 10.3390/ijerph110707231. [DOI] [PMC free article] [PubMed] [Google Scholar]
- EPA. United States Environmental Protection Agency. [Accessed: 21 September 2016];TSCA Chemical Substance Inventory. 2016 Available: https://www.epa.gov/tsca-inventory/about-tsca-chemical-substance-inventory.
- FAN R, ZHANG F, WANG H, ZHANG L, ZHANG J, ZHANG Y, YU C, GUO Y. Reliable screening of pesticide residues in maternal and umbilical cord sera by gas chromatography-quadrupole time of flight mass spectrometry. Science China Chemistry. 2014;57:669–677. [Google Scholar]
- FEKETE S, SCHAPPLER J, VEUTHEY JL, GUILLARME D. Current and future trends in UHPLC. TrAC - Trends in Analytical Chemistry. 2014;63:2–13. [Google Scholar]
- FOCANT JF, SJODIN A, TURNER WE, PATTERSON DG., JR Measurement of selected polybrominated diphenyl ethers, polybrominated and polychlorinated biphenyls, and organochlorine pesticides in human serum and milk using comprehensive two-dimensional gas chromatography isotope dilution time-of-flight mass spectrometry. Anal Chem. 2004;76:6313–20. doi: 10.1021/ac048959i. [DOI] [PubMed] [Google Scholar]
- FRANKE AA, CUSTER LJ, MORIMOTO Y, NORDT FJ, MASKARINEC G. Analysis of urinary estrogens, their oxidized metabolites, and other endogenous steroids by benchtop orbitrap LCMS versus traditional quadrupole GCMS. Anal Bioanal Chem. 2011;401:1319–30. doi: 10.1007/s00216-011-5164-3. [DOI] [PMC free article] [PubMed] [Google Scholar]
- FRENICH AG, ROMERO-GONZÁLEZ R, DEL MAR AGUILERA-LUIZ M. Comprehensive analysis of toxics (pesticides, veterinary drugs and mycotoxins) in food by UHPLC-MS. TrAC Trends in Analytical Chemistry. 2014;63:158–169. [Google Scholar]
- GAGO-FERRERO P, SCHYMANSKI EL, BLETSOU AA, AALIZADEH R, HOLLENDER J, THOMAIDIS NS. Extended Suspect and Non-Target Strategies to Characterize Emerging Polar Organic Contaminants in Raw Wastewater with LC-HRMS/MS. Environmental Science & Technology. 2015;49:12333–12341. doi: 10.1021/acs.est.5b03454. [DOI] [PubMed] [Google Scholar]
- GHASTE M, MISTRIK R, SHULAEV V. Applications of fourier transform ion cyclotron resonance (FT-ICR) and orbitrap based high resolution mass spectrometry in metabolomics and lipidomics. International Journal of Molecular Sciences. 2016:17. doi: 10.3390/ijms17060816. [DOI] [PMC free article] [PubMed] [Google Scholar]
- GO YM, WALKER DI, LIANG Y, UPPAL K, SOLTOW QA, TRAN V, STROBEL F, QUYYUMI AA, ZIEGLER TR, PENNELL KD, MILLER GW, JONES DP. Reference Standardization for Mass Spectrometry and High-resolution Metabolomics Applications to Exposome Research. Toxicol Sci. 2015;148:531–43. doi: 10.1093/toxsci/kfv198. [DOI] [PMC free article] [PubMed] [Google Scholar]
- GOMEZ-RAMOS MM, FERRER C, MALATO O, AGUERA A, FERNANDEZ-ALBA AR. Liquid chromatography-high-resolution mass spectrometry for pesticide residue analysis in fruit and vegetables: screening and quantitative studies. J Chromatogr A. 2013;1287:24–37. doi: 10.1016/j.chroma.2013.02.065. [DOI] [PubMed] [Google Scholar]
- GORROCHATEGUI E, JAUMOT J, LACORTE S, TAULER R. Data analysis strategies for targeted and untargeted LC-MS metabolomic studies: Overview and workflow. TrAC Trends in Analytical Chemistry. 2016;82:425–442. [Google Scholar]
- GOSETTI F, MAZZUCCO E, GENNARO MC, MARENGO E. Contaminants in water: non-target UHPLC/MS analysis. Environmental Chemistry Letters. 2016;14:51–65. [Google Scholar]
- GRONDIN CJ, DAVIS AP, WIEGERS TC, KING BL, WIEGERS JA, REIF DM, HOPPIN JA, MATTINGLY CJ. Advancing Exposure Science through Chemical Data Curation and Integration in the Comparative Toxicogenomics Database. Environ Health Perspect. 2016 doi: 10.1289/EHP174. [DOI] [PMC free article] [PubMed] [Google Scholar]
- GROSKREUTZ SR, SWENSON MM, SECOR LB, STOLL DR. Selective comprehensive multi-dimensional separation for resolution enhancement in high performance liquid chromatography. Part I: Principles and instrumentation. Journal of Chromatography A. 2012;1228:31–40. doi: 10.1016/j.chroma.2011.06.035. [DOI] [PubMed] [Google Scholar]
- HEMERYCK LY, MOORE SA, VANHAECKE L. Mass Spectrometric Mapping of the DNA Adductome as a Means to Study Genotoxin Exposure, Metabolism, and Effect. Anal Chem. 2016;88:7436–46. doi: 10.1021/acs.analchem.6b00863. [DOI] [PubMed] [Google Scholar]
- HENRY H, SOBHI HR, SCHEIBNER O, BROMIRSKI M, NIMKAR SB, ROCHAT B. Comparison between a high-resolution single-stage Orbitrap and a triple quadrupole mass spectrometer for quantitative analyses of drugs. Rapid Commun Mass Spectrom. 2012;26:499–509. doi: 10.1002/rcm.6121. [DOI] [PubMed] [Google Scholar]
- HERNÁNDEZ F, GRIMALT S, POZO ÓJ, SANCHO JV. Use of ultra-high-pressure liquid chromatography-quadrupole time-of-flight MS to discover the presence of pesticide metabolites in food samples. Journal of Separation Science. 2009a;32:2245–2261. doi: 10.1002/jssc.200900093. [DOI] [PubMed] [Google Scholar]
- HERNÁNDEZ F, IBÁÑEZ M, BADE R, BIJLSMA L, SANCHO JV. Investigation of pharmaceuticals and illicit drugs in waters by liquid chromatography-high-resolution mass spectrometry. TrAC Trends in Analytical Chemistry. 2014;63:140–157. [Google Scholar]
- HERNÁNDEZ F, IBÁÑEZ M, BOTERO-COY AM, BADE R, BUSTOS-LÓPEZ MC, RINCÓN J, MONCAYO A, BIJLSMA L. LC-QTOF MS screening of more than 1,000 licit and illicit drugs and their metabolites in wastewater and surface waters from the area of Bogotá, Colombia. Analytical and Bioanalytical Chemistry. 2015a;407:6405–6416. doi: 10.1007/s00216-015-8796-x. [DOI] [PubMed] [Google Scholar]
- HERNÁNDEZ F, IBÁÑEZ M, PORTOLÉS T, CERVERA MI, SANCHO JV, LÓPEZ FJ. Advancing towards universal screening for organic pollutants in waters. Journal of Hazardous Materials. 2015b;282:86–95. doi: 10.1016/j.jhazmat.2014.08.006. [DOI] [PubMed] [Google Scholar]
- HERNÁNDEZ F, PORTOLÉS T, PITARCH E, LÓPEZ FJ. Searching for anthropogenic contaminants in human breast adipose tissues using gas chromatography-time-of-flight mass spectrometry. Journal of Mass Spectrometry. 2009b;44:1–11. doi: 10.1002/jms.1538. [DOI] [PubMed] [Google Scholar]
- HERNÁNDEZ F, PORTOLÉS T, PITARCH E, LÓPEZ FJ. Gas chromatography coupled to high-resolution time-of-flight mass spectrometry to analyze trace-level organic compounds in the environment, food safety and toxicology. TrAC - Trends in Analytical Chemistry. 2011a;30:388–400. [Google Scholar]
- HERNANDEZ F, PORTOLES T, PITARCH E, LOPEZ FJ, BELTRAN J, VAZQUEZ C. Potential of gas chromatography coupled to triple quadrupole mass spectrometry for quantification and confirmation of organohalogen xenoestrogen compounds in human breast tissues. Anal Chem. 2005;77:7662–72. doi: 10.1021/ac050874+. [DOI] [PubMed] [Google Scholar]
- HERNÁNDEZ F, SANCHO JV, IBÁÑEZ M, ABAD E, PORTOLÉS T, MATTIOLI L. Current use of high-resolution mass spectrometry in the environmental sciences. Analytical and Bioanalytical Chemistry. 2012;403:1251–1264. doi: 10.1007/s00216-012-5844-7. [DOI] [PubMed] [Google Scholar]
- HERNÁNDEZ F, SANCHO JV, IBÁÑEZ M, PORTOLÉS T. Encyclopedia of Analytical Chemistry. John Wiley & Sons, Ltd; 2011b. Time-of-Flight and Quadrupole Time-of-Flight Mass Spectrometry for Identifying Unknown Contaminants and Degradation Products in the Environment. [Google Scholar]
- HOWARD PH, MUIR DCG. Identifying New Persistent and Bioaccumulative Organics Among Chemicals in Commerce. Environmental Science & Technology. 2010;44:2277–2285. doi: 10.1021/es903383a. [DOI] [PubMed] [Google Scholar]
- HSIAO HH, URLAUB H. Pseudo-neutral-loss scan for selective detection of phosphopeptides and N-glycopeptides using liquid chromatography coupled with a hybrid linear ion-trap/orbitrap mass spectrometer. Proteomics. 2010;10:3916–21. doi: 10.1002/pmic.201000290. [DOI] [PubMed] [Google Scholar]
- HUFSKY F, SCHEUBERT K, BOCKER S. New kids on the block: novel informatics methods for natural product discovery. Nat Prod Rep. 2014;31:807–17. doi: 10.1039/c3np70101h. [DOI] [PubMed] [Google Scholar]
- IBÁÑEZ M, POZO ÓJ, SANCHO JV, ORENGO T, HARO G, HERNÁNDEZ F. Analytical strategy to investigate 3,4-methylenedioxypyrovalerone (MDPV) metabolites in consumers’ urine by high-resolution mass spectrometry. Analytical and Bioanalytical Chemistry. 2016;408:151–164. doi: 10.1007/s00216-015-9088-1. [DOI] [PubMed] [Google Scholar]
- IBÁÑEZ M, SANCHO JV, BIJLSMA L, VAN NUIJS ALN, COVACI A, HERNÁNDEZ F. Comprehensive analytical strategies based on high-resolution time-of-flight mass spectrometry to identify new psychoactive substances. TrAC Trends in Analytical Chemistry. 2014;57:107–117. [Google Scholar]
- IBÁÑEZ M, SANCHO JV, HERNÁNDEZ F, MCMILLAN D, RAO R. Rapid non-target screening of organic pollutants in water by ultraperformance liquid chromatography coupled to time-of-light mass spectrometry. TrAC - Trends in Analytical Chemistry. 2008;27:481–489. [Google Scholar]
- IONAS AC, BALLESTEROS GÓMEZ A, LEONARDS PEG, COVACI A. Identification strategies for flame retardants employing time-of-flight mass spectrometric detectors along with spectral and spectra-less databases. Journal of Mass Spectrometry. 2015;50:1031–1038. doi: 10.1002/jms.3618. [DOI] [PubMed] [Google Scholar]
- JAMIN E, BONVALLOT N, TREMBLAY-FRANCO M, CRAVEDI JP, CHEVRIER C, CORDIER S, DEBRAUWER L. Untargeted profiling of pesticide metabolites by LC–HRMS: an exposomics tool for human exposure evaluation. Analytical and Bioanalytical Chemistry. 2014;406:1149–1161. doi: 10.1007/s00216-013-7136-2. [DOI] [PubMed] [Google Scholar]
- JONES DP. Sequencing the exposome: A call to action. Toxicol Rep. 2016;3:29–45. doi: 10.1016/j.toxrep.2015.11.009. [DOI] [PMC free article] [PubMed] [Google Scholar]
- JONKER W, LAMOREE MH, HOUTMAN CJ, HAMERS T, SOMSEN GW, KOOL J. Rapid activity-directed screening of estrogens by parallel coupling of liquid chromatography with a functional gene reporter assay and mass spectrometry. J Chromatogr A. 2015;1406:165–74. doi: 10.1016/j.chroma.2015.06.012. [DOI] [PubMed] [Google Scholar]
- KAUFMANN A. Combining UHPLC and high-resolution MS: A viable approach for the analysis of complex samples? TrAC Trends in Analytical Chemistry. 2014;63:113–128. [Google Scholar]
- KAZDA R, HAJŠLOVÁ J, POUSTKA J, ČAJKA T. Determination of polybrominated diphenyl ethers in human milk samples in the Czech Republic: Comparative study of negative chemical ionisation mass spectrometry and time-of-flight high-resolution mass spectrometry. Analytica Chimica Acta. 2004;520:237–243. [Google Scholar]
- KHALHEIM OM. Scaling of analytical data. Analytica Chimica Acta. 1985;177:71–79. [Google Scholar]
- KINYUA J, NEGREIRA N, IBÁÑEZ M, BIJLSMA L, HERNÁNDEZ F, COVACI A, VAN NUIJS ALN. A data-independent acquisition workflow for qualitative screening of new psychoactive substances in biological samples. Analytical and Bioanalytical Chemistry. 2015;407:8773–8785. doi: 10.1007/s00216-015-9036-0. [DOI] [PubMed] [Google Scholar]
- KOHLER I, SCHAPPLER J, RUDAZ S. Highly sensitive capillary electrophoresis-mass spectrometry for rapid screening and accurate quantitation of drugs of abuse in urine. Analytica Chimica Acta. 2013;780:101–109. doi: 10.1016/j.aca.2013.03.065. [DOI] [PubMed] [Google Scholar]
- KORTENKAMP A, FAUST M, SCHOLZE M, BACKHAUS T. Low-level exposure to multiple chemicals: reason for human health concerns? Environ Health Perspect. 2007;115(Suppl 1):106–14. doi: 10.1289/ehp.9358. [DOI] [PMC free article] [PubMed] [Google Scholar]
- KVALHEIM OM, BRAKSTAD F, LIANG Y. Preprocessing of analytical profiles in the presence of homoscedastic or heteroscedastic noise. Anal Chem. 1994:66. [Google Scholar]
- LEBLANC A, SHIAO TC, ROY R, SLENO L. Improved detection of reactive metabolites with a bromine-containing glutathione analog using mass defect and isotope pattern matching. Rapid Communications in Mass Spectrometry. 2010;24:1241–1250. doi: 10.1002/rcm.4507. [DOI] [PubMed] [Google Scholar]
- LEENDERT V, VAN LANGENHOVE H, DEMEESTERE K. Trends in liquid chromatography coupled to high-resolution mass spectrometry for multi-residue analysis of organic micropollutants in aquatic environments. TrAC Trends in Analytical Chemistry. 2015;67:192–208. [Google Scholar]
- LEHOTAY SJ, SAPOZHNIKOVA Y, MOL HGJ. Current issues involving screening and identification of chemical contaminants in foods by mass spectrometry. TrAC Trends in Analytical Chemistry. 2015;69:62–75. [Google Scholar]
- LI X, FRANKE AA. High-throughput and cost-effective global DNA methylation assay by liquid chromatography-mass spectrometry. Anal Chim Acta. 2011a;703:58–63. doi: 10.1016/j.aca.2011.07.014. [DOI] [PMC free article] [PubMed] [Google Scholar]
- LI X, FRANKE AA. Improved LC-MS method for the determination of fatty acids in red blood cells by LC-orbitrap MS. Anal Chem. 2011b;83:3192–8. doi: 10.1021/ac103093w. [DOI] [PMC free article] [PubMed] [Google Scholar]
- LIM HK, CHEN J, COOK K, SENSENHAUSER C, SILVA J, EVANS DC. A generic method to detect electrophilic intermediates using isotopic pattern triggered data-dependent high-resolution accurate mass spectrometry. Rapid Communications in Mass Spectrometry. 2008;22:1295–1311. doi: 10.1002/rcm.3504. [DOI] [PubMed] [Google Scholar]
- LIN L, LIN H, ZHANG M, DONG X, YIN X, QU C, NI J. Types, principle, and characteristics of tandem high-resolution mass spectrometry and its applications. RSC Advances. 2015;5:107623–107636. [Google Scholar]
- LIND PM, RISERUS U, SALIHOVIC S, BAVEL B, LIND L. An environmental wide association study (EWAS) approach to the metabolic syndrome. Environ Int. 2013;55:1–8. doi: 10.1016/j.envint.2013.01.017. [DOI] [PubMed] [Google Scholar]
- LIU ZY. An introduction to hybrid ion trap/time-of-flight mass spectrometry coupled with liquid chromatography applied to drug metabolism studies. J Mass Spectrom. 2012;47:1627–42. doi: 10.1002/jms.3126. [DOI] [PubMed] [Google Scholar]
- LOPEZ DE MATURANA E, PINEDA S, BRAND A, VAN STEEN K, MALATS N. Toward the integration of Omics data in epidemiological studies: still a “long and winding road”. Genet Epidemiol. 2016 doi: 10.1002/gepi.21992. [DOI] [PubMed] [Google Scholar]
- MA S, CHOWDHURY SK. Application of Liquid Chromatography/Mass Spectrometry for Metabolite Identification. Drug Metabolism in Drug Design and Development: Basic Concepts and Practice 2007 [Google Scholar]
- MA S, CHOWDHURY SK. Data acquisition and data mining techniques for metabolite identification using LC coupled to high-resolution MS. Bioanalysis. 2013;5:1285–97. doi: 10.4155/bio.13.103. [DOI] [PubMed] [Google Scholar]
- MA WL, GAO C, BELL EM, DRUSCHEL CM, CAGGANA M, ALDOUS KM, BUCK LOUIS GM, KANNAN K. Analysis of polychlorinated biphenyls and organochlorine pesticides in archived dried blood spots and its application to track temporal trends of environmental chemicals in newborns. Environmental research. 2014;133:204–210. doi: 10.1016/j.envres.2014.05.029. [DOI] [PMC free article] [PubMed] [Google Scholar]
- MACHERONE A. Chapter 20 - The Future of GC/Q-TOF in Environmental Analysis. In: IMMA F, THURMAN EM, editors. Comprehensive Analytical Chemistry. Elsevier; 2013. [Google Scholar]
- MADJI HOUNOUM B, BLASCO H, EMOND P, MAVEL S. Liquid chromatography-high-resolution mass spectrometry-based cell metabolomics: Experimental design, recommendations, and applications. TrAC - Trends in Analytical Chemistry. 2016;75:118–128. [Google Scholar]
- MARCHESE S, CURINI R, GENTILI A, PERRET D, ROCCA LM. Simultaneous determination of the urinary metabolites of benzene, toluene, xylene and styrene using high-performance liquid chromatography/hybrid quadrupole time-of-flight mass spectrometry. Rapid Commun Mass Spectrom. 2004;18:265–72. doi: 10.1002/rcm.1323. [DOI] [PubMed] [Google Scholar]
- MARDAL M, MISEREZ B, BADE R, PORTOLÉS T, BISCHOFF M, HERNÁNDEZ F, MEYER MR. 3-Fluorophenmetrazine, a fluorinated analogue of phenmetrazine: Studies on in vivo metabolism in rat and human, in vitro metabolism in human CYP isoenzymes and microbial biotransformation in Pseudomonas Putida and wastewater using GC and LC coupled to (HR)-MS techniques. Journal of Pharmaceutical and Biomedical Analysis. 2016;128:485–495. doi: 10.1016/j.jpba.2016.06.011. [DOI] [PubMed] [Google Scholar]
- MARIN SJ, HUGHES JM, LAWLOR BG, CLARK CJ, MCMILLIN GA. Rapid screening for 67 drugs and metabolites in serum or plasma by accurate-mass LC-TOF-MS. J Anal Toxicol. 2012;36:477–86. doi: 10.1093/jat/bks061. [DOI] [PubMed] [Google Scholar]
- MARIN SJ, METCALF A, KRASOWSKI MD, LINERT BS, CLARK CJ, STRATHMANN FG, MCMILLIN GA. Detection of neonatal drug exposure using umbilical cord tissue and liquid chromatography time-of-flight mass spectrometry. Ther Drug Monit. 2014;36:119–24. doi: 10.1097/FTD.0b013e3182a0d18c. [DOI] [PubMed] [Google Scholar]
- MARKLEY JL, BRÜSCHWEILER R, EDISON AS, EGHBALNIA HR, POWERS R, RAFTERY D, WISHART DS. The future of NMR-based metabolomics. Current Opinion in Biotechnology. 2017;43:34–40. doi: 10.1016/j.copbio.2016.08.001. [DOI] [PMC free article] [PubMed] [Google Scholar]
- MARNEY LC, HOGGARD JC, SKOGERBOE KJ, SYNOVEC RE. Methods of discovery-based and targeted metabolite analysis by comprehensive two-dimensional gas chromatography with time-of-flight mass spectrometry detection. Methods Mol Biol. 2014;1198:83–97. doi: 10.1007/978-1-4939-1258-2_6. [DOI] [PubMed] [Google Scholar]
- MCARDLE A, QASIM BUTT A, SZENTPETERY A, DE JAGER W, DE ROOCK S, FITZGERALD O, PENNINGTON SR. Developing clinically relevant biomarkers in inflammatory arthritis: A multiplatform approach for serum candidate protein discovery. Proteomics Clin Appl. 2016;10:691–8. doi: 10.1002/prca.201500046. [DOI] [PubMed] [Google Scholar]
- MCMAHEN RL, STRYNAR MJ, DAGNINO S, HERR DW, MOSER VC, GARANTZIOTIS S, ANDERSEN EM, FREEBORN DL, MCMILLAN L, LINDSTROM AB. Identification of fipronil metabolites by time-of-flight mass spectrometry for application in a human exposure study. Environ Int. 2015;78:16–23. doi: 10.1016/j.envint.2015.01.016. [DOI] [PMC free article] [PubMed] [Google Scholar]
- MEDINA CM, PITARCH E, LOPEZ FJ, VAZQUEZ C, HERNANDEZ F. Determination of PBDEs in human breast adipose tissues by gas chromatography coupled with triple quadrupole mass spectrometry. Anal Bioanal Chem. 2008;390:1343–54. doi: 10.1007/s00216-007-1792-z. [DOI] [PubMed] [Google Scholar]
- MEGSON D, FOCANT JF, PATTERSON DG, ROBSON M, LOHAN MC, WORSFOLD PJ, COMBER S, KALIN R, REINER E, O’SULLIVAN G. Can polychlorinated biphenyl (PCB) signatures and enantiomer fractions be used for source identification and to age date occupational exposure? Environ Int. 2015;81:56–63. doi: 10.1016/j.envint.2015.04.006. [DOI] [PubMed] [Google Scholar]
- MEGSON D, KALIN R, WORSFOLD PJ, GAUCHOTTE-LINDSAY C, PATTERSON DG, JR, LOHAN MC, COMBER S, BROWN T, AGOS Fingerprinting polychlorinated biphenyls in environmental samples using comprehensive two-dimensional gas chromatography with time-of-flight mass spectrometry. J Chromatogr A. 2013;1318:276–83. doi: 10.1016/j.chroma.2013.10.016. [DOI] [PubMed] [Google Scholar]
- MEGSON D, ORTIZ X, JOBST KJ, REINER EJ, MULDER MF, BALOUET JC. A comparison of fresh and used aircraft oil for the identification of toxic substances linked to aerotoxic syndrome. Chemosphere. 2016;158:116–23. doi: 10.1016/j.chemosphere.2016.05.062. [DOI] [PubMed] [Google Scholar]
- MEIER SM, GERNER C, KEPPLER BK, CINELLU MA, CASINI A. Mass Spectrometry Uncovers Molecular Reactivities of Coordination and Organometallic Gold(III) Drug Candidates in Competitive Experiments That Correlate with Their Biological Effects. Inorg Chem. 2016;55:4248–59. doi: 10.1021/acs.inorgchem.5b03000. [DOI] [PubMed] [Google Scholar]
- MILLER GW. The Exposome: A Primer. The Exposome: A Primer 2014 [Google Scholar]
- MILLER GW, JONES DP. The nature of nurture: refining the definition of the exposome. Toxicol Sci. 2014;137:1–2. doi: 10.1093/toxsci/kft251. [DOI] [PMC free article] [PubMed] [Google Scholar]
- MISCHAK H, COON JJ, NOVAK J, WEISSINGER EM, SCHANSTRA JP, DOMINICZAK AF. Capillary electrophoresis-mass spectrometry as a powerful tool in biomarker discovery and clinical diagnosis: an update of recent developments. Mass Spectrom Rev. 2009;28:703–24. doi: 10.1002/mas.20205. [DOI] [PMC free article] [PubMed] [Google Scholar]
- MUIR DCG, HOWARD PH. Are There Other Persistent Organic Pollutants? A Challenge for Environmental Chemists. Environmental Science & Technology. 2006;40:7157–7166. doi: 10.1021/es061677a. [DOI] [PubMed] [Google Scholar]
- MUSCALU AM, EDWARDS M, GORECKI T, REINER EJ. Evaluation of a single-stage consumable-free modulator for comprehensive two-dimensional gas chromatography: analysis of polychlorinated biphenyls, organochlorine pesticides and chlorobenzenes. J Chromatogr A. 2015;1391:93–101. doi: 10.1016/j.chroma.2015.02.074. [DOI] [PubMed] [Google Scholar]
- NÁCHER-MESTRE J, SERRANO R, PORTOLÉS T, BERNTSSEN MHG, PÉREZ-SÁNCHEZ J, HERNÁNDEZ F. Screening of pesticides and polycyclic aromatic hydrocarbons in feeds and fish tissues by gas chromatography coupled to high-resolution mass spectrometry using atmospheric pressure chemical ionization. Journal of Agricultural and Food Chemistry. 2014;62:2165–2174. doi: 10.1021/jf405366n. [DOI] [PubMed] [Google Scholar]
- NÁCHER-MESTRE J, SERRANO R, PORTOLÉS T, HERNÁNDEZ F. Investigation of organophosphate esters in fresh water, salt and brine samples by GC-TOF MS. Analytical Methods. 2011;3:1779–1785. [Google Scholar]
- NAKAMURA J, MUTLU E, SHARMA V, COLLINS L, BODNAR W, YU R, LAI Y, MOELLER B, LU K, SWENBERG J. The endogenous exposome. DNA Repair. 2014;19:3–13. doi: 10.1016/j.dnarep.2014.03.031. [DOI] [PMC free article] [PubMed] [Google Scholar]
- NEMES P, VERTES A. Laser ablation electrospray ionization for atmospheric pressure, in vivo, and imaging mass spectrometry. Anal Chem. 2007;79:8098–106. doi: 10.1021/ac071181r. [DOI] [PubMed] [Google Scholar]
- NIELEN MW, VAN ENGELEN MC, ZUIDERENT R, RAMAKER R. Screening and confirmation criteria for hormone residue analysis using liquid chromatography accurate mass time-of-flight, Fourier transform ion cyclotron resonance and orbitrap mass spectrometry techniques. Anal Chim Acta. 2007;586:122–9. doi: 10.1016/j.aca.2006.08.055. [DOI] [PubMed] [Google Scholar]
- NIJMEIJER S, VISCHER HF, RUDEBECK AF, FLEURBAAIJ F, FALCK D, LEURS R, NIESSEN WM, KOOL J. Development of a profiling strategy for metabolic mixtures by combining chromatography and mass spectrometry with cell-based GPCR signaling. J Biomol Screen. 2012;17:1329–38. doi: 10.1177/1087057112451922. [DOI] [PubMed] [Google Scholar]
- NISHIOKA T, KASAMA T, KINUMI T, MAKABE H, MATSUDA F, MIURA D, MIYASHITA M, NAKAMURA T, TANAKA K, YAMAMOTO A. Winners of CASMI2013: Automated Tools and Challenge Data. Mass Spectrom (Tokyo) 2014;3:S0039. doi: 10.5702/massspectrometry.S0039. [DOI] [PMC free article] [PubMed] [Google Scholar]
- NURMI J, PELLINEN J, RANTALAINEN AL. Critical evaluation of screening techniques for emerging environmental contaminants based on accurate mass measurements with time-of-flight mass spectrometry. Journal of Mass Spectrometry. 2012;47:303–312. doi: 10.1002/jms.2964. [DOI] [PubMed] [Google Scholar]
- OJANPERA I, KOLMONEN M, PELANDER A. Current use of high-resolution mass spectrometry in drug screening relevant to clinical and forensic toxicology and doping control. Anal Bioanal Chem. 2012;403:1203–20. doi: 10.1007/s00216-012-5726-z. [DOI] [PubMed] [Google Scholar]
- ONGHENA M, VAN HOECK E, VAN LOCO J, IBÁÑEZ M, CHERTA L, PORTOLÉS T, PITARCH E, HERNANDÉZ F, LEMIÈRE F, COVACI A. Identification of substances migrating from plastic baby bottles using a combination of low-resolution and high-resolution mass spectrometric analysers coupled to gas and liquid chromatography. Journal of Mass Spectrometry. 2015;50:1234–1244. doi: 10.1002/jms.3644. [DOI] [PubMed] [Google Scholar]
- ORGANTINI KL, MYERS AL, JOBST KJ, COCHRAN J, ROSS B, MCCARRY B, REINER EJ, DORMAN FL. Comprehensive characterization of the halogenated dibenzo-p-dioxin and dibenzofuran contents of residential fire debris using comprehensive two-dimensional gas chromatography coupled to time of flight mass spectrometry. J Chromatogr A. 2014;1369:138–46. doi: 10.1016/j.chroma.2014.09.088. [DOI] [PubMed] [Google Scholar]
- PATEL CJ, BHATTACHARYA J, BUTTE AJ. An Environment-Wide Association Study (EWAS) on type 2 diabetes mellitus. PLoS One. 2010;5:e10746. doi: 10.1371/journal.pone.0010746. [DOI] [PMC free article] [PubMed] [Google Scholar]
- PATTERSON DG, JR, WELCH SM, TURNER WE, SJODIN A, FOCANT JF. Cryogenic zone compression for the measurement of dioxins in human serum by isotope dilution at the attogram level using modulated gas chromatography coupled to high resolution magnetic sector mass spectrometry. J Chromatogr A. 2011;1218:3274–81. doi: 10.1016/j.chroma.2010.10.084. [DOI] [PubMed] [Google Scholar]
- PELANDER A, RISTIMAA J, RASANEN I, VUORI E, OJANPERA I. Screening for basic drugs in hair of drug addicts by liquid chromatography/time-of-flight mass spectrometry. Ther Drug Monit. 2008;30:717–24. doi: 10.1097/FTD.0b013e3181897cfa. [DOI] [PubMed] [Google Scholar]
- PERRY RH, COOKS RG, NOLL RJ. Orbitrap mass spectrometry: instrumentation, ion motion and applications. Mass Spectrom Rev. 2008;27:661–99. doi: 10.1002/mas.20186. [DOI] [PubMed] [Google Scholar]
- PETROVIC M, BARCELO D. Application of liquid chromatography/quadrupole time-of-flight mass spectrometry (LC-QqTOF-MS) in the environmental analysis. J Mass Spectrom. 2006;41:1259–67. doi: 10.1002/jms.1103. [DOI] [PubMed] [Google Scholar]
- PLASSMANN MM, BRACK W, KRAUSS M. Extending analysis of environmental pollutants in human urine towards screening for suspected compounds. J Chromatogr A. 2015;1394:18–25. doi: 10.1016/j.chroma.2015.03.040. [DOI] [PubMed] [Google Scholar]
- PLASSMANN MM, TENGSTRAND E, ABERG KM, BENSKIN JP. Non-target time trend screening: a data reduction strategy for detecting emerging contaminants in biological samples. Anal Bioanal Chem. 2016;408:4203–8. doi: 10.1007/s00216-016-9563-3. [DOI] [PMC free article] [PubMed] [Google Scholar]
- PLEIL JD, ISAACS KK. High-resolution mass spectrometry: basic principles for using exact mass and mass defect for discovery analysis of organic molecules in blood, breath, urine and environmental media. J Breath Res. 2016;10:012001. doi: 10.1088/1752-7155/10/1/012001. [DOI] [PubMed] [Google Scholar]
- PLEIL JD, STIEGEL MA. Evolution of environmental exposure science: using breath-borne biomarkers for “discovery” of the human exposome. Anal Chem. 2013;85:9984–90. doi: 10.1021/ac402306f. [DOI] [PubMed] [Google Scholar]
- PORTOLÉS T, MOL JGJ, SANCHO JV, HERNÁNDEZ F. Use of electron ionization and atmospheric pressure chemical ionization in gas chromatography coupled to time-of-flight mass spectrometry for screening and identification of organic pollutants in waters. Journal of Chromatography A. 2014a;1339:145–153. doi: 10.1016/j.chroma.2014.03.001. [DOI] [PubMed] [Google Scholar]
- PORTOLÉS T, MOL JGJ, SANCHO JV, LÓPEZ FJ, HERNÁNDEZ F. Validation of a qualitative screening method for pesticides in fruits and vegetables by gas chromatography quadrupole-time of flight mass spectrometry with atmospheric pressure chemical ionization. Analytica Chimica Acta. 2014b;838:76–85. doi: 10.1016/j.aca.2014.06.006. [DOI] [PubMed] [Google Scholar]
- POZO ÓJ, IBÁÑEZ M, SANCHO JV, LAHOZ-BENEYTEZ J, FARRÉ M, PAPASEIT E, DE LA TORRE R, HERNÁNDEZ F. Mass Spectrometric Evaluation of Mephedrone In Vivo Human Metabolism: Identification of Phase I and Phase II Metabolites, Including a Novel Succinyl Conjugate. Drug Metabolism and Disposition. 2015;43:248–257. doi: 10.1124/dmd.114.061416. [DOI] [PubMed] [Google Scholar]
- PRAGST F, BROECKER S, HASTEDT M, HERRE S, ANDRESEN-STREICHERT H, SACHS H, TSOKOS M. Methadone and illegal drugs in hair from children with parents in maintenance treatment or suspected for drug abuse in a German community. Ther Drug Monit. 2013;35:737–52. doi: 10.1097/FTD.0b013e31829a78c3. [DOI] [PubMed] [Google Scholar]
- RAGER JE, STRYNAR MJ, LIANG S, MCMAHEN RL, RICHARD AM, GRULKE CM, WAMBAUGH JF, ISAACS KK, JUDSON R, WILLIAMS AJ, SOBUS JR. Linking high resolution mass spectrometry data with exposure and toxicity forecasts to advance high-throughput environmental monitoring. Environ Int. 2016;88:269–80. doi: 10.1016/j.envint.2015.12.008. [DOI] [PubMed] [Google Scholar]
- RAPPAPORT SM. Implications of the exposome for exposure science. J Expo Sci Environ Epidemiol. 2011;21:5–9. doi: 10.1038/jes.2010.50. [DOI] [PubMed] [Google Scholar]
- RAPPAPORT SM. Biomarkers intersect with the exposome. Biomarkers. 2012;17:483–489. doi: 10.3109/1354750X.2012.691553. [DOI] [PMC free article] [PubMed] [Google Scholar]
- RAPPAPORT SM. Genetic Factors Are Not the Major Causes of Chronic Diseases. PLoS One. 2016;11:e0154387. doi: 10.1371/journal.pone.0154387. [DOI] [PMC free article] [PubMed] [Google Scholar]
- RAPPAPORT SM, BARUPAL DK, WISHART D, VINEIS P, SCALBERT A. The Blood Exposome and Its Role in Discovering Causes of Disease. Environ Health Perspect. 2014 doi: 10.1289/ehp.1308015. [DOI] [PMC free article] [PubMed] [Google Scholar]
- RAPPAPORT SM, SMITH MT. Epidemiology. Environment and disease risks. Science. 2010;330:460–1. doi: 10.1126/science.1192603. [DOI] [PMC free article] [PubMed] [Google Scholar]
- RATHAHAO-PARIS E, ALVES S, JUNOT C, TABET JC. High resolution mass spectrometry for structural identification of metabolites in metabolomics. Metabolomics. 2016;12:1–15. [Google Scholar]
- REN S, HINZMAN AA, KANG EL, SZCZESNIAK RD, LU LJ. Computational and statistical analysis of metabolomics data. Metabolomics. 2015;11:1492–1513. [Google Scholar]
- RISTIMAA J, GERGOV M, PELANDER A, HALMESMAKI E, OJANPERA I. Broad-spectrum drug screening of meconium by liquid chromatography with tandem mass spectrometry and time-of-flight mass spectrometry. Anal Bioanal Chem. 2010;398:925–35. doi: 10.1007/s00216-010-3942-y. [DOI] [PubMed] [Google Scholar]
- ROBINSON O, BASAGANA X, AGIER L, DE CASTRO M, HERNANDEZ-FERRER C, GONZALEZ JR, GRIMALT JO, NIEUWENHUIJSEN M, SUNYER J, SLAMA R, VRIJHEID M. The Pregnancy Exposome: Multiple Environmental Exposures in the INMA-Sabadell Birth Cohort. Environ Sci Technol. 2015;49:10632–41. doi: 10.1021/acs.est.5b01782. [DOI] [PubMed] [Google Scholar]
- ROCA M, LEON N, PASTOR A, YUSÀ V. Comprehensive analytical strategy for biomonitoring of pesticides in urine by liquid chromatography–orbitrap high resolution mass spectrometry. Journal of Chromatography A. 2014;1374:66–76. doi: 10.1016/j.chroma.2014.11.010. [DOI] [PubMed] [Google Scholar]
- ROTANDER A, KARRMAN A, TOMS LM, KAY M, MUELLER JF, GOMEZ RAMOS MJ. Novel fluorinated surfactants tentatively identified in firefighters using liquid chromatography quadrupole time-of-flight tandem mass spectrometry and a case-control approach. Environ Sci Technol. 2015;49:2434–42. doi: 10.1021/es503653n. [DOI] [PubMed] [Google Scholar]
- SANDAU CD, SJODIN A, DAVIS MD, BARR JR, MAGGIO VL, WATERMAN AL, PRESTON KE, PREAU JL, JR, BARR DB, NEEDHAM LL, PATTERSON DG., JR Comprehensive solid-phase extraction method for persistent organic pollutants. Validation and application to the analysis of persistent chlorinated pesticides. Anal Chem. 2003;75:71–7. doi: 10.1021/ac026121u. [DOI] [PubMed] [Google Scholar]
- SCHEUBERT K, HUFSKY F, BOCKER S. Computational mass spectrometry for small molecules. J Cheminform. 2013;5:12. doi: 10.1186/1758-2946-5-12. [DOI] [PMC free article] [PubMed] [Google Scholar]
- SCHRIMPE-RUTLEDGE AC, CODREANU SG, SHERROD SD, MCLEAN JA. Untargeted Metabolomics Strategies—Challenges and Emerging Directions. Journal of The American Society for Mass Spectrometry. 2016:1–9. doi: 10.1007/s13361-016-1469-y. [DOI] [PMC free article] [PubMed] [Google Scholar]
- SCHYMANSKI E, NEUMANN S. CASMI: And the Winner is. Metabolites. 2013;3:412. doi: 10.3390/metabo3020412. [DOI] [PMC free article] [PubMed] [Google Scholar]
- SCIGELOVA M, HORNSHAW M, GIANNAKOPULOS A, MAKAROV A. Fourier transform mass spectrometry. Mol Cell Proteomics. 2011;10:M111.009431. doi: 10.1074/mcp.M111.009431. [DOI] [PMC free article] [PubMed] [Google Scholar]
- SHEN M, BIN P, LI H, ZHANG X, SUN X, DUAN H, NIU Y, MENG T, DAI Y, GAO W, YU S, GU G, ZHENG Y. Increased levels of etheno-DNA adducts and genotoxicity biomarkers of long-term exposure to pure diesel engine exhaust. Sci Total Environ. 2016a;543:267–73. doi: 10.1016/j.scitotenv.2015.10.165. [DOI] [PubMed] [Google Scholar]
- SHEN X, GONG X, CAI Y, GUO Y, TU J, LI H, ZHANG T, WANG J, XUE F, ZHU ZJ. Normalization and integration of large-scale metabolomics data using support vector regression. Metabolomics. 2016b;12:1–12. [Google Scholar]
- SHI X, QIAO L, XU G. Recent development of ionic liquid stationary phases for liquid chromatography. Journal of Chromatography A. 2015;1420:1–15. doi: 10.1016/j.chroma.2015.09.090. [DOI] [PubMed] [Google Scholar]
- SIROUX V, AGIER L, SLAMA R. The exposome concept: a challenge and a potential driver for environmental health research. Eur Respir Rev. 2016;25:124–9. doi: 10.1183/16000617.0034-2016. [DOI] [PMC free article] [PubMed] [Google Scholar]
- SJODIN A, JONES RS, LAPEZA CR, FOCANT JF, MCGAHEE EE, 3RD, PATTERSON DG., JR Semiautomated high-throughput extraction and cleanup method for the measurement of polybrominated diphenyl ethers, polybrominated biphenyls, and polychlorinated biphenyls in human serum. Anal Chem. 2004;76:1921–7. doi: 10.1021/ac030381+. [DOI] [PubMed] [Google Scholar]
- SMOLINSKA A, HAUSCHILD AC, FIJTEN RRR, DALLINGA JW, BAUMBACH J, VAN SCHOOTEN FJ. Current breathomics - A review on data pre-processing techniques and machine learning in metabolomics breath analysis. Journal of Breath Research. 2014:8. doi: 10.1088/1752-7155/8/2/027105. [DOI] [PubMed] [Google Scholar]
- SOLTOW Q, STROBEL F, MANSFIELD K, WACHTMAN L, PARK Y, JONES D. High-performance metabolic profiling with dual chromatography-Fourier-transform mass spectrometry (DC-FTMS) for study of the exposome. Metabolomics. 2013;9:132–143. doi: 10.1007/s11306-011-0332-1. [DOI] [PMC free article] [PubMed] [Google Scholar]
- SPAGGIARI D, GEISER L, RUDAZ S. Coupling ultra-high-pressure liquid chromatography with mass spectrometry for in-vitro drug-metabolism studies. TrAC Trends in Analytical Chemistry. 2014;63:129–139. [Google Scholar]
- STAGLIANO MC, DEKEYSER JG, OMIECINSKI CJ, JONES AD. Bioassay-directed fractionation for discovery of bioactive neutral lipids guided by relative mass defect filtering and multiplexed collision-induced dissociation. Rapid Commun Mass Spectrom. 2010;24:3578–84. doi: 10.1002/rcm.4796. [DOI] [PMC free article] [PubMed] [Google Scholar]
- SWINTON DJ, CD, IDOWU T. Analysis of nicotine and its major metabolites, cotinine and trans-3′-hydroxycotinine, using the quadrupole time-of-flight mass spectrometer. IHE: Lincoln University Journal of Science. 2011:2. [Google Scholar]
- TAIRA K, FUJIOKA K, AOYAMA Y. Qualitative Profiling and Quantification of Neonicotinoid Metabolites in Human Urine by Liquid Chromatography Coupled with Mass Spectrometry. PLoS ONE. 2013;8:e80332. doi: 10.1371/journal.pone.0080332. [DOI] [PMC free article] [PubMed] [Google Scholar]
- TANG DQ, ZOU L, YIN XX, ONG CN. HILIC-MS for metabolomics: An attractive and complementary approach to RPLC-MS. Mass Spectrom Rev. 2014 doi: 10.1002/mas.21445. [DOI] [PubMed] [Google Scholar]
- THEVIS M, THOMAS A, POP V, SCHANZER W. Ultrahigh pressure liquid chromatography-(tandem) mass spectrometry in human sports drug testing: possibilities and limitations. J Chromatogr A. 2013;1292:38–50. doi: 10.1016/j.chroma.2012.12.048. [DOI] [PubMed] [Google Scholar]
- TILLER PR, YU S, CASTRO-PEREZ J, FILLGROVE KL, BAILLIE TA. High-throughput, accurate mass liquid chromatography/tandem mass spectrometry on a quadrupole time-of-flight system as a ‘first-line’ approach for metabolite identification studies. Rapid Communications in Mass Spectrometry. 2008;22:1053–1061. doi: 10.1002/rcm.3472. [DOI] [PubMed] [Google Scholar]
- UBUKATA M, JOBST KJ, REINER EJ, REICHENBACH SE, TAO Q, HANG J, WU Z, DANE AJ, CODY RB. Non-targeted analysis of electronics waste by comprehensive two-dimensional gas chromatography combined with high-resolution mass spectrometry: Using accurate mass information and mass defect analysis to explore the data. Journal of Chromatography A. 2015;1395:152–159. doi: 10.1016/j.chroma.2015.03.050. [DOI] [PubMed] [Google Scholar]
- UPPAL K, WALKER DI, LIU K, LI S, GO Y-M, JONES DP. Computational metabolomics: a framework for the million metabolome. Chemical Research in Toxicology. 2016 doi: 10.1021/acs.chemrestox.6b00179. [DOI] [PMC free article] [PubMed] [Google Scholar]
- VAN DEN BERG RA, HOEFSLOOT HC, WESTERHUIS JA, SMILDE AK, VAN DER WERF MJ. Centering, scaling, and transformations: improving the biological information content of metabolomics data. BMC Genomics. 2006;7:1–15. doi: 10.1186/1471-2164-7-142. [DOI] [PMC free article] [PubMed] [Google Scholar]
- VINEIS P, CHADEAU-HYAM M, GMUENDER H, GULLIVER J, HERCEG Z, KLEINJANS J, KOGEVINAS M, KYRTOPOULOS S, NIEUWENHUIJSEN M, PHILLIPS DH, PROBST-HENSCH N, SCALBERT A, VERMEULEN R, WILD CP. The exposome in practice: Design of the EXPOsOMICS project. Int J Hyg Environ Health. 2016 doi: 10.1016/j.ijheh.2016.08.001. [DOI] [PMC free article] [PubMed] [Google Scholar]
- WALKER DI, MALLON CT, HOPKE PK, UPPAL K, GO YM, ROHRBECK P, PENNELL KD, JONES DP. Deployment-Associated Exposure Surveillance With High-Resolution Metabolomics. J Occup Environ Med. 2016a;58:S12–21. doi: 10.1097/JOM.0000000000000768. [DOI] [PMC free article] [PubMed] [Google Scholar]
- WALKER DI, PENNELL KD, UPPAL K, XIA X, HOPKE PK, UTELL MJ, PHIPPS RP, SIME PJ, ROHRBECK P, MALLON CT, JONES DP. Pilot Metabolome-Wide Association Study of Benzo(a)pyrene in Serum From Military Personnel. J Occup Environ Med. 2016b;58:S44–52. doi: 10.1097/JOM.0000000000000772. [DOI] [PMC free article] [PubMed] [Google Scholar]
- WANG H, WANG B, ZHAO Q, ZHAO Y, FU C, FENG X, WANG N, SU M, TANG C, JIANG F, ZHOU Y, CHEN Y, JIANG Q. Antibiotic body burden of Chinese school children: a multisite biomonitoring-based study. Environ Sci Technol. 2015;49:5070–9. doi: 10.1021/es5059428. [DOI] [PubMed] [Google Scholar]
- WANG HX, WANG B, ZHOU Y, JIANG QW. Rapid and sensitive screening and selective quantification of antibiotics in human urine by two-dimensional ultraperformance liquid chromatography coupled with quadrupole time-of-flight mass spectrometry. Anal Bioanal Chem. 2014a;406:8049–58. doi: 10.1007/s00216-014-8197-6. [DOI] [PubMed] [Google Scholar]
- WANG Y, KORA G, BOWEN BP, PAN C. MIDAS: a database-searching algorithm for metabolite identification in metabolomics. Anal Chem. 2014b;86:9496–503. doi: 10.1021/ac5014783. [DOI] [PubMed] [Google Scholar]
- WARRACK BM, HNATYSHYN S, OTT KH, REILY MD, SANDERS M, ZHANG H, DREXLER DM. Normalization strategies for metabonomic analysis of urine samples. J Chromatogr B Analyt Technol Biomed Life Sci. 2009;877:547–52. doi: 10.1016/j.jchromb.2009.01.007. [DOI] [PubMed] [Google Scholar]
- WHILEY L, GODZIEN J, RUPEREZ FJ, LEGIDO-QUIGLEY C, BARBAS C. In-vial dual extraction for direct LC-MS analysis of plasma for comprehensive and highly reproducible metabolic fingerprinting. Anal Chem. 2012;84:5992–9. doi: 10.1021/ac300716u. [DOI] [PubMed] [Google Scholar]
- WILD CP. Complementing the genome with an “exposome”: the outstanding challenge of environmental exposure measurement in molecular epidemiology. Cancer Epidemiol Biomarkers Prev. 2005;14:1847–50. doi: 10.1158/1055-9965.EPI-05-0456. [DOI] [PubMed] [Google Scholar]
- WILD CP. The exposome: from concept to utility. Int J Epidemiol. 2012;41:24–32. doi: 10.1093/ije/dyr236. [DOI] [PubMed] [Google Scholar]
- WILD CP, SCALBERT A, HERCEG Z. Measuring the exposome: a powerful basis for evaluating environmental exposures and cancer risk. Environ Mol Mutagen. 2013;54:480–99. doi: 10.1002/em.21777. [DOI] [PubMed] [Google Scholar]
- WILLMANN L, ERBES T, KRIEGER S, TRAFKOWSKI J, RODAMER M, KAMMERER B. Metabolome analysis via comprehensive two-dimensional liquid chromatography: identification of modified nucleosides from RNA metabolism. Anal Bioanal Chem. 2015;407:3555–66. doi: 10.1007/s00216-015-8516-6. [DOI] [PubMed] [Google Scholar]
- WOLF S, SCHMIDT S, MULLER-HANNEMANN M, NEUMANN S. In silico fragmentation for computer assisted identification of metabolite mass spectra. BMC Bioinformatics. 2010;11:148. doi: 10.1186/1471-2105-11-148. [DOI] [PMC free article] [PubMed] [Google Scholar]
- WU JL, LEUNG KF, TONG SF, LAM CW. Organochlorine isotopic pattern-enhanced detection and quantification of triclosan and its metabolites in human serum by ultra-high-performance liquid chromatography/quadrupole time-of-flight/mass spectrometry. Rapid Commun Mass Spectrom. 2012;26:123–32. doi: 10.1002/rcm.5303. [DOI] [PubMed] [Google Scholar]
- WU JL, LIU J, CAI Z. Determination of triclosan metabolites by using in-source fragmentation from high-performance liquid chromatography/negative atmospheric pressure chemical ionization ion trap mass spectrometry. Rapid Commun Mass Spectrom. 2010;24(13):1828–1834. doi: 10.1002/rcm.4558. [DOI] [PubMed] [Google Scholar]
- XIE C, ZHONG D, YU K, CHEN X. Recent advances in metabolite identification and quantitative bioanalysis by LC-Q-TOF MS. Bioanalysis. 2012;4:937–959. doi: 10.4155/bio.12.43. [DOI] [PubMed] [Google Scholar]
- YAMAGUCHI K, HIKIJI W, TAKINO M, SAKA K, HAYASHIDA M, FUKUNAGA T, OHNO Y. Analysis of tolfenpyrad and its metabolites in plasma in a tolfenpyrad poisoning case. J Anal Toxicol. 2012;36:529–37. doi: 10.1093/jat/bks060. [DOI] [PubMed] [Google Scholar]
- YAN Z, CALDWELL GW. Stable-isotope trapping and high-throughput screenings of reactive metabolites using the isotope MS signature. Analytical Chemistry. 2005;76:6835–6847. doi: 10.1021/ac040159k. [DOI] [PubMed] [Google Scholar]
- YAO Y, WANG P, SHAO G, ANZALOTA DEL TORO LV, CODERO, GIESE RW. Nontargeted analysis of the urine nonpolar sulfateome: a pathway to the nonpolar xenobiotic exposome. Rapid Commun Mass Spectrom. 2016;30(21):2341–2350. doi: 10.1002/rcm.7726. [DOI] [PMC free article] [PubMed] [Google Scholar]
- YI L, DONG N, YUN Y, DENG B, REN D, LIU S, LIANG Y. Chemometric methods in data processing of mass spectrometry-based metabolomics: A review. Analytica Chimica Acta. 2016;914:17–34. doi: 10.1016/j.aca.2016.02.001. [DOI] [PubMed] [Google Scholar]
- YIN P, XU G. Current state-of-the-art of nontargeted metabolomics based on liquid chromatography-mass spectrometry with special emphasis in clinical applications. J Chromatogr A. 2014;1374:1–13. doi: 10.1016/j.chroma.2014.11.050. [DOI] [PubMed] [Google Scholar]
- YOSHIOKA N, ASANO M, KUSE A, MITSUHASHI T, NAGASAKI Y, UENO Y. Rapid determination of glyphosate, glufosinate, bialaphos, and their major metabolites in serum by liquid chromatography-tandem mass spectrometry using hydrophilic interaction chromatography. J Chromatogr A. 2011;1218:3675–80. doi: 10.1016/j.chroma.2011.04.021. [DOI] [PubMed] [Google Scholar]
- ZENG Z, LIU X, DAI W, YIN P, ZHOU L, HUANG Q, LIN X, XU G. Ion fusion of high-resolution LC-MS-based metabolomics data to discover more reliable biomarkers. Anal Chem. 2014;86:3793–800. doi: 10.1021/ac500878x. [DOI] [PubMed] [Google Scholar]
- ZHANG H, ZHANG D, RAY K, ZHU M. Mass defect filter technique and its applications to drug metabolite identification by high-resolution mass spectrometry. Journal of Mass Spectrometry. 2009;44:999–1016. doi: 10.1002/jms.1610. [DOI] [PubMed] [Google Scholar]
- ZHANG H, ZHU M, RAY KL, MA L, ZHANG D. Mass defect profiles of biological matrices and the general applicability of mass defect filtering for metabolite detection. Rapid Communications in Mass Spectrometry. 2008;22:2082–2088. doi: 10.1002/rcm.3585. [DOI] [PubMed] [Google Scholar]
- ZHAO L, LI F. UHPLC-MS strategies and applications for bioanalyses related to pharmacokinetics and drug metabolism. TrAC Trends in Analytical Chemistry. 2014;63:170–179. [Google Scholar]
- ZHAO Y, LAM M, WU D, MAK R. Quantification of small molecules in plasma with direct analysis in real time tandem mass spectrometry, without sample preparation and liquid chromatographic separation. Rapid Commun Mass Spectrom. 2008;22:3217–24. doi: 10.1002/rcm.3726. [DOI] [PubMed] [Google Scholar]
- ZHOU J, WEBER RJ, ALLWOOD JW, MISTRIK R, ZHU Z, JI Z, CHEN S, DUNN WB, HE S, VIANT MR. HAMMER: automated operation of mass frontier to construct in silico mass spectral fragmentation libraries. Bioinformatics. 2014;30:581–3. doi: 10.1093/bioinformatics/btt711. [DOI] [PMC free article] [PubMed] [Google Scholar]
- ZHU M, ZHANG H, HUMPHREYS WG. Drug metabolite profiling and identification by high-resolution mass spectrometry. Journal of Biological Chemistry. 2011;286:25419–25425. doi: 10.1074/jbc.R110.200055. [DOI] [PMC free article] [PubMed] [Google Scholar]
- ZHU P, TONG W, ALTON K, CHOWDHURY S. An accurate-mass-based spectral-averaging isotope-pattern-filtering algorithm for extraction of drug metabolites possessing a distinct isotope pattern from LC-MS data. Analytical Chemistry. 2009;81:5910–5917. doi: 10.1021/ac900626d. [DOI] [PubMed] [Google Scholar]
- ZHU X, CHEN Y, SUBRAMANIAN R. Comparison of information-dependent acquisition, SWATH, and MS All techniques in metabolite identification study employing ultrahigh-performance liquid chromatography-quadrupole time-of-flight mass spectrometry. Analytical Chemistry. 2014;86:1202–1209. doi: 10.1021/ac403385y. [DOI] [PubMed] [Google Scholar]
Associated Data
This section collects any data citations, data availability statements, or supplementary materials included in this article.