

Abstract
Lymphocyte cytosolic protein 1 (LCP1), a member of actin-binding protein of the plastin family, has been identified in several malignant tumors of non-hematopoietic sites, such as the colon, prostate, and breast. However, little is known about the roles of LCP1 in oral squamous cell carcinomas (OSCCs). This present study sought to clarify the clinical relevance of LCP1 in OSCCs and investigate possible clinical applications for treating OSCCs by regulating LCP1 expression. We found up-regulation of LCP1in OSCCs compared with normal counterparts using real-time quantitative reverse transcription polymerase chain reaction (qRT-PCR), immunoblotting, and immunohistochemistry (P < 0.05). We used shRNA models for LCP1 (shLCP1) and enoxacin (ENX), a fluoroquinolone antibiotic drug, as a regulator of LCP1 expression. In addition to the LCP1 knockdown experiments in which shLCP1 cells showed several depressed functions, including cellular proliferation, invasiveness, and migratory activities, ENX-treated cells also had attenuated functions. Consistent with our hypothesis from our in vitro data, LCP1-positive OSCC samples were correlated closely with the primary tumoral size and regional lymph node metastasis. These results suggested that LCP1 is a useful biomarker for determining progression of OSCCs and that ENX might be a new therapeutic agent for treating OSCCs by controlling LCP1 expression.
The plastin family, which is comprised of actin-binding proteins, is conserved evolutionary and expressed in such as yeast, plant, and animal cells1. Three isoforms of plastin (T-, I-, and L-types) have been identified in mammals. Among them, L-plastin, lymphocyte cytosolic protein 1 (LCP1), is expressed in hematopoietic cellular lineages and many types of cancers1. While many kinds of the actin-binding proteins modulate dynamics of the actin cytoskeleton, recent studies have concerned LCP1 in regulation of actin dynamics2. Activated LCP1 induced high cellular adhesion and increased actin binding and actin assembly2.
LCP1 is found in many kinds of tumoral cells of non-hematopoietic origin, such as in the colon, prostate, and breast. LCP1 expression is correlated positively with advanced tumoral stages and severity in colon and breast cancers and is assumed a potential prognostic indicator3,4. LCP1 is overexpressed and play an important role in tumor cell functions in colon cancer, furthermore, LCP1 gene serve as gender- and/or stage-specific molecular predictors of tumor recurrence as well as potential therapeutic targets5. Similar to those cancers, LCP1 is participated in tumoral invasion and metastasis in prostate cancer cells, and its knockdown experiment is potentially a useful approach for treating tumors1,6. In prostatic epithelial cells, the expression of LCP1 is associated with the malignant status and is regulated by steroid hormone receptors7. Moreover, an oral broad-spectrum fluoroquinolone, enoxacin (ENX), controlled expression of LCP1 and led to similar phenotypes of LCP1 knockdown cells in prostate cancer8. In addition, cellular invasiveness of malignant melanoma cells requires not only LCP1 expression status but also the phosphorylation levels of LCP19. However, the functional significance of LCP1 expression in oral squamous cell carcinomas (OSCCs) for tumoral cellular proliferation and metastasis remains uncertain.
In the present study, we sought to clarify the clinical relevance of LCP1 in OSCCs and valuate a new candidate for medical treatment of OSCCs by drug repositioning of an antibiotic agent, enoxacin.
Results
Up-Regulation of LCP1 in OSCC Cell Lines
To evaluate the status of LCP1 expression as a cancer-related gene, we conducted real-time quantitative reverse transcription polymerase chain reaction (qRT-PCR) and immunoblot analyses with nine OSCC-derived cell lines and human normal oral keratinocytes (HNOKs). LCP1 mRNA expression was significantly up-regulated in all OSCC-derived cell lines compared with the HNOKs (Fig. 1A, P < 0.05). Figure 1B gives representative results of immunoblot analysis. The LCP1 protein also increased in all OSCC cell lines compared with the counterpart.
Figure 1. LCP1 expression in OSCC-derived cell lines and in primary OSCCs.

(A) Quantification of LCP1 mRNA expression in OSCC-derived cell lines by qRT-PCR analysis. (B) Representative immunoblot analysis of LCP1 protein expression. Densitometric LCP1 protein data are normalized to GAPDH protein levels. The values are expressed as a percentage of the HNOKs. (C) The LCP1 IHC scores of normal oral tissues and OSCCs. (D) Representative IHC results for LCP1 protein in normal tissue, primary OSCCs, and metastatic regional lymph nodes. Original magnification, x 400. Scale bars, 50 μm.
Evaluation of LCP1 Status in Primary OSCCs
We evaluated the LCP1 expression in primary OSCCs by immunohistochemistry (IHC) and the IHC scoring system10. The IHC scores of LCP1 in oral normal tissues and primary OSCCs ranged from 2.7 to 118.2 (median, 18.2) and 14.9 to 200.7 (median, 112.9). These IHC scores in primary OSCCs were significantly greater than in normal oral tissues (Fig. 1C, P < 0.05). Representative IHC figures for LCP1 protein in normal tissues, primary OSCCs, and metastatic lymph node were shown in Fig. 1D. Intense LCP1 immunoreactivity was observed in primary OSCCs and metastatic lymph nodes, whereas the normal oral tissues showed almost negative immunostaining.
Establishment of LCP1 Knockdown Cells
Because overexpression of LCP1 was frequently seen in OSCC in vitro and in vivo (Fig. 1), we transfected LCP1 shRNA or shMock vectors into OSCC cells (Ca9-22, Ho-1-N-1). To investigate the efficiency of the transfection, we conducted qRT-PCR and immunoblot analyses. The LCP1 mRNA expression levels in the shLCP1 cells was lower than in the shMock cells (Fig. 2A, P < 0.05). Similarly, the LCP1 protein level in the shLCP1 cells decreased compared with the counterparts (Fig. 2B). To clarify the effect of LCP1 knockdown on localization of F-actin, we performed immunofluorescence (IF), which showed that LCP1 and F-actin were co-localized in the cytosol near the plasma membrane in shMock cells, whereas LCP1 and F-actin were expressed throughout the cytosol in shLCP1 cells (Fig. 2C). Additionally, in our clinical samples, the cancer cells at the invasive front revealed strong immunoreaction for both LCP-1 and F-actin. This suggest that these molecules may collaborate for the tumor invasion. These results have indicated in the Supplemental Fig. S1.
Figure 2. Establishment of LCP1 knockdown cells.

(A) Expression of LCP1 mRNA in shMock and shLCP1 cells (Ca9-22 and Ho-1-N-1-derived transfectants). (B) Immunoblot analysis of the LCP1 protein levels in shLCP1 cells and shMock cells. (C) Immunofluorescence of LCP1 and F-actin in shLCP1 cells and ahMock cells.
Functional Assays
A proliferation assay was performed to evaluate the effect of LCP1 knockdown on cell growth showed that the cell growth of shLCP1 cells was significantly inhibited compared with shMock cells after 120 h (Fig. 3A, P < 0.05; Student’s t-test). We also performed invasion and migration assays to evaluate the effect of LCP1 knockdown on cell invasiveness and migratory abilities. The number of invading shLCP1 cells significantly decreased compared with shMock cells after 48 h (Fig. 3B, P < 0.05; Student’s t-test), and the wound size significantly decreased in shMock cells after 12 h, whereas in the shLCP1 cells (Fig. 3C, P < 0.05; Student’s t-test).
Figure 3. Functional assays of LCP1 knockdown cells.
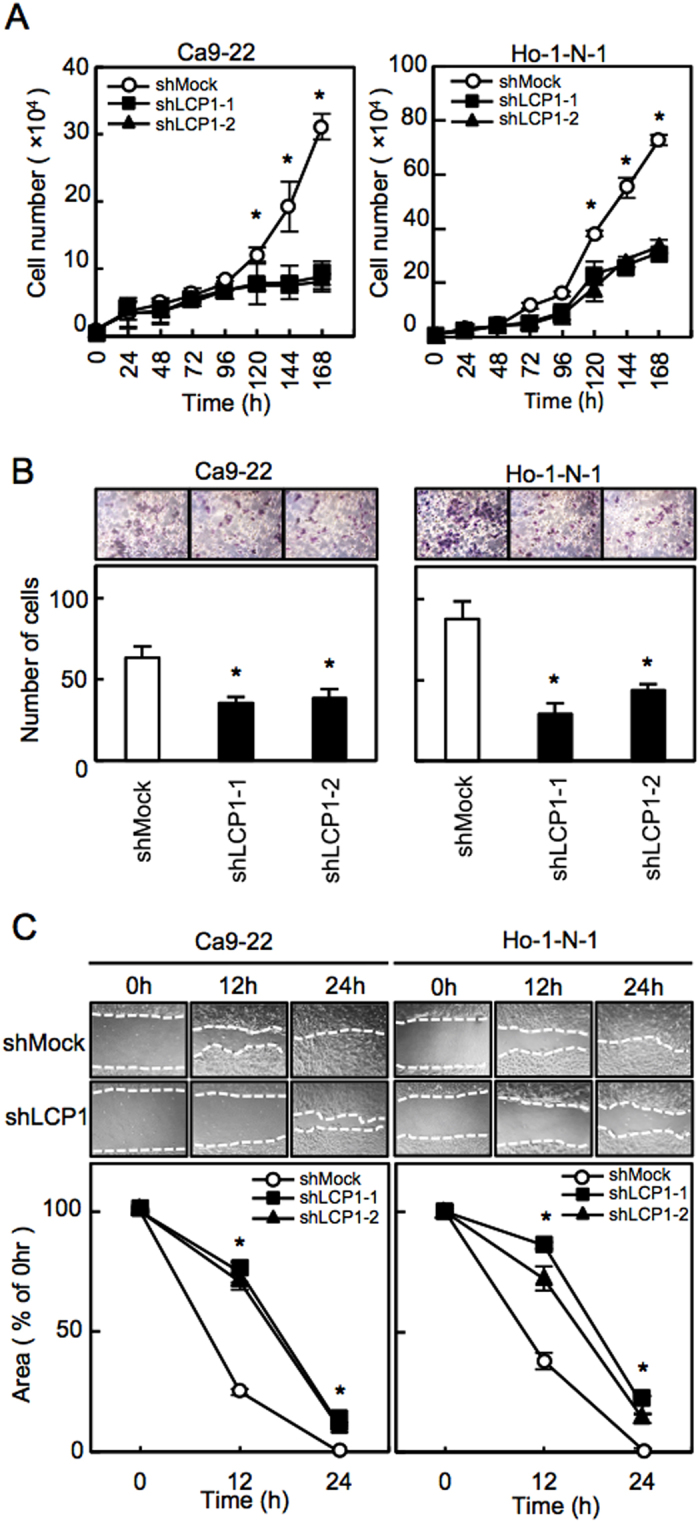
(A) Proliferation assays of shMock cells and shLCP1 cells. The results are expressed as the mean ± standard error of the mean of the values from three assays. (B) Invasion assay of shMock cells and shLCP1 cells. The mean value is calculated from data obtained from three separate chambers. (C) Migration assay of shMock cells and shLCP1 cells. The mean value is calculated from data obtained from three separate chambers.
Enoxacin Treatment
To investigate the efficiency of enoxacin (ENX), we assessed LCP1 expression and functional activities after treatment with ENX. Immunoblot analysis showed that LCP1 protein levels in the ENX-treated cells decreased obviously compared with the control cells (optimal concentration, 125 μM) (Fig. 4A). The cell growth of the ENX-treated cells was significantly inhibited compared with the control (Fig. 4B, P < 0.05, Student’s t-test). The number of ENX-treated cells invading the pores decreased significantly compared with the control (Fig. 4C, P < 0.05; Student’s t-test). In addition, the ENX-treated cells showed a wide gap after the 24 h treatment (Fig. 4D). These results indicated that ENX might regulate critical functions associated with tumoral growth and metastasis through down-regulation of LCP1.
Figure 4. ENX treatment.

(A) Immunoblot analysis of LCP1 protein levels in the ENX-treated cells. (B) Proliferation assay of the control and the ENX-treated cells. (C) Invasion assay of the control and the ENX-treated cells. (D) Migration assay of the control cells and the ENX-treated cells.
Correlation between LCP1 Expression and Clinical Classification in OSCCs
The correlations between the clinicopathologic features of OSCC cases and their LCP1 protein levels using the IHC scoring system were shown in Table 1. To determine the optimal cutoff value of the IHC scores, we performed receiver operating characteristic (ROC) curve analysis, which showed that the optimal cutoff value was 71.350 (area under the curve, 0.97; 95% confidence interval, 0.952–0.988). Among the clinical classifications, the LCP1 expression level showed a significant stratification in primary tumoral size (P = 0.016) and regional lymph node metastasis (P = 0.043).
Table 1. Correlation between LCP1 expression and clinical classification in OSCCs.
| Clinical classification | Total | Immunostaining results No. patients |
P value | |
|---|---|---|---|---|
| LCP1-negative | LCP1-positive | |||
| Age at surgery (years) | ||||
| <60 | 31 | 5 | 26 | 0.451* |
| ≧60 | 90 | 12 | 78 | |
| Gender | ||||
| Male | 73 | 11 | 62 | 0.454† |
| Female | 48 | 6 | 42 | |
| T-primary tumor | ||||
| T1 + T2 | 46 | 11 | 35 | 0.016†,‡ |
| T3 + T4 | 75 | 6 | 69 | |
| N-regional lymph node | ||||
| Negative | 66 | 13 | 53 | 0.043†,‡ |
| Positive | 55 | 4 | 51 | |
| Vascular invasion | ||||
| Negative | 83 | 12 | 71 | 0.849† |
| Positive | 38 | 5 | 33 | |
| Stage | ||||
| I + II | 34 | 8 | 28 | 0.060† |
| III + IV | 87 | 9 | 78 | |
| Histopathologic type | ||||
| Well | 80 | 14 | 66 | 0.126§ |
| Moderately | 33 | 2 | 31 | |
| Poorly | 8 | 1 | 7 | |
| Tumoral site | ||||
| Tongue | 63 | 9 | 54 | 0.546§ |
| Gingiva | 36 | 7 | 29 | |
| Buccal mucosa | 13 | 0 | 13 | |
| Oral floor | 7 | 1 | 6 | |
| Lip | 2 | 0 | 2 | |
*χ2 test.
†Fisher’s exact test.
‡P < 0.05.
§Mann-Whitney U-test.
Discussion
We found that LCP1 was overexpressed in OSCC in vitro and in vivo; LCP1 knockdown cells decreased cell growth, invasiveness, and migratory activities; and LCP1 expression in clinical samples was associated positively with tumoral size and regional lymph node metastasis in OSCCs. Interestingly, we focused that an oral broad-spectrum fluoroquinolone, ENX, controlled LCP1 expression, leading to similar phenotypes of LCP1 knockdown cells.
Consistent with previous studies, the current study has shown the clinical relevance of LCP1 up-regulation, which is related closely to tumoral progression in various human cancers1,3,4,5,6,7,8. Normally, LCP1 expressed in leukocytes that responses to inflammatory and infections, therefore, LCP1 may be expressed in freely movable cells such as leukocytes and malignant cells1. In bladder cancer, tissue microarray analysis indicated that LCP1 expression was significantly correlated with tumor grade11. In addition to a previous study of prostate cancer progression6, our LCP1 knockdown models using OSCC cells is potentially useful to interfere with OSCC progression (Fig. 3). To date, the mechanism for the correlation between LCP1 and human malignancies is still unclear. In this regards, invasiveness for malignant melanoma and chemo-resistance for breast cancer may require phosphorylation of LCP19,12. On the other hand, LCP-1 polymorphism (LCP1 rs494153) may be closely associated with its over-expression leading to predict colon cancer prognosis5. Thus, the mechanism for aberrant expression of LCP1 may differ from tumor to tumor, and more studies are needed to better understand the important role of LCP1 including its phosphorylation in tumoral progression.
Metastatic cancer cells use actin bundles to invade from the primary tumoral site through the surrounding tissue4. Immunofluorescence data showed that localization of F-actin, a binding partner of LCP1, was rearranged in shLCP1 cells (Fig. 2), which had low activity for cellular growth and tumoral invasion. Moreover, it is worthy to note that invasive carcinoma cells displayed strong immunoreaction for both LCP1 and F-actin (Supplementary Fig. S1). Therefore, our data suggested that the LCP1 together with F-actin, which may be formed LCP1-F-actin complex, has a role in proliferation and invasiveness of cancer cells.
ENX decreased cellular viability, induced apoptosis, caused cell cycle arrest, and inhibited the invasiveness in the prostate cancer cell lines8, making ENX an attractive candidate for use in cancer treatment as well as being an antibiotic. Comprehensive analysis using macrophages showed that LCP1 was down-regulated after treatment with ENX13, suggesting that ENX might regulate LCP1 expression. Our data indicated that ENX led to down-regulation of LCP1 and decreased cellular proliferation, invasiveness, and migratory activities. Further study is required to investigate if ENX is the upstream molecule of LCP1 in the cancer cells.
In conclusion, LCP1 can be a useful biomarker for determining the progression of OSCCs, and ENX might be a strong candidate as a new therapeutic agent against OSCCs by controlling LCP1 expression.
Methods
Ethics Statement
All experiments were performed in accordance with relevant guidelines and regulations. The ethics committee of Chiba University approved this study, protocol number, 236. We have obtained written informed consent from all subjects.
OSCC-Derived Cell Lines and Tissue Specimens
Nine OSCC-derived cell lines, including HSC-2 (RBRC-RCB1945, mouth), HSC-3 (JCRB-0623, tongue), HSC-4 (RBRC-RCB1902, tongue), Sa3 (RBRC-RCB0980, upper gingiva), Ca9-22 (RCB-1976, gingiva), KOSC-2 (JCRB-0126.1, mouth floor), SAS (RBRC-RCB 1974, tongue), Ho-1-N-1 (JCRB-0831, buccal mucosa), and Ho-1-u-1 (RBRC-RCB2102, mouth floor), were purchased from the JCRB cell bank (Ibaraki, Osaka, Japan) and the RIKEN BioResource Center (Tsukuba, Ibaraki, Japan). We used, as described previously, primary cultured HNOKs as a normal control cells and tissue specimens14,15,16,17.
mRNA Expression Analysis
We performed qRT-PCR as described previously18,19,20,21,22,23. Briefly, the primer sequences were: LCP1, forward, 5′-AAC CCT CGA GTC AAT CAT TTG-3′; reverse, 5′-TTT GAT CTT TTC ATA GAG CTG GAA-3′; probe, #37.
Immunoblot Analysis
Immunoblot analysis was conducted as described previously15,16,24,25,26,27. The antibodies were affinity-purified mouse anti-LCP1 monoclonal antibody (sc-133219, Santa Cruz Biotechnology), rabbit anti-GAPDH monoclonal antibody (sc-25778, Santa Cruz Biotechnology), and mouse anti-F-actin monoclonal antibody (ab205, Abcam).
IHC
IHC and IHC scoring systems were performed as described previously10,21,22,26,27,28,29,30,31. Briefly, the mean percentages of positive tumoral cells were determined in at least three random fields in each section, and the intensity of the LCP1 immunoreaction was scored using IHC profiler as follows: 0+, negative; 1+, low positive; 2+, positive; 3+, high positive. Moreover, we quantified the intensity of the LCP1 immunoreaction with IHC profiler, (https://souceforge.net/projects/ihcprofiler/)32. In order to determine the optimal cutoff point of LCP1 IHC scores, we evaluated the IHC scores from 121 samples with OSCC by constructing the ROC curve analysis for AUC calculation using LCP-1 expression in distinguishing oral cancer specimens from normal tissues. Cases with a score over the optimal cutoff point were defined as LCP1-positive21,22,33,34,35.
Transfection with shRNA Plasmid
Transfection with shRNA Plasmid were conducted as described previously16,21,22. LCP1 shRNA (shLCP1) and control shRNA (shMock) vectors (sc-43209-SH, sc-108060, Santa Cruz Biotechnology) were transfected into Ca9-22 and Ho-1-N-1. After transfection, the cells were isolated and cultured as previously described16,21,22. To appraise the efficiency of LCP1 knockdown, we carried out qRT-PCR and immunoblotting.
ENX Treatment
ENX, a fluoroquinolone, has been used extensively and with minimal side effects in humans to treat urinary tract infections and gonorrhea36. Several investigators reported that ENX down-regulated LCP1, resulting in decreased formation of actin rings. Therefore, we challenged the cells with ENX for functional analyses, such as cellular proliferation, invasiveness, and migration assays. Since Sousa et al. reported the half-maximal effective concentrations (105 and 141 μM) of ENX for two prostate cancer cell lines8, we performed immunoblotting using ENX (Tokyo Chemical) ranged from concentrations of 1 to 150 μM to determine the optimal concentration for further functional analyses.
Functional Assay
Proliferation assay, invasion assay and migration assay was performed as described previously14,17,21,22,37,38,39,40.
Immunofluorescence Analysis
IF was performed with a F-Actin Visualization Biochem Kit (Cytoskeleton) according to the manufacturer’s instructions and our protocol previously reported22,40,41. IF was observed using confocal microscopy and analyzed with the FluoView Software (Olympus Optical)22,40,41.
Statistical Analysis
The statistical significance for LCP1 mRNA expression was calculated by the Student’s t-test. The correlations between the LCP1 IHC scores and each clinicopathological parameters were analyzed statistically by the χ2 test, Fisher’s exact test, and Mann-Whitney U-test. The significance level for two-sided P values was 0.05 for all tests. All data are expressed as the mean ± standard error of the mean of triplicate results.
Additional Information
How to cite this article: Koide, N. et al. Evidence for Critical Role of Lymphocyte Cytosolic Protein 1 in Oral Cancer. Sci. Rep. 7, 43379; doi: 10.1038/srep43379 (2017).
Publisher's note: Springer Nature remains neutral with regard to jurisdictional claims in published maps and institutional affiliations.
Supplementary Material
Acknowledgments
We thank Ms. Lynda C. Charters for English language editing this manuscript.
Footnotes
The authors declare no competing financial interests.
Author Contributions N.K., A.K., K.U. contributed to conception, design, data acquisition, data analysis and interpretation, drafted the manuscript; Y.E., S.I., T.S., Y.K., I.M., S.Y., M.S. and H.T., contributed to conception, design, data acquisition and interpretation, drafted the manuscript. All authors gave final approval to and agreed to be accountable for all aspects of the work.
References
- Shinomiya H. Plastin family of actin-bundling proteins: Its functions in leukocytes, neurons, intestines, and cancer. Int. J. Cell Biol. 2012, 213492 (2012). [DOI] [PMC free article] [PubMed] [Google Scholar]
- Morley S. C. The actin-bundling protein L-plastin: A critical regulator of immune cell function. Int. J. Cell Biol. 2012, 935173 (2012). [DOI] [PMC free article] [PubMed] [Google Scholar]
- Foran E., McWilliam P., Kelleher D., Croke D. T. & Long A. The leukocyte protein L-plastin induces proliferation, invasion and loss of E-cadherin expression in colon cancer cells. Int. J. Cancer 118, 2098–2104 (2006). [DOI] [PubMed] [Google Scholar]
- Stevenson R. P., Veltman D. & Machesky L. M. Actin-bundling proteins in cancer progression at a glance. J. Cell Sci. 125, 1073–1079 (2012). [DOI] [PubMed] [Google Scholar]
- Ning Y. et al. Plastin Polymorphisms Predict Gender- and Stage-Specific Colon Cancer Recurrence after Adjuvant Chemotherapy. Mol. Cancer. Ther. 13 (2014). [DOI] [PMC free article] [PubMed] [Google Scholar]
- Zheng J., Rudra-Ganguly N., Powell W. C. & Roy-Burman P. Suppression of prostate carcinoma cell invasion by expression of antisense L-plastin gene. Am. J. Pathol. 155, 115–22 (1999). [DOI] [PMC free article] [PubMed] [Google Scholar]
- Zheng J. et al. Steroid hormone induction and expression patterns of L-plastin in normal and carcinomatous prostate tissues. Am J Pathol. 150, 2009–1028 (1997). [PMC free article] [PubMed] [Google Scholar]
- Sousa E. J. et al. Enoxacin inhibits growth of prostate cancer cells and effectively restores microRNA processing. Epigenetics. 8, 548–558 (2013). [DOI] [PMC free article] [PubMed] [Google Scholar]
- Klemke M. et al. Phosphorylation of ectopically expressed L-plastin enhances invasiveness of human melanoma cells. Int. J. Cancer. 120, 2590–2599 (2007). [DOI] [PubMed] [Google Scholar]
- Uzawa K. et al. High Prevalence of Decreased Expression of KAI1 Metastasis Suppressor in Human Oral Carcinogenesis. Clin. Cancer. Res. 8, 828–835 (2002). [PubMed] [Google Scholar]
- Fang Z. Q. et al. Gene expression profile and enrichment pathways in different stages of bladder cancer. Gen. Mol. Res. 12, 1479–1489 (2013). [DOI] [PubMed] [Google Scholar]
- Janji B. et al. The actin filament cross-linker L-plastin confers resistance to TNF-α in MCF-7 breast cancer cells in a phosphorylation-dependant manner. J. Cell. Mol. Med. 14, 1264–1275 (2010). [DOI] [PMC free article] [PubMed] [Google Scholar]
- Dubovsky J. A. et al. Lymphocyte cytosolic protein 1 is a chronic lymphocytic leukemia membrane-associated antigen critical to niche homing. Blood. 122 (2013). [DOI] [PMC free article] [PubMed] [Google Scholar]
- Shimizu T. et al. Annexin A10 in Human Oral Cancer: Biomarker for Tumoral Growth via G1/S Transition by Targeting MAPK Signaling Pathways. PLoS One 7, e45510 (2012). [DOI] [PMC free article] [PubMed] [Google Scholar]
- Koyama T. et al. ANGPTL3 is a novel biomarker as it activates ERK/MAPK pathway in oral cancer. Cancer Med. 4, 759–769 (2015). [DOI] [PMC free article] [PubMed] [Google Scholar]
- Miyamoto I. et al. Kinesin family member 14 in human oral cancer: A potential biomarker for tumoral growth. Biochem. Biophys. Reports. 3, 26–31 (2015). [DOI] [PMC free article] [PubMed] [Google Scholar]
- Kitajima D. et al. Tie2 Regulates Tumor Metastasis of Oral Squamous Cell Carcinomas. J. Cancer. 7, 600–7 (2016). [DOI] [PMC free article] [PubMed] [Google Scholar]
- Yamano Y. et al. Hyaluronan-mediated motility: A target in oral squamous cell carcinoma. Int. J. Oncol. 32, 1001–1009 (2008). [PubMed] [Google Scholar]
- Koike K. et al. High prevalence of epigenetic inactivation of the human four and a half LIM domains 1 gene in human oral cancer. Int. J. Oncol. 42, 141–150 (2013). [DOI] [PubMed] [Google Scholar]
- Shimizu F. et al. Overexpression of LIM and SH3 protein 1 leading to accelerated G2/M phase transition contributes to enhanced tumourigenesis in oral cancer. PLoS One 8, e83187 (2013). [DOI] [PMC free article] [PubMed] [Google Scholar]
- Saito T. et al. Semaphorin7A promotion of tumoral growth and metastasis in human oral cancer by regulation of g1 cell cycle and matrix metalloproteases: Possible contribution to tumoral angiogenesis. PLoS One. 10, e0137923 (2015). [DOI] [PMC free article] [PubMed] [Google Scholar]
- Kimura Y. et al. ARNT2 Regulates Tumoral Growth in Oral Squamous Cell Carcinoma. J. Cancer. 7, 702–710 (2016). [DOI] [PMC free article] [PubMed] [Google Scholar]
- Uzawa K. et al. Long-term culture of human odontoma-derived cells with a Rho kinase inhibitor. Exp. Cell Res. 347, 232–240 (2016). [DOI] [PubMed] [Google Scholar]
- Endo Y. et al. Sarcoendoplasmic reticulum Ca(2+) ATPase type 2 downregulated in human oral squamous cell carcinoma. Int. J. Cancer 231, 225–231 (2004). [DOI] [PubMed] [Google Scholar]
- Kasamatsu A. et al. Galectin-9 as a regulator of cellular adhesion in human oral squamous cell carcinoma cell lines. Int. J. Mol. Med. 16, 269–273 (2005). [PubMed] [Google Scholar]
- Iyoda M. et al. Epithelial cell transforming sequence 2 in human oral cancer. PLoS One 5, e14082 (2010). [DOI] [PMC free article] [PubMed] [Google Scholar]
- Baba T. et al. Persephin: A potential key component in human oral cancer progression through the RET receptor tyrosine kinase-mitogen-activated protein kinase signaling pathway. Mol. Carcinog. 617, 1–8 (2013). [DOI] [PubMed] [Google Scholar]
- Shimada K. et al. Aberrant expression of RAB1A in human tongue cancer. Br. J. Cancer 92, 1915–21 (2005). [DOI] [PMC free article] [PubMed] [Google Scholar]
- Kouzu Y. et al. Overexpression of stathmin in oral squamous-cell carcinoma: correlation with tumour progression and poor prognosis. Br. J. Cancer. 94, 717–23 (2006). [DOI] [PMC free article] [PubMed] [Google Scholar]
- Yamatoji M. et al. Dermatopontin: A potential predictor for metastasis of human oral cancer. Int. J. Cancer. 130, 2903–2911 (2012). [DOI] [PubMed] [Google Scholar]
- Usukura K. et al. Tripeptidyl peptidase II in human oral squamous cell carcinoma. J. Cancer Res. Clin. Oncol. 139, 123–130 (2013). [DOI] [PubMed] [Google Scholar]
- Varghese F., Bukhari A. B., Malhotra R. & De A. IHC profiler: An open source plugin for the quantitative evaluation and automated scoring of immunohistochemistry images of human tissue samples. PLoS One. 9, e96801 (2014). [DOI] [PMC free article] [PubMed] [Google Scholar]
- Kanda Y. Investigation of the freely available easy-to-use software ‘EZR’ for medical statistics. Bone Marrow Transplant. 48, 452–458 (2013). [DOI] [PMC free article] [PubMed] [Google Scholar]
- Kasamatsu A. et al. Decorin in human oral cancer: A promising predictive biomarker of S-1 neoadjuvant chemosensitivity. Biochem. Biophys. Res. Commun. 457, 71–76 (2015). [DOI] [PubMed] [Google Scholar]
- Suzuki T. et al. Overexpression of TMOD1 is associated with enhanced regional lymph node metastasis in human oral cancer. Int J Oncol. 48, 607–12 (2016). [DOI] [PubMed] [Google Scholar]
- Toro E. J. et al. Enoxacin directly inhibits osteoclastogenesis without inducing apoptosis. J. Biol. Chem. 287, 17894–17904 (2012). [DOI] [PMC free article] [PubMed] [Google Scholar]
- Saito Y. et al. ALY as a potential contributor to metastasis in human oral squamous cell carcinoma. J. Cancer Res. Clin. Oncol. 139, 585–594 (2013). [DOI] [PubMed] [Google Scholar]
- Uzawa K. et al. Suppression of metastasis by mirtazapine via restoration of the Lin-7C/β-catenin pathway in human cancer cells. Sci. Rep. 4, 5433 (2014). [DOI] [PMC free article] [PubMed] [Google Scholar]
- Kasama H. et al. Adenosine A2b receptor promotes progression of human oral cancer. BMC Cancer. 15, 563 (2015). [DOI] [PMC free article] [PubMed] [Google Scholar]
- Unozawa M. et al. Cavin-2 in oral cancer: A potential predictor for tumor progression. Mol. Carcinog. 1047, 1037–1047 (2015). [DOI] [PubMed] [Google Scholar]
- Minakawa Y. et al. Kinesin family member 4A: A potential predictor for progression of human oral cancer. PLoS One 8, e85951 (2013). [DOI] [PMC free article] [PubMed] [Google Scholar]
Associated Data
This section collects any data citations, data availability statements, or supplementary materials included in this article.