Summary
The maternal-to-zygotic transition (MZT) is one of the most profound and orchestrated processes during the early life of embryos, yet factors that shape the temporal pattern of vertebrate MZT are largely unknown. Here we show that over one-third of zebrafish maternal messenger RNAs (mRNAs) can be N6-methyladenosine (m6A) modified, and the clearance of these maternal mRNAs is facilitated by an m6A-binding protein, Ythdf2. Removal of Ythdf2 in zebrafish embryos decelerates the decay of m6A-modified maternal mRNAs and impedes zygotic genome activation. These embryos fail to initiate timely MZT, undergo cell cycle pause, and remain developmentally delayed throughout larval life. Our study reveals m6A-dependent RNA decay as a previously unidentified maternally driven mechanism that regulates maternal mRNA clearance during zebrafish MZT, highlighting the critical role of m6A mRNA methylation in transcriptome switching and animal development.
During the early stages of embryogenesis, maternally inherited RNAs govern gene expression before relinquishing control to the zygotic genome. This changeover, termed maternal-to-zygotic transition (MZT), exists in all animal species1,2. During MZT, the massive maternal RNA population is rapidly cleared in two modes: by maternally supplied factors and by newly synthesized zygotic gene products3. In zebrafish, zygotically expressed miR-430 regulates the clearance of a few hundred maternal mRNAs4. Codon usage has recently been shown to correlate with maternal RNA stability5. Yet factors and pathways in charge of the majority of maternal RNA decay remain elusive6–8. Here we present post-transcriptional RNA methylation as a new maternal mode that plays a critical role in the clearance of methylated maternal mRNA.
N6-methyladenosine (m6A), the most abundant internal modification in eukaryotic mRNA9 and the first confirmed reversible RNA modification with dedicated writers and erasers10–12, can be recognized by the m6A reader protein YTHDF2 to mediate degradation of methylated RNAs13. m6A has been shown to impact the transcript stability of murine pluripotency regulators, thus facilitating a transition between naïve pluripotency and differentiation in mouse embryonic stem cells14–16. We suspected that the m6A-dependent RNA decay acts as a general mechanism to initiate and facilitate the switching of cell states: clearing the gene products that govern the old cell state in order to enter the new one.
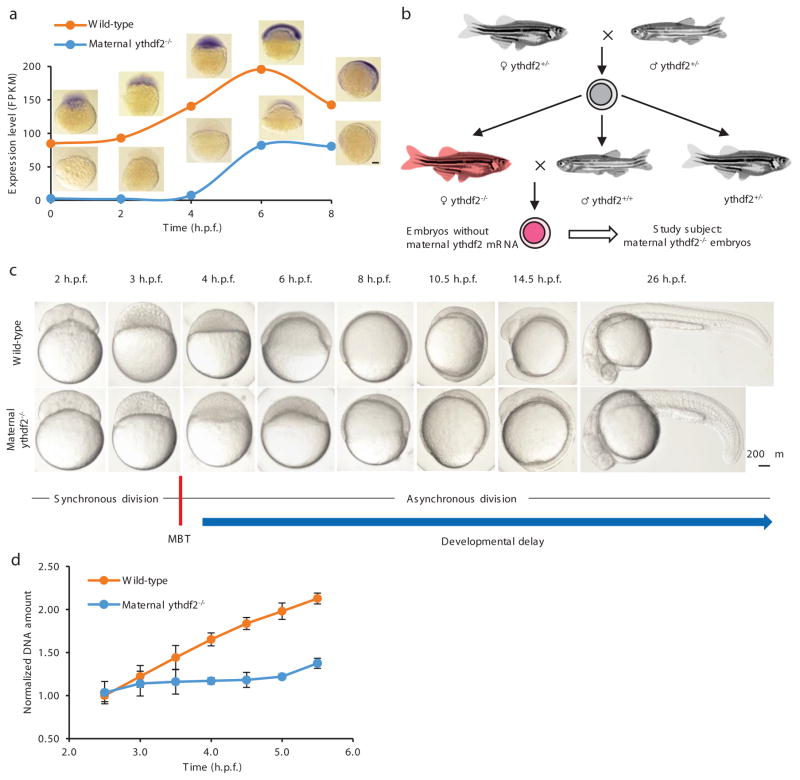
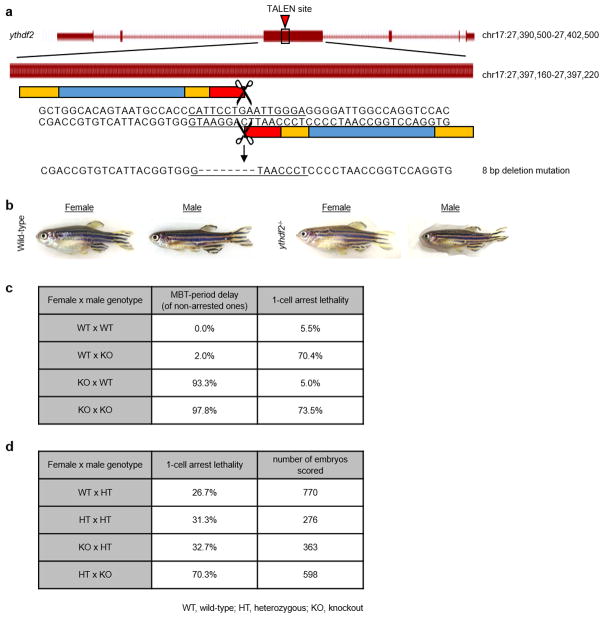
Zebrafish ythdf2 is expressed ubiquitously throughout early embryogenesis (Fig. 1a). We investigated the role of m6A-dependent mRNA decay in embryogenesis by examining ythdf2 loss-of-function (LOF) at early stages of zebrafish (Extended Data Fig. 1a). Mating heterozygous mutants (ythdf2+/−), we obtained the first generation of ythdf2 homozygous mutant fish (ythdf2−/ −_F1) harboring no apparent disabilities as adults (Extended Data Fig. 1b). Crossing ythdf2 homozygotes together, we found that on average ~70% of their progeny never developed past the 1-cell stage. This lethality is likely mediated by defective sperm from ythdf2−/ − males (Extended Data Fig. 1c, d, and Supplementary Discussion). To isolate the maternal function of Ythdf2, we crossed female ythdf2−/−_F1 fish to male wild-type fish to produce maternal ythdf2−/− embryos (Fig. 1b, red embryos) with the loss of ythdf2 mRNA (Fig. 1a).
Figure 1. The deficiency of m6A-binding protein Ythdf2 in zebrafish embryo led to a developmental delay.
a, Expression profile of ythdf2 mRNA in wild-type and maternal ythdf2−/− embryos from crossing ythdf2−/− female and wild-type male fish. mRNA-seq and in situ hybridization revealed the mutation eliminated ythdf2 mRNA prior to 4 h.p.f. b, Crossing scheme to show the origin of maternal ythdf2−/− embryos used in this study. c, Time-matched bright field images of embryos showing that maternal ythdf2−/− embryos experience an early-stage delay maintained throughout early development. d, Quantification of DNA amounts in wild-type and mutant embryos pre- and post-MBT (2.5–5.5 h.p.f.). Error bars, mean ± s.e.m., n = 3 (biological replicates).
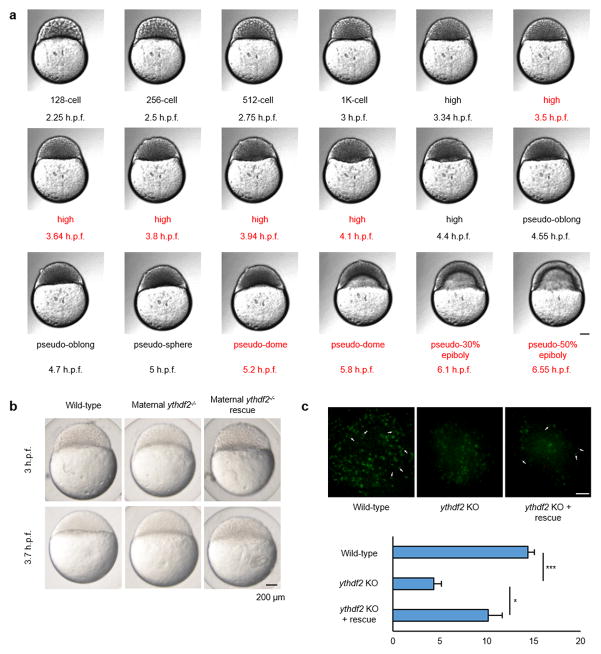
Comparing maternal ythdf2−/− embryos with wild-type, we observed that both genotypes completed cell cycle 10 (during which the mid-blastula transition (MBT) is initiated17) at 3 hours post fertilization (h.p.f.) to reach the 1 K stage and cell cycle 11 at 3.3 h.p.f. to reach the high stage (Fig. 1c and Extended Data Fig. 2a). However, whereas wild-type embryos complete cell cycle 12 within the next 20 minutes to reach the oblong stage at 3.7 h.p.f., maternal ythdf2−/− embryos arrest at the high stage for ~45 minutes before completing cell cycle 12 and continuing cell divisions (Extended Data Fig. 2a). Mutant embryos lose another ~30 minutes of developmental time in between their pseudo-sphere and pseudo-50% epiboly stages before eventually initiating gastrulation at ~7 h.p.f. (vs. wild-type embryos at ~5.5 h.p.f.) (Fig. 1c and Extended Data Fig. 2a). The pre-gastrulation developmental delay of maternal ythdf2−/− embryos is maintained at least throughout the first 30 hours of development, marked by delayed onset of involuntary tail movement, delayed cessation of somitogenesis, and delayed pigmentation (Fig. 1c). This delay can be partially rescued by the injection of ythdf2 mRNA, suggesting that these phenotypes are derived from deleting ythdf2 (Extended Data Fig. 2b).
Quantifying the total amount of DNA pre- and post-MBT in the wild-type and mutant embryos, we found both a delay in DNA accumulation and a decrease in the amount of total DNA in mutant embryos, indicating fewer cell divisions within the studied time frame (Fig. 1d). These ythdf2 mutants also lack the recognizable, condensed pH3-positive nuclei characteristic of metaphase and anaphase, though the overall number of pH3-positive as well as PCNA-positive (to mark interphase) cells is the same for each group. This defect can be partially rescued by the injection of ythdf2 mRNA (Extended Data Fig. 2c), suggesting a block in late G2 phase or early M phase of the cell cycle in ythdf2 mutants. These observations reveal that Ythdf2 is necessary for the normal progression of the cell cycle during MZT.
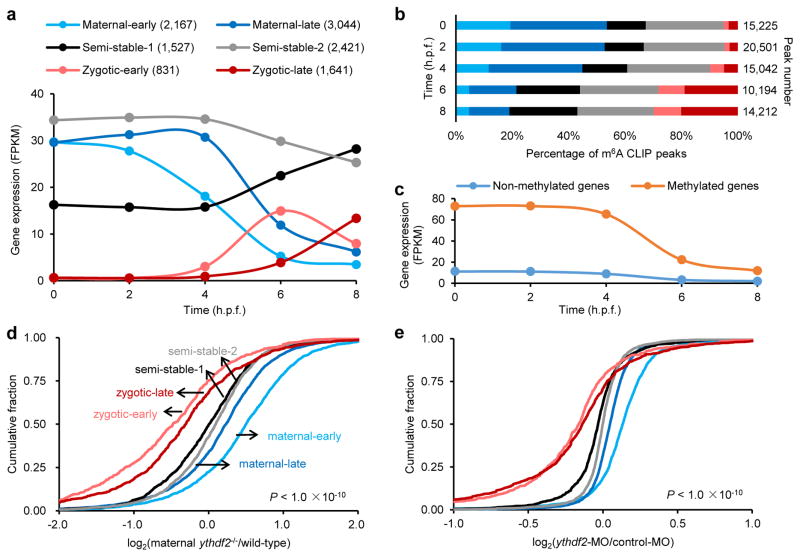
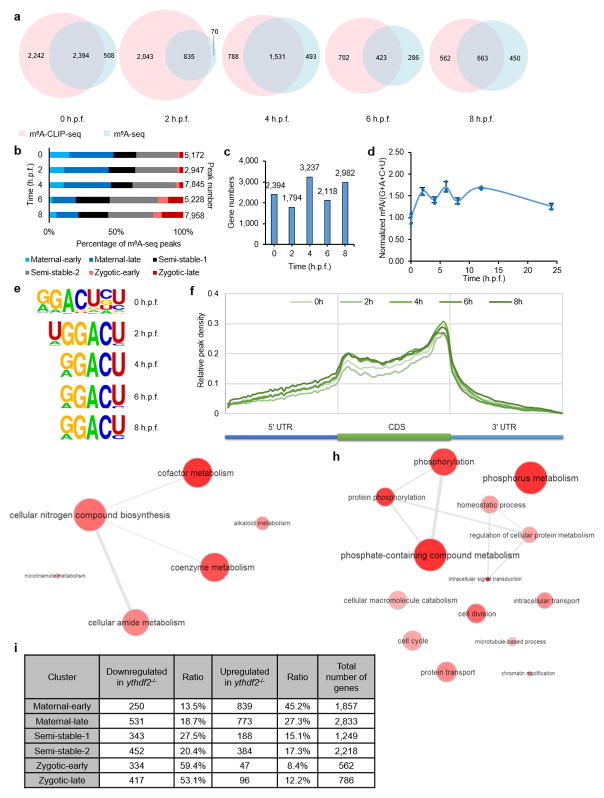
To probe molecular mechanism, we profiled early embryonic transcriptomes of zebrafish using mRNA-seq at five time points (0, 2, 4, 6, and 8 h.p.f.) and categorized transcripts into three superclusters (maternal, semi-stable, and zygotic), each containing two subclusters, based on their abundance changes over time (Fig. 2a and Supplementary Discussion). We then applied m6A-seq18 and a modified approach19,20 that identifies m6A sites at higher resolution (Extended Data Fig. 3a) to obtain m6A profiles of zebrafish embryonic mRNAs (Fig. 2b and Extended Data Fig. 3b). More than 40% (4,600 out of 11,631) gene transcripts were detected to contain m6A peaks during the studied time period (Supplementary Discussion). Notably, more than 36% of maternal genes were m6A methylated. Just as mRNA abundance shifted from maternally-derived to zygotically-derived at 4 h.p.f. (Fig. 2a), so did the distribution of the m6A modification shift from maternal RNAs to zygotic RNAs after 4 h.p.f. (Fig. 2b and Extended Data Fig. 3b), with the overall number of m6A-modified transcripts maintained at high levels during MZT (Extended Data Fig. 3c), while the total mRNA m6A level fluctuates (Extended Data Fig. 3d). The measured m6A sites showed an RRACU (R=G/A) consensus motif (Extended Data Fig. 3e) and were enriched near the start and stop codons (Extended Data Fig. 3f), resembling similar features previously reported in other organisms18,21,22.
Figure 2. Maternal RNAs are m6A-modified and their clearance is hindered by ythdf2 loss-of-function (LOF).
a, Expression profiles of six gene groups clustered by their RNA abundance over time (0 – 8 h.p.f.) determined by RNA sequencing: maternal-early (degradation starting at 2 h.p.f), maternal-late (decrease after 4 h.p.f.), zygotic-early (onset at 4 h.p.f. and peak at 6 h.p.f.), zygotic-late (onset at 6 h.p.f.), and two semi-stable gene groups (relatively stable expression over time). b, Distribution of m6A-sites (number of m6A-CLIP-seq peaks) in the six gene groups over time (the same colour code as a). c, Expression profiles of m6A-modified and non-modified maternal transcripts over time. d–e, Cumulative distribution of the log2 fold changes of RNA expression at 4 h.p.f. for the six gene groups between maternal ythdf2−/− and wild-type (d), or ythdf2 morpholino (MO) treated and control (e). Compared to the relatively unchanged curves of semi-stable gene groups (black and grey), the right shift of blue curves indicates the increase of maternal RNAs while the left shift of red curves indicates the decrease of zygotic RNAs in ythdf2 LOF samples versus control. P values were calculated using two-sided Kruskal-Wallis test. Representative data shown from two independent experiments.
We divided the maternal supercluster genes into methylated and non-methylated groups. Compared to non-methylated maternal transcripts, methylated ones are present at a higher abundance with more dramatic decay at 4 h.p.f. (Fig. 2c), and are enriched in phosphorus metabolism (e.g. nucleotide and ATP binding) and cell cycle regulation functions, whereas non-methylated ones featuring nitrogen metabolism (Extended Data Fig. 3g, h), suggesting distinctive kinetics and functional roles of methylated maternal transcripts.
We subsequently performed mRNA-seq on embryos spawned by either the wild-type or ythdf2−/− female fish at the same five time points. Differential analysis revealed that the most drastic change occurs around MBT. At 4 h.p.f., maternal transcripts were upregulated in embryos devoid of maternal ythdf2 compared to wild-type, accompanied by downregulation of zygotic transcripts (Fig. 2d and Extended Data Fig. 3i). We also employed a translation-blocking morpholino (MO) specific for zebrafish ythdf2 as an alternative approach to induce ythdf2 LOF (Extended Data Fig. 4). mRNA-seq results showed that, similar to the observation in maternal ythdf2−/− embryos, a less drastic yet significant change occurred at 4 h.p.f. with upregulated maternal transcripts and downregulated zygotic transcripts in ythdf2-MO treated embryos (Fig. 2e). These results indicate that Ythdf2 facilitates the clearance of maternal transcripts and that the failure to remove maternal transcripts hinders the activation of zygotic genes.
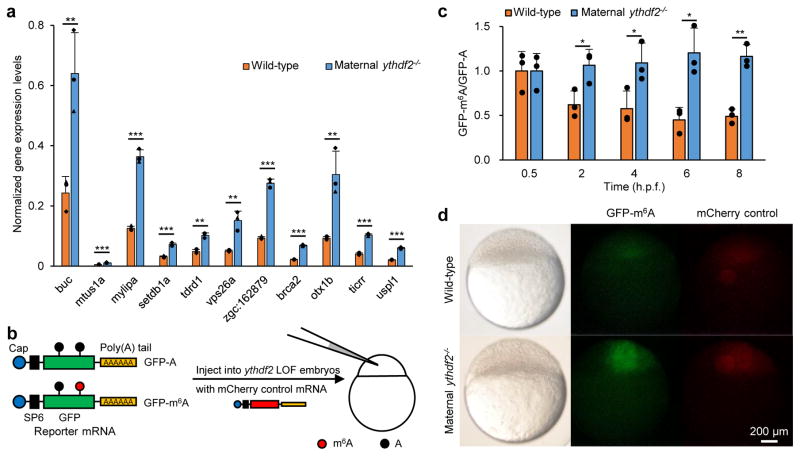
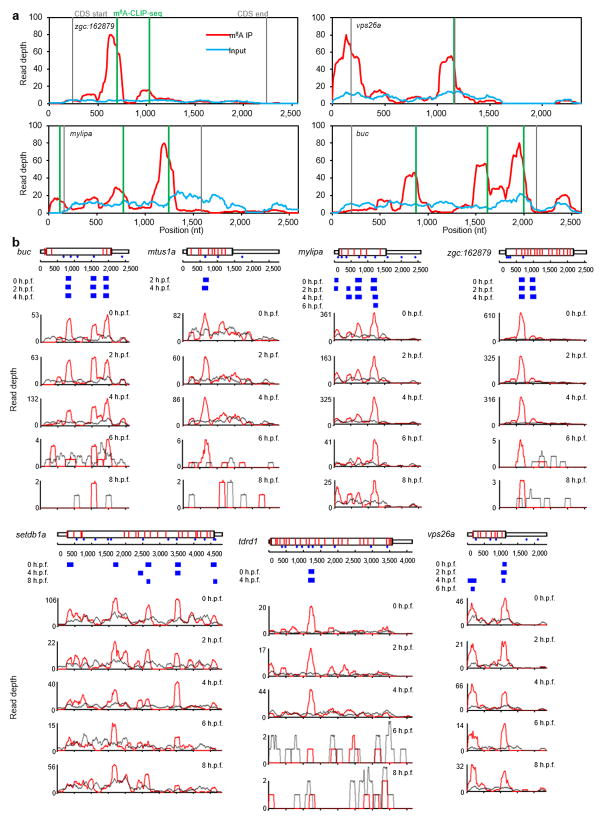
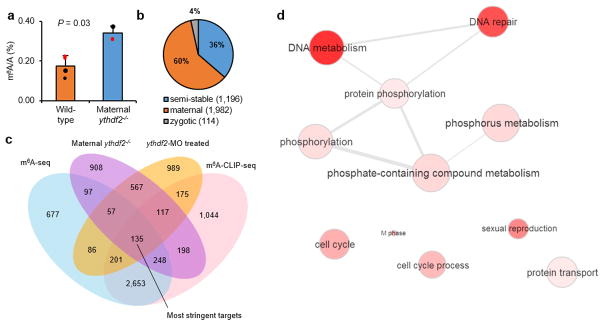
Ythdf2 appears to affect primarily methylated maternal mRNA at 4 h.p.f. (Supplementary Discussion) because the total mRNA m6A abundance increases by over 50% in ythdf2−/− embryos compared to wild-type (Extended Data Fig. 5a), and over 60% of upregulated, methylated transcripts are maternal genes at 4 h.p.f. (Extended Data Fig. 5b). We defined the most stringent Ythdf2 targets as the top 20% of upregulated genes differentially expressed in both maternal ythdf2−/− mutants and MO-treated samples and also present in both m6A-seq and m6A-CLIP-seq at 4 h.p.f. (Extended Data Fig. 5c). 135 genes met these stringent criteria and showed clustering of phosphorus metabolism, cell cycle process, and reproduction (Extended Data Fig. 5d). Among these genes, mtus1a, mylipa, setdb1a, vps26a, and zgc:162879 have been reported as regulators of cell cycle, while buc and tdrd1 are involved in gamete generation (Extended Data Fig. 6). Quantitative Real-Time PCR (RT-qPCR) of these gene transcripts showed major retention in mutant embryos compared to wild-type (Fig. 3a). Thus the retention of methylated maternal transcripts in the absence of functional Ythdf2 may lead to the observed defects during early zebrafish development.
Figure 3. Ythdf2 is required for m6A-dependent RNA decay.
a, RT-qPCR validation of the relative abundance of representative Ythdf2 targets increased at 4 h.p.f. in maternal ythdf2−/− samples compared with wild-type. b, Design of the reporter RNA. m6A-modified (GFP-m6A) or non-modified GFP mRNAs (GFP-A) were prepared and co-injected with mCherry control mRNA into one-cell stage embryos. c, The in vivo degradation of GFP-m6A mRNAs was faster in wild-type embryos but slightly slower in maternal ythdf2−/− ones than GFP-A mRNAs. mRNA abundance was determined by RT-qPCR and normalized to 0.5 h.p.f. values. d, Comparison of GFP-m6A expression levels in wild-type and maternal ythdf2−/− embryos at the oblong stage of development (stage-matched embryos, 3.8 h.p.f. for wild-type and 4.2 h.p.f. for mutants). The m6A-modified GFP reporter RNA produced consistently higher GFP protein levels in maternal ythdf2−/− embryos versus wild-type embryos. Quantification of the overall phenomena: 61/72 embryos (85%) for maternal ythdf2−/− and 59/85 (70%) for wild-type in two experiments. Error bars, s.d., n = 3 (technical replicates). P values were determined using two-sided Student’s t-test for two samples with equal variance.
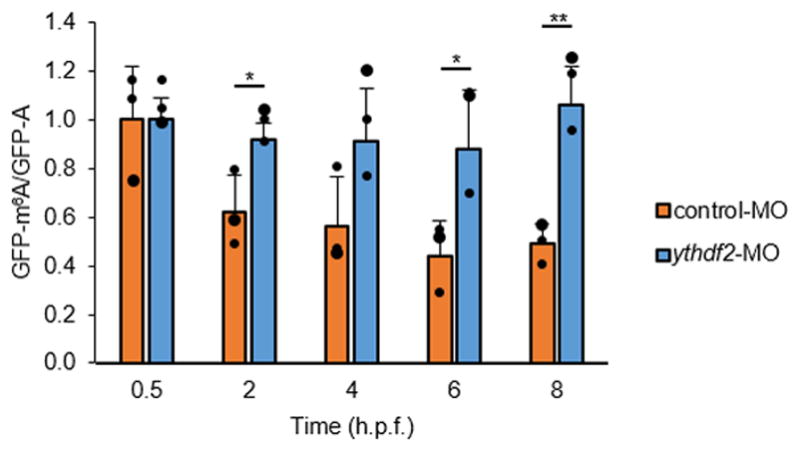
In order to determine whether m6A methylation is sufficient to trigger mRNA degradation in a Ythdf2-dependent manner, we produced GFP reporter mRNAs with or without m6A (Fig. 3b). These reporter mRNAs were injected into wild-type or maternal ythdf2−/− embryos and their decay kinetics were monitored by RT-qPCR. The results showed that degradation of the m6A-modified reporter mRNA is faster than that of the unmethylated control during MZT in wild-type embryos, whereas in maternal ythdf2−/− mutant embryos, the clearance of the methylated reporter mRNA is noticeably hampered during MZT when compared to the unmethylated control (Fig. 3c). Similar results were also observed in embryos co-injected with control or ythdf2-MO (Extended Data Fig. 7). Further, fluorescence microscopy showed that the m6A-modified GFP reporter produced consistently brighter fluorescence in maternal ythdf2−/− embryos compared to wild-type ones harvested during the oblong stage (cell cycle 13 for most cells; 4.2 h.p.f. for mutant embryos and 3.8 h.p.f. for wild-type embryos) (Fig. 3d). Maternally deposited ythdf2 is present in the embryo before any zygotic transcription has taken place (Fig. 1a), and loss-of-function maternal mutant alleles, but not paternal alleles, exhibit the observed cell cycle pause during MBT and delayed clearance of methylated maternal transcripts (Extended Data Fig. 1c). Together, these results further indicate that m6A methylation negatively impacts the stability of target mRNAs and subsequent protein synthesis in zebrafish early embryos and that Ythdf2 is a maternally-supplied factor to direct maternal mRNA clearance.
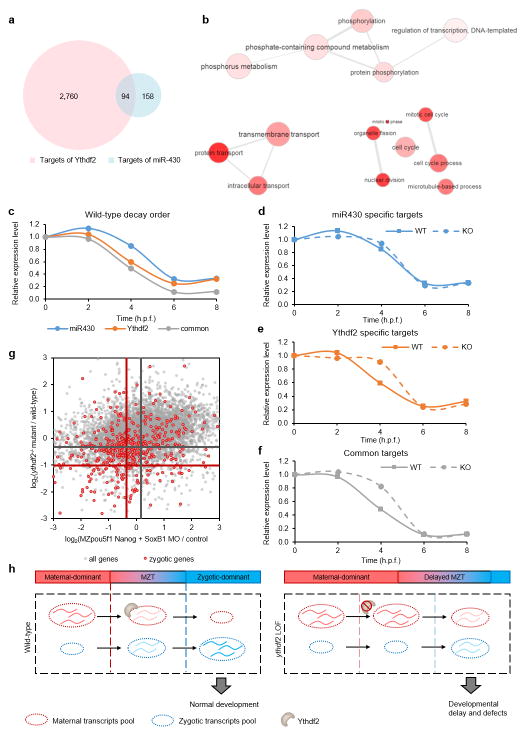
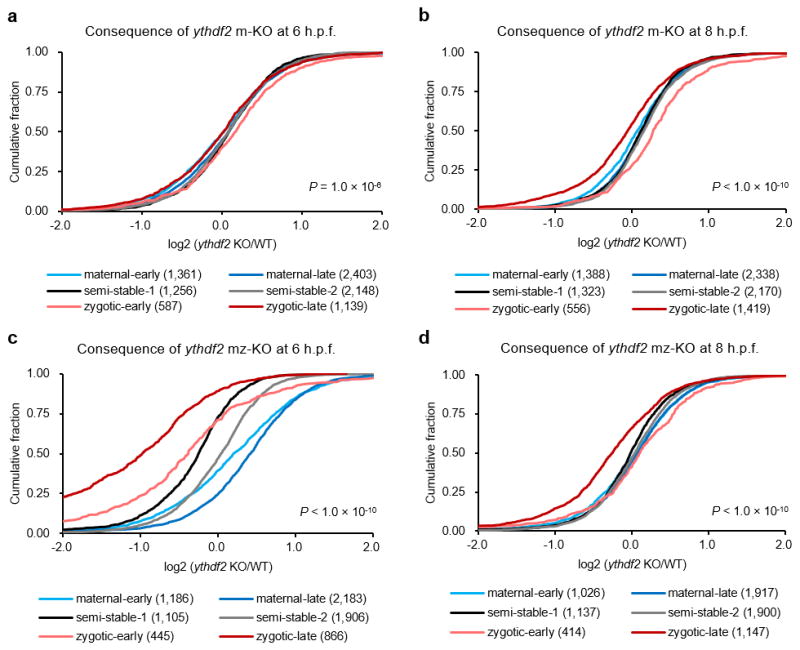
The surviving offspring of ythdf2−/− mating pairs (~30% of progeny on average) developed to adulthood devoid of both maternal and zygotic ythdf2 (mz-KO) (Extended Data Fig. 1c). Further experiments revealed that zygotic Ythdf2 could also participate in maternal RNA clearance (Extended Data Fig. 8); however, Ythdf2 appears to primarily promote the decay of maternal but not zygotic mRNAs during early development (Extended Data Fig. 9 and Supplementary Discussion). The ability to reach adulthood observed in m-KO mutants and a fraction of mz-KO mutants indicates the existence of parallel pathways for maternal mRNA clearance. To this point, we find the targets of miR-4304 and Ythdf2 exhibit significant overlap, with the decay of their common targets occurring earliest, followed by the specific targets of Ythdf2, and then the specific targets of miR-430. This temporal sequence again indicates that Ythdf2 is a maternally-supplied factor acting to degrade maternal mRNAs in the zygote, which is then followed by zygotically-supplied miR-430 for further maternal RNA degradation. Together, these factors suggest the importance of timely, robust removal of maternal transcripts via overlapping yet temporally distinct mechanisms for proper development (Extended Data Fig. 10 a–g, Supplementary Data 1 and Discussion)23–25. Both of these pathways account for still only a portion of total maternal mRNA clearance in zebrafish, with other pathways and mechanisms remain to be discovered.
In conclusion, we show that m6A mRNA methylation and the m6A reader protein Ythdf2 act in a previously hypothesized but unidentified maternal mode to regulate zebrafish maternal mRNA clearance in order to control development through MZT (Extended Data Fig. 10h). This study supports a vital function of m6A in controlling the dynamics of global gene expression during development, in which hundreds to thousands of transcripts, each with their own distinct metabolism, need to be grouped and coordinated for translation and decay. The mechanism enabled by m6A methylation and YTHDF2 allows transcriptome switching in highly orchestrated transition events as reported here and possibly other cell differentiation and development processes.
Methods
Materials and Methods
Zebrafish maintenance
Male heterozygous ythdf2+/− fish in the *AB background were custom made by ZGeneBio (Taipei City, Taiwan). TALEN mutagenesis was performed to mutate ythdf2 (Ensembl ENSDART00000127043) with L1 recognition sequence GGACCTGGCCAATCCCC, R1 recognition sequence GGCACAGTAATGCCACC, and Spacer sequence TCCCAATTCAGGAATG. Purchased fish were outcrossed to in-house wild type *AB fish. Embryos were obtained from natural crosses, were raised under standard conditions, and were staged according to literature26. Embryos were reared at 28.5°C and all experiments and observations were performed as close to this temperature as possible. Fish lines were maintained in accordance with AAALAC research guidelines, under a protocol approved by the University of Chicago IACUC (Institutional Animal Care & Use Committee).
In situ hybridization
The open reading frame of zebrafish ythdf2 was purchased from Open Biosystems (Clone ID: 5601005) and subcloned into a pCS2+ vector using restriction enzyme sites of BamHI and XhoI. The resulting vector was linearized by HindIII and used as a template for ythdf2 probe preparation. Antisense digoxigenin (DIG) RNA probes were generated by in vitro transcription using standard reagents and methods. In situ hybridization protocol was followed essentially as previously reported27. All experiments were repeated at least once from biological samples.
Morpholino and mRNA injection
Control and ythdf2 morpholinos (TGGCTGACATTTCTCACTCCCCGGT) were obtained from Gene Tools (Oregon). 3 ng of either control or gene-specific morpholino was injected into *AB wild-type embryos at the one-cell stage.
GFP and mCherry were subcloned into pCS2+ vectors and linearized by NotI. GFP-m6A, GFP-A, and mCherry capped and polyadenylated mRNA was generated by in vitro transcription using mMessage mMachine SP6 kit (Thermo Fisher) and Poly(A) tailing kit (Thermo Fisher) according to manufacturer’s protocol. Products were purified with the MEGAclear transcription clean-up kit (Thermo Fisher) and used for injections directly. For GFP-m6A, we spiked 6 nmol m6ATP into the 100 nmol ATP supplied in the transcription reaction, in order to ensure that less than 0.3% of GFP mRNAs are without m6A on average. (GFP mRNA is 942 nt; each mRNA has 1.89 m6A on average.). 35 pg of either GFP reporter mRNA and 10 pg of mCherry mRNA were injected together in 1.25nL into embryos at the one-cell stage. ythdf2 mRNA containing the ythdf2 5′UTR and a 3′ FLAG tag, which was used to rescue the mutant phenotype and validate the knockdown efficiency of ythdf2 MO, was constructed in pCS2+ vector (Forward primer: CGTACGGATCCTGTCTGATCT GCAGCTGTAG; Reverse primer: CGATGCTCGAGTTACTTGTCATCGTCGTCCTTGTAATCTATTCCAGATGGAGCAAGGC) and prepared in the same way as mCherry mRNAs.
Antibodies
Antibodies used in this study are listed below in the format of name (application; catalogue number; supplier): Mouse anti-Flag HRP conjugate (Western; A5892; Sigma), rabbit anti-m6A (m6A-seq and m6A-CLIP-seq; 202003; Synaptic Systems), rabbit anti-histone H3 (IF; ab5176; Abcam), and anti-rabbit Alexa Fluor 488 (IF; ab150077; Abcam).
Microscopy
All images were observed with a Leica MZFLIII microscope and captured with a Nikon D5000 digital camera using Camera Control Pro (Nikon) software. For fluorescent microscopy, standard ET-GFP and TXR LP filters (Leica) were used. For bright field imaging of live embryos, only saturation was adjusted and was adjusted identically for all images. For fluorescent imaging of live embryos, no image processing was performed. For fluorescent imaging of fixed embryos, contrast and exposure were adjusted for all to obtain the lowest amount of background while preserving the morphology of all visible nuclei. All experiments were repeated at least once from biological samples.
DNA quantification
To compare the total amount of DNA in wild-type and mutant embryos at different time points during the MZT, 10 embryos per time point per condition were dechorionated and pipetted into standard DNA lysis buffer. The number of embryos in each tube was counted twice to ensure uniformity. Proteinase K was added to 100 μg/mL and the embryos were incubated for 4 hours at ~55°C with occasional mixing. Proteinase K was inactivated by a 10-minute incubation at 95 °C and the DNA was then phenol-chloroform extracted, ethanol precipitated, and resuspended in 100 μl Tris pH 8.5 + 1mM EDTA using standard procedures. Double stranded DNA content was measured via NanoDrop. Three biological replicates (comprised of the offspring of three different fish mating pairs of the appropriate genotype) were measured for each time point for both the control and experimental samples. Biological replicates were averaged together to determine the average DNA amount per time point per genotype and to compute standard errors of the mean. All DNA values were normalized to that of wild-type embryos at 2.5 h.p.f.
Western blot
Embryos were collected into standard 2 × protein sample buffer with added beta-mercaptoethanol and protease inhibitors and immediately put on ice for a few minutes. The embryo mixtures were carefully but thoroughly pipetted up and down to dissolve and homogenize the embryos, and then samples were heated at 95 °C for 5 min and frozen at −80°C. Before use, samples were again heated for 5 minutes and then centrifuged at 12,000 rpm to remove debris. Supernatants were loaded into a 10-well, 1.5 mm Novex 4–20% Tris-Glycine Mini Protein Gel (Thermo Fisher) with 6 embryos per well. The gel was transferred onto a nitrocellulose membrane using iBlot2 gel transfer system (Thermo Fisher) set to P3 for 7 min with iBlot2 mini gel transfer stacks (Thermo Fisher). Membranes were blocked in 5% BSA, 0.05% Tween-20 in PBS for 1 h, and then incubated overnight at 4 °C with anti-Flag HRP conjugate (Sigma) diluted 1:10,000 in 3% BSA. Proteins were visualized using the SuperSignal West Pico Luminol/Enhancer solution (Thermo Fisher) in FluorChem M system (ProteinSimple).
RNA isolation
mRNA isolation for LC-MS/MS: total RNA was isolated from zebrafish embryos with TRIzol reagent (Invitrogen) and Direct-zol RNA MiniPrep kit (Zymo). mRNA was extracted by removal of contaminating rRNA using RiboMinus Eukaryote Kit v2 (Thermo Fisher) for two rounds. Total RNA isolation for qRT–PCR: we followed the instruction of Direct-zol RNA MiniPrep kit (Zymo) with DNase I digestion step. Total RNA was eluted with RNase-free water and used for qRT-PCR directly.
LC-MS/MS
100–200 ng of mRNA was digested by nuclease P1 (2 U) in 25 μl of buffer containing 10 mM of NH4OAc (pH=5.3) at 42°C for 2 h, followed by the addition of NH4HCO3 (1 M, 3 μl, freshly made) and alkaline phosphatase (0.5 U). After an additional incubation at 37°C for 2 h, the sample was diluted to 50 μl and filtered (0.22 μm pore size, 4 mm diameter, Millipore), and 5 μl of the solution was injected into LC-MS/MS. Nucleosides were separated by reverse phase ultra-performance liquid chromatography on a C18 column with on-line mass spectrometry detection using an Agilent 6410 QQQ triple-quadrupole LC mass spectrometer in positive electrospray ionization mode. The nucleosides were quantified by using the nucleoside to base ion mass transitions of 282 to 150 (m6A), and 268 to 136 (A). Quantification was performed in comparison with the standard curve obtained from pure nucleoside standards running on the same batch of samples. The ratio of m6A to A was calculated based on the calibrated concentrations 9.
m6A-seq
Total RNA was isolated from fish embryos collected at different time points with TRIzol reagent and Direct-zol RNA MiniPrep kit. For each time points, ~200 embryos were collected to ensure RNA yield and sample representativity. mRNA was further purified using RiboMinus Eukaryote Kit v2. RNA fragmentation was performed by sonication at 10 ng/μl in 100 μl RNase-free water using Bioruptor Pico (Diagenode) with 30s on/30s off for 30 cycles. m6A-IP and library preparation were performed according to the previous protocol 17. Sequencing was carried out on Illumina HiSeq 2000 according to the manufacturer’s instructions.
m6A-CLIP-seq
Additional high-throughput sequencing of zebrafish methylome was carried out using a modified m6A-seq method, which is similar to previously reported methods19,20. Briefly, total RNA and mRNA were purified as previously described for m6A-seq. Purified mRNA (1 μg) was mixed with 2.5 μg of affinity purified anti-m6A polyclonal antibody (Synaptic Systems) in IPP buffer (150 mM NaCl, 0.1% NP-40, 10 mM Tris-HCl, pH 7.4) and incubated for 2 hours at 4 °C. The mixture was subjected to UV-crosslinking in a clear flat-bottom 96-well plate (Nalgene) on ice at 254 nm with 0.15 J for 3 times. The mixture was then digested with 1 U/μl RNase T1 at 22 °C for 6 min followed by quenching on ice. Next, the mixture was immunoprecipitated by incubation with protein-A beads (Invitrogen) at 4 °C for 1 hr. After extensive washing, the mixture was digested again with 10 U/μl RNase T1 at 22 °C for 6 min followed by quenching on ice. After additional washing and on beads end-repair, the bound RNA fragments were eluted from the beads by proteinase K digestion twice at 55 °C for 20 and 10 min, respectively. The eluate was further purified using RNA clean and concentrator kit (Zymo Research). RNA was used for library generation with NEBNext multiplex small RNA library prep kit (NEB). Sequencing was carried out on Illumina HiSeq 2000 according to the manufacturer’s instructions.
mRNA-seq
Total RNA was isolated from wild-type and mutant fish embryos collected at different time points with TRIzol reagent and Direct-zol RNA MiniPrep kit. For each time points, ~20 embryos were collected to ensure RNA yield and sample representativity. mRNA was further purified using RiboMinus Eukaryote Kit v2. RNA fragmentation was performed using Bioruptor Pico as described previously. Fragmented mRNA was used for library construction using TruSeq stranded mRNA library prep kit (Illumina) according to manufacturer’s protocol. Sequencing was carried out on Illumina HiSeq 2000 according to the manufacturer’s instructions.
Data analysis of high-throughput sequencing data
General information: All samples were sequenced by Illumina Hiseq 2000 with single-end 50-bp read length. The deep sequencing data were mapped to zebrafish genome version 10 (GRCz10). Data analysis for each experiment: (1) for m6A-seq, reads were aligned to the reference genome (danRer10) using Tophat v2.0.1428 with parameter -g 1 --library-type=fr-firststrand. RefSeq Gene structure annotations were downloaded from UCSC Table Browser. The longest isoform was used if the gene had multiple isoforms. Aligned reads were extended to 150 bp (average fragments size) and converted from genome-based coordinates to isoform-based coordinates, in order to eliminate the interference from introns in peak calling. The peak calling method was modified from published work18. To call m6A peaks, the longest isoform of each gene was scanned using a 100 bp sliding window with 10 bp step. To reduce bias from potential inaccurate gene structure annotation and the arbitrary usage of the longest isoform, windows with read counts less than 1/20 of the top window in both m6A-IP and input sample were excluded. For each gene, the read counts in each window were normalized by the median count of all windows of that gene. A Fisher exact test was used to identify the differential windows between IP and input samples. The window was called as positive if the FDR < 0.01 and log2(Enrichment Score) >= 1. Overlapping positive windows were merged. The following four numbers were calculated to obtain the enrichment score of each peak (or window): reads count of the IP samples in the current peak/window (a), median read counts of the IP sample in all 100 bp windows on the current mRNA (b), reads count of the input sample in the current peak/window (c), and median read counts of the input sample in all 100 bp windows on the current mRNA (d). The enrichment score of each window was calculated as (a×d)/(b×c). (2) for m6A-CLIP-seq, after removing the adapter sequence, the reads were mapped to the reference genome (danRer10) using Bowtie2. Peak calling method was similar to the previous study19. Briefly, mutations were considered as signal and all mapped reads were treated as background. A Gaussian Kernel density estimation was used to identify the binding regions. The motif analysis was performed using HOMER29 to search motifs in each set of m6A peaks. The longest isoform of all genes was used as background. (3) for mRNA-seq, reads were mapped with Tophat and Cufflink (v2.2.1) was used to calculate the FPKM of each gene to represent their mRNA expression level30. (4) for fish gene group categorization, we used the input mRNA-seq data from m6A-seq. FPKM of all genes were first normalized to the highest value of five time points, with only genes with FPKM > 1 analyzed. Then Cluster3.031 was used to divide all genes into six clusters, with the parameters: adjust data – normalize genes; K-means cluster – organize genes, 6 clusters, 100 number; K-means – Euclidean distance. The result clustered file with clustered number was merged with original FPKM values, imported and processed in R, and plotted in Excel. (5) for GO analysis, the list of target genes was first uploaded into DAVID32,33 and analyzed with functional annotation clustering. The resulting file was downloaded and extracted with GO terms and corresponding P values. The new list (contains GO terms with P < 0.01) was imported into REVIGO34 and visualized with the interactive graph, which was used as the final output figures.
Integrative data analysis and statistics: methylated genes (at each time point) were defined as overlapped gene targets between m6A-seq and m6A-CLIP-seq. Ythdf2 regulated genes were defined as overlapped gene targets between the lists of the top 20% upregulated genes in both ythdf2 knockout and MO-injected samples. The most stringent Ythdf2 target genes at 4 h.p.f. (135) were defined in the main text, as overlapped genes of methylated genes at 4 h.p.f. (3,237) and ythdf2 regulated genes at 4 h.p.f. (876).
Data presentation: all the raw data and processed files have been deposited in the Gene Expression Omnibus (http://www.ncbi.nlm.nih.gov/geo) and accessible under GSE79213. A summary of sequenced samples and processed FPKM data is included as Supplementary Data 2. One set of representative experiment results from at least two independent experiments were shown where applicable.
qRT–PCR
Quantitative reverse transcription PCR (qRT–PCR) was performed to assess the relative abundance of mRNA. All RNA templates used for qRT–PCR were pre-treated with on-column DNase I digestion in the purification step. qRT–PCR primers were designed to span exon-exon junctions to only detect mature mRNA. qRT–PCR was performed by using SuperScript III one-step RT-PCR system (Thermo Fisher) with 50–100 ng total RNA template. Actb1 was used as an internal control as it showed relative invariant expression during the studied time period according to pilot qRT-PCR data. P values were determined using two-sided Student’s t-test for two samples with equal variance. *, P <0.05; **, P <0.01; ***, P <0.001. The sequences of primers used in this study are listed below.
actb1: CGAGCAGGAGATGGGAACC; CAACGGAAACGCTCATTGC.
buc: CAAGTTACTGGACCTCAGGATC; GGCAGTAGGTAAATTCGGTCTC.
zgc:162879: TCCTGAATGTCCGTGAATGG; CCCTCAGATCCACCTTGTTC.
mylipa: CCAAACCAGACAACCATCAAC; CACTCCACCCCATAATGCTC.
vps26a: AAATGACAGGAATAGGGCCG; CAGCCAGGAAAAGTCGGATAG.
tdrd1: TACTTCAACACCCGACACTG; TCACAAGCAGGAGAACCAAC.
setdb1a: CTTCTCAACCCAAAACACTGC; CTATCTGAAGAGACGGGTGAAAC.
mtus1a: TGGAGTATTACAAGGCTCAGTG; TTATGACCACAGCGACAGC.
GFP: TGACATTCTCACCACCGTGT; AGTCGTCCACACCCTTCATC.
Data availability statement
High-throughput sequencing data that support the findings of this study have been deposited at GEO under the accession number GSE79213. All the other data generated or analysed during this study are included in the article and Supplementary Information.
Extended Data
Extended Data Figure 1. Generation and characterization of ythdf2 mutant fish.
a, Design of transcription activator-like effectors (TALEs) used to generate ythdf2 mutant fish. An 8 bp deletion upstream of the YTH RNA-binding domain is made to create a premature stop codon. b, Photos of adult wild-type and ythdf2−/− mutant fish. Homozygous ythdf2 mutant males are often smaller than wild-type males. c, Table showing the percent of embryos suffering from MBT-period developmental delay and lethality for crosses between different homozygous genotypes. Homozygous mutant females produce ~95% embryos that suffer from MBT-period developmental delay, regardless of paternal genotype. Homozygous mutant males produce on average ~70% embryos that do not develop past the 1-cell stage, regardless of maternal genotype. These two phenotypes can segregate independently from one another and reveal that Ythdf2 is pleiotropic in zebrafish development (see Supplementary Discussion). Each row is tabulated from six to eighteen crosses, scoring between 365 and 1026 embryos, and using randomly selected males and females from each genotype from at least 4 fish of each sex. d, Table showing additional crosses to characterize the paternal-associated lethality and/or sterility of ythdf2 loss of function. Heterozygous males produce about half the number 1-cell arrested offspring as homozygous mutant males, perhaps indicating a function for Ythdf2 in later gametogenesis; this arrest occurs without respect to maternal genotype. Data for each row is tabulated from 5 crosses each, using randomly selected males and females from each genotype from at least 4 fish of each sex.
Extended Data Figure 2. Phenotypes of maternal ythdf2−/− mutant embryos.
a, Still images taken from the time-lapse movie of a maternal ythdf2−/− mutant embryo filmed between 2.25 h.p.f. and 6.55 h.p.f. highlighting the development delay phenotype occurring during the MBT period. Red texts indicate stages experiencing the delay. All cell divisions are normal in mutant embryos until the cell cycle that should take place between high and oblong stages, cell cycle 12. The high stage in mutant embryos lasts ~ 60 min while the similar stage in wild-type lasts ~ 20 min. Maternal ythdf2−/− mutants lose another ~ 30 min of developmental time between the pseudo-dome and pseudo-50% epiboly stages before reaching the 50% epiboly stage at 6.5 h.p.f. versus 5 h.p.f. in wild-type. b, Injection of ythdf2 mRNA allows partial rescue of the ythdf2 mutant phenotype. Maternal ythdf2−/− mutant embryos injected with 150pg ythdf2 mRNA showed an overall reduction in the cell cycle 12 delay compared to uninjected embryos of the same genotype. In these partially rescued embryos, an appreciable number of cells during cell cycle 12 divided at the same time as wild-type cells did. This partial rescue is nearly 100% penetrant (n=69, four experiments). c, Immunofluorescent microscopy of wild-type, ythdf2 mutant, and ythdf2 mRNA-injected mutant embryos fixed at 3 hours 50 min post-fertilization and stained with anti-phospho-histone H3 (pH3) antibody to label nuclei in late G2 phase through M-phase of the cell cycle. The bar chart shows the average number of condensed pH3-positive nuclei per 100 cells. The results showed that unlike wild-type embryos, maternal ythdf2−/− mutants are lacking in the tight, condensed pH3 nuclei staining characteristic of metaphase/anaphase, which can be partially rescued by the injection of ythdf2 mRNA. Error bars, mean ± s.e.m., n = 8 embryos counted for each condition, 100 cells each embryo. P values were determined using unpaired Student’s t-test.
Extended Data Figure 3. Characterization of m6A modification and gene expression change in the early embryonic transcriptome of zebrafish.
a, Venn diagrams show the overlap of two replicates of m6A-modified transcripts determined by m6A-seq and m6A-CLIP-seq at five time points. b, Distribution of m6A-sites (number of m6A-seq peaks) in the six gene groups over time. c, Number of m6A-modified genes identified in both m6A-seq and m6A-CLIP-seq at five time points. d, Quantification of the m6A/(G+A+C+U) ratio of mRNAs purified from zebrafish embryos at various developmental time points by LC-MS/MS. The fluctuation observed may reflect the complex dynamics of the decay of the methylated maternal transcripts, the transcription and methylation of newly synthesized zygotic mRNAs, and their subsequent decay during early development. All time points were normalized to 0 h.p.f. value. Error bars, mean ±s.d., n = 3 (technical replicates). e, Consensus motif identified by HOMER with m6A-CLIP peaks at five time points. f, Metagene profiles depict the subtranscript distribution pattern of m6A-sites (from m6A-seq) within the zebrafish transcriptome. m6A-seq peak signals are enriched after the start codon and before the stop codon. g–h, Gene Ontology (GO) analysis of non-methylated maternal transcripts (g) and methylated ones (h). i, Table showing the number of genes downregulated and upregulated in maternal ythdf2−/− mutants at 4 h.p.f. within the 6 gene expression clusters (top 20%).
Extended Data Figure 4. Design and knockdown efficiency of the morpholino targeting ythdf2.
a, Design of ythdf2 morpholino that targets the intersection of the 5′ UTR and CDS of ythdf2 mRNA. b, Efficiency test of ythdf2 morpholino treatment inhibiting the expression of Ythdf2 by Western blot. mRNAs containing the 5′UTR and full-length CDS of ythdf2 with FLAG tag sequence fused at the C-terminus were co-injected with either control or ythdf2 MO into single cell wild-type embryos. Ythdf2-FLAG was detected by the anti-FLAG antibody. Material from six embryos was loaded into each lane. For gel source data, see Supplementary Figure 1.
Extended Data Figure 5. Overlap between methylated genes and upregulated genes in maternal ythdf2−/− embryos.
a, Quantification of the m6A/A ratio of the total mRNA purified from maternal ythdf2−/− and wild-type embryos by LC-MS/MS. P values were determined using two-sided Student’s t-test for paired samples. Error bars, mean ± s.d. of two technical replicates (data points with same colour) from two biological experiments. b, Composition of upregulated, methylated genes in maternal ythdf2−/− samples at 4 h.p.f. A total of 3,292 genes are both methylated and upregulated upon ythdf2 LOF, over 60% of which are maternal genes. c, Venn diagram depicts the overlapping of m6A-modified transcripts determined by m6A-seq, m6A-CLIP-seq, and differentially expressed transcripts between ythdf2 LOF samples and controls at 4 h.p.f. The 135 intersected genes were defined as the most stringent Ythdf2 RNA targets. Without including the MO-treated result (but with ythdf2−/− result), we can estimate about 383 Ythdf2 target mRNAs. d, GO analysis of the most stringent Ythdf2 target genes.
Extended Data Figure 6. Methylation profiles of Ythdf2 target transcripts.
a, Examples of Ythdf2 RNA targets harboring both m6A-seq peaks and m6A-CLIP-seq peaks. Coverage of m6A immunoprecipitation (IP) and input fragments are indicated in red and blue, respectively. m6A-CLIP-seq peaks are highlighted in green. Grey lines signify CDS borders.
b, The dynamics of m6A immunoprecipitation (IP) signals over time in Ythdf2 RNA targets. Coverage of m6A immunoprecipitation (IP) and input fragments are indicated in red and grey, respectively. The locations of consensus motifs of GGACU and AGACU are indicated as blue dots. Red lines show splice junctions. Blue squares mark the peaks identified from the m6A-seq signals. Example genes shown: buc, mtus1a, mylipa, setdb1a, tdrd1, vps26a, and zgc:162879.
Extended Data Figure 7. Degradation of reporter mRNAs in ythdf2 LOF and control embryos.
The in vivo degradation of GFP-m6A mRNAs was faster than GFP-A mRNAs when co-injected with control MO. In contrast, GFP-m6A mRNAs displayed an undistinguishable decay rate from GFP-A mRNAs when co-injected with ythdf2 MO. The abundances of GFP-m6A and GFP-A mRNAs were determined by RT-qPCR. Error bars, mean ± s.d, n = 3 (technical replicates). P values were determined using two-sided Student’s t-test for two samples with equal variance.
Extended Data Figure 8. Zygotic Ythdf2 facilitates continued regulation of maternal mRNA clearance during late MZT (6–8 h.p.f.).
Cumulative distribution of the log2 fold changes of RNA expression after 4 h.p.f. for the six gene groups between maternal ythdf2−/− (m-KO) and wild-type (a, b), or maternal-zygotic ythdf2−/− (mz-KO) and wild-type (c, d). Colour code and gene numbers of each gene group are listed under each figure panel. Compared to the relatively unchanged curves of semi-stable gene groups (black and grey), the right shift of blue curves indicates the increase of maternal RNAs while the left shift of red curves indicates the decrease of zygotic RNAs in mutant samples versus wild-type ones. While the gene expression patterns of m-KO samples remain largely unchanged at 6 h.p.f. (a) and 8 h.p.f. (b), mz-KO samples show significant retention of maternal genes and delayed activation of zygotic genes at 6 h.p.f. (c) and continued notable delay of zygotic expression at 8 h.p.f. (d), indicating zygotically expressed Ythdf2 also functions on maternal mRNA during late MZT. Gene group categorization was based on the expression pattern data from 0 – 8 h.p.f. P values were calculated using two-sided Kruskal-Wallis test. Representative data shown from two independent experiments.
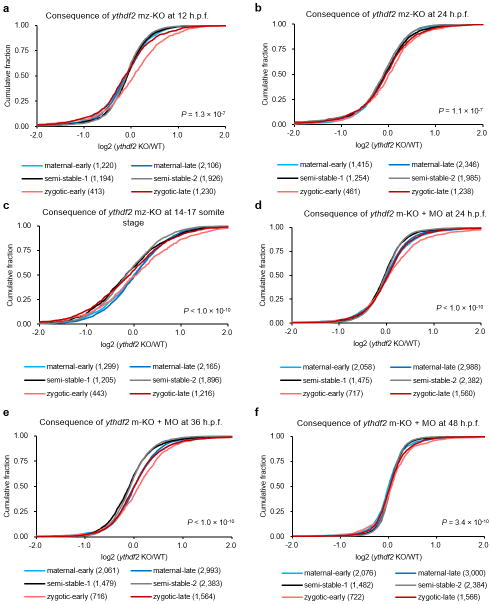
Extended Data Figure 9. Ythdf2 does not cause transcriptome-wide zygotic gene expression change during the zygotic stage of zebrafish early development (12–48 h.p.f.).
Cumulative distribution of the log2 fold changes of RNA expression during the zygotic stage of zebrafish early development for the six gene groups between mutant and wild-type embryos. a–b, mz-KO samples exhibit largely unchanged gene expression patterns at 12 h.p.f. (a) and 24 h.p.f. (b) versus wild-type, indicating that Ythdf2 does not impact the degradation of zygotic mRNA on the organismal level during this time period. c, Considering the potential time-matched inaccuracy due to the delayed zygotic gene expression in the mutant embryos, we performed a stage-matched comparison at the 14–17 somite stage (WT 16 h.p.f. vs KO 17.5 h.p.f.) and observed very similar, unchanged gene expression profiles between mutant and wild-type embryos. Both time-matched and stage-matched comparisons reveal largely indistinguishable zygotic transcriptome profiles during the investigated zygotic stage corresponds nicely with the lack of abnormal developmental phenotypes in ythdf2 mz-KO embryos during this time period. d–f, To avoid the involvement of paternal effect from male ythdf2 KO fish, we used maternal KO embryos (from wild-type male) injected with ythdf2-MO (m-KO + MO) to achieve maternal and zygotic depletion of Ythdf2. We investigated the RNA expression of all genes between wild-type and ythdf2 LOF groups during later developmental stages and observed largely unchanged gene expression patterns in m-KO + MO samples at 24 h.p.f. (d), 36 h.p.f. (e), and 48 h.p.f. (f) versus wild-type, which indicate that Ythdf2 does not impact the degradation of zygotic mRNA on the transcriptome level during late zygotic stages. Gene group categorization was based on the expression pattern data from 0 – 8 h.p.f. P values were calculated using two-sided Kruskal-Wallis test. Representative data shown from two independent experiments.
Extended Data Figure 10. Target overlap of Ythdf2 and miR-430 regulation pathways.
a, Target overlap between Ythdf2 and miR-430. Genes with more than 1.5-fold upregulation upon removal of maternal Ythdf2 or miR-4304 were used as corresponding targets in the analysis. b, GO analysis of the common target genes of Ythdf2 and miR-430. c–f, Differential temporal regulation of the targets of miR430 and Ythdf2. In wild-type embryos, common targets are decayed first, followed by Ythdf2-specific targets, and then miR430-specific targets (c). Upon maternal ythdf2 knockout, the decay of the miR430-specific targets showed minimal delay (d), while the Ythdf2-specific targets and the common targets show more significant decay delays; the latter finding is consistent with Ythdf2 as a maternally-supplied factor able to degrade maternal mRNAs earlier in time (e, f). Relative expression level is calculated by the median of the expression levels of all genes and normalized to the value at 0 h.p.f., respectively. g, Maternal ythdf2−/− embryos show a similar zygotic genome activation delay as Nanog+Sox19b+Pou5f3 LOF embryos at 4 h.p.f. The log2 fold change of the mRNA-seq data of maternal ythdf2−/− mutants and the published mRNA-seq data with combined loss of nanog, sox19b (soxB1), and pou5f3 (oct4 homolog) were plotted in the same diagram. Zygotic genes (red dots) were separately plotted out from all genes (grey dots). Intersections of crosslines mark the median points of each group of genes. h, proposed mechanism of Ythdf2 regulating zebrafish MZT: Ythdf2-mediated RNA decay ensures the timely clearance of maternal RNA; Without Ythdf2, m6A-modified maternal RNA are overrepresented in the transcriptome during MZT, causing delayed zygotic genome activation and a significant developmental delay.
Supplementary Material
Acknowledgments
This work was supported by National Institutes of Health HG008688, GM113194 (both to C.H.), and HD072598 (to R.K.H.). C.H. is an investigator of the Howard Hughes Medical Institute (HHMI). B.S.Z. is an HHMI International Student Research fellow. The Mass Spectrometry Facility of the University of Chicago is funded by National Science Foundation (CHE-1048528).
Footnotes
Supplementary Information is linked to the online version of the paper at www.nature.com/nature
Author Contributions B.S.Z., X.W., and A.V.B. contributed equally to this work. B.S.Z., X.W., A.V.B., C.H., and R.K.H. designed experiments. B.S.Z., X.W., A.V.B., and H.S. performed biochemistry experiments. A.V.B., B.S.Z., X.W., and A.K. performed cell biology experiments. B.S.Z., X.W., and Z.L. analysed sequencing data. B.S.Z., X.W., A.V.B., and C.H. wrote the manuscript with inputs from Z.L. and R.K.H.
The authors declare no competing financial interests.
References and Notes
- 1.Tadros W, Lipshitz HD. The maternal-to-zygotic transition: a play in two acts. Development. 2009;136:3033–3042. doi: 10.1242/dev.033183. [DOI] [PubMed] [Google Scholar]
- 2.Lee MT, Bonneau AR, Giraldez AJ. Zygotic genome activation during the maternal-to-zygotic transition. Annu Rev Cell Dev Bi. 2014;30:581–613. doi: 10.1146/annurev-cellbio-100913-013027. [DOI] [PMC free article] [PubMed] [Google Scholar]
- 3.Walser CB, Lipshitz HD. Transcript clearance during the maternal-to-zygotic transition. Curr Opin Genet Dev. 2011;21:431–443. doi: 10.1016/j.gde.2011.03.003. [DOI] [PubMed] [Google Scholar]
- 4.Giraldez AJ, et al. Zebrafish miR-430 promotes deadenylation and clearance of maternal mRNAs. Science. 2006;312:75–79. doi: 10.1126/science.1122689. [DOI] [PubMed] [Google Scholar]
- 5.Mishima Y, Tomari Y. Codon usage and 3′UTR length determine maternal mRNA stability in zebrafish. Mol Cell. 2016;61:874–885. doi: 10.1016/j.molcel.2016.02.027. [DOI] [PubMed] [Google Scholar]
- 6.Mathavan S, et al. Transcriptome analysis of zebrafish embryogenesis using microarrays. Plos Genet. 2005;1:260–276. doi: 10.1371/journal.pgen.0010029. [DOI] [PMC free article] [PubMed] [Google Scholar]
- 7.Aanes H, et al. Zebrafish mRNA sequencing deciphers novelties in transcriptome dynamics during maternal to zygotic transition. Genome Res. 2011;21:1328–1338. doi: 10.1101/gr.116012.110. [DOI] [PMC free article] [PubMed] [Google Scholar]
- 8.Rabani M, et al. High-resolution sequencing and modeling identifies distinct dynamic RNA regulatory strategies. Cell. 2014;159:1698–1710. doi: 10.1016/j.cell.2014.11.015. [DOI] [PMC free article] [PubMed] [Google Scholar]
- 9.Desrosiers R, Friderici K, Rottman F. Characterization of Novikoff Hepatoma messenger-RNA methylation. Fed Proc. 1975;34:628–628. [Google Scholar]
- 10.Jia GF, et al. N6-methyladenosine in nuclear RNA is a major substrate of the obesity-associated FTO. Nat Chem Biol. 2011;7:885–887. doi: 10.1038/nchembio.687. [DOI] [PMC free article] [PubMed] [Google Scholar]
- 11.Zheng GQ, et al. ALKBH5 is a mammalian RNA demethylase that impacts RNA metabolism and mouse fertility. Mol Cell. 2013;49:18–29. doi: 10.1016/j.molcel.2012.10.015. [DOI] [PMC free article] [PubMed] [Google Scholar]
- 12.Liu JZ, et al. A METTL3-METTL14 complex mediates mammalian nuclear RNA N-6-adenosine methylation. Nat Chem Biol. 2014;10:93–95. doi: 10.1038/nchembio.1432. [DOI] [PMC free article] [PubMed] [Google Scholar]
- 13.Wang X, et al. N-6-methyladenosine-dependent regulation of messenger RNA stability. Nature. 2014;505:117–120. doi: 10.1038/nature12730. [DOI] [PMC free article] [PubMed] [Google Scholar]
- 14.Geula S, et al. m6A mRNA methylation facilitates resolution of naïve pluripotency toward differentiation. Science. 2015;347:1002–1006. doi: 10.1126/science.1261417. [DOI] [PubMed] [Google Scholar]
- 15.Batista PJ, et al. m6A RNA modification controls cell fate transition in mammalian embryonic stem cells. Cell stem cell. 2014;15:707–719. doi: 10.1016/j.stem.2014.09.019. [DOI] [PMC free article] [PubMed] [Google Scholar]
- 16.Wang Y, et al. N-6-methyladenosine modification destabilizes developmental regulators in embryonic stem cells. Nat Cell Biol. 2014;16:191–198. doi: 10.1038/ncb2902. [DOI] [PMC free article] [PubMed] [Google Scholar]
- 17.Kane DA, Kimmel CB. The zebrafish midblastula transition. Development. 1993;119:447–456. doi: 10.1242/dev.119.2.447. [DOI] [PubMed] [Google Scholar]
- 18.Dominissini D, et al. Topology of the human and mouse m6A RNA methylomes revealed by m(6)A-seq. Nature. 2012;485:201–206. doi: 10.1038/nature11112. [DOI] [PubMed] [Google Scholar]
- 19.Chen K, et al. High-resolution N-6-methyladenosine (m6A) map using photo-crosslinking-assisted m6A sequencing. Angew Chem Int Edit. 2015;54:1587–1590. doi: 10.1002/anie.201410647. [DOI] [PMC free article] [PubMed] [Google Scholar]
- 20.Linder B, et al. Single-nucleotide-resolution mapping of m6A and m6Am throughout the transcriptome. Nat Methods. 2015;12:767–772. doi: 10.1038/nmeth.3453. [DOI] [PMC free article] [PubMed] [Google Scholar]
- 21.Meyer KD, et al. Comprehensive analysis of mRNA methylation reveals enrichment in 3′ UTRs and near stop codons. Cell. 2012;149:1635–1646. doi: 10.1016/j.cell.2012.05.003. [DOI] [PMC free article] [PubMed] [Google Scholar]
- 22.Schwartz S, et al. High-resolution mapping reveals a conserved, widespread, dynamic mRNA methylation program in yeast meiosis. Cell. 2013;155:1409–1421. doi: 10.1016/j.cell.2013.10.047. [DOI] [PMC free article] [PubMed] [Google Scholar]
- 23.Gerber AP, Luschnig S, Krasnow MA, Brown PO, Herschlag D. Genome-wide identification of mRNAs associated with the translational regulator PUMILIO in Drosophila melanogaster. P Natl Acad Sci USA. 2006;103:4487–4492. doi: 10.1073/pnas.0509260103. [DOI] [PMC free article] [PubMed] [Google Scholar]
- 24.Laver JD, et al. Brain tumor is a sequence-specific RNA-binding protein that directs maternal mRNA clearance during the Drosophila maternal-to-zygotic transition. Genome Biol. 2015;16:94. doi: 10.1186/s13059-015-0659-4. [DOI] [PMC free article] [PubMed] [Google Scholar]
- 25.Stoeckius M, et al. Global characterization of the oocyte-to-embryo transition in Caenorhabditis elegans uncovers a novel mRNA clearance mechanism. Embo J. 2014;33:1751–1766. doi: 10.15252/embj.201488769. [DOI] [PMC free article] [PubMed] [Google Scholar]
- 26.Kimmel CB, Ballard WW, Kimmel SR, Ullmann B, Schilling TF. Stages of embryonic-development of the zebrafish. Dev Dynam. 1995;203:253–310. doi: 10.1002/aja.1002030302. [DOI] [PubMed] [Google Scholar]
- 27.Thisse B, Thisse C. In situ hybridization on whole-mount zebrafish embryos and young larvae. Methods Mol Biol. 2014;1211:53–67. doi: 10.1007/978-1-4939-1459-3_5. [DOI] [PubMed] [Google Scholar]
- 28.Kim D, et al. TopHat2: accurate alignment of transcriptomes in the presence of insertions, deletions and gene fusions. Genome Biol. 2013;14:R36. doi: 10.1186/gb-2013-14-4-r36. [DOI] [PMC free article] [PubMed] [Google Scholar]
- 29.Heinz S, et al. Simple combinations of lineage-determining transcription factors prime cis-regulatory elements required for macrophage and B cell identities. Mol Cell. 2010;38:576–589. doi: 10.1016/j.molcel.2010.05.004. [DOI] [PMC free article] [PubMed] [Google Scholar]
- 30.Trapnell C, et al. Transcript assembly and quantification by RNA-Seq reveals unannotated transcripts and isoform switching during cell differentiation. Nat Biotechnol. 2010;28:511–515. doi: 10.1038/nbt.1621. [DOI] [PMC free article] [PubMed] [Google Scholar]
- 31.de Hoon MJL, Imoto S, Nolan J, Miyano S. Open source clustering software. Bioinformatics. 2004;20:1453–1454. doi: 10.1093/bioinformatics/bth078. [DOI] [PubMed] [Google Scholar]
- 32.Huang DW, Sherman BT, Lempicki RA. Systematic and integrative analysis of large gene lists using DAVID bioinformatics resources. Nat Protoc. 2009;4:44–57. doi: 10.1038/nprot.2008.211. [DOI] [PubMed] [Google Scholar]
- 33.Huang DW, Sherman BT, Lempicki RA. Bioinformatics enrichment tools: paths toward the comprehensive functional analysis of large gene lists. Nucleic Acids Res. 2009;37:1–13. doi: 10.1093/nar/gkn923. [DOI] [PMC free article] [PubMed] [Google Scholar]
- 34.Supek F, Bosnjak M, Skunca N, Smuc T. REVIGO summarizes and visualizes long lists of gene ontology terms. Plos One. 2011;6:e21800. doi: 10.1371/journal.pone.0021800. [DOI] [PMC free article] [PubMed] [Google Scholar]
- 35.Bazzini AA, Lee MT, Giraldez AJ. Ribosome profiling shows that miR-430 reduces translation before causing mRNA decay in zebrafish. Science. 2012;336:233–237. doi: 10.1126/science.1215704. [DOI] [PMC free article] [PubMed] [Google Scholar]
- 36.Lee MT, et al. Nanog, Pou5f1 and SoxB1 activate zygotic gene expression during the maternal-to-zygotic transition. Nature. 2013;503:360–364. doi: 10.1038/nature12632. [DOI] [PMC free article] [PubMed] [Google Scholar]
Associated Data
This section collects any data citations, data availability statements, or supplementary materials included in this article.
Supplementary Materials
Data Availability Statement
High-throughput sequencing data that support the findings of this study have been deposited at GEO under the accession number GSE79213. All the other data generated or analysed during this study are included in the article and Supplementary Information.


