

ABSTRACT
Pluripotency is an important feature of cancer stem cells (CSCs) that contributes to self-renewal and chemoresistance. The maintenance of pluripotency of CSCs under various pathophysiological conditions requires a complex interaction between various cellular pathways including those involved in homeostasis and energy metabolism. However, the exact mechanisms that maintain the CSC pluripotency remain poorly understood. In this report, using both human and murine models of CSCs, we demonstrate that basal levels of autophagy are required to maintain the pluripotency of CSCs, and that this process is differentially regulated by the rate-limiting enzyme in the NAD+ synthesis pathway NAMPT (nicotinamide phosphoribosyltransferase) and the transcription factor POU5F1/OCT4 (POU class 5 homeobox 1). First, our data show that the pharmacological inhibition and knockdown (KD) of NAMPT or the KD of POU5F1 in human CSCs significantly decreased the expression of pluripotency markers POU5F1, NANOG (Nanog homeobox) and SOX2 (SRY-box 2), and upregulated the differentiation markers TUBB3 (tubulin β 3 class III), CSN2 (casein β), SPP1 (secreted phosphoprotein 1), GATA6 (GATA binding protein 6), T (T brachyury transcription factor) and CDX2 (caudal type homeobox 2). Interestingly, these pluripotency-regulating effects of NAMPT and POU5F1 were accompanied by contrasting levels of autophagy, wherein NAMPT KD promoted while POU5F1 KD inhibited the autophagy machinery. Most importantly, any deviation from the basal level of autophagy, either increase (via rapamycin, serum starvation or Tat-beclin 1 [Tat-BECN1] peptide) or decrease (via ATG7 or ATG12 KD), strongly decreased the pluripotency and promoted the differentiation and/or senescence of CSCs. Collectively, these results uncover the link between the NAD+ biosynthesis pathway, CSC transcription factor POU5F1 and pluripotency, and further identify autophagy as a novel regulator of pluripotency of CSCs.
KEYWORDS: autophagy, cancer stem cells, differentiation, pluripotency, POU5F1/Oct4, senescence
Introduction
The cancer stem cell hypothesis proposes that only a small population of cells within tumors, termed cancer stem cells (CSCs), is responsible for tumor growth and recurrence,1,2 CSCs can be defined as pluripotent cells that are capable of self-renewal which give rise to heterogeneous tumor masses.3 Pluripotency is a feature of CSCs that allows them to differentiate into all somatic cell lineages and contributes to their ability to self-renew, which is the capacity to indefinitely divide and maintain the undifferentiated state.4 Transplantation of very small populations of CSCs into immunocompromised mice is sufficient to initiate the formation of the original tumor.5-7 Furthermore, CSCs are more resistant to traditional cancer therapies than differentiated cancer cells and can reinitiate the formation of new tumors following an apparent eradication of cancers to undetectable levels.2,8,9 Due to their enhanced chemoresistant properties and their uncontrolled proliferation, CSCs are extremely difficult to target. Recent studies have highlighted that cancer stem-like cells such as NT2/D1 and P19 are able to proliferate at an extremely high rate by regulating various growth related factors such as POU5F1/OCT4 (POU class 5 homeobox 1), and AKT (AKT serine/threonine kinase).10 Furthermore, there are several lines of evidence clearly showing that embryonal carcinoma cells (ECCs) such as the NT2/D1 and P19 cell lines (of human and murine origin respectively) are suitable models for studying CSCs at the embryonic stage.10,11
There are various factors that are implicated in the pluripotency of CSCs. Among those factors, the POU domain transcription factor POU5F1 is an essential regulator of embryonic development and is highly expressed in cultured cell lines including ECCs.12 POU5F1 helps to maintain the pluripotent state by controlling the transcription of core stemness factors including itself and NANOG.13 An accurately controlled level of POU5F1 is important not only for the pluripotency of CSCs but also for their differentiation. Interestingly, increases or decreases in the normal levels of POU5F1 induce the differentiation of stem cells into various lineages.14
On the other hand, autophagy is a highly conserved homeostatic process by which intracellular constituents are delivered to lysosomes for degradation. Depending on the mode of delivery, there are 3 different primary types of autophagy: chaperone-mediated autophagy, microautophagy, and macroautophagy, the latter of which is henceforth referred to as autophagy and has been extensively investigated.15 Through autophagy, redundant long-lived proteins and damaged organelles are degraded in autolysosomes. This is a multistep process consisting of the formation of the autophagosome through sequential modification of MAP1LC3/LC3 isoforms A and B (microtubule-associated protein 1 light chain 3 α and β). After synthesis, the C-terminal of LC3A/B is cleaved by ATG4 (autophagy related 4 cysteine peptidase) to produce LC3A/B-I with a molecular mass (MM) of 18 kDa. Upon activation of autophagy, a fraction of LC3A/B-I is transferred to phosphotidylethanolamine (PE) to produce an LC3A/B–PE conjugate (also known as LC3A/B-II) that gets associated with autophagosomes, and thus the amount of LC3A/B-II and the formation of LC3A/B puncta are used as markers of the autophagosome.15,16
The role of autophagy in cancer has been studied extensively. There are 2 thoughts regarding the role of autophagy in cancer. On one hand, autophagy is believed to be a prosurvival mechanism by recycling cellular components to meet increased energy requirements;17 on the other hand, defects in autophagy have been linked with increased tumorigenesis and autophagy has been shown to induce cell death in cancer cells.17,18 Our recent study also shows that inhibition or knockdown (KD) of NAMPT (nicotinamide phosphoribosyltransferase), the rate limiting enzyme in procancer NAD+ synthesis, inhibits the growth of differentiated cancer cells through autophagy.19 Thus, targeting autophagy has emerged as a potential approach to treat certain cancers, although the role of autophagy in regulating the pluripotency of CSCs is relatively unknown. Since recent evidence has linked CSCs with chemoresistance and cancer recurrence, it is of the utmost importance to explore therapeutic manipulations that can target CSCs. In this study, we investigated the characteristics of autophagy and pluripotency response to NAMPT (known to regulate autophagy) and POU5F1 (main pluripotency factor) in human (NT2/D1) and murine (P19) ECCs. We observed that a basal level of autophagy is crucial for the pluripotency of ECCs and any modification (increase or decrease) in autophagy levels strongly decreases the pluripotency of ECCs. These findings are further supported by the observation that direct inhibition of autophagy via ATG7 (autophagy-related 7) or ATG12 (autophagy-related 12) KD, or stimulation of autophagy using rapamycin, serum starvation or Tat-beclin 1 (Tat-BECN1) peptide strongly inhibits the pluripotency of ECCs. These results conclusively demonstrate the critical role for autophagy in CSC biology and identify autophagy as an important therapeutic target for the management of CSCs.
Results
NAMPT inhibition reduces the viability and proliferation of cancer stem cells
NAMPT inhibition has been shown to induce autophagic cell death in several cancer cell lines that are known to harbor cancer stem cell populations such as neuroblastoma SH-SY5Y cells and multiple myeloma cells.20-23 However, the role of NAMPT in bona fide CSCs has never been studied. In the context of our recent findings that NAMPT inhibition reduces the growth of differentiated cancer cells by promoting autophagy, we began by looking at the effect of NAMPT inhibition (both by KD and using chemical inhibition) on the growth rate of well-characterized human teratocarcinoma stem cells (NT2/D1).10,11 First, NT2/D1 CSCs were transfected with NAMPT shRNA and then monitored for viability using trypan blue dye exclusion or for their ability to proliferate using 5-(and-6) carboxyfluorescein diacetate succinimidyl ester (CFSE)-based cell proliferation assay.24 As shown in Fig. 1, NT2/D1 CSCs with NAMPT KD demonstrated significantly reduced viability and cell numbers after 48 and 72 h post-transfection (Fig. 1A) and displayed significantly higher CFSE fluorescence (Fig. 1B) as compare with the scrambled control (Cytarabine was used as a positive control to demonstrate the impairment of proliferation in CSCs.). Similar trends of cell survival and proliferation were observed when the activity of NAMPT in CSCs was inhibited with the chemical inhibitor FK866 (Fig. 1C and D). Together, these results showed that the inhibition of NAMPT, with either KD or chemical inhibition, reduces the viability and proliferation of CSCs.
Figure 1.
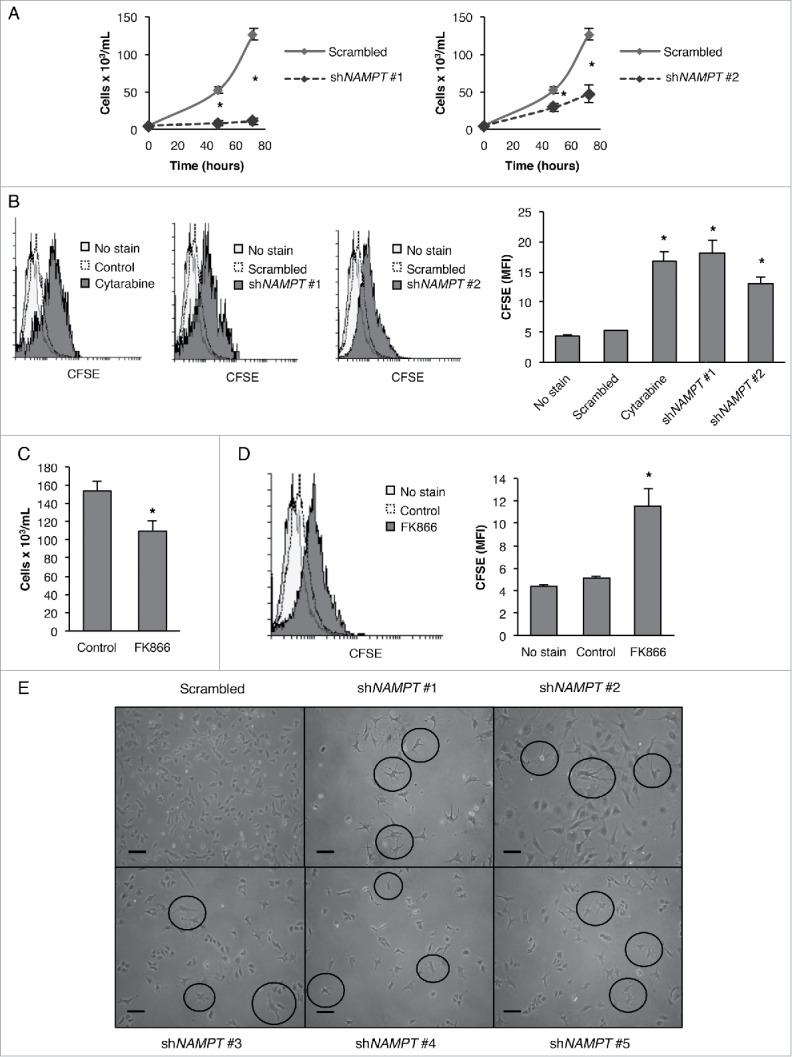
NAMPT inhibition or KD inhibits the proliferation of cancer stem cells. (A) NT2/D1 NAMPT KD cells from 2 different shRNA clones were stained with trypan blue and counted to determine the number of viable cells after 48 and 72 h transfection. (B) NT2/D1 NAMPT KD cells were labeled with CFSE and then analyzed by flow cytometry for CFSE fluorescence after 4 d of culturing. (C) NT2/D1 cells treated with FK866 for 48 h were stained with trypan blue and counted to determine the number of viable cells. (D) NT2/D1 cells treated with FK866 were labeled with CFSE and then analyzed by flow cytometry after 4 d of culturing. (E) Photographs were taken to show a change in cell morphology of NAMPT KDs with 5 different shRNA compare with scrambled control cells. Statistical analysis was performed with the 2-tailed, Student t test with 95% confidence interval; *P values ≤ 0.05 obtained by comparing the respective data with the untreated or scrambled control. MFI, mean fluorescent intensity. Scale bar: 100 µm.
Interestingly, NT2/D1 CSCs with NAMPT KD (with 5 different NAMPT shRNAs) displayed phenotypic characteristics of differentiated cells (Fig. 1E). When examined under the microscope, the majority of cells were not dying but instead appeared to be undergoing morphological changes. It is reported that once CSCs lose their pluripotency, they typically undergo differentiation into various lineages. This differentiation can often be characterized by a change in morphology wherein CSCs undergoing differentiation begin to form elongated outgrowths called neurites.25,26 It is apparent from the micrographs of NAMPT KDs that, as compare with the scrambled control, these cells form many elongated neurites (Fig. 1E). This observation raised the possibility that the inhibition of NAMPT promotes the differentiation of CSCs.
NAMPT inhibition decreases pluripotency and promotes differentiation in cancer stem cells
Three major transcription factors POU5F1, NANOG and SOX2 are required to maintain the pluripotency of stem cells,27 and are routinely used to distinguish stem cells from differentiated ones. Thus, to further probe the effect of NAMPT inhibition on pluripotency and differentiation of NT2/D1 cells, we examined the expression of these transcription factors using western blot (WB) and quantitative real-time PCR (qRT-PCR) analysis. Our data show that both NAMPT KD and FK866 treatment significantly decreased the protein (Fig. 2A and C) and mRNA (Fig. 2B and D) levels of POU5F1/POU5F1, NANOG/NANOG and SOX2/SOX2 in CSCs, indicating that NAMPT inhibition or KD decreases the pluripotency of CSCs.
Figure 2.

NAMPT KD or inhibition decreases pluripotency and promotes differentiation in NT2/D1 cells. NT2/D1 NAMPT KD cells were subjected to (A) WB and (B) qRT-PCR analysis for pluripotency factors (POU5F1/POU5F1, NANOG/NANOG, SOX2/SOX2). (B) Cells treated with FK866 for 48 h were subjected to (C) WB and (D) qRT-PCR analysis for pluripotency factors (POU5F1/POU5F1, NANOG/NANOG, SOX2/SOX2). NT2/D1 NAMPT KD cells were subjected to (E) WB analysis for differentiation markers TUBB3 and CSN2 and (F) qRT-PCR analysis for differentiation markers TUBB3, CSN2, SPP1, GATA6, T and CDX2. NT2/D1 cells treated with FK866 for 48 h were subjected to (G) WB analysis for differentiation markers TUBB3 and CSN2 and (H) qRT-PCR analysis for differentiation markers TUBB3, CSN2, SPP1, GATA6, and CDX2. Statistical analysis was performed with the 2-tailed, Student t test with 95% confidence interval; *P values ≤ 0.05 obtained by comparing the respective data with the untreated or scrambled control.
Considering the above-mentioned decrease in pluripotency markers, we analyzed whether NAMPT KD or FK866-treated CSCs undergo differentiation. There are many different markers of differentiation that may or may not be upregulated depending on the specific lineage of the cell. Furthermore, within a population of stem cells, individual cells may undergo differentiation into different lineages, resulting in a heterogeneous population of differentiated cells. Because of this, we examined several differentiation markers that are characteristic of various lineages. These included the differentiation markers for endodermal lineage, GATA6 (GATA binding protein 6) and SPP1 (secreted phosphoprotein 1); mesodermal lineage, T (T brachyury transcription factor); ectodermal lineage, CDX2 (caudal type homeobox 2); neuronal progenitor lineage, TUBB3 (tubulin β 3 class III); and mammary epithelial lineage, CSN2 (casein β). We found that NAMPT KD increased the protein and mRNA levels of TUBB3/TUBB3 and CSN2/CSN2, and additionally increased the mRNA levels of SPP1 and GATA6 (Fig. 2E and F). Similar results were also observed following the pharmacological inhibition of NAMPT with FK866 treatment (Fig. 2G and H). Taken together, these data show that NAMPT inhibition or KD decreases the pluripotency and promotes the differentiation of CSCs.
NAMPT and POU5F1 regulate the expression of each other
POU5F1 has been established as the master regulator of pluripotency, and the basal levels of POU5F1 are critical to maintain the self-renewal and pluripotent capacity of stem cells.14 Because we observed that NAMPT KD or inhibition drastically downregulates both the protein and mRNA levels of POU5F1/POU5F1, we were interested to know whether POU5F1 reciprocally regulates NAMPT in CSCs. We found that POU5F1KD significantly decreased both the protein and mRNA levels of NAMPT/NAMPT (Fig. 3A), further highlighting the importance of NAMPT for the pluripotent capacity of CSCs. Next, because POU5F1 is known to be an essential pluripotency factor in embryonic stem cells (ESCs), we sought to confirm whether POU5F1 is essential for the maintenance of pluripotency in our system. As expected, POU5F1 KD significantly decreased the growth of NT2/D1 cells as measured by trypan blue dye exclusion as well as CFSE proliferation assay (Fig. 3B and C), and caused substantial morphological changes including a drastic increase in neurite outgrowth (Fig. 3D). Concurring with findings in ESCs28,29 and in line with its master regulator function, POU5F1 KD greatly decreased the protein and mRNA levels of NANOG/NANOG and SOX2/SOX2 (Fig. 3E). Furthermore, POU5F1 KD increased the protein and mRNA levels of TUBB3/TUBB3 and CSN2/CSN2 and also upregulated the mRNA levels of SPP1 and GATA6 (Fig. 3F). These data support observations in ESCs and other CSCs showing that POU5F1 is required to maintain pluripotency, and that regulation of NAMPT is important for the pluripotency of CSCs.
Figure 3.

POU5F1 and NAMPT regulate the expression of each other. (A) NT2/D1 POU5F1 KD cells were subjected to WB and qRT-PCR analysis for NAMPT/NAMPT protein and mRNA levels. (B) NT2/D1 POU5F1 KD cells were stained with trypan blue and counted to determine the number of viable cells after 24 and 48 h transfection (C) or labeled with CFSE and then analyzed by flow cytometry for CFSE fluorescence after 4 d of culturing. (D) Photographs were taken to show a change in cell morphology of POU5F1 KDs using 3 different shRNA clones compare with the scrambled control. (E) WB and qRT-PCR analysis were performed for pluripotency factors (NANOG/NANOG, SOX2/SOX2) and (F) differentiation markers (TUBB3/TUBB3, CSN2/CSN2, SPP1/SPP1, GATA6/GATA6). Statistical analysis was performed with the 2-tailed, Student t test with 95% confidence interval; *P values ≤ 0.05 obtained by comparing the respective data with the untreated or scrambled control. MFI, mean fluorescent intensity. Scale bar: 100 µm.
NAMPT and POU5F1 differentially regulate autophagy in cancer stem cells
Autophagy is an important process for maintaining cellular homeostasis, and is involved in both cell survival and death in a context dependent manner. NAMPT inhibition has been shown to induce autophagic cell death in several types of cancer; however, the effect of NAMPT on autophagy in CSCs has never been shown. Our data now show that the inhibition of NAMPT with KD or through a pharmacological inhibitor causes an increase in ATG5, ATG7, LC3A-II and LC3B-II proteins in CSCs (Fig. 4A and C) indicating an increase in the induction of the autophagic process. Furthermore, ATG5, ATG7, ATG12, BECN1 (Beclin 1), ULK1 (unc-51 like autophagy activating kinase 1) and SQSTM1/p62 (sequestosome 1) mRNA levels were all upregulated (Fig. 4B and D). Of note, NAMPT inhibition in CSCs causes contrasting effects on the levels of SQSTM1/SQSTM1 protein and mRNA. In the context of autophagy, SQSTM1 is required for the formation of ubiquitinated protein aggregates and interacts with LC3-II to sequester these proteins to the autophagosome for degradation. Upon autophagosome-lysosome fusion, SQSTM1 is itself degraded in the autolysosome.30 Although SQSTM1 mRNA levels were drastically upregulated, the protein levels of SQSTM1 decreased with NAMPT KD or inhibition, indicating the completion of autophagy through autophagic degradation of SQSTM1 (Fig. 4A and C). The presence of NAMPT inhibition-induced autophagic vacuoles was further determined through the use of the autophagy detection kit from Abcam (ab139484) via flow cytometry analysis. This kit uses a green fluorescent dye that selectively labels phagophores, autophagosomes, and autolysosomes. As shown in histogram overlays, NT2/D1 cells showed a significant increase in fluorescent signal following NAMPT KD or FK866 treatment (Fig. 4E and F) as compared with scrambled control, and further support our data that NAMPT KD or inhibition strongly induces autophagy in CSCs. In order to conclusively demonstrate that NAMPT KD or inhibition causes an upregulation of autophagic flux in our CSC model as opposed to the mere blocking of the autophagic degradation process, we measured the levels of SQSTM1 and LC3B-II in NAMPT KD or FK866 treated cells in the presence or absence of 2 different late-stage autophagy inhibitors, chloroquine and bafilomycin A1 (BAF). If autophagic flux is indeed upregulated in NAMPT KD or FK866-treated cells, treatment with chloroquine and/or BAF should lead to the accumulation of LC3B-II in autophagic vacuoles and enhanced LC3B-II signal in NAMPT KD and FK866-treated cells. Furthermore, if decrease in SQSTM1 levels is due to enhanced autophagic degradation, then the addition of chloroquine and/or BAF should rescue SQSTM1 levels. Our results showed that in both NAMPT KD and FK866-treated cells, chloroquine and/or BAF enhanced the upregulation of LC3B-II concommitant with a rescue in SQSTM1 levels, demonstrating the presence of enhanced autophagic flux in these cells (Fig. 4G and H).
Figure 4.
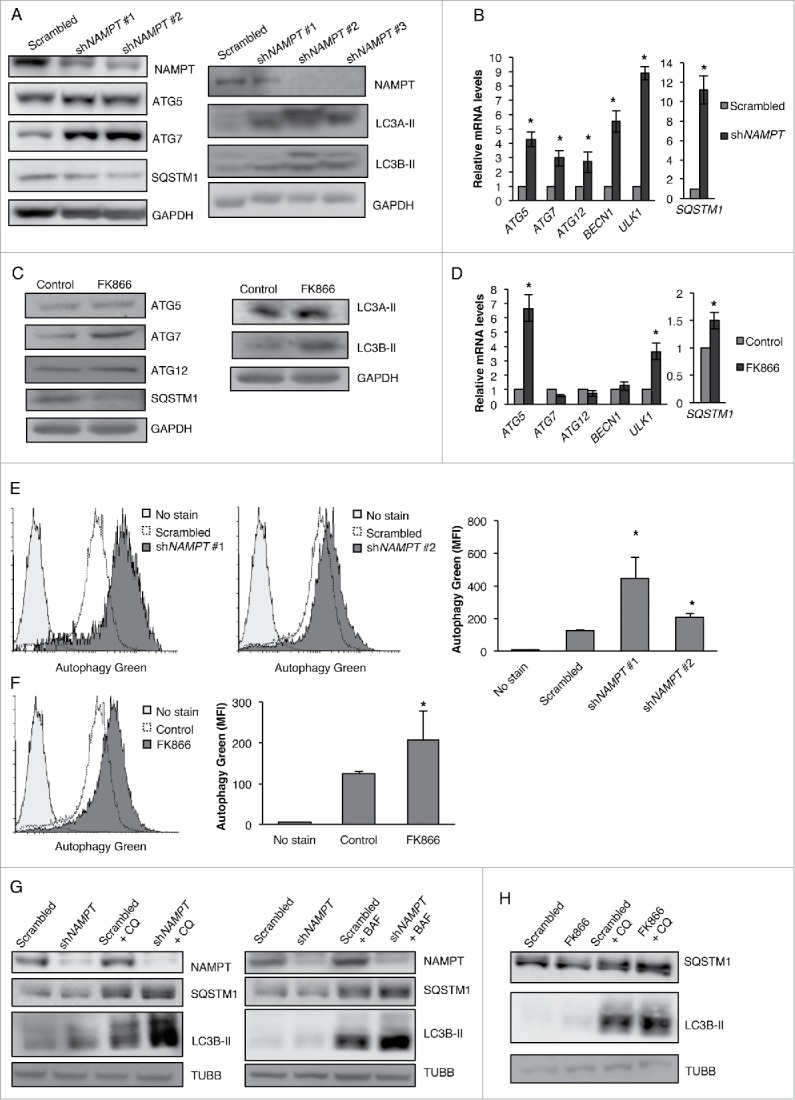
NAMPT KD or inhibition promotes autophagy in NT2/D1 cells. (A) NT2/D1 NAMPT KD cells were subjected to WB analysis for ATG5, ATG7, SQSTM1, LC3A-II and LC3B-II and (B) qRT-PCR analysis for ATG5, ATG7, ATG12, BECN1, ULK1 and SQSTM1. (C) NT2/D1 cells treated with FK866 for 48 h were subjected to WB analysis for ATG5, ATG7, ATG12, SQSTM1, LC3A-II and LC3B-II and (D) qRT-PCR analysis for ATG5, ATG7, ATG12, BECN1, ULK1 and SQSTM1. (E) NT2/D1 NAMPT KD cells and (F) cell treated with FK866 were labeled with green detection reagent from the autophagy detection kit (Abcam) and analyzed by flow cytometry to determine the presence of autophagic vacuoles. (G) NT2/D1 NAMPT KD or (H) FK866-treated cells were treated with 18 µM chloroquine (CQ) or 0.5 µM of BAF and the levels of SQSTM1, and LC3B-II were analyzed by WB analysis. Statistical analysis was performed with the 2-tailed, Student t test with 95% confidence interval; *P values ≤ 0.05 obtained by comparing the respective data with the untreated or scrambled control. MFI, mean fluorescent intensity.
In the context of our newly found connection between NAMPT and POU5F1, we also examined the levels of autophagy in POU5F1 KD cells. Surprisingly, in contrast to FK866-treated and NAMPT KD cells, POU5F1 KD in CSCs resulted in a decrease in the protein levels of ATG5, ATG7, ATG12, LC3A-II and LC3B-II (Fig. 5A), a downregulation of the mRNA levels of ATG5, ATG7, ATG12, BECN1 and ULK1 (Fig. 5B), and a reduction in the levels of autophagic vacuoles (Fig. 5C). Interestingly, POU5F1 KD CSCs demonstrated elevated levels of mRNA as well as protein levels of SQSTM1/SQSTM1, indicating a decrease in autophagic degradation (Fig. 5A and B). These observations suggest that the inhibition of POU5F1 reduces autophagy in CSCs. Taken together, results from Figs. 4 and 5 suggest that autophagy plays a very important role in regulating pluripotency, where either an upregulation or downregulation of autophagy decreases pluripotency in CSCs.
Figure 5.
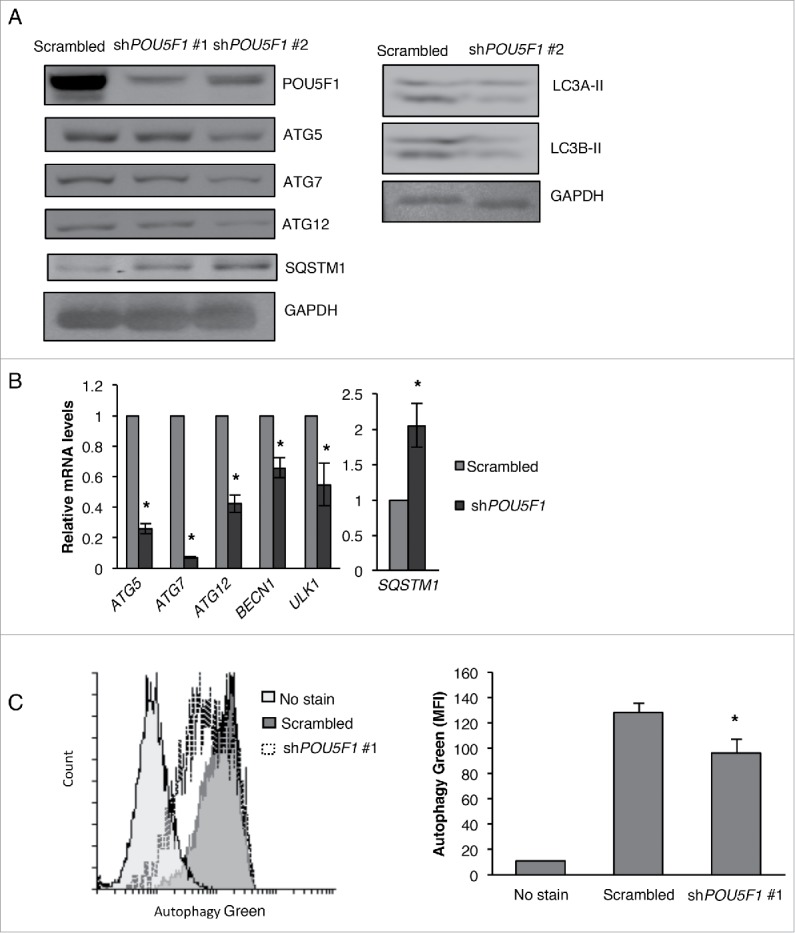
POU5F1 KD inhibits autophagy in NT2/D1 cells. (A) NT2/D1 POU5F1 KD cells were subjected to WB analysis for ATG5, ATG7, ATG12, SQSTM1, LC3A-II and LC3B-II and (B) qRT-PCR analysis for ATG5, ATG7, ATG12, BECN1, ULK1 and SQSTM1. (C) POU5F1 KD cells were labeled with green detection reagent from the autophagy detection kit (Abcam) and analyzed by flow cytometry to determine the presence of autophagic vacuoles. Statistical analysis was performed with the 2-tailed, Student t test with 95% confidence interval; *P values ≤ 0.05 obtained by comparing the respective data with the untreated or scrambled control. MFI, mean fluorescent intensity.
NAMPT and POU5F1 regulate autophagy through differential AKT-independent, p-PTEN-p-MTOR signaling
Because we observed that NAMPT and POU5F1 KD cause contrasting autophagic phenotypes in CSCs, we wished to understand the mechanism by which they control autophagy. Considering the critical role of the mitogen-activated protein kinases and AKT signaling pathways in controlling the transcription and post-translational modification of pluripotency factors (including POU5F1)10,31 as well as controlling the autophagic machinery via p-MTOR (mechanistic target of rapamycin [serine/threonine kinase])32 we examined the protein levels of p-MAPK1/3 (phosphorylated mitogen-activated protein kinase isoforms 1 and 3 at Tyr204 residue), p-AKT (Ser473) and p-MTOR (Ser2448) in CSCs with NAMPT and POU5F1 inhibition. As shown in Figures 6A and B, both NAMPT and POU5F1 KD resulted in a marked decrease in p-MAPK1/3 and p-AKT, with no significant decrease in total MAPK3 or AKT (isoforms 1, 2 and 3), suggesting that downregulation of p-MAPK1/3 and p-AKT signaling pathways may play a role in the inhibition of growth and pluripotency in NAMPT and POU5F1 KD CSCs. On the contrary, the levels of p-MTOR, a negative regulator of autophagy, were decreased in the CSCs with FK866 treatment and NAMPT KD (Fig. 6C and D), and increased in the CSCs with POU5F1 KD (Fig. 6E). We acknowledge that p-AKT is known to inhibit autophagy by promoting p-MTOR; however, we observed a downregulation of p-AKT following the inhibition of both NAMPT and POU5F1 KD in CSCs. These results suggested that p-MTOR is regulated by a factor other than p-AKT in CSCs. Considering the fact that p-PTEN (phosphatase and tensin homolog), another important regulator of autophagy, is also able to inhibit p-MTOR independent of p-AKT,33 we investigated the levels of p-PTEN in NAMPT and POU5F1 KD CSCs using WB analysis. Strikingly, the levels of p-PTEN (Ser 380) were drastically upregulated in NAMPT KD cells (Fig. 6F) and remained unchanged or slightly reduced in POU5F1 KD CSCs (Fig. 6G), suggesting that p-PTEN could promote autophagy via downregulation of p-MTOR in a p-AKT-independent manner. In summary, these results show that the contrasting autophagic phenotypes in CSCs following the inhibition of NAMPT and POU5F1 result from the differential use of p-PTEN-p-MTOR signaling independent of p-AKT.
Figure 6.
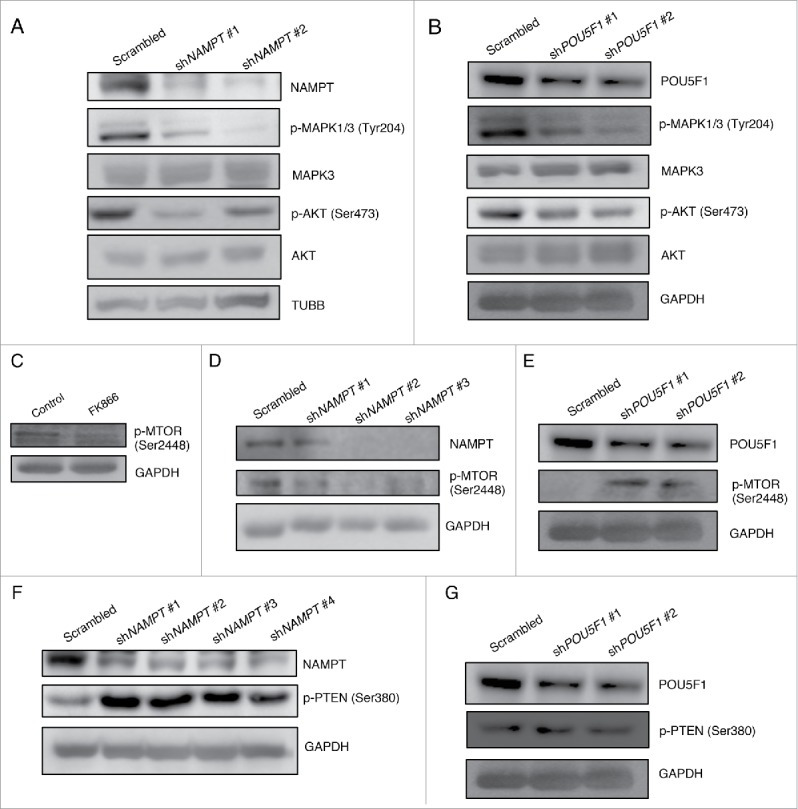
NAMPT and POU5F1 differentially regulate p-MTOR via AKT-independent p-PTEN signaling. (A) WB analysis was performed on NAMPT KD or (B) POU5F1 KD cells for p-MAPK1/3 (Tyr208), MAPK3, p-AKT (Ser473) and AKT protein levels. WB analysis was performed for (C) FK866-treated, (D) NAMPT KD or (E) POU5F1 KD cells for p-MTOR (Ser2448). WB analysis was performed for (F) NAMPT KD or (G) POU5F1 KD cells for p-PTEN (Ser380).
Changes in the basal levels of autophagy inhibit the pluripotency of cancer stem cells
Based on our observation that either NAMPT or POU5F1 KD decreases pluripotency but differentially regulates autophagy in CSCs, we wished to further determine the precise role of autophagy in the regulation of pluripotency. We were interested to see whether the downregulation or upregulation of autophagy alone was sufficient to inhibit the pluripotency of CSCs. To pursue this, we first separately knocked down the autophagy related genes ATG7 and ATG12 in CSCs, and then confirmed the inhibition of autophagic machinery by visualizing the decreased levels of autophagic vacuoles and increased levels of SQSTM1 protein (Fig. 7A and B). Strikingly, both ATG7 and ATG12 KD significantly decreased the viability and growth rate as well as proliferation of NT2/D1 CSCs (Fig. 7C and D) as compared with control shRNA cells. Similar to NAMPT and POU5F1 KD, the vast majority of these cells showed the presence of extensive neurites following ATG7 and ATG12 KD when examined under the microscope (Fig. 7E). Most importantly, the protein and mRNA levels of pluripotency factors POU5F1/POU5F1, SOX2/SOX2 and NANOG/NANOG were downregulated (Fig. 7F and G) while the protein and mRNA levels of differentiation markers TUBB3/TUBB3, CSN2/CSN2 and mRNA levels of GATA6 were upregulated in ATG7 and ATG12 KD CSCs (Fig. 7H and I), suggesting that the decrease in the basal levels of autophagy strongly limits the pluripotency of CSCs. These results for the first time show that the direct inhibition of autophagy via ATG KDs regulates the pluripotency and differentiation of CSCs.
Figure 7.
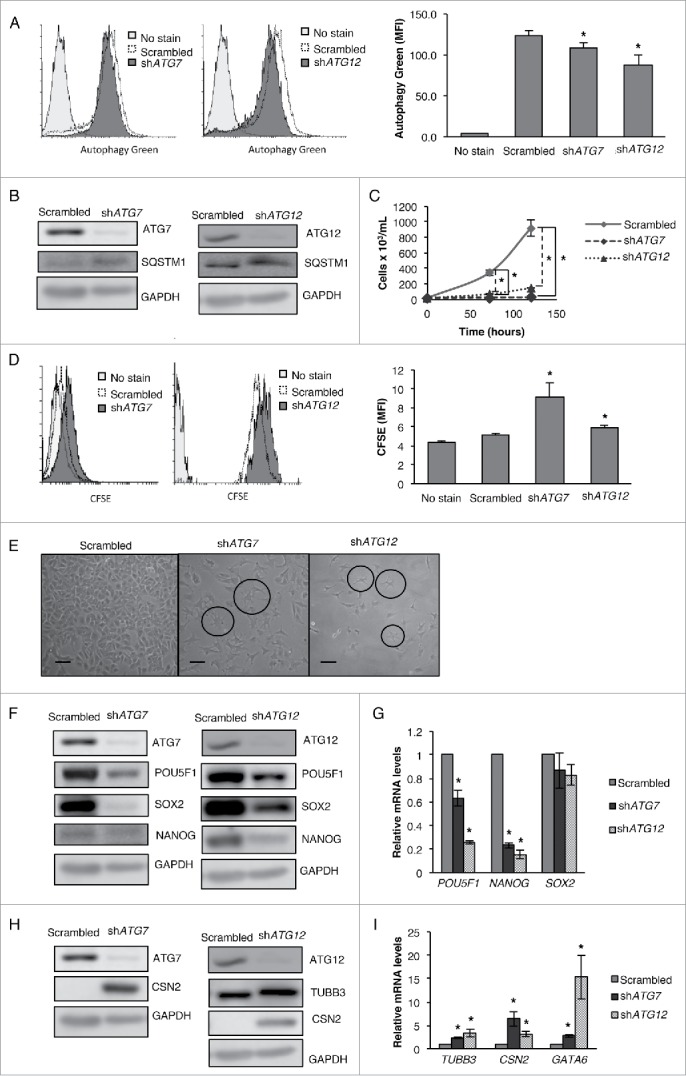
Inhibition of autophagy via ATG7 or ATG12 KD inhibits pluripotency and promotes differentiation. ATG7 or ATG12 KD cells were (A) labeled with green detection reagent from the autophagy detection kit (Abcam) and then analyzed by flow cytometry to determine the presence of autophagic vacuoles and (B) subjected to WB analysis of SQSTM1 protein levels. (C) ATG7 or ATG12 KD cells were stained with trypan blue and counted to determine the number of viable cells after 72 and 120 h transfection, (D) and labeled with CFSE and then analyzed by flow cytometry for CFSE fluorescence after 4 d of culturing. (E) Photographs were taken to show changes in cell morphology in ATG7 and ATG12 KD cells compare with the scrambled control. (F) WB and (G) qRT-PCR analysis were performed for pluripotency factors (POU5F1/POU5F1, NANOG/NANOG, SOX2/SOX2). (H) WB and (I) qRT-PCR analysis were performed for differentiation markers (TUBB3/TUBB3, CSN2/CSN2, GATA6/GATA6). Statistical analysis was performed with the 2-tailed, Student t test with 95% confidence interval; *P values ≤ 0.05 obtained by comparing the respective data with the untreated or scrambled control. MFI, mean fluorescent intensity. Scale bar: 100 µm.
Conversely, we also determined the effect of autophagy upregulation on the pluripotency of CSCs. For this purpose, we treated NT2/D1 cells with rapamycin or serum starvation to upregulate autophagy. As shown in Fig. 8, the treatment of CSCs with these autophagy-inducers increased the amount of autophagic vacuoles (Fig. 8A), upregulated LC3A-II and LC3B-II and decreased SQSTM1 at protein levels, while rapamycin treatment drastically upregulated SQSTM1 mRNA (Fig. 8B and C). Furthermore, the combination of rapamycin or serum starvation treatment with chloroquine enhanced LC3A-II and LC3B-II upregulation compare with NT2/D1 cells treated with chloroquine alone (Fig. 8D), indicating increased autophagic flux. Surprisingly, similar to ATG KDs, both rapamycin treatment and serum starvation significantly decreased the growth rate and proliferative potential of NT2/D1 cells (Fig. 8E and F); however, in contrast to NAMPT, POU5F1, and ATG KD CSCs, the morphology of these cells appeared unchanged when examined under the microscope (Fig. 8G). Interestingly, similar to ATG7 and ATG12 KD CSCs, the CSCs treated with autophagy-inducers showed reduced levels of pluripotency master regulator POU5F1 (Fig. 8H and I). However, this downregulation of POU5F1 occurred in the absence of comparable increase in the levels of differentiation related markers (Fig. 8J and K).
Figure 8.
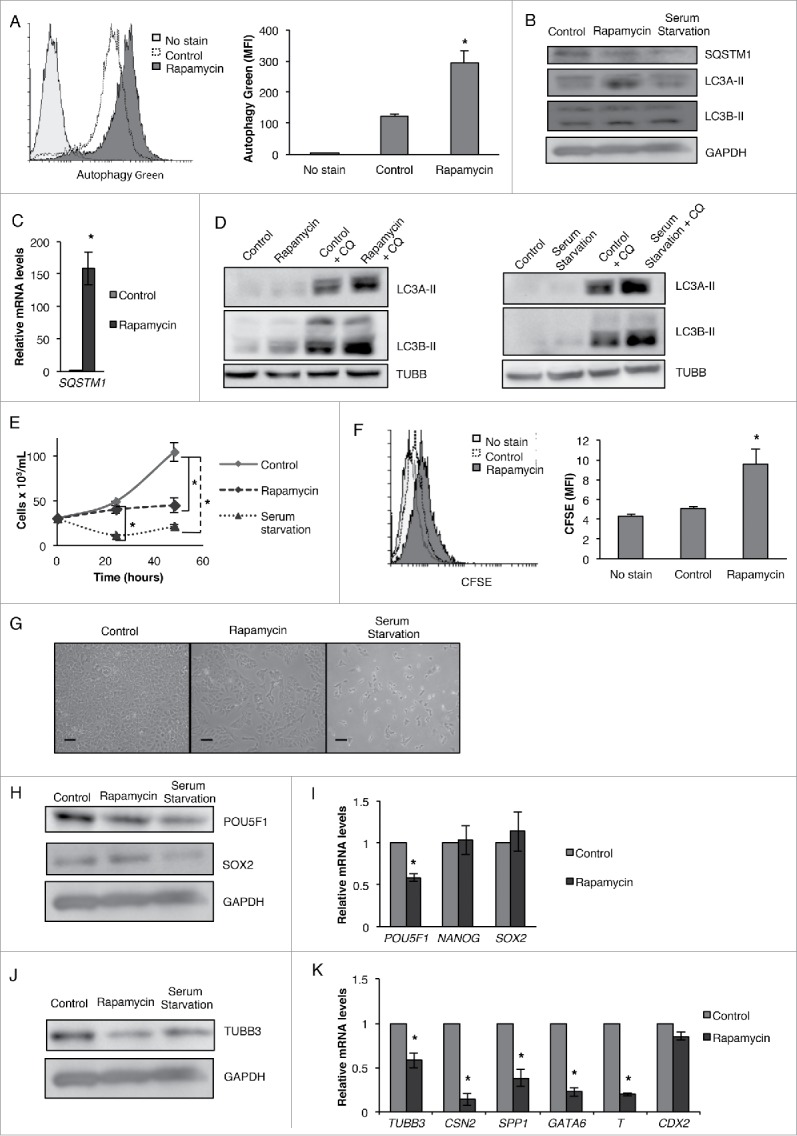
Induction of autophagy via rapamycin or serum starvation inhibits pluripotency. (A) Rapamycin-treated NT2/D1 cells were labeled with green detection reagent from the autophagy detection kit (Abcam) and then analyzed by flow cytometry to determine the presence of autophagic vacuoles. (B) NT2/D1 cells treated with rapamycin or serum starvation were subjected to WB analysis of SQSTM1, LC3A-II, and LC3B-II protein levels and (C) rapamycin-treated cells were subjected to qRT-PCR analysis of SQSTM1 mRNA levels. (D) NT2/D1 cells were treated with rapamycin or serum starvation in the presence or absence of chloroquine (CQ) (18 µM) and the levels LC3A-II and LC3B-II were analyzed by WB analysis. (E) Rapamycin and serum starvation-treated cells were stained with trypan blue and counted to determine the number of viable cells after 24 and 48 h post-treatment. (F) Rapamycin-treated cells were labeled with CFSE and then analyzed by flow cytometry for CFSE fluorescence after 4 d of culturing. (G) Photographs were taken to show cell morphology of rapamycin and serum starvation-treated NT2/D1 cells compare with the untreated control. Rapamycin and serum starvation-treated cells were subjected to (H) WB analysis and rapamycin-treated cells were subjected to (I) qRT-PCR analysis for pluripotency factors (POU5F1, NANOG, SOX2). Rapamycin and serum starvation-treated cells were subjected to (J) WB analysis and rapamycin-treated cells were subjected to (K) qRT-PCR analysis for differentiation markers (TUBB3, CSN2, SPP1, GATA6, T, CDX2). Statistical analysis was performed with the 2-tailed, Student t test with 95% confidence interval; *P values ≤ 0.05 obtained by comparing the respective data with the untreated or scrambled control. MFI, mean fluorescent intensity. Scale bar: 100 µm.
Rapamycin and serum starvation treatment are known to affect many cellular signaling and growth pathways. To negate the possible contribution of such secondary effects toward the decrease in pluripotency of CSCs, we treated NT2/D1 cells with Tat-BECN1 peptide, a potent inducer of autophagy.34 We found that Tat-BECN1 peptide treatment of NT2/D1 cells greatly enhanced LC3A-II and LC3B-II protein levels as compare with untreated and Tat-scrambled peptide control, indicating induction of autophagy (Fig. 9A), and markedly decreased cell viability (Fig. 9B). Consistent with our rapamycin and serum starvation results, Tat-BECN1 treatment greatly decreased the protein expression of pluripotency factors POU5F1, NANOG and SOX2 without upregulating the expression of differentiation markers TUBB3 and CSN2 (Fig. 9C and Fig. 9D). These data, in concurrence with our observations noted with NAMPT and POU5F1 KD in CSCs, demonstrate that basal levels of autophagy are critical for maintaining the pluripotency of cancer stem cells.
Figure 9.
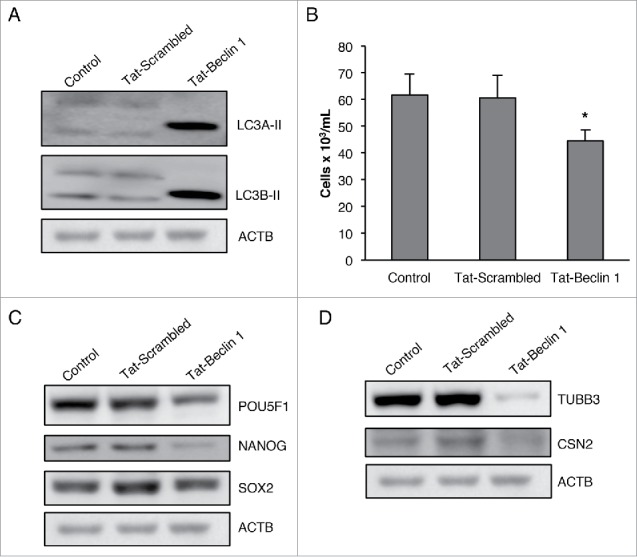
Tat-BECN1 induces autophagy and inhibits pluripotency in CSCs. (A) NT2/D1 cells treated with Tat-scrambled control peptide or Tat-BECN1 peptide were subjected to WB analysis of LC3A-II, and LC3B-II protein levels. (B) Tat-scrambled control peptide or Tat-BECN1 peptide-treated cells were stained with trypan blue and counted to determine the number of viable cells after 24 h. (C) WB analysis of Tat-scrambled and Tat-BECN1-treated cells for pluripotency factors (POU5F1, NANOG, SOX2) and (D) differentiation markers (TUBB3, CSN2). ACTB, actin β.
Autophagy-driven decrease in pluripotency is coupled with an increase in senescence in CSCs
Since rapamycin, serum starvation, or Tat-BECN1 treatment greatly inhibited the growth rate of NT2/D1 cells without inducing differentiation, we investigated whether these treatments promoted senescence in CSCs. During senescence, cells enter the Go phase of the cell cycle and remain alive and metabolically active but cease to grow or divide. This growth arrest is achieved, in part, by the increased expression of specific cyclin-dependent kinase inhibitors, including CDKN2A/p16INK4a (cyclin dependent kinase inhibitor 2A), CDKN1A/p21CIP1/WAF1 (cyclin dependent kinase inhibitor 1A), and CDKN1B/p27KIP1 (cyclin dependent kinase inhibitor 1B).35 Senescence plays an important role in regulating the pluripotency of stem cells and inhibits the proliferative capacity of adult stem cells with age.36-38 To investigate the possibility that autophagic induction in CSCs decreased growth by inhibiting their pluripotency and promoting senescence, we analyzed the levels of the senescence-related molecules CDKN1A/CDKN1A, CDKN2A/CDKN2A and CDKN1B/CDKN1B by WB and qRT-PCR. As shown in Fig. 10, we found increased protein levels of CDKN1A following rapamycin, serum starvation or Tat-BECN1 treatment as well as increased levels of CDKN2A in rapamycin and serum starvation-treated cells (Fig. 10A), which was further corroborated by significantly greater levels of CDKN1A, CDKN2A and CDKN1B mRNA in rapamycin-treated cells (Fig. 10B) as compare with the control, untreated CSCs. To further confirm that rapamycin and serum starvation treatment induce senescence in CSCs, we performed a widely used GLB1/β-galactosidase staining assay.39 Senescent cells, but not quiescent cells, hold characteristic GLB1 activity and hydrolyze the substrate X-Gal at a pH of 6 to form a blue colored precipitate.35 As shown in Fig. 10C, rapamycin-treated cells showed an increase in GLB1 activity as compare with control, suggesting that rapamycin promotes senescence in CSCs. Based on the observation that autophagy induction promotes senescence in CSCs, we next asked whether the other manipulations affecting autophagy such as ATG KD, NAMPT KD, and POU5F1 KD used in this study also promoted senescence. As shown in Fig. 10D and E, protein and mRNA levels of CDKN1A/CDKN1A and mRNA levels of CDKN1B were upregulated in ATG7 and ATG12 KD cells, and there was a marked increase in GLB1 activity as compare with the scrambled control (Fig. 10F). Furthermore, both NAMPT and POU5F1 KD also increased the protein (Fig. 10G and J) and mRNA (Fig. 10H and K) levels of CDKN1A/CDKN1A, CDKN2A/CDKN2A and CDKN1B/CDKN1B, and also increased the GLB1 activity in CSCs (Fig. 10I and L). These data demonstrate that a change in the basal levels of autophagy, either increase or decrease, promotes senescence in CSCs.
Figure 10.

Decrease in pluripotency is coupled with an increase in senescence. (A) NT2/D1 cells treated with rapamycin or serum starvation were subjected to WB analysis for CDKN1A and CDKN2A and NT2/D1 cells treated with Tat-scrambled or Tat-BECN1 peptide were subjected to WB analysis for CDKN1A (B) Rapamycin-treated cells were subjected to qRT-PCR analysis for CDKN1A, CDKN2A and CDKN1B mRNA levels. (C) GLB1 staining was performed to confirm the presence of senescent cells following rapamycin treatment. (D) ATG7 and ATG12 KD NT2/D1 cells were subjected to WB analysis for CDKN1A and (E) qRT-PCR analysis for CDKN1A and CDKN1B. (F) GLB1 staining was performed to confirm the presence of senescent cells following ATG7 and ATG12 KD. (G) NAMPT KD NT2/D1 cells were subjected to WB analysis for CDKN1A and CDKN2A and (H) qRT-PCR analysis for CDKN1A, CDKN2A and CDKN1B. (I) GLB1 staining was performed to confirm the presence of senescent cells following NAMPT KD. (J) POU5F1 KD NT2/D1 cells were subjected to WB analysis for CDKN1A and CDKN2A and (K) qRT-PCR analysis for CDKN1A, CDKN2A and CDKN1B. (L) GLB1 staining was performed to confirm the presence of senescent cells following POU5F1 KD. Statistical analysis was performed with the 2-tailed, Student t test with 95% confidence interval; *P values ≤ 0.05 obtained by comparing the respective data with the untreated or scrambled control. Scale bar: 100 µm.
To further clarify the role of senescence in regulating the pluripotency of CSCs, we investigated whether the induction of senescence in CSCs is important for the inhibition of pluripotency. To address this question, we promoted senescence in NT2/D1 cells using low doses of doxorubicin (a standard inducer of senescence).35 As shown in Fig. 11, doxorubicin-treated CSCs showed increased levels of CDKN1A protein (Fig. 11A), significantly greater expression of CDKN1A, CDKN2A and CDKN1B mRNA (Fig. 11B), and increased GLB1 activity (Fig. 11C), indicating that senescence was efficiently induced. Doxorubicin treatment significantly decreased the growth rate of NT2/D1 cells (Fig. 11D) accompanied by an increase in neurites formation (Fig. 11E) as compared with control, untreated CSCs. Interestingly, doxorubicin treatment effectively downregulated the protein and mRNA levels of pluripotency factors POU5F1/POU5F1, NANOG/NANOG and SOX2/SOX2, and upregulated the levels of TUBB3/TUBB3 and GATA6/GATA6 (Fig. 11F and G), suggesting that senescence induction inhibits the pluripotency and promotes differentiation of CSCs. Doxorubicin treatment has been shown to induce autophagy in several cancer models.40-42 However, we observed a decrease in the protein levels of ATG5, ATG7, LC3A-II and LC3B-II, as well as mRNA levels of ATG5, ATG7, ATG12, BECN1 and ULK1, and an increase in the protein levels of p-MTOR and SQSTM1 following low-dose doxorubicin treatment (Fig. 11H and I). To address the possibility that we were unable to observe upregulated LC3A-II and LC3B-II levels due to enhanced autophagic breakdown following doxorubicin treatment, we treated cells with doxorubicin and chloroquine, alone or in combination, to compare the levels of autophagic flux. Combination of doxorubicin treatment with chloroquine drastically upregulated LC3A-II and LC3B-II as compared with chloroquine treatment alone in NT2/D1 cells (Fig. 11J), indicating the presence of increased autophagic flux in doxorubicin-treated cells. Furthermore, chloroquine treatment rescued SQSTM1 levels in doxorubicin-treated cells most likely due to saturation of SQSTM1 levels; although we were unable to observe further upregulation of SQSTM1 in doxorubicin and chloroquine combination compare with chloroquine treatment alone. It is possible that autophagy-related genes such as ATG5 and ATG7 were decreased due to excessive autophagic degradation and that p-MTOR is upregulated as a feedback mechanism against doxorubicin-induced autophagy.
Figure 11.
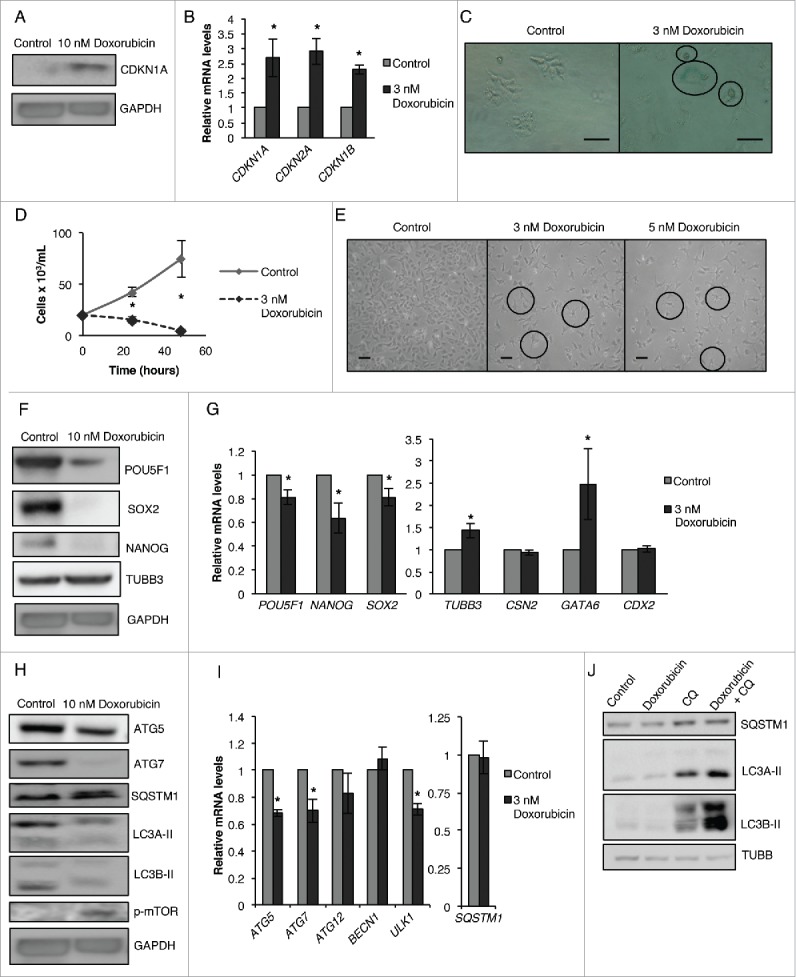
Senescence induction via doxorubicin decreases pluripotency, increases differentiation, and inhibits autophagy in NT2/D1 cells. (A) NT2/D1 cells treated with 10 nM of doxorubicin were subjected to WB analysis for CDKN1A (B) and cells treated with 3 nM of doxorubicin were subjected to qRT-PCR analysis for CDKN1A, CDKN2A and CDKN1B. (C) GLB1 staining was performed to confirm the presence of senescent cells following 3 nM doxorubicin treatment. (D) Cells treated with 3 nM of doxorubicin were stained with trypan blue and counted to determine the number of viable cells after 24 and 48 h post-treatment. (E) Photographs were taken of cells treated with 3 nM and 5 nM of doxorubicin to show changes in cell morphology compare with the untreated control. (F) Cells treated with 10 nM of doxorubicin were subjected to WB analysis for pluripotency factors (POU5F1, NANOG, SOX2) and differentiation markers (TUBB3). (G) Cells treated with 3 nM of doxorubicin were subjected to qRT-PCR analysis for pluripotency factors (POU5F1, NANOG, SOX2) and differentiation markers (TUBB3, CSN2, GATA6, CDX2). (H) Cells treated with 10 nM of doxorubicin were subjected to WB analysis for autophagy markers (ATG5, ATG7, SQSTM1, LC3A-II, LC3B-II and p-MTOR). (I) Cells treated with 3 nM of doxorubicin were subjected to qRT-PCR analysis for autophagy markers (ATG5, ATG7, ATG12, BECN1, ULK1 and SQSTM1). (J) NT2/D1 cells treated with doxorubicin (10 nM), chloroquine (CQ) (18 µM) or in combination were subjected to WB analysis for protein levels of SQSTM1, LC3A-II and LC3B-II. Statistical analysis was performed with the 2-tailed, Student t test with 95% confidence interval; *P values ≤ 0.05 obtained by comparing the respective data with the untreated or scrambled control. Scale bar: 100 µm.
These data highlight the importance of senescence in the regulation of pluripotency and differentiation of CSCs and further support our finding that changes in the basal levels of autophagy inhibit pluripotency by promoting senescence. Taken together, and in the context of our data from Fig. 1 to Fig. 8, these results elucidate the complex role of autophagy in CSC biology, and show that the basal levels of autophagy dictate the processes involved in differentiation and senescence, and these basal levels are required to maintain the pluripotency of CSCs.
Basal levels of autophagy are required for the maintenance of pluripotency in murine cancer stem cells
To further confirm our findings that an increase or decrease in the basal levels of autophagy inhibits the pluripotency of CSCs is a common phenomenon and not just a characteristic of NT2/D1 cells, we examined the mouse equivalent teratocarcinoma cell line P19.11 First, similar to NT2/D1 cells (Fig. 1C and D), we treated P19 cells with FK866 to inhibit NAMPT and examined the effect on cell growth using the CFSE-based proliferation assay. As shown in Figure S1, FK866-treated P19 cells showed undivided CFSE fluorescence, as compare with the control cells, indicating that FK866 treatment significantly inhibits the growth of P19 cells. These results confirm that NAMPT is important for the maintenance of cell proliferation in both human and mouse CSCs. Moving forward, we wished to determine whether the direct inhibition or promotion of autophagy affects the pluripotency of murine CSCs. To achieve this, we treated P19 cells with an autophagy inhibitor, 3-methyladenine (3-MA), and examined the effect on cell growth using trypan blue dye exclusion and CSFE proliferation assay. Consistent with our ATG KD data in human NT2/D1 cells, inhibition of autophagy via 3-MA treatment greatly decreased the growth rate (Fig. 12A) as well as the proliferation of P19 cells (Fig. 12B). Similarly, analysis of protein and mRNA expression in 3-MA-treated murine CSCs showed decreased levels of pluripotency markers POU5F1/Pou5f1, NANOG/Nanog and SOX2/Sox2, that were accompanied by increased levels of differentiation markers TUBB3/Tubb3, SPP1/Spp1, GATA6/Gata6, T/T and CDX2/Cdx2 as compared with untreated cells (Fig. 12C and D). These results further highlight the importance of autophagy in maintaining the pluripotency of CSCs, where inhibition of autophagy via 3-MA greatly decreases the growth and pluripotency of murine CSCs and promotes differentiation. In line with our observations in human CSCs, both rapamycin and serum starvation treatment significantly decreased the growth rate and proliferation (Fig. 12E and F), as well as SQSTM1 protein levels, in murine CSCs (Fig. 12G). Interestingly, WB analysis of rapamycin-treated cells showed a marked increase in the protein levels of POU5F1 with no significant difference in Pou5f1 mRNA levels (Fig. 12H and I). Because POU5F1 is a major pluripotency transcription factor in stem cells, its levels are tightly regulated, and either a decrease or increase in POU5F1 levels can inhibit pluripotency and promote differentiation.14 WB and qRT-PCR analysis of other important pluripotency factors showed that NANOG/Nanog and SOX2/Sox2 decreased following rapamycin treatment in P19 cells (Fig. 12H and I), further indicating the decrease in the pluripotency of murine CSCs. Furthermore, consistent with the observations in NT2/D1 cells, P19 cells demonstrated a marked increase in CDKN1A protein levels following rapamycin treatment (Fig. 12H) and demonstrated a marked decrease in pluripotency factors POU5F1, NANOG and SOX2 following doxorubicin treatment (Fig. S1B). These results from the murine CSC model further confirm the role the basal levels of autophagy play in maintaining pluripotency, and suggest that this phenomenon is not restricted to the CSCs of human origin.
Figure 12.
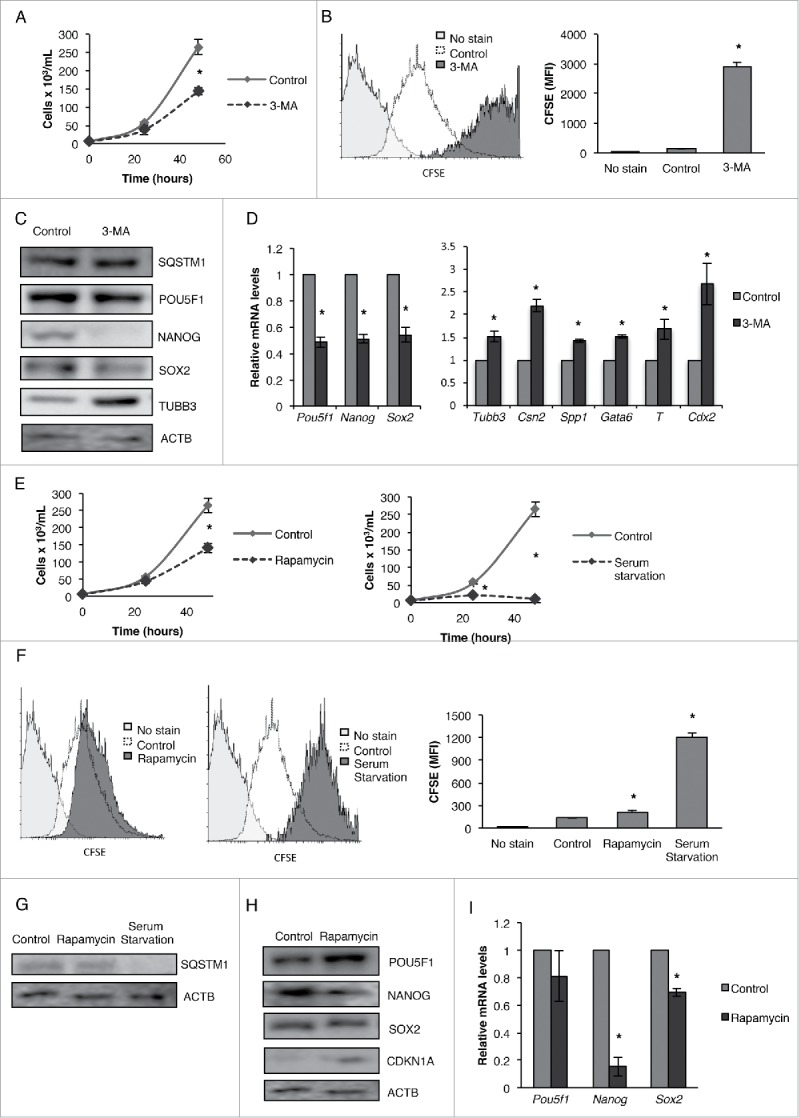
Inhibition or induction of autophagy inhibits the pluripotency of mouse teratocarcinoma stem cells (P19). Cells treated with 3-MA were (A) stained with trypan blue and counted to determine the number of viable cells after 24 and 48 h post-treatment, (B) and labeled with CFSE and then analyzed by flow cytometry after 4 d of culturing. Cells treated with 3-MA were subjected to (C) WB and (D) qRT-PCR analysis for pluripotency factors (POU5F1/Pou5f1, NANOG/Nanog, SOX2/Sox2) and differentiation markers (TUBB3/Tubb3, CSN2/Csn2, SPP1/Spp1, GATA6/Gata6, T/T, CDX2/Cdx2). Cells treated with rapamycin or serum starvation were (E) stained with trypan blue and counted to determine the number of viable cells, (F) and labeled with CFSE and then analyzed by flow cytometry after 4 d of culturing. Cells treated with rapamycin and serum starvation were subjected to (G) WB analysis for SQSTM1 protein levels and rapamycin-treated cells were subjected to (H) WB and (I) qRT-PCR analysis for pluripotency factors (POU5F1/Pou5f1, NANOG/Nanog, SOX2/Sox2) and the senescence-related protein CDKN1A/Cdkn1a. Statistical analysis was performed with the 2-tailed, Student t test with 95% confidence interval; *P values ≤ 0.05 obtained by comparing the respective data with the untreated or scrambled control. MFI, mean fluorescent intensity.
Taken together, the results from this study reveal a mechanism by which autophagy regulates the pluripotency of CSCs. Fig. 13A shows a schematic representation of the balance between pluripotency and differentiation and/or senescence in CSCs. Any change in the basal levels of autophagy, increase or decrease, offsets the balance and leads to a decrease in pluripotency and an increase in differentiation and/or senescence in CSCs. Fig. 13B depicts a summary of the roles of POU5F1 and NAMPT in the regulation of pluripotency and differentiation in CSCs. POU5F1 KD decreases the levels of pluripotency markers, increases the levels of differentiation markers, and inhibits autophagy which promotes the differentiation of CSCs. NAMPT KD decreases the levels of pluripotency markers, increases the levels of differentiation markers, and promotes autophagy which promotes the differentiation of CSCs.
Figure 13.
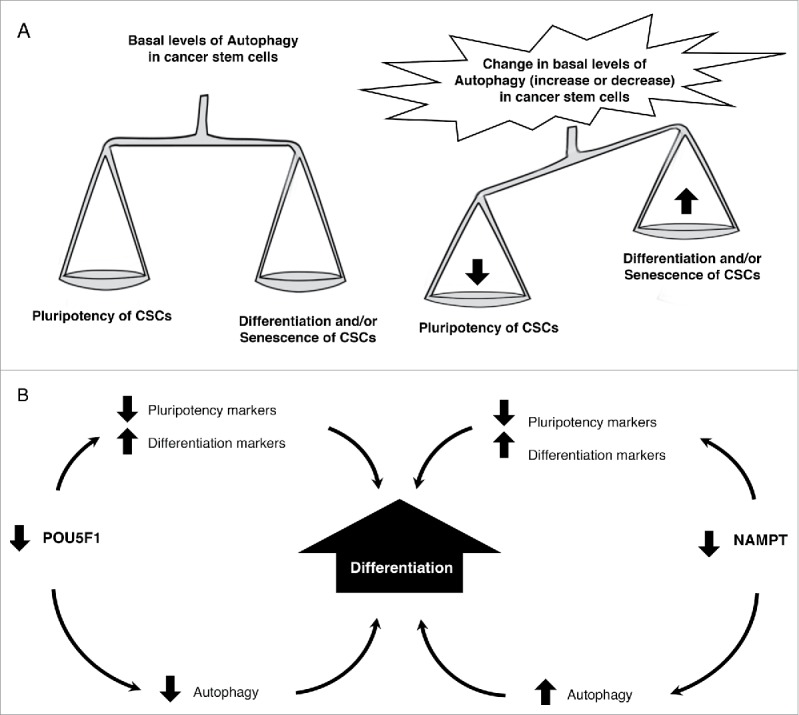
Basal levels of autophagy are required to maintain the balance between pluripotency and differentiation in cancer stem cells (CSCs). (A) Schematic representation of the balance between pluripotency and differentiation and/or senescence in CSCs. Any change in the basal levels of autophagy leads to a decrease in pluripotency and an increase in differentiation and/or senescence in CSCs. (B) POU5F1 KD decreases the levels of pluripotency markers, increases the levels of differentiation markers, and inhibits autophagy which promotes the differentiation of CSCs. NAMPT KD decreases the levels of pluripotency markers, increases the levels of differentiation markers, and promotes autophagy and the differentiation of CSCs.
Discussion
Autophagy plays a pivotal role in cell survival as well as cell death. On one hand, it aids in cell survival by removing toxic metabolites, redundant proteins, and intracellular pathogens; on the other hand, it can also promote cell death through excessive self-digestion that leads to degradation of essential cellular constituents.15 It is now clear that the apparently contrasting effects of autophagy are dictated by the biological context in which they occur, and have started to surface as a hallmark for many health and disease conditions.43 Here we show that a basal level of autophagy is required for the pluripotency of CSCs and any change in this basal level limits the pluripotency of the cells by promoting differentiation and/or senescence.
The abundant expression of various pluripotency factors such as POU5F1 allows CSCs to rapidly proliferate. POU5F1 is the most important growth factor required to maintain the self-renewal and pluripotency of CSCs and recently has emerged as a very promising target to control the pluripotency of CSCs.12,14,27 Here we show that NAMPT inhibition strongly decreases the levels of POU5F1, both at mRNA and protein levels. This effect from NAMPT inhibition or KD is coupled with a strong decrease in the pluripotency and a significant increase in the differentiation of CSCs. There is evidence that NAMPT promotes cell proliferation and survival by providing a constant supply of NAD+ which is required for a variety of biological processes.44 Here, our results show that the inhibition of the activity or levels of NAMPT decreases the expression levels of POU5F1 and other pluripotency factors such NANOG AND SOX2, and increases the levels of differentiation factors in CSCs. These data highlight the connection between the NAD+ biosynthesis pathway and the transcription factors essential for the stemness of CSCs, and show that NAMPT is crucial for the pluripotency and differentiation of CSCs.
The most important revelation from the present study pertains to the linkage between autophagy and pluripotency in CSCs. Here, we show that even though inhibition of either NAMPT or POU5F1 decreased the pluripotency of CSCs, autophagy was regulated in a contrasting manner. We found that NAMPT inhibition or KD effectively induced autophagy, while POU5F1 KD inhibited autophagy. Together, these results led us to hypothesize that basal levels of autophagy are required for the pluripotency of CSCs. Our experiments with autophagy-inducing rapamycin, serum starvation or Tat-BECN1 peptide clearly showed that autophagy induction strongly decreases the pluripotency of CSCs. Surprisingly, reduction of autophagy through the individual KDs of autophagy-related genes (ATG12 and ATG7) also decreased the pluripotency of CSCs, indicating that the change in the basal level of autophagy in CSCs is detrimental for pluripotency. In concurrence with recently published findings,45 our data suggest that, in total contrast to the dual role of autophagy in differentiated cancer cells (either prosurvival or prodeath depending upon the extent of autophagy), CSCs strictly require a basal level of autophagy for the maintenance of pluripotency.
Our studies aiming to find the mechanism behind the differential regulation of autophagy by NAMPT or POU5F1 KD identified that NAMPT and POU5F1 regulate p-MTOR, an important negative regulator of autophagy, in an opposing manner, where NAMPT KD or inhibition decreased while POU5F1 KD increased the expression of p-MTOR. Interestingly, further mechanistic studies found that p-PTEN, an upstream inhibitor of p-MTOR, is regulated differently in NAMPT or POU5F1 KD CSCs. We found that NAMPT KD increased the phosphorylation of PTEN, while POU5F1 KD had no such effect. Despite the fact that both NAMPT and POU5F1 KD strongly decreased the phosphorylation of AKT at Ser473 (which is downstream of PTEN), their regulation of p-MTOR in a total contrasting manner indicates that PTEN is able to regulate p-MTOR and therefore regulate autophagy independent of p-AKT in CSCs. These results are in line with previous studies by Liu et al.,33 showing that PTEN-mediated suppression of growth and regulation of p-MTOR in U251MG cells is independent of AKT downregulation.
Another interesting observation noted in this study showed that rapamycin, serum starvation or Tat-BECN1 peptide known as potent inducers of autophagy, strongly inhibited the pluripotency of CSCs without promoting their differentiation. These results indicate the involvement of another mechanism in rapamycin, serum starvation or Tat-BECN1 peptide mediated inhibition of pluripotency. On the other hand, there is a strong notion that activation of senescence is also linked with growth inhibition. Furthermore, very recently Garcia-Prat et al.45 have also reported that a basal level of autophagy maintains the stemness of normal muscle stem cells by preventing senescence. Such senescence is achieved by growth arrest due to increased expression of cyclin-dependent kinase inhibitors, including CDKN2A, CDKN1A and CDKN1B.35 So, we checked the levels of these standard senescence markers (CDKN2A, CDKN1A and CDKN1B) and found that their expression levels were strongly upregulated with rapamycin and serum starvation. Interestingly, we also observed that senescence induction always goes hand in hand with a change in autophagy (increase or decrease) in CSCs. These results show that a basal level of autophagy is also required to avoid senescence in CSCs.
Overall, our findings establish the connection between the NAD+ biosynthesis pathway, the transcription factors essential for the stemness of cancer cells, and autophagy. Furthermore, we conclusively demonstrate that CSCs rely on basal levels of autophagy for pluripotency, lending credence to the idea of targeting autophagy to limit the pluripotency of CSCs. Further studies focused on deciphering the crosstalk between autophagy and pluripotency in various CSCs from different origins will help the development of effective and safer therapeutic interventions for targeting CSCs. In the context of currently ongoing research on the therapeutic targeting of autophagy and unavailability of effective treatment options against CSCs, our findings represent a novel approach to target CSCs by modulating autophagy.
Materials and methods
Cell culture
Human NT2/D1 (ATCC, CRL-1973) and murine P19 (ATCC, CRL-1825) teratocarcinoma cells were maintained in Dulbecco's modified Eagle's medium (Thermo Fisher Scientific, 12430–054). The medium was supplemented with 1% antibiotic-antimycotic (Thermo Fisher Scientific, 15240–062), 1% nonessential amino acids (Thermo Fisher Scientific, 11140–050), and 10% heat-inactivated fetal bovine serum (Thermo Fisher Scientific, 12483–020). Cells were maintained at 37°C in a humidified atmosphere of 5% CO2 and 95% air.
Generation of knockdowns
NAMPT and POU5F1 KDs were generated using lentiviral plasmids expressing shRNAs specific against NAMPT (Dharmacon, RHS4533-EG10135; accession no.: NM_005746, clone ID: TRCN0000116177, TRCN0000116179, TRCN0000116178, TRCN0000116180 and TRCN0000116181), POU5F1 (Dharmacon, RHS4533-EG7161; accession number: NM_001126240, NM_001126242, NM_005427, clone IDs: TRCN0000004879, TRCN0000004881 and TRCN0000004883), ATG7 (Dharmacon, RHS39379–201739857; accession number: NM_006395, clone ID: TRCN0000007584 and TRCN0000007587), and ATG12 (Dharmacon, RHS3979–201739663; accession number: NM_004707, clone ID: TRCN0000007392). The 293T cells were cotransfected with the plasmid of interest together with the packaging (psPAX2) and envelope vector (pMD2G) using the calcium phosphate transfection method. 5 × 10⁵ NT2/D1 cells were subcultured onto 35 mm wells 24 h prior to transduction with lentivirus. The following day, cells were selected with 2 μg/mL puromycin (Thermo Fisher Scientific, A11138–03) for 2 d.
Treatment protocols, protein extraction and western blot assay
Actively growing cells were treated with FK866 (Cedarlane, 13287–5), rapamycin (Sigma-Aldrich Corporation, R0395), 3-MA (Sigma-Aldrich Corporation, M9281), doxorubicin (Santa Cruz Biotechnology, sc-200923), chloroquine (Sigma-Aldrich Corporation, C6628), or bafilomycin A1/BAF (AdipoGen International, BVT-0252-M001) at different concentrations or with the vehicle, or serum starved and incubated for the times indicated. For peptide treatment, cells were treated with 30 µM of Tat-scrambled (Anaspec, AS-65468) or Tat-beclin 1 (Tat-BECN1) peptide (Anaspec, AS-65467) for 24 h.34 Cells were then harvested and centrifuged at 200 g for 10 min at room temperature; the pellets were resuspended in RIPA buffer (25 mM Tris, pH 7.6, 150 mM NaCl, 1% NP-40 [Sigma, I3021], 1% sodium deoxycholate [Sigma, D6750] 0.1% SDS [Sigma, L3771]) containing protease inhibitors (Thermo Fisher Scientific, 78434) and incubated on ice. The cell suspensions were then sonicated and the supernatants were collected after centrifugation at 10,000 g for 15 min. Protein concentrations were determined using the Micro BCA protein assay kit (Thermo Fisher Scientific, 23235). For western blot analysis, proteins were resolved on 10% SDS-polyacrylamide gels and transferred onto nitrocellulose membranes (Bio-Rad Laboratories, 162–0115). Immunoblotting was then performed using specified antibodies.
Autophagy detection by flow cytometry
Autophagy detection kit (Abcam, ab139484) was used for detection of autophagic vacuoles in live cells according to the manufacturer's protocol. Briefly, cells were cultured overnight in standard culture conditions (37°C in a humidified atmosphere of 5% CO2 and 95% air). Cells were treated with compounds of interest at indicated concentration for the indicated time, whereas the KDs were left untreated. At the end of the treatment, cells were trypsinized and pelleted. Cells were counted and samples containing 1×10⁶ cells per mL were prepared. Cells were centrifuged at 500 g for 5 min to pellet the cells and washed with 1X Assay buffer. Cells were centrifuged and resuspended in 250 µL of phenol red-free cell culture medium. 250 µL of the diluted Green stain solution was added and mixed in each sample followed by incubation for 30 min at 37°C in the dark. Cells were mixed occasionally by pipetting up and down during the incubation. After the incubation, cells were collected by centrifugation and washed with 1X Assay buffer, then resuspended in 500 µL of fresh 1X Assay buffer and analyzed in green (FL1) channel in FACSCalibur flow cytometer (BD Biosciences, San Jose, CA, USA).
Senescence detection
Senescence was detected by using the senescence GLB1/β-galactosidase staining kit (Cell Signaling Technology, 9860) following the manufacturer's protocol. Briefly, the growth media was removed from the cells and the plate was washed one time with 1X PBS (Thermo Fisher Scientific, 10010023). Cells were fixed with the 1X Fixative solution and incubated for 15 min at room temperature. After the incubation, the plate was rinsed 2 times with 1X PBS and 1 mL of the GLB1/β-Galactosidase Staining Solution was added to each plate. All the plates were sealed with parafilm and incubated at 37°C in a dry incubator. After the final incubation, the images were captured using a light microscope (Nikon Diaphot TMD, Tokyo, Japan).
Antibodies
Antibodies against the following proteins were used for immunoblotting: NAMPT (Bethyl Laboratories, A300–372A), POU5F1/OCT4 (Santa Cruz Biotechnology, sc-5279), SOX2 (Cell Signaling Technology, 2748), NANOG (Santa Cruz Biotechnology, sc-134218), TUBB3 (Santa Cruz Biotechnology, sc-80005), CSN2 (Santa Cruz Biotechnology, sc-30041), ATG5 (Cell Signaling Technology, 8540), ATG7 (Cell Signaling Technology, 8558), ATG12 (Cell Signaling Technology, 4180), LC3A (Cell Signaling Technology, 4599), LC3B (Cell Signaling Technology, 3868), SQSTM1/p62 (Cell Signaling Technology, 5114), p-MAPK1/ERK2-MAPK3/ERK1 (p-ERK2/1) (Santa Cruz Biotechnology, sc-7383), MAPK3/ERK1) (Santa Cruz Biotechnology, sc-94), p-AKT (Ser473) (Cell Signaling Technology, 4060), AKT (pan AKT, detecting AKT1/2/3) (Cell Signaling Technology, 4691), p-MTOR (Santa Cruz Biotechnology, sc-101738), p-PTEN (Cell Signaling Technology, 9551), CDKN1A (Santa Cruz Biotechnology, sc-56335), CDKN2A (Santa Cruz Biotechnology, sc-390485), GAPDH (Santa Cruz Biotechnology, sc-365062), ACTB (Santa Cruz Biotechnology, sc-47778), and TUBB (Cell Signaling Technology, 2146).
Cell viability assays
To monitor cell growth and viability, equal numbers of cells from each sample were seeded in 6-well plates containing 2 mL of culture medium. After 24-h incubation, cells were treated with chemicals at the indicated concentrations. Adherent cells were dissociated at the indicated times with 0.05% trypsin-EDTA and then counted by trypan blue dye exclusion (Thermo Fisher Scientific, 15250061). The numbers of viable cells are presented as mean ± SEM of 3 replicates for each sample.
CFSE staining
Cell growth was also visualized and quantified with 5–(and–6) carboxyfluorescein diacetate succinimidyl ester (CFSE)-based cell proliferation assay as previously described.46,24 Briefly, CFSE (eBioscience, 65–0850–84) was used to label cells which were then cultured for 4 d and then monitored in FACSCalibur flow cytometry (BD Biosciences, San Jose, CA) for cell division through halving of CFSE fluorescence. The CSFE fluorescence halving was deconvoluted using Flowing Software (Turku Bioimaging).
Quantitative real-time PCR analysis
RNA was extracted using Trizol methodology and cDNA was synthesized using enzyme Superscript II (Thermo Fisher Scientific, 180640140). Each sample of cDNA was quantitated and diluted to a similar concentration of 10 ng/mL. The CFX96 PCR machine (Bio-Rad Laboratories, Hercules, CA) was used for the quantitative real-time PCR (qRT-PCR), using SYBR Green Supermix (Bio-Rad Laboratories, 1708880). All primers, as described in Table S1, were purchased from Invitrogen. GAPDH (glyceraldehyde-3-phosphate dehydrogenase) was used for normalization of the genes of interest. The results were collected and analyzed using the 2−ΔΔCT method and expressed as fold change relative to respective untreated or scrambled controls.
Statistical analysis
All values are expressed as means ± SEM of 3 independent experiments. Statistical evaluation was performed using the 2-tailed, Student t test with 95% confidence interval. P < 0.05 was considered as significant.
Supplementary Material
Abbreviations
- ACTB
actin β
- AKT
AKT serine/threonine kinase
- ATG5
autophagy-related 5
- ATG7
autophagy-related 7
- ATG12
autophagy-related 12
- BECN1
Beclin 1
- CSCs
cancer stem cells
- CDKN1A/p21
cyclin-dependent kinase inhibitor 1A
- CDKN1B/p27
cyclin-dependent kinase inhibitor 1B
- CDKN2A/p16
cyclin-dependent kinase inhibitor 2A
- CSN2
casein β
- ECCs
embryonal carcinoma cells
- ESCs
embryonic stem cells
- GAPDH
glyceraldehyde-3-phosphate dehydrogenase
- MAP1LC3
microtubule- associated protein 1 light chain 3
- MAPK1
mitogen-activated protein kinase isoform 1
- MAPK3
mitogen-activated protein kinase isoform 3
- NAMPT
nicotinamide phosphoribosyltransferase
- PTEN
phosphatase and tensin homolog
- POU5F1/OCT4
POU class 5 homeobox1
- SPP1
secreted phosphoprotein 1
- SQSTM1/p62
sequestosome 1
- T
T brachyury transcription factor
- TUBB
tubulin β class I
- TUBB3
tubulin β 3 class 3
- ULK1
unc-51 autophagy activating kinase 1
- WB
western blot
Disclosure of potential conflicts of interest
No potential conflicts of interest were disclosed.
Funding
This work was supported by grants from the Canadian Institute of Health Research (CIHR), from the Canadian Breast Cancer Foundation – Atlantic (CBCF), and Breast Cancer Society of Canada (BCSC)/QEII Foundation Awards for Breast Cancer Research through Beatrice Hunter Cancer Research Institute (BHCRI) to SAG and PWKL. TS, DC and YK are supported by the CIHR. PM is supported through the Cancer Research Training Program (CRTP) of BHCRI. DC was previously supported by CRTP from BHCRI, and the Nova Scotia Health Research Foundation (NSHRF). EM and CD received Summer Studentship training awards from BHCRI CBCF.
References
- [1].Polyak K, Hahn WC. Roots and stems: stem cells in cancer. Nat Med 2006; 12:296-300; PMID:16520777; http://dx.doi.org/ 10.1038/nm1379 [DOI] [PubMed] [Google Scholar]
- [2].Dean M. Cancer stem cells: Implications for cancer causation and therapy resistance. Discov Med 2005; 5:278-82; PMID:20704888 [PubMed] [Google Scholar]
- [3].Kreso A, Dick John E. Evolution of the Cancer Stem Cell Model. Cell Stem Cell 2014; 14:275-91; PMID:24607403; http://dx.doi.org/ 10.1016/j.stem.2014.02.006 [DOI] [PubMed] [Google Scholar]
- [4].Hanna JH, Saha K, Jaenisch R. Somatic cell reprogramming and transitions between pluripotent states: facts, hypotheses, unresolved issues. Cell 2010; 143:508-25; PMID:21074044; http://dx.doi.org/ 10.1016/j.cell.2010.10.008 [DOI] [PMC free article] [PubMed] [Google Scholar]
- [5].Lapidot T, Sirard C, Vormoor J, Murdoch B, Hoang T, Caceres-Cortes J, Minden M, Paterson B, Caligiuri MA, Dick JE. A cell initiating human acute myeloid leukaemia after transplantation into SCID mice. Nature 1994; 367:645-8; PMID:7509044; http://dx.doi.org/ 10.1038/367645a0 [DOI] [PubMed] [Google Scholar]
- [6].O'Brien CA, Pollett A, Gallinger S, Dick JE. A human colon cancer cell capable of initiating tumour growth in immunodeficient mice. Nature 2007; 445:106-10; PMID:17122772; http://dx.doi.org/ 10.1038/nature05372 [DOI] [PubMed] [Google Scholar]
- [7].Ricci-Vitiani L, Lombardi DG, Pilozzi E, Biffoni M, Todaro M, Peschle C, De Maria R. Identification and expansion of human colon-cancer-initiating cells. Nature 2007; 445:111-5; PMID:17122771; http://dx.doi.org/ 10.1038/nature05384 [DOI] [PubMed] [Google Scholar]
- [8].Zhou BB, Zhang H, Damelin M, Geles KG, Grindley JC, Dirks PB. Tumour-initiating cells: challenges and opportunities for anticancer drug discovery. Nat Rev Drug Discov 2009; 8:806-23; PMID:19794444; http://dx.doi.org/ 10.1038/nrd2137 [DOI] [PubMed] [Google Scholar]
- [9].Clevers H. The cancer stem cell: premises, promises and challenges. Nat Med 2011; 17:313-9; PMID:21386835; http://dx.doi.org/ 10.1038/nm.2304 [DOI] [PubMed] [Google Scholar]
- [10].Lin Y, Yang Y, Li W, Chen Q, Li J, Pan X, Zhou L, Liu C, Chen C, He J, et al.. Reciprocal regulation of Akt and Oct4 promotes the self-renewal and survival of embryonal carcinoma cells. Mol Cell 2012; 48:627-40; PMID:23041284; http://dx.doi.org/ 10.1016/j.molcel.2012.08.030 [DOI] [PMC free article] [PubMed] [Google Scholar]
- [11].Sharif T, Auger C, Bronner C, Alhosin M, Klein T, Etienne-Selloum N, Schini-Kerth VB, Fuhrmann G. Selective proapoptotic activity of polyphenols from red wine on teratocarcinoma cell, a model of cancer stem-like cell. Invest New Drugs 2011; 29:239-47; PMID:19943082; http://dx.doi.org/ 10.1007/s10637-009-9352-3 [DOI] [PubMed] [Google Scholar]
- [12].Nichols J, Zevnik B, Anastassiadis K, Niwa H, Klewe-Nebenius D, Chambers I, Scholer H, Smith A. Formation of pluripotent stem cells in the mammalian embryo depends on the POU transcription factor Oct4. Cell 1998; 95:379-91; PMID:9814708; http://dx.doi.org/ 10.1016/S0092-8674(00)81769-9 [DOI] [PubMed] [Google Scholar]
- [13].Ng HH, Surani MA. The transcriptional and signalling networks of pluripotency. Nat Cell Biol 2011; 13:490-6; PMID:21540844; http://dx.doi.org/ 10.1038/ncb0511-490 [DOI] [PubMed] [Google Scholar]
- [14].Niwa H, Miyazaki J, Smith AG. Quantitative expression of Oct-3/4 defines differentiation, dedifferentiation or self-renewal of ES cells. Nat Genet 2000; 24:372-6; PMID:10742100; http://dx.doi.org/ 10.1038/74199 [DOI] [PubMed] [Google Scholar]
- [15].Mizushima N. Autophagy: process and function. Genes Dev 2007; 21:2861-73; PMID:18006683; http://dx.doi.org/ 10.1101/gad.1599207 [DOI] [PubMed] [Google Scholar]
- [16].He C, Klionsky DJ. Regulation mechanisms and signaling pathways of autophagy. Annu Rev Genet 2009; 43:67-93; PMID:19653858; http://dx.doi.org/ 10.1146/annurev-genet-102808-114910 [DOI] [PMC free article] [PubMed] [Google Scholar]
- [17].Mathew R, Karantza-Wadsworth V, White E. Role of autophagy in cancer. Nat Rev Cancer 2007; 7:961-7; PMID:17972889; http://dx.doi.org/ 10.1038/nrc2254 [DOI] [PMC free article] [PubMed] [Google Scholar]
- [18].Levine B, Packer M, Codogno P. Development of autophagy inducers in clinical medicine. J Clin Invest 2015; 125:14-24; PMID:25654546; http://dx.doi.org/ 10.1172/JCI73938 [DOI] [PMC free article] [PubMed] [Google Scholar]
- [19].Sharif T, Ahn DG, Liu RZ, Pringle E, Martell E, Dai C, Nunokawa A, Kwak M, Clements D, Murphy JP, et al. The NAD(+) salvage pathway modulates cancer cell viability via p73. Cell Death Differ 2016; 23:669-80. PMID: 26586573; PMID:9814708; http://dx.doi.org/ 10.1038/cdd.2015.134. [DOI] [PMC free article] [PubMed] [Google Scholar]
- [20].Billington RA, Genazzani AA, Travelli C, Condorelli F. NAD depletion by FK866 induces autophagy. Autophagy 2008; 4:385-7; PMID:18227641; http://dx.doi.org/ 10.4161/auto.5635 [DOI] [PubMed] [Google Scholar]
- [21].Cea M, Cagnetta A, Fulciniti M, Tai YT, Hideshima T, Chauhan D, Roccaro A, Sacco A, Calimeri T, Cottini F, et al.. Targeting NAD+ salvage pathway induces autophagy in multiple myeloma cells via mTORC1 and extracellular signal-regulated kinase (ERK1/2) inhibition. Blood 2012; 120:3519-29; PMID:22955917; http://dx.doi.org/ 10.1182/blood-2012-03-416776 [DOI] [PMC free article] [PubMed] [Google Scholar]
- [22].Schneider L, Giordano S, Zelickson BR, M SJ, G AB, Ouyang X, Fineberg N, Darley-Usmar VM, Zhang J. Differentiation of SH-SY5Y cells to a neuronal phenotype changes cellular bioenergetics and the response to oxidative stress. Free Radic Biol Med 2011; 51:2007-17; PMID:21945098; http://dx.doi.org/ 10.1016/j.freeradbiomed.2011.08.030 [DOI] [PMC free article] [PubMed] [Google Scholar]
- [23].Ghosh N, Matsui W. Cancer stem cells in multiple myeloma. Cancer Lett 2009; 277:1-7; PMID:18809245; http://dx.doi.org/ 10.1016/j.canlet.2008.08.005 [DOI] [PMC free article] [PubMed] [Google Scholar]
- [24].Gujar SA, Michalak TI. Flow cytometric quantification of T cell proliferation and division kinetics in woodchuck model of hepatitis B. Immunol Invest 2005; 34:215-36; PMID:15921160; http://dx.doi.org/ 10.1081/IMM-200055834 [DOI] [PubMed] [Google Scholar]
- [25].Bain G, Kitchens D, Yao M, Huettner JE, Gottlieb DI. Embryonic stem cells express neuronal properties in vitro. Dev Biol 1995; 168:342-57; PMID:7729574; http://dx.doi.org/ 10.1006/dbio.1995.1085 [DOI] [PubMed] [Google Scholar]
- [26].Finley MF, Kulkarni N, Huettner JE. Synapse formation and establishment of neuronal polarity by P19 embryonic carcinoma cells and embryonic stem cells. J Neurosci 1996; 16:1056-65; PMID:8558234 [DOI] [PMC free article] [PubMed] [Google Scholar]
- [27].Takahashi K, Yamanaka S. Induction of pluripotent stem cells from mouse embryonic and adult fibroblast cultures by defined factors. Cell 2006; 126:663-76; PMID:16904174; http://dx.doi.org/ 10.1016/j.cell.2006.07.024 [DOI] [PubMed] [Google Scholar]
- [28].Rodda DJ, Chew JL, Lim LH, Loh YH, Wang B, Ng HH, Robson P. Transcriptional regulation of nanog by OCT4 and SOX2. J Biol Chem 2005; 280:24731-7; PMID:15860457; http://dx.doi.org/ 10.1074/jbc.M502573200 [DOI] [PubMed] [Google Scholar]
- [29].Chew JL, Loh YH, Zhang W, Chen X, Tam WL, Yeap LS, Li P, Ang YS, Lim B, Robson P, et al.. Reciprocal transcriptional regulation of Pou5f1 and Sox2 via the Oct4/Sox2 complex in embryonic stem cells. Mol Cell Biol 2005; 25:6031-46; PMID:15988017; http://dx.doi.org/ 10.1128/MCB.25.14.6031-6046.2005 [DOI] [PMC free article] [PubMed] [Google Scholar]
- [30].Klionsky DJ, Abdelmohsen K, Abe A, Abedin MJ, Abeliovich H, Acevedo Arozena A, Adachi H, Adams CM, Adams PD, Adeli K, et al.. Guidelines for the use and interpretation of assays for monitoring autophagy (3rd edition). Autophagy 2016; 12:1-222; PMID:26799652; http://dx.doi.org/ 10.1080/15548627.2015.1100356 [DOI] [PMC free article] [PubMed] [Google Scholar]
- [31].Li L, Sun L, Gao F, Jiang J, Yang Y, Li C, Gu J, Wei Z, Yang A, Lu R, et al.. Stk40 links the pluripotency factor Oct4 to the Erk/MAPK pathway and controls extraembryonic endoderm differentiation. Proc Natl Acad Sci 2010; 107:1402-7; http://dx.doi.org/ 10.1073/pnas.0905657107 [DOI] [PMC free article] [PubMed] [Google Scholar]
- [32].Hay N, Sonenberg N. Upstream and downstream of mTOR. Genes Dev 2004; 18:1926-45; PMID:15314020; http://dx.doi.org/ 10.1101/gad.1212704 [DOI] [PubMed] [Google Scholar]
- [33].Liu JL, Sheng X, Hortobagyi ZK, Mao Z, Gallick GE, Yung WKA. Nuclear PTEN-mediated growth suppression is independent of Akt Down-Regulation. Mol Cell Biol 2005; 25:6211-24; PMID:15988030; http://dx.doi.org/ 10.1128/MCB.25.14.6211-6224.2005 [DOI] [PMC free article] [PubMed] [Google Scholar]
- [34].Shoji-Kawata S, Sumpter R, Leveno M, Campbell GR, Zou Z, Kinch L, Wilkins AD, Sun Q, Pallauf K, MacDuff D, et al.. Identification of a candidate therapeutic autophagy-inducing peptide. Nature 2013; 494:201-6; PMID:23364696; http://dx.doi.org/ 10.1038/nature11866 [DOI] [PMC free article] [PubMed] [Google Scholar]
- [35].Ewald JA, Desotelle JA, Wilding G, Jarrard DF. Therapy-induced senescence in cancer. J Natl Cancer Inst 2010; 102:1536-46; PMID:20858887; http://dx.doi.org/ 10.1093/jnci/djq364 [DOI] [PMC free article] [PubMed] [Google Scholar]
- [36].Park IK, Qian D, Kiel M, Becker MW, Pihalja M, Weissman IL, Morrison SJ, Clarke MF. Bmi-1 is required for maintenance of adult self-renewing haematopoietic stem cells. Nature 2003; 423:302-5; PMID:12714971; http://dx.doi.org/ 10.1038/nature01587 [DOI] [PubMed] [Google Scholar]
- [37].Marques-Torrejon MA, Porlan E, Banito A, Gomez-Ibarlucea E, Lopez-Contreras AJ, Fernandez-Capetillo O, Vidal A, Gil J, Torres J, Farinas I. Cyclin-dependent kinase inhibitor p21 controls adult neural stem cell expansion by regulating Sox2 gene expression. Cell Stem Cell 2013; 12:88-100; PMID:23260487; http://dx.doi.org/ 10.1016/j.stem.2012.12.001 [DOI] [PMC free article] [PubMed] [Google Scholar]
- [38].Piccinato CA, Sertie AL, Torres N, Ferretti M, Antonioli E. High OCT4 and Low p16(INK4A) expressions determine in vitro Lifespan of Mesenchymal stem cells. Stem Cells Int 2015; 2015:369828; PMID:26089914; http://dx.doi.org/ 10.1155/2015/369828 [DOI] [PMC free article] [PubMed] [Google Scholar]
- [39].Debacq-Chainiaux F, Erusalimsky JD, Campisi J, Toussaint O. Protocols to detect senescence-associated beta-galactosidase (SA-betagal) activity, a biomarker of senescent cells in culture and in vivo. Nat Protoc 2009; 4:1798-806; PMID:20010931; http://dx.doi.org/ 10.1038/nprot.2009.191 [DOI] [PubMed] [Google Scholar]
- [40].Zhao D, Yuan H, Yi F, Meng C, Zhu Q. Autophagy prevents doxorubicininduced apoptosis in osteosarcoma. Mol Med Rep 2014; 9:1975-81; PMID:24639013 [DOI] [PubMed] [Google Scholar]
- [41].Sishi BJ, Loos B, van Rooyen J, Engelbrecht AM. Autophagy upregulation promotes survival and attenuates doxorubicin-induced cardiotoxicity. Biochem Pharmacol 2013; 85:124-34; PMID:23107818; http://dx.doi.org/ 10.1016/j.bcp.2012.10.005 [DOI] [PubMed] [Google Scholar]
- [42].Dimitrakis P, Romay-Ogando MI, Timolati F, Suter TM, Zuppinger C. Effects ofdoxorubicin cancer therapy on autophagy and the ubiquitin-proteasome system in long-term cultured adult rat cardiomyocytes. Cell Tissue Res 2012; 350:361-72; PMID:22864983; http://dx.doi.org/ 10.1007/s00441-012-1475-8 [DOI] [PubMed] [Google Scholar]
- [43].Huang J, Klionsky DJ. Autophagy and human disease. Cell Cycle 2007; 6:18349. [DOI] [PubMed] [Google Scholar]
- [44].Garten A, Petzold S, Korner A, Imai S, Kiess W. Nampt: linking NAD biology, metabolism and cancer. Trends Endocrinol Metab 2009; 20:130-8; PMID:19109034; http://dx.doi.org/ 10.1016/j.tem.2008.10.004 [DOI] [PMC free article] [PubMed] [Google Scholar]
- [45].Garcia-Prat L, Martinez-Vicente M, Perdiguero E, Ortet L, Rodriguez-Ubreva J, Rebollo E, Ruiz-Bonilla V, Gutarra S, Ballestar E, Serrano AL, et al.. Autophagy maintains stemness by preventing senescence. Nature 2016; 529:37-42; PMID:26738589; http://dx.doi.org/ 10.1038/nature16187 [DOI] [PubMed] [Google Scholar]
- [46].Gujar SA, Marcato P, Pan D, Lee PW. Reovirus virotherapy overrides tumor antigen presentation evasion and promotes protective antitumor immunity. Mol Cancer Ther 2010; 9:2924-33; PMID:20978162; http://dx.doi.org/ 10.1158/1535-7163.MCT-10-0590 [DOI] [PubMed] [Google Scholar]
Associated Data
This section collects any data citations, data availability statements, or supplementary materials included in this article.