

Abstract
Rationale & objectives
We sought to develop an abbreviated protocol (AP) for breast MRI that maximizes lesion detection by assessing each lesion not seen on mammography by each acquisition from a full diagnostic protocol (FDP).
Materials & methods
671 asymptomatic women (mean 55.7 years, range 40–80) with a negative mammogram were prospectively enrolled in this IRB approved study. All lesions on MRI not visualized on mammography were analyzed, reported, and suspicious lesions biopsied. In parallel, all FDP MRI acquisitions were scored by lesion to eventually create a high-yield AP.
Results
FDP breast MRI detected 452 findings not visible on mammography, including 17 suspicious lesions recommended for biopsy of which seven (PPV 41.2%) were malignant in six women. Mean size of the four invasive malignancies was 1.9 cm (range 0.7–4.1), all node negative; three lesions in two women were ductal carcinoma in situ. Nine biopsied lesions were benign, mean size 1.2 cm (range 0.6–2.0). All biopsied lesions were in women with dense breasts (heterogeneously or extremely dense on mammography, n = 367), for a cancer detection rate of 16.3/1000 examinations in this subpopulation. These data were used to identify four high-yield acquisitions: T2, T1-pre-contrast, T11.5, and T16 to create the AP with a scan time of 7.5 min compared to 24 min for the FDP.
Conclusions
Our analysis of a FDP MRI in a mammographically negative group identified four high-yield acquisitions that could be used for rapid screening of women for breast cancer that retains critical information on morphology, histopathology, and kinetic activity to facilitate detection of suspicious lesions.
Electronic supplementary material
The online version of this article (doi:10.1007/s10549-017-4112-0) contains supplementary material, which is available to authorized users.
Keywords: Magnetic resonance imaging, Mammography, Breast cancer, Cancer screening, Dense breast
Introduction
Breast MRI has potential for use in breast cancer screening due to its increased sensitivity over mammography. Screening breast MRI has primarily been studied in women at high risk for breast cancer [1, 2] based on multiple trials [3–7] and reflected in screening guidelines from the American Cancer Society [1, 2]. Allowing for evaluation of both tumor architecture and biological activity, MRI’s application as an effective and efficient screening tool in the general population is still evolving. The application of MRI in more general screening is hindered by high cost [8], required injection of contrast, reported high rates of false positives [9], and lack of expertise in interpretation [10]. The cost for breast MRI is due, in large part, to high fixed costs for equipment acquisition, operation, maintenance, and relatively low throughput due to exam duration.
Although early efforts with the empiric selection of limited acquisitions have been proposed [11], a systematic process at defining the appropriate type and number of acquisitions is lacking. Development of such an abbreviated MRI would be both cost and time efficient without sacrificing accuracy allowing for broader utilization of this sensitive tool. This study analyzes a full diagnostic protocol (FDP) breast MRI and uses this information to identify high-yield acquisitions to develop an abbreviated protocol (AP) for general breast cancer screening.
Materials and methods
Subjects
From 2009 to 2011, all women who obtained their routine mammograms at a community hospital or surrounding area (film screen with computer-assisted detection) were considered for eligibility in the study. All mammogram reports contained family history of breast cancer and breast density using the breast imaging reporting data system (BI-RADS) 4th edition. Women with screening mammograms, read as BI-RADS 1, negative, or 2, benign, were considered eligible as were initially incomplete examinations (BI-RADS 0) with a final BI-RADS assessment of 1, 2, or 3 after diagnostic workup. Initial BI-RADS three assessments were also eligible who received further workup, but without recommendation for biopsy, resulting in a final BI-RADS assessment 1, 2, or 3 [12]. Women with positive mammograms (BI-RADS 4a, 4b, 4c, 5, or 6) were ineligible. Other exclusion criteria included personal history of breast cancer, prior chest radiation therapy, or any MRI contraindications. Invitations and consent forms offering a breast MRI at no charge if performed within 30 days of their mammogram were sent to 1200 women of whom 671 accepted and received FDP breast MRI exams. None of the women reported having a prior breast MRI.
Process
MRI images for this prospective study were acquired at a community hospital and interpreted by an outside radiology institution conducting this research. Both facilities are American College of Radiology (ACR) certified centers in mammography and breast ultrasound. The reading institution is also ACR certified as a breast imaging center of excellence which includes breast MRI. Accuracy of the mammogram studies (films and reports) were verified by the MRI interpreting radiologist and available during MRI interpretation performed by one of four radiologists with breast MRI experience ranging from 6 to 12 years.
A standard FDP breast MRI was performed on a typical MRI scanner (Supplementary Table 1) using the following acquisitions: T2 (non-fat suppressed), STIR (Short-TI inversion recovery), T1-pre-contrast (T1-pre) prior to injection of contrast and T11, T12, T13, T14, T15, T16, and T1-high-resolution (T1HiRes) following contrast (subscript refers to minutes post-injection). The MRI acquisition data were post-processed on a CADstream system (Merge Healthcare, Chicago, IL) to create T1 subtraction images, maximum intensity projection images, and post-injection kinetic curves-color mapping using T1-pre and post-contrast T11, T12, and T16 acquisitions with a threshold of 80% change in pixel intensity. All enhancing and non-enhancing lesions not detected on mammography were evaluated and a report generated by the interpreting radiologist using pre-defined MRI interpretive criteria (Table 1). In parallel, each lesion was scored by acquisition using criteria defined in Table 2 and recorded by the supervising radiologist trained technicians allowing the interpreting radiologist’s evaluation of the MRI for the dictated report to be unbiased by the applied scores. The interpreting radiologist then reviewed the applied scores and made adjustments in fewer than 2% of the cases (Tables 4, 5).
Table 1.
Initial baseline screening breast MRI interpretive criteria
| Lesion (nodule or NME) | Malignant characteristics | Benign characteristics | Action | |
|---|---|---|---|---|
| Plateau or washout kinetic activity | Lobulated or spiculated margins | Internal septations or normal morphologic lymph node or bright on T2 | ||
| 5 mm or less | Yes | Yes | NA | Workup |
| 5 mm or less | Yes | – | NA | Annual screening |
| 5 mm or less | – | Yes | NA | Annual screening |
| 5 mm or less | – | – | NA | Annual screening |
| 6 mm or larger | Yes | – | – | Workup |
| 6 mm or larger | – | Yes | Yes or No | Workup |
| 6 mm or larger | Yes | Yes | Yes or No | Workup |
| 6 mm or larger | – | – | Yes | Annual screening |
| 6 mm or larger | Yes | – | Yes | Annual screening |
| 6 mm or larger | – | – | – | Annual screening |
| BPE - asymmetric | Yes or No | NA | N/A | Workup |
| BPE - symmetric | Yes or No | NA | N/A | Annual screening |
– no, N/A not applicable, NME non-mass enhancement, BPE background parenchymal enhancement
The bold emphasizes the requirement that futher workup is necessary
Table 2.
Scoring criteria for the full diagnostic MRI protocol
| MRI | Location | In = inside FGT Out = outside FGT None = no lesion |
| Signal intensity (relative to immediate surround tissue intensity) of: T2, STIR, T1pre-contrast, T1subtraction Images*, T1high-resolution | 0 = Lesion intensity equal to surrounding tissue +1 = Mild increased signal intensity +2 = Moderate +3 = Marked −1 = Mild decreased signal intensity −2 = Moderate decreased −3 = Marked decreased |
|
| Kinetic analysis (kinetic curve) | 0 = Flat or persistent curve below 80% threshold 1 = Persistent enhancement surpassing 80% 2 = Plateau enhancement surpassing 80% 3 = Enhancement with washout surpassing 80% |
|
| Morphologic score | N = No lesion 1 = Circumscribed margins, negative other morphologic abnormalities 2 = Partial lobulated/spiculated margins or with some other morphologic abnormality 3 = Diffuse Spiculated margins or other gross morphologic abnormality |
|
| T11 vs. T12 effect | Description of effect | |
| T13/T14/T15 requirement | Description of requirement | |
| MXR | FGT density-by-volume | 1 = 0–24% (fatty) 2 = 25–49% (scattered) 3 = 50–74% (heterogeneously dense) 4 = 75%–100% (extremely dense) |
FGT Fibroglandular tissue, MXR mammography
* Subtraction images = T11 through T16 minus T1pre-contrast (subscript = minutes following injection)
Table 4.
Values of suspicious (Biopsied) lesions (n = 17 lesions in 16 women)—scoring
| Age (years) | Location relative to FGT | T2 intensity | STIR intensity | T1-pre-contrast intensity | T11 subtraction intensity | T12 subtraction intensity | T16 subtr action intensity | T1-high-resolution intensity | Kinetic analysisa (curve) | Morphologic score | MXR density-by-volume | MXR BI-RADS | MRI BI-RADS | Size (mm) | Biopsy results | |
|---|---|---|---|---|---|---|---|---|---|---|---|---|---|---|---|---|
| Malignant | ||||||||||||||||
| Lesion 1b | 57 | In | 0 | 1 | 0 | 2 | 2 | 2 | 2 | 1 | 2 | 3 | 1 | 4 | 18 | DCIS |
| Lesion 2 | 53 | In | 0 | 0 | 0 | 2 | 2 | 3 | 3 | 1 | 2 | 4 | 3 | 4 | 66 | DCIS |
| Lesion 3 | 59 | In | 0 | 0 | 0 | 3 | 3 | 3 | 3 | 3 | 2 | 3 | 3 | 4 | 18 | IDC |
| Lesion 4 | 64 | In | 0 | 2 | 2 | 3 | 3 | 1 | 1 | 2 | 1 | 3 | 1 | 4 | 7 | IDC |
| Lesion 5 | 41 | In | 0 | 1 | 0 | 3 | 3 | 3 | 3 | 3 | 2 | 4 | 1 | 4 | 41 | ILC |
| Lesion 6 | 53 | In | 0 | 2 | 0 | 2 | 2 | 1 | 1 | 2 | 2 | 3 | 2 | 4 | 8 | IDC |
| Lesion 7b | 57 | In | 0 | 1 | 0 | 2 | 2 | 2 | 2 | 1 | 2 | 3 | 1 | 4 | 20 | DCIS |
| ADH | ||||||||||||||||
| Lesion 8 | 51 | In | 1 | 0 | 0 | 2 | 2 | 2 | 2 | 1 | 2 | 3 | 1 | 4 | 18 | ADH |
| Benign | ||||||||||||||||
| Lesion 9 | 57 | In | 0 | 2 | 0 | 2 | 2 | 2 | 2 | 1 | 1 | 3 | 2 | 4 | 19 | Fibrocystic Change |
| Lesion 10 | 40 | In | −1 | −1 | 0 | 2 | 2 | 1 | 1 | 1 | 1 | 4 | 2 | 4 | 9 | Fibroadenoma |
| Lesion 11 | 54 | In | 0 | 3 | 0 | 3 | 3 | 3 | 3 | 3 | 1 | 3 | 2 | 4 | 7 | Benign Lymph Node |
| Lesion 12 | 50 | In | 0 | 1 | 0 | 2 | 2 | 1 | 1 | 2 | 2 | 4 | 2 | 4 | 8 | Complex cyst |
| Lesion 13 | 40 | In | 1 | 3 | 0 | 1 | 1 | 2 | 2 | 0 | 1 | 3 | 1 | 4 | 6 | Fibroadenoma |
| Lesion 14 | 40 | In | 2 | 2 | 0 | 1 | 1 | 0 | 0 | 1 | 1 | 4 | 2 | 4 | 10 | Sclerosing adenosis |
| Lesion 15 | 67 | In | 0 | -2 | 0 | 3 | 3 | 1 | 1 | 3 | 1 | 3 | 1 | 4 | 10 | Papilloma |
| Lesion 16 | 68 | In | 0 | 0 | 0 | 1 | 1 | 1 | 1 | 1 | 1 | 3 | 1 | 4 | 20 | Papilloma |
| Lesion 17 | 52 | In | 0 | 3 | 0 | 3 | 3 | 1 | 1 | 3 | 2 | 3 | 1 | 4 | 20 | Papilloma sclerosing adenosis fibroadenoma |
| Average | 53 | N/A | 0.18 | 1.06 | 0.12 | 2.18 | 2.18 | 1.71 | 1.71 | 1.71 | 1.53 | 3.29 | 1.59 | 4.00 | 17.94 | N/A |
| Range | 40 to 68 | In | −1 to 2 | −2 to 2 | 0 to 2 | 1 to 3 | 1 to 3 | 0 to 3 | 0 to 3 | 0 to 3 | 1 to 2 | 3 to 4 | 1 to 3 | 4 to 4 | 6 to 66 | N/A |
Refer to Table 2 for parameter scoring definitions
ADH Atypical Ductal Hyperplasia, DCIS Ductal carcinoma in situ, FGT fibroglandular tissue, IDC Invasive ductal carcinoma, ILC invasive lobular carcinoma, MXR mammography, N/A not applicable
aKinetic curve type was derived from T1-pre-constrast, T11–2, and T16
bLesions 1 and 7 are from the same patient but in different quadrants
Table 5.
Values of non-suspicious lesions (i.e., benign, n = 435 lesions in 218 women)—scoring
| T2 intensity | STIR intensity | T1-pre-contrast intensity | T11 subtraction intensity | T12 subtraction intensity | T16 subtraction intensity | T1-high-resolution intensity | Kinetic analysisa (curve) | Morphologic score | |
|---|---|---|---|---|---|---|---|---|---|
| Cysts (C) n = 186 | 1.58 | 2.66 | 0.17 | 0.05 | 0.05 | 0.21 | 0.21 | 0.11 | 1.06 |
| BPE (B) n = 132 | 0.21 | 0.70 | 0.15 | 1.61 | 1.61 | 0.82 | 0.82 | 1.00 | 1.00 |
| Lymph nodes (L) n = 72 | −0.19 | 1.84 | 0.97 | 2.42 | 2.42 | 2.03 | 2.03 | 0.39 | 1.35 |
| Fibroadenoma (F) n = 41 | 0.63 | 2.37 | 0.71 | 1.85 | 1.85 | 1.81 | 1.81 | 0.78 | 1.49 |
| Dilated duct (D) n = 2 | 0.00 | 1.50 | 1.00 | 0.00 | 0.00 | 0.00 | 0.00 | 0.00 | 1.00 |
| Lipoma (P) n = 1 | 2.00 | 0.00 | 0.00 | 0.00 | 0.00 | 0.00 | 0.00 | 0.00 | 1.00 |
| Fat Necrosis(N) n = 1 | 3.00 | 3.00 | 3.00 | 0.00 | 0.00 | 1.00 | 1.00 | 0.00 | 1.00 |
| Suspicious lesions (n = 17)b | 0.18 | 1.06 | 0.12 | 2.18 | 2.18 | 1.71 | 1.71 | 1.71 | 1.53 |
| RATIO between suspicious & (C)* | 8.77 <0.0001 |
2.51 <0.0001 |
1.42 NS |
43.60 <0.0001 |
43.60 <0.0001 |
8.14 <0.0001 |
8.14 <0.0001 |
15.55 <0.0001 |
1.44 <0.0001 |
| RATIO between suspicious & (B)* | 1.17 NS |
0.66 NS |
1.25 NS |
1.35 <0.01 |
1.35 <0.01 |
2.09 <0.0005 |
2.09 <0.0005 |
1.71 <0.0001 |
1.53 <0.0001 |
| RATIO between suspicious & (L)* | 2.06 <0.05 |
1.74 <0.05 |
8.08 <0.001 |
0.90 NS |
0.90 NS |
0.84 NS |
0.84 NS |
4.39 <0.0001 |
1.13 NS |
| RATIO between suspicious & (F)* | 3.50 <0.05 |
2.24 <0.001 |
5.92 <0.005 |
1.18 NS |
1.18 NS |
0.95 NS |
0.95 NS |
2.19 <0.0005 |
1.03 NS |
| RATIO between suspicious & (D)c | 0.00 | 1.42 | 8.33 | 25+ | 25+ | 25+ | 25+ | 25+ | 1.53 |
| RATIO between suspicious & (P)c | 11.11 | 0.00 | 0.00 | 25+ | 25+ | 25+ | 25+ | 25+ | 1.53 |
| RATIO between suspicious & (N)c | 16.67 | 2.83 | 25.00 | 25+ | 25+ | 1.71 | 1.71 | 25+ | 1.53 |
Refer to Table 2 for parameter scoring definitions
NS statistically not significant
* p value from Wilcoxon test (<0.05 significant)
aKinetic curve type was derived from T1-pre-contrast, T11–2, and T16
bFrom Table 4
cStatistical testing not applicable due to sample size; intensities and ratios agree with clinical observations
If a lesion did not clearly meet MRI BI-RADS 1 or 2 (there were no MRI BI-RADS three assessments), an MRI BI-RADS assessment of 4a, 4b, 4c, or 5 (recorded as a 4 or 5 in Table 4) was reported and a biopsy attempt was first made by ultrasound guidance. MRI-guided biopsy was performed only after unsuccessful ultrasound biopsy in less than 10% of the cases. The data collected for this study were evaluated for the development of the AP only after completion of the two-year data collection period.
FDP breast MRI interpretive criteria and evaluative methods for abbreviated protocol development
The evaluative process of a lesion utilizes information from three basic aspects, i.e., morphology, signal response from each individual acquisition, and kinetic activity all based on the lesion’s conspicuity (intensity relative to surrounding tissue) as well as change in conspicuity following contrast. We hypothesized that an acquisition that provides greater visual conspicuity of lesion intensity improves characterization of morphology. We further considered histopathologic outcomes seeking individual acquisitions that best distinguish suspicious from non-suspicious lesions. As such, lesion conspicuity on a scale of −3 to +3 (Table 2) is presented in Table 4 for suspicious lesions and Table 5 as means for non-suspicious lesion types. As a general observation (Table 5), the mean intensity of each pre-contrast acquisition of suspicious lesions was less than the mean for non-suspicious lesions (substantiating that malignant lesions are often more difficult to see within non-enhanced breast tissue than benign lesions), and on post-contrast acquisitions, the reverse is observed. Thus, the ratios of relative intensities reported in Table 5, and ultimately plotted in Chart 2, were defined as the absolute value of non-suspicious lesion intensity divided by the suspicious lesion intensity for acquisitions prior to contrast and the reverse for acquisitions following contrast. This allows the majority of the ratios to be reported as values higher than 1 for visual discernment of a clinical interpretation of how these lesions present themselves. When the denominator of the ratio was 0, it was assigned a value of “25+”. Finally, we considered kinetic enhancement of each lesion and recorded kinetic information as one of four commonly used kinetic curves (Table 2).
Chart 2.
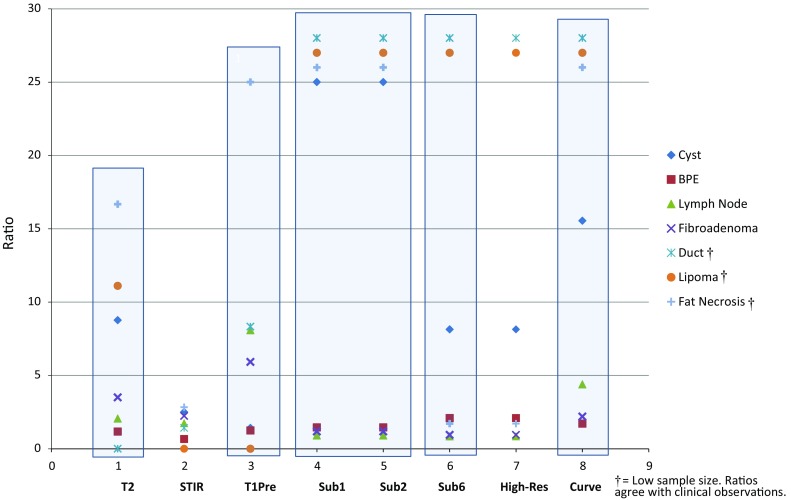
Ratios by acquisition (from Table 5)
Historically, T13, T14, and T15 post-contrast acquisitions are used for redundancy in the event patient motion causes signal degradation of one or more of the other post-contrast T1 images. No signal degradation occurred due to motion for any of our women. Therefore, these acquisitions added no value to the development of the AP, and results from these sequences are not reported in any of the tables.
The potential for increased risk of malignancy associated with increased background parenchymal enhancement (BPE) has been recently reported [13]. The inability to evaluate each focus and lack of any standard method of recording these numerous tiny lesions prompted us to create a subjective approach to reporting BPE data. Conservatively, BPE was recorded as only one unidentified mammographic finding for each quadrant of involvement, not to exceed two lesions in each breast and, regardless of signal intensity, recorded the pattern as symmetric (not requiring biopsy) or asymmetric (requiring further workup). A lesion of concern within or adjacent to an area of BPE was evaluated separately using the interpretive criteria of Table 1.
Statistical analyses
T test and its nonparametric equivalent, Wilcoxon test, were used to compare the distribution of the scores and the mean and median values for a given acquisition by comparing all suspicious lesions and all type specific non-suspicious lesions. The conclusions did not differ, and the reported p values are from the Wilcoxon test to account for non-normality and non-equality of variances in some comparisons [14]. All analyses were performed in SAS 9.4 (SAS Institute, Cary, NC). Two-sided p < 0.05 was statistically significant.
Results
Patient characteristics
From 2009 to 2011, 671 asymptomatic women received a FDP breast MRI (Table 3), mean age 55.7 years (range 40–80). Of these, 141 (21%) had a first-degree relative with breast cancer. No woman reported having a known BRCA1 or −2 pathogenic mutation.
Table 3.
Patient characteristics
| All 671 women | N (%) |
|---|---|
| Age | |
| 40–49 | 194 (28.9%) |
| 50–59 | 274 (40.8%) |
| 60–69 | 165 (24.6%) |
| 70–80 | 38 (5.7%) |
| Density-by-volume (n = 671) | |
| 0–24% (fatty) | 42 (6.3%) |
| 25–49% (scattered) | 262 (39.0%) |
| 50–74% (heterogeneously dense) | 278 (41.4%) |
| 75–100% (extremely dense) | 89 (13.3%) |
| Detected tumors (7) | |
| Clinical T-stage (n = 7)a | |
| Tis | 3 (42.9%) |
| T1 | 3 (42.9%) |
| T2 | 1 (14.2%) |
| Clinical N-stage (n = 7)a | |
| N0 | 7 (100%) |
| Pathologic T-stage (n = 7)a | |
| TXb | 3 (42.9%) |
| Tis | 1 (14.2%) |
| T1 | 3 (42.9%) |
| Pathologic N-stage (n = 7)a | |
| NXb,c | 5 (71.4%) |
| N0 | 2 (28.6%) |
aBiopsy proven DCIS or carcinoma
bTwo patients with biopsy confirmed diagnosis included the patient with 2 areas of DCIS in separate quadrants (3 lesions)
cTwo patients with clinical N0 disease did not have axillary sampling (2 lesions)
Lesion identification
Figure 1 provides the MRI screening outcomes. Of the 671 women, 367 (55%) had dense breasts (heterogeneously or extremely dense on mammography). Of these women, 164 (45%) had one or more lesions not detected on their mammograms, totaling 331 lesions. The remaining 304 (45%) had non-dense breasts (fatty or scattered fibroglandular tissue (FGT)) of whom 70 (23%) had one or more lesions not detected on mammography, totaling 121 lesions. Overall, as a result of obscuring FGT, 435 lesions in 218 women were not observed on mammography and assessed as MRI BI-RADS 1 or 2 (negative or benign) and 17/452 lesions (3.8%) were assessed as BI-RADS 4 or 5 (suspicious, requiring biopsy) in 16 women. None of the lesions fit the criteria for MRI BI-RADS assessment category 3.
Fig. 1.

Patient and lesion distribution.
Hat (^) one women with two positive quadrants, ADH Atypical ductal hyperplasia
Seventeen suspicious lesions in 16 women were biopsied (Fig. 1; Table 4) of which 7 were malignant in 6 women for a PPV3 of 41.2%. Four women were diagnosed with invasive carcinoma (mean size 1.9 cm, range 0.7–4.1), all node negative, and three lesions in two women were ductal carcinoma in situ (DCIS) (one with two areas in different quadrants) (Table 3). Although 2 of the 6 women had a final mammographic BI-RADS assessment of three prior to the MRI (one with a small nodule and the other with focal asymmetry), these mammographic findings were unrelated to the malignancies detected by MRI. All six malignancies found on MRI were among the 367 women with dense breasts for an incremental cancer detection rate of 16.3 per 1000 in this subpopulation. One additional woman, also with dense tissue, had atypical ductal hyperplasia on MRI biopsy and excision. No biopsies were prompted by MRI findings in anyone with non-dense breasts. Nine of the biopsied lesions were benign, mean size 1.2 cm, range 0.6–2.0. All pathology reports were reviewed and concordant with MRI findings.
Evaluation of lesion intensities: development of the MRI abbreviated protocol (Charts 1, 2; Table 5)
Chart 1.

Suspicious lesions vs. intensity by acquisition
Chart 1 is a plot of intensities of every biopsied lesion demonstrating each acquisition’s ability to maximize conspicuity and thereby maximize morphologic evaluation. Based on lesion enhancement only, the subtraction images surpassed all other acquisitions in this process.
Expressed in Chart 2 (using Table 5), T2 images help differentiate cysts (8.77, p < 0.0001), fibroadenomas (3.5, p < 0.05), lipomas (11.11) and fat necrosis (16.67) from suspicious lesions, and T1-pre images help differentiate the presence of lymph nodes (8.08, p < 0.001), fibroadenomas (5.92, p < 0.005), fat necrosis (25.00) and dilated ducts (8.33). Of the three pre-contrast acquisitions, STIR images were of less utility to differentiate any non-suspicious lesion from suspicious lesions relative to either T2 or T1-pre. Clinically, these findings are supported by STIR’s inability to identify lipomas as the fat signal is suppressed. Regarding fat necrosis and cysts, STIR acquisitions added no additional information that T2 or T1-pre images did not provide. Further, the characteristic pattern of dilated ducts, observed on multiple adjacent images, is so recognizable on all other acquisitions, other than T2, that STIR acquisitions are not necessary in this regard. While visualization of lymph nodes was good on STIR images, lymph nodes were better seen on T11 and T12 subtraction images, and evaluation of the hila for the presence of fat was only possible on T2 images. Diagnosing fibroadenomas involves identification of internal non-enhancing septations best observed on post-contrast images, supported by the same observation on T2 images, which are not seen on STIR images. Lastly, the ability to raise suspicion for cancer by identifying a low signal surrounded by non-suppressed fat (a higher signal) on T2 images is also not possible with STIR acquisitions. Therefore, STIR acquisitions are not deemed a necessary part of the AP.
Of the post-contrast acquisitions, T11 and T12 subtraction images had the highest ratios in four categories—cysts (43.60, p < 0.0001), lipoma (25.00), fat necrosis (25.00), duct (25.00) (Chart 2). Further, the intensities and ratios for T11 and T12 subtraction images are identical to each other in all categories for both suspicious and non-suspicious lesions. Therefore, a single T11.5 acquisition is sufficient to capture early lesion enhancement in place of T11 and T12.
T16 subtraction and T1HiRes were identical in their ability to differentiate the seven categories from suspicious lesions but to a lesser degree than T11 and T12 subtraction. Of these two acquisitions, T16 is necessary for development of important kinetic curves discussed below. Further, morphologic scores (Table 5), recorded using T1HiRes images, were low (range 1.00–1.49) as a result of dense tissue obscuring lesion margins and/or small lesions for which margins could not be evaluated. Also, Chart 1, T1HiRes images are less intense than subtraction images for morphologic evaluation. Therefore, the T11.5 subtraction image can replace the function of the T1HiRes acquisition.
Kinetic evaluation
The importance of evaluating kinetic activity, expressed as curves and reported in Chart 2, is demonstrated by its excellent differentiating ability, associated with very low p values, for five of the lesion categories. The T1-pre, T11.5, and T16 acquisitions (used to create the curves for kinetic evaluation) were mandatory for kinetic evaluation and, consequently, proved to be important to retain in the AP.
Fig. 2.

Reduction of full diagnostic protocol (FDP) to rapid protocol (RP).
The subscript of the T1 acquisitions represents the time in minutes post-injection. For the FDP, the first post-injection acquisition (T11) starts 35 s after initiation of the injection. For the RP, the first post-injection acquisition (T11.5) starts 65 s after initiation of the injection
BPE: a special circumstance
None of the acquisitions were of help in distinguishing BPE from a suspicious process (Chart 2). Further, kinetic evaluation is of no help as the activity of any of these tiny foci cannot be accurately determined as a result of size/volume averaging during the post-process development of kinetic curves. Therefore, the diagnosis of BPE must be on the basis of identifying the classic distribution of these tiny enhancing foci within one or both breasts and not on the basis of kinetic activity or intensity on any given acquisition.
The developed AP
Our evaluative process led to the following 4 acquisitions for the AP: T2, T1-pre prior to contrast, and post-contrast T11.5, and T16 (necessary for kinetic curve calculation). Maintaining T2 as the first acquisition would preclude efficiency of the AP. Therefore, this acquisition, unaffected by contrast, can be placed in the time gap between T11.5 and T16 as the final step in the development of the AP (Fig. 2). This reduces scan time from 24 to 7.5 min. Using such an AP, all 7 malignancies and 10 suspicious benign lesions would have been identified. For institutions using T15 verses T16 for evaluating kinetic activity, scan time would be 6.5 min.
Discussion
Due to overlapping tissue, lesions can be mischaracterized on mammography or missed altogether contributing to an initial PPV of recall of 4.2% (PPV1) [15]. Only after additional diagnostic imaging does PPV increase to 23.9% for biopsies recommended (PPV2) and 27.9% for biopsies actually performed (PPV3) [15]. The benefit of digital mammography over film screen is primarily limited to a subset of women of age <50 years with minimally improved PPV3 [16]. More recently, tomosynthesis has been promoted as a better screening modality. However, it only improves PPV1 to 6.4% and PPV3 to 29.2% [17] and continues use of ionizing radiation [18].
To the best of our knowledge, this is the first prospective clinical study investigating breast MRI in a general unselected female population after a negative routine mammogram that used that data to develop an AP by analyzing all lesions (suspicious and non-suspicious) missed by negative routine mammography. The findings were provocative in that all six cancers were found in the 367 women who had dense breasts at a rate of 16.3 per 1000 MRI examinations in this subset. For women with non-dense breasts, MRI did not identify any suspicious lesions. This suggests that MRI and mammography appear to serve distinct populations that could guide its future utilization.
A reported concern for screening with MRI is decreased specificity leading to increased false positives. Our standardized reading criteria (Table 1) ensured consistency and reproducibility which resulted in no repeat MRIs or supplementary imaging, other than imaging required for biopsy, for a PPV3 of 41.2%. When compared to the mammographic PPV1 of 4.2% and PPV2 of 23.9% [15], 41.2% is a large improvement for women with dense breasts and associated with a decreased rate of unnecessary biopsies. MRI improved detection of malignant lesions and better characterized a multitude of mammographically undetected benign lesions as well.
The concept of an abbreviated screening breast MRI study was recently investigated in a mild-to-moderate risk breast cancer population [11]. Even though our study was conducted at the same time as that of Kuhl et al., our approach and results differ in many respects. We evaluated all lesions (452) missed by screening mammography by each acquisition, not previously investigated in this manner, to identify the minimum required number of acquisitions for development of the AP. Kuhl et al. tested the empiric selection of only two acquisitions, one just before and one just after contrast injection without the ability to evaluate kinetic activity. Retaining kinetic/curve information is critical to accurately evaluate all lesions which also helped reduce unnecessary biopsies by nearly half. In a routine screening environment, smaller lesions would be identified in younger women, who also have more dense tissue, decreasing the ability to evaluate morphology further raising the importance of kinetic evaluation.
The standardized baseline MRI reading criteria (Table 1) allow for broader reader application, whereas Kuhl et al. stipulated their technique could only be read by breast MRI “experts.” Using kinetic data and standardized reading criteria, no woman in our study received an MRI BI-RADS assessment three (needing additional workup), whereas in Kuhl et al. 53 of 443 women, 12%, received this score. Our technique decreases uncertainty in interpretation allowing for broader application to “non-experts”. Additional facility time, scan time, cost of extra biopsies and organization resources to re-evaluate the 12% recalled in Kuhl’s et al. study, in conjunction with patient’s time and anxiety, likely outweigh the scan time advantage of 3.1 verses 7.5 min.
Multiple other centers have attempted to develop and evaluate an abbreviated MRI breast protocol; however, these were performed retrospectively, studied less generalizable populations (i.e., already had a cancer diagnosis), were not built upon a screening population in which lesions were missed on mammography, and did not analyze each independent acquisition by lesion category or evaluate the impact an abbreviated protocol might have on benign lesion identification [19–22]. Moschetta et al. studied a mixed population of patients referred for screening, problem solving, and preoperative staging, thus increasing the pre-test probability of finding cancer when imaged with MRI and obscuring the analysis [19]. Heacock et al. only utilized a population with a confirmed breast cancer diagnosis—some of which already had breast biopsy clips at the time of the MRI—thus also eliminating the ability to design an abbreviated protocol to help distinguish malignant and benign lesions if used in a screening setting [20]. Harvey et al. and Grimm et al. only studied the abbreviated MRI in a high-risk population, again limiting its applicability to a general screening environment [21, 22].
Most significantly, in these retrospective studies, there was an empiric selection of acquisitions as opposed to a more systematic approach to identify those that would have the highest yield when used on women within a screening environment. Furthermore, none of these studies identified the value and impact of breast density and its interaction with the usefulness with MRI.
Recent attention has also focused on bilateral whole breast ultrasound as a screening modality. The median ultrasound scan time in a high-risk population is reported by Berg et al. as 19 min [23], which is considerably greater than the AP MRI scan time of 7.5 min. In terms of effectiveness when studied as a screening modality in a high-risk population, Kuhl et al. reported a PPV for ultrasound of 11 versus 50% for MRI, sensitivity for ultrasound of 40 versus 91% for MRI, and specificity for ultrasound of 90.5 versus 97.2% for MRI [7]. Prospective comparisons such as this clearly demonstrate that ultrasound does not have the accuracy of MRI. This was also further reflected by Hooley et al. in which these investigators found a screening ultrasound yield in women with dense breasts of only 3.2 per 1000 women [24].
Studies suggest mammography is more sensitive for DCIS [25, 26] related to calcifications. However, another series found MRI had improved sensitivity for intermediate/high-grade DCIS over mammography [27]. DCIS not initially identified (i.e., low grade) will likely not be clinically significant or need aggressive management for which MRI screening can continue.
Even though the participants were drawn from a general population of 1200 women, only 56% accepted, which introduces the possibility of selection bias. While this rate of enrollment is similar to a prior MRI study in high-risk women [5, 28], the women willing to undergo MRI may have different baseline characteristics. Twenty-one percent had a first-degree relative with breast cancer, higher than the national average of 15% [29]. However, among the women diagnosed with breast cancer in our study, only 17% had a positive family history, similar to the national average.
At the time this study was performed, film technology was used by many facilities and considered an appropriate standard of care. Studies have since shown digital mammography can benefit certain populations [16] leading it to become the current standard. That being said, the degree of benefit from film to digital mammography is a fraction of the benefit we have demonstrated from film mammography to MRI. Compared to mammography, the benefit of MRI is most apparent in women with dense breasts, a population with well-documented challenges in all forms of mammographic imaging.
Finally, funding of the project was available for approximately 700 breast MRI examinations. Rather than apply these funds to 350 women with 350 follow-up studies of those same women, we elected to maximize the number of data points by scanning 671 women one time. Thus, a follow-up period was not part of our IRB approved study which does not allow for calculation of sensitivity, specificity, and negative predictive values.
Once our AP has been validated in an independent cohort, and used strictly in a baseline/screening environment, it will abbreviate MRI scanner time, reduce costs, and should reduce biopsies and time for reader interpretation. By retaining kinetic evaluation, our protocol allows for better lesion characterization and simplifies interpretation without detrimentally effecting overall patient/facility throughput.
Significant potential exists to improve breast cancer survival by rapid screening of women with dense breasts using this abbreviated MRI protocol and could be a supplement or even surrogate to mammographic screening of women with dense breasts, whereas mammographic technology will continue to remain the standard of care for women with fatty breasts or those that become fatty with advancing age [30].
Electronic supplementary material
Below is the link to the electronic supplementary material.
Acknowledgements
We would like to thank Wendie A. Berg, MD, Kristin Krizmanich-Conniff, MD, Kayla M. Smith, Pamela R. Teveit, and Rafael Santana-Davila, MD, for their assistance with data analysis and manuscript preparation. We would also like to thank the Dearborn Community Foundation (Lawrenceburg, IN) and the City of Lawrenceburg, IN for their support of this research.
Compliance with ethical standards
Conflict of interest
David A. Strahle has no conflict of interest with any outside equipment manufacturer, vendor, or drug manufacturer. However, he is president and co-owner of Regional Medical Imaging, PC, the coordinating institution of this study. Kiran Devisetty owns stock in Abbott Laboratories and AbbVie and served as an advisory role for Novocure. Dorothy R. Pathak, Arlene Sierra, Sukamal Saha, and Catherine Strahle declare that he/she has no conflict of interest.
Ethical approval
All procedures performed in this study involving human participates were in accordance with the ethical standards of the institutional and/or national research committee and with the 1964 Helsinki declaration and its later amendments or comparable ethical standards.
Informed consent
Informed consent was obtained from all individual participants included in the study.
Contributor Information
David A. Strahle, Phone: (810) 732-1919, Email: dstrahle@rmipc.net
Dorothy R. Pathak, Phone: (517) 353-8623, Email: pathak@msu.edu
Arlene Sierra, Phone: (517) 884-3238, Email: Arlene.Sierra@radiology.msu.edu.
Sukamal Saha, Phone: (610) 419-6525, Email: ssahadr@aol.com.
Catherine Strahle, Phone: (810) 247-1994, Email: strahlec@msu.edu.
Kiran Devisetty, Phone: (810) 342-3800, Email: kiran.devisetty@mclaren.org.
References
- 1.Saslow D, Boetes C, Burke W, et al. American Cancer Society guidelines for breast screening with MRI as an adjunct to mammography. CA Cancer J Clin. 2007;57:75–89. doi: 10.3322/canjclin.57.2.75. [DOI] [PubMed] [Google Scholar]
- 2.Lee CH, Dershaw DD, Kopans D, et al. Breast cancer screening with imaging: recommendations from the Society of Breast Imaging and the ACR on the use of mammography, breast MRI, breast ultrasound, and other technologies for the detection of clinically occult breast cancer. J Am Coll Radiol. 2010;7:18–27. doi: 10.1016/j.jacr.2009.09.022. [DOI] [PubMed] [Google Scholar]
- 3.Warner E, Messersmith H, Causer P, Eisen A, Shumak R, Plewes D. Systematic review: using magnetic resonance imaging to screen women at high risk for breast cancer. Ann Intern Med. 2008;148:671–679. doi: 10.7326/0003-4819-148-9-200805060-00007. [DOI] [PubMed] [Google Scholar]
- 4.Warner E, Hill K, Causer P, et al. Prospective study of breast cancer incidence in women with a BRCA1 or BRCA2 mutation under surveillance with and without magnetic resonance imaging. J Clin Oncol. 2011;29:1664–1669. doi: 10.1200/JCO.2009.27.0835. [DOI] [PMC free article] [PubMed] [Google Scholar]
- 5.Berg WA, Zhang Z, Lehrer D, et al. Detection of breast cancer with addition of annual screening ultrasound or a single screening MRI to mammography in women with elevated breast cancer risk. JAMA. 2012;307:1394–1404. doi: 10.1001/jama.2012.388. [DOI] [PMC free article] [PubMed] [Google Scholar]
- 6.Passaperuma K, Warner E, Causer PA, et al. Long-term results of screening with magnetic resonance imaging in women with BRCA mutations. Br J Cancer. 2012;107:24–30. doi: 10.1038/bjc.2012.204. [DOI] [PMC free article] [PubMed] [Google Scholar]
- 7.Kuhl CK, Schrading S, Leutner CC, et al. Mammography, breast ultrasound, and magnetic resonance imaging for surveillance of women at high familial risk for breast cancer. J Clin Oncol. 2005;23:8469–8476. doi: 10.1200/JCO.2004.00.4960. [DOI] [PubMed] [Google Scholar]
- 8.Griebsch I, Brown J, Boggis C, et al. Cost-effectiveness of screening with contrast enhanced magnetic resonance imaging vs X-ray mammography of women at a high familial risk of breast cancer. Br J Cancer. 2006;95:801–810. doi: 10.1038/sj.bjc.6603356. [DOI] [PMC free article] [PubMed] [Google Scholar]
- 9.Kriege M, Brekelmans CT, Boetes C, et al. Differences between first and subsequent rounds of the MRISC breast cancer screening program for women with a familial or genetic predisposition. Cancer. 2006;106:2318–2326. doi: 10.1002/cncr.21863. [DOI] [PubMed] [Google Scholar]
- 10.Obdeijn IM, Loo CE, Rijnsburger AJ, et al. Assessment of false-negative cases of breast MR imaging in women with a familial or genetic predisposition. Breast Cancer Res Treat. 2010;119:399–407. doi: 10.1007/s10549-009-0607-7. [DOI] [PubMed] [Google Scholar]
- 11.Kuhl CK, Schrading S, Strobel K, Schild HH, Hilgers RD, Bieling HB. Abbreviated breast magnetic resonance imaging (MRI): first postcontrast subtracted images and maximum-intensity projection—a novel approach to breast cancer screening with MRI. J Clin Oncol. 2014;32:2304–2310. doi: 10.1200/JCO.2013.52.5386. [DOI] [PubMed] [Google Scholar]
- 12.D’Orsi CJ, Sickles E, Mendelson E, Morris E. ACR BI-RADS atlas, breast imaging reporting and data system—mammography. 5. Reston: American College of Radiology; 2013. [Google Scholar]
- 13.Dontchos BN, Rahbar H, Partridge SC, et al. Are qualitative assessments of background parenchymal enhancement, amount of fibroglandular tissue on MR images, and mammographic density associated with breast cancer risk? Radiology. 2015;276:371–380. doi: 10.1148/radiol.2015142304. [DOI] [PMC free article] [PubMed] [Google Scholar]
- 14.Rosner B. Fundamentals of biostatistics. 8. Boston: Cengage Learning; 2015. p. 888. [Google Scholar]
- 15.Consortium NCIBCS. abnormal interpretations for 2,061,691 screening mammography examinations from 2004–2008—based on BCSC data through 2009. http://breastscreening.cancer.gov/statistics/benchmarks/screening/2009/table3.html. Accessed 9 Jul 2016
- 16.Pisano ED, Gatsonis C, Hendrick E, et al. Diagnostic performance of digital versus film mammography for breast-cancer screening. N Engl J Med. 2005;353:1773–1783. doi: 10.1056/NEJMoa052911. [DOI] [PubMed] [Google Scholar]
- 17.Friedewald SM, Rafferty EA, Rose SL, et al. Breast cancer screening using tomosynthesis in combination with digital mammography. JAMA. 2014;311:2499–2507. doi: 10.1001/jama.2014.6095. [DOI] [PubMed] [Google Scholar]
- 18.Kopans DB. Mammography and radiation risk. In: Janower ML, Linston OW, editors. Radiation risk: a primer. Reston: American College of Radiology; 1996. pp. 21–22. [Google Scholar]
- 19.Moschetta M, Telegrafo M, Rella L, Stabile Ianora AA, Angelelli G. Abbreviated combined MR protocol: a new faster strategy for characterizing breast lesions. Clin Breast Cancer. 2016;16:207–211. doi: 10.1016/j.clbc.2016.02.008. [DOI] [PubMed] [Google Scholar]
- 20.Heacock L, Melsaether AN, Heller SL, et al. Evaluation of a known breast cancer using an abbreviated breast MRI protocol: correlation of imaging characteristics and pathology with lesion detection and conspicuity. Eur J Radiol. 2016;85:815–823. doi: 10.1016/j.ejrad.2016.01.005. [DOI] [PubMed] [Google Scholar]
- 21.Harvey SC, Di Carlo PA, Lee B, Obadina E, Sippo D, Mullen L. An abbreviated protocol for high-risk screening breast MRI saves time and resources. J Am Coll Radiol. 2016;13:374–380. doi: 10.1016/j.jacr.2015.08.015. [DOI] [PubMed] [Google Scholar]
- 22.Grimm LJ, Soo MS, Yoon S, Kim C, Ghate SV, Johnson KS. Abbreviated screening protocol for breast MRI: a feasibility study. Acad Radiol. 2015;22:1157–1162. doi: 10.1016/j.acra.2015.06.004. [DOI] [PubMed] [Google Scholar]
- 23.Berg WA, Blume JD, Cormack JB, et al. Combined screening with ultrasound and mammography vs mammography alone in women at elevated risk of breast cancer. JAMA. 2008;299:2151–2163. doi: 10.1001/jama.299.18.2151. [DOI] [PMC free article] [PubMed] [Google Scholar]
- 24.Hooley RJ, Greenberg KL, Stackhouse RM, Geisel JL, Butler RS, Philpotts LE. Screening US in patients with mammographically dense breasts: initial experience with Connecticut Public Act 09-41. Radiology. 2012;265:59–69. doi: 10.1148/radiol.12120621. [DOI] [PubMed] [Google Scholar]
- 25.Kriege M, Brekelmans CT, Boetes C, et al. Efficacy of MRI and mammography for breast-cancer screening in women with a familial or genetic predisposition. N Engl J Med. 2004;351:427–437. doi: 10.1056/NEJMoa031759. [DOI] [PubMed] [Google Scholar]
- 26.Leach MO, Boggis CR, Dixon AK, et al. Screening with magnetic resonance imaging and mammography of a UK population at high familial risk of breast cancer: a prospective multicentre cohort study (MARIBS) Lancet. 2005;365:1769–1778. doi: 10.1016/S0140-6736(05)66646-9. [DOI] [PubMed] [Google Scholar]
- 27.Kuhl CK, Schrading S, Bieling HB, et al. MRI for diagnosis of pure ductal carcinoma in situ: a prospective observational study. Lancet. 2007;370:485–492. doi: 10.1016/S0140-6736(07)61232-X. [DOI] [PubMed] [Google Scholar]
- 28.Berg WA, Blume JD, Adams AM, et al. Reasons women at elevated risk of breast cancer refuse breast MR imaging screening: ACRIN 6666. Radiology. 2010;254:79–87. doi: 10.1148/radiol.2541090953. [DOI] [PMC free article] [PubMed] [Google Scholar]
- 29.American Cancer Society. What are the risk factors for breast cancer?. http://www.cancer.org/cancer/breastcancer/detailedguide/breast-cancer-risk-factors. Accessed 4 May 2016
- 30.Stomper PC, D’Souza DJ, DiNitto PA, Arredondo MA. Analysis of parenchymal density on mammograms in 1353 women 25–79 years old. Am J Roentgenol. 1996;167:1261–1265. doi: 10.2214/ajr.167.5.8911192. [DOI] [PubMed] [Google Scholar]
Associated Data
This section collects any data citations, data availability statements, or supplementary materials included in this article.