Abstract
“Is the brain ’wiring’ different between groups of populations?” is an increasingly important question with advances in diffusion MRI and abundance of network analytic tools. Recently, automatic, data-driven and computationally efficient framework for extracting brain networks using tractography and epsilon neighborhoods were proposed in the diffusion tensor imaging (DTI) literature [1]. In this paper we propose new extensions to that framework and show potential applications of such epsilon radial networks (ERN) in performing various types of neuroimage analyses. These extensions allow us to use ERNs not only to mine for topo-physical properties of the structural brain networks but also to perform classical region-of-interest (ROI) analyses in a very efficient way. Thus we demonstrate the use of ERNs as a novel image processing lens for statistical and machine learning based analyses. We demonstrate its application in an autism study for identifying topological and quantitative group differences, as well as performing classification. Finally, these views are not restricted to ERNs but can be effective for population studies using any computationally efficient network-extraction procedures.
Keywords: DTI, brain connectivity, tractography, brain networks, network measures, classification, toplogical group differences, autism
1 Introduction
Population studies on brain connectivity networks are commonly performed using resting state functional magnetic resonance imaging (fMRI). These networks are called default mode networks (DMNs) and represent functional correlations between regions of the brain under rest [2]. These networks may not directly reflect the underlying structural organization of the brain white matter (WM). Diffusion tensor imaging (DTI) is a modality of MR imaging that is an exquisitely sensitive, non-invasive method to map and characterize the microstructural properties and macroscopic organization of the WM [3]. Streamline tractography methods on DTI data, albeit with limitations, are very useful for mapping major connections in the brain faithfully [4]. They have been used to develop in vivo dissection atlases [5] and build whole structural brain networks (e.g., Fig 1. of [6]). T1-weighted images are typically used for obtaining node regions for these networks. For example in [6], the cortex was parcellated into various regions using FreeSurfer1 on a T1-weighted image. The main challenge in population studies using such brain networks is a DTI-T1 image co-registration since the problem of DTI to T1 co-registration is ill-posed and quite challenging: although there is contrast between white and grey matter in the T1-weighted images the contrast within white matter is not specific enough. More discussion on this can be found in Fig. 1 of the supplementary material2. This inter-modality image registration step forms a non-trivial hindrance for scalable studies of structural brain connectivity networks in population studies. Without a detailed evaluation study of such inter-modality registrations the connectivity analyses can be intricately confounded. Hence one of the key challenges in studying brain connectivity patterns in neuro-pathologies using DTI, short of the limitations of DTI, is efficient and unbiased designation of nodes and edges in the brain.
Fig. 1.
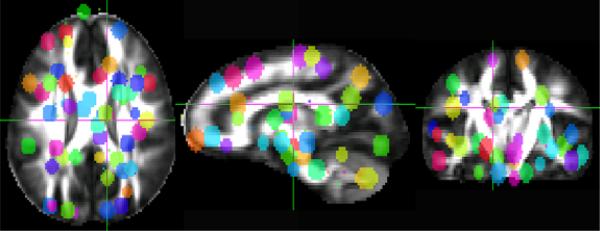
The ϵ-radial nodes on the average DTI template are shown in random colors
Recently a scalable framework that avoids the inter-modality registration has been proposed where, relying on well-validated tensor-based normalization methods, nodes are identified on the average DTI of a population using ϵ neighborhoods of end points of tracts obtained on the whole brain [1]. Some of the methods used kd-tree based search algorithms to identify the ϵ-radial nodes [7] while the others used a sequential elimination of tracts [1]. Except for the bias introduced from tractography, which is present in all streamline based methods, such a node generation does not introduce any bias from the ill-posed image registration processes. These methods are also computationally efficient: they can identify nodes and edges in a few seconds on a typical modern day computer [7].
The key extensions presented in this paper are: (1) We generate the nodes by first ordering the tracts by their length. Since the ϵ-neighborhood approaches depend on the sequence of tracts this is an important change as this removes the bias due to ordering of the tracts. (2) We enhance the edge properties by using geodesic information of the tracts and not just the count of the tracts. Such enhancements can result in increased sensitivity for statistical analyses. (3) Using the enhanced edge matrices we perform novel physio-topological as well as tract specific quantitative ROI analyses both in the setting of classical voxel based analyses (VBA) as well as classification.
2 Epsilon Radial Networks
Brain networks (BNs) are modeled similar to other network models that is as a collection of vertices (V) and edges (E). That is BN = {V, E}. Tabel 1 summarizes different modeling of the vertices and edges for contrasting with the epsilon radial networks (ERNs). In the default mode networks (DMNs) using resting fMRI, the vertices (node regions) are a function of blood oxygen level (BOLD) activations and the edges are based on temporal correlations between them. In the anatomical parcellation networks (APNs), the node regions are based on anatomical parcellation/segmentation [6]. In contrast, the nodes in ERNs are identified based on tracts themselves. This allows for identification of vertices (node regions) that have potential structural connectivity. Thus ERNs are completely DTI data-driven.
Table 1.
Different models of brain networks
| DMNs | APNs | ERNs | |
|---|---|---|---|
| V | f(BOLD activations) | f(segmentation ± registration) | f(tractography) |
| E | f(temporal correlations) | f(tractography) | f(tractography) |
The ERNs are undirected and weighted networks and are constructed by adapting the framework and algorithms introduced in [7]. Briefly, the method uses the end points of the tracts to define the nodes by clustering neighboring tract end points into a set of spheres of ϵ radius which form the nodes for constructing connectivity matrices. Let Tij denote the set of tracts connecting two vertices i, j ϵ V. The original proposal defined E = {|Tij|}i,j ϵ v. We propose that in addition to using tract counts as the edge strength, using the quantitative and physical properties using the geodesic pathway information of the tracts can enhance the ERNs.
That is we define E = {|Tij|, quant(Tij), physical(Tij)}i,j∈v. These enhanced ERNs can be more sensitive to group differences in population studies. In this paper we store the average fractional anisotropy (FA), mean diffusivity (MD) and axial diffusivity (AD) along tracts and the geodesic lengths of the tracts. Other diffusion based measures like radial diffusivity (RD), skewness, planarity, linearity and sphericalness may also be stored. In typical voxel based analyses an FWHM of 8mm smoothing is used to compensate for errors in spatial normalization. Hence we use an ∈ = 4 to match the smoothing amount. The ERN nodes on the average template are shown in Fig. 1. As can be seen, the nodes have a good coverage of the brain regions and are generally in the grey/white matter boundaries as discussed in [7].
2.1 Properties of the ERNs
The nodes and edges of ERNs provide two fold advantages: (1) Provide an efficient way to extract various quantitative measures such as average FA, MD along the WM tracts and node regions. This is possible by extracting ROI masks using V and {Tij}i,j∈v. (2) Provide an efficient way to extract various topological properties of WM organization such as Rentian scaling, characteristic path length and clustering coefficient which are described next.
(1) Rentian scaling
Imagine we can partition the vertices (V) of an ERN into n or physical partitions (e.g. cubes in a brain volume). Then it is likely that the following power law [8] holds for most of those partitions:
| (1) |
where is the number of connections crossing a partition and is the number of nodes in that partition. k is called the Rent coefficient and 0 ≤ r 1, the Rent exponent. When k = 1 and r is estimated using all the partitions from the log – log relationships as:
| (2) |
the estimated r is called Rentian scaling. If it is statistically significant for a given distribution of and , that is the connections only scale linearly in the log–log space, the network is considered efficient in terms of ”wiring cost” and physical embedding. Such features have been studied in the context of neuroimaging [9,10]. Following [8] the brain volume is partitioned into n = 5000 cubes in our experiments.
(2) Characteristic path length
The characteristic path length (CPL) of a network is defined as the average shortest path (SP) between all pairs of N vertices [11]:
| (3) |
It roughly indicates the efficiency of connectivity between regions in the network. The smaller the path length the more efficient the reachability is in a network. We would like to note the difference between this efficiency and the rentian scaling: the rentian scaling tries to characterize the efficiency in terms of resources needed to build the network while the characteristic path length tries to characterize the efficiency of the network in terms of connectivity/reachability and reflects “small worldness” of a network [11].
(3) Clustering coefficient
The clustering coefficient of a node (ν ∈ V) in a network is defined as the proportion of connections that it has to the rest of the network, i.e. the ratio of the number of edges connecting the node to the total number of possible edges that can connect the node [11]:
| (4) |
where Ev = {eνi}iϵvν and eνi is the edge strength for e.g. in ERNs it would be |Tνi|. The clustering coefficient of an ERN is defined as the average clustering coefficient of a node in that network, i.e. . The CC indicates the redundancy of connections in a network. Thus higher CC reflects the robustness of connectivity in a network. This is because the network can afford to lose some edges without losing connectivity to regions.
(4) Node-Strength
The strength of a node is a generalization of the degree of a node for weighted networks. It is defined as the sum of the weights of all edges connecting a node, i.e. . The strength of a network can be defined as the average strength of all nodes in that network, i.e. .
Thus ERNs are very useful in extracting different “views” of the DTI data for better sensitivity in neuroimage analyses. We use the implementations available in [12] to extract these measures on the ERNs.
3 ERN Analyses in Autism
In this section we present various statistical analyses performed using different properties and measures extracted from ERNs. The details of the data and preprocessing can be found in the supplementary material 2. First we look into three types of group differences: (1) Differences between average properties of the individual ERNs of the two groups. (2) Differences between the properties of the average ERNs of the two groups. (3) Differences between quantitative measures of the tissue extracted using individual ERNs, which involves quant(Ti,j). (4) Then using various features of the ERNs we perform classification using support vector machines [13]. (5) Finally we examine abnormal long vs. short range and hemispheric connectivity hypotheses in autism [14,15], which involves using physical(Ti,j).
(1) Differences between individual ERNs
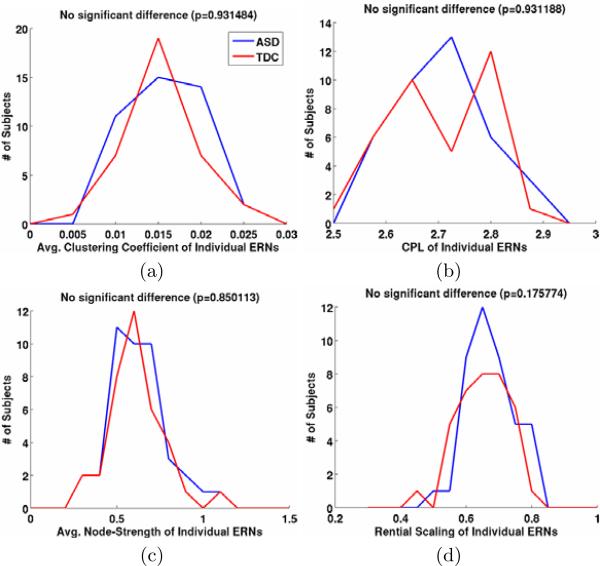
The distribution of subjects in the two groups according to CCERN, CPLERN, SERN and Rentian scaling are shown in Fig. 2. We can observe that there are no statistically significant differences between the two groups. This can be expected since the two groups are matched for age, IQ and handedness3. This also shows that our ’network-extraction process’ does not introduce any bias into identifying group differences.
Fig. 2.
The distribution of subjects in two groups according to different properties of their corresponding ERNs. (a) Average clustering coefficient, (b) Characteristic path length, (c) Average node-strength, (d) Rentian scaling. We can see that there is no statistically significant difference between the two groups in this sample-set using ERNs.
(2) Differences between the average ERNs
Let V denote the ϵ-radial nodes on the template and denote the edges of ERN of subject i. Then denotes the average ERN for the ASD group and TDCERN can be similarly defined. Fig. 3 shows the differences between the distributions of clustering coefficients of nodes, strengths of nodes and rentian scalings of ASDERN and TDCERN. Since the distributions (showed in insets) are skewed we use Kolmogorov-Smirnov test [16], instead of two-sample t tests, to compare the significance of the differences between their corresponding cumulative distribution functions (CDFs). We can observe that there is decreased clustering coefficients and node strength in the ASD relative to the TDC. These two suggest under-connectivity of white matter in autism. There is no significant difference in the rentian scaling of the two average networks. This can also be expected as we do not expect a huge difference between the “wiring costs” of the brains of high-functioning ASD and TDC.
Fig. 3.
Group differences using properties of the average ERNs. (a) Cumulative distribution function (CDF) of the nodes vs. clustering coefficient, (b) CDF of nodes vs. their strength. The significances of the differences are computed using Kolmogorov-Smirnov tests. (c) Rentian scaling with the corresponding log – log distribution of nodes in the partitions and their connections.
(3) Differences between quantitative measures
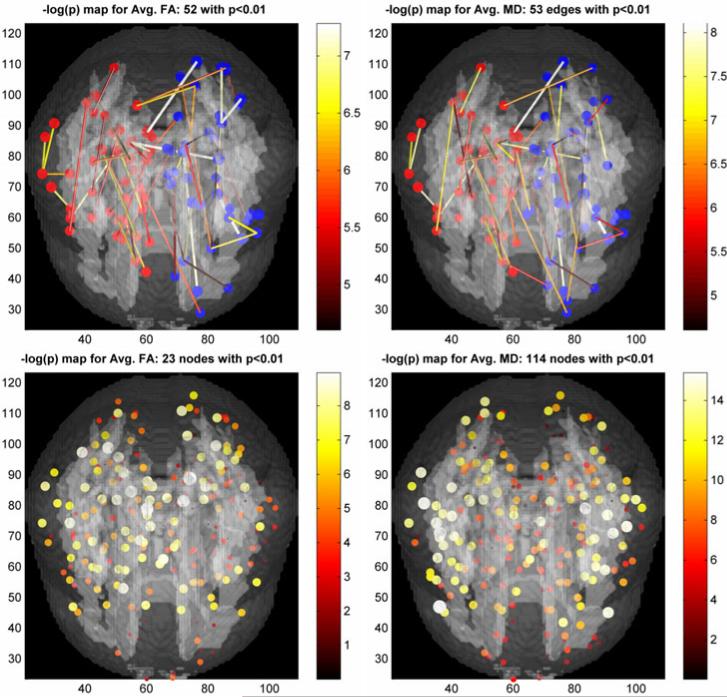
Here we perform classical ROI analyses using the masks obtained from V on the template and {Tij}i,j∈v in the individual ERNs. The group differences using average FA and average MD in those masks are shown in Fig. 4. These differences can be attributed purely to the tissue property differences and are not confounded by network extraction procedure as shown by the failure to reject null-hypotheses using individual ERNs (Fig. 2). Thus using ERNs one can look into tissue differences by holding the topological properties constant when possible.
Fig. 4.
Group differences using average quantitative measures (left - FA, right - MD) of the tissue masks obtained from V and {Tij}i,j∈v in the individual ERNs. Top row: Significant edges. The nodes in the left and right hemispheres are colored red and blue respectively. Bottom row: Significant nodes. The size of the edges and nodes are proportional to the – log(p) values.
(4) Classification
Classification is a very challenging problem in autism studies especially using DTI. General leave-one-out cross-validation accuracies reported are in the high 70% to 80% [17,7,18]. An accuracy of 90% on an independently chosen test sample was reported in [19]. In this paper we report the performance of SVM classification using features extracted from ERNs (ERN1 and ERN2) as well as basic voxel based features of the WM (VBM).
– ERN1: Average FA, MD, AD on the node-regions in V.
– ERN2: FA, MD, AD at all the voxels in the mask obtained from all the node-regions in V.
– VBM: FA, MD, AD at all the voxels in the white matter mask on the template.
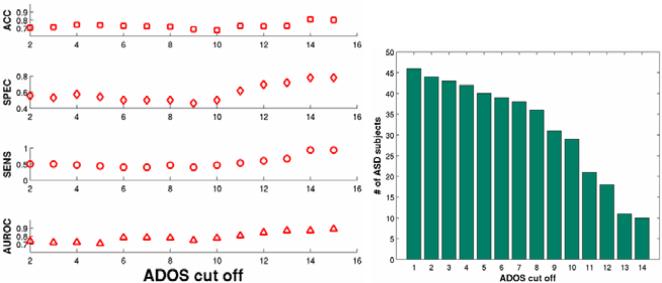
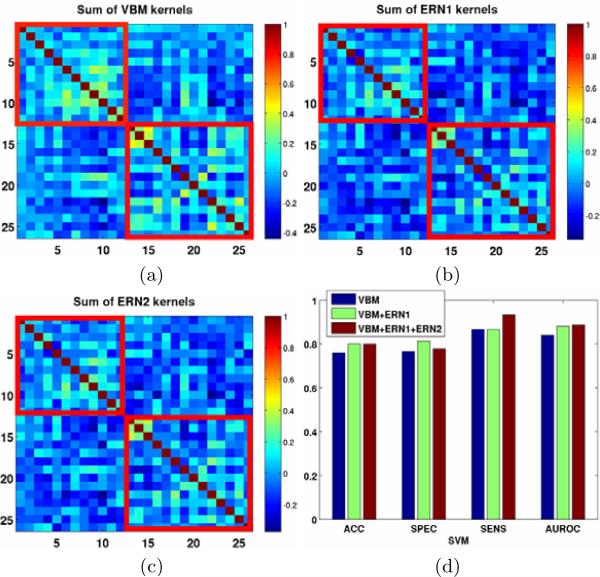
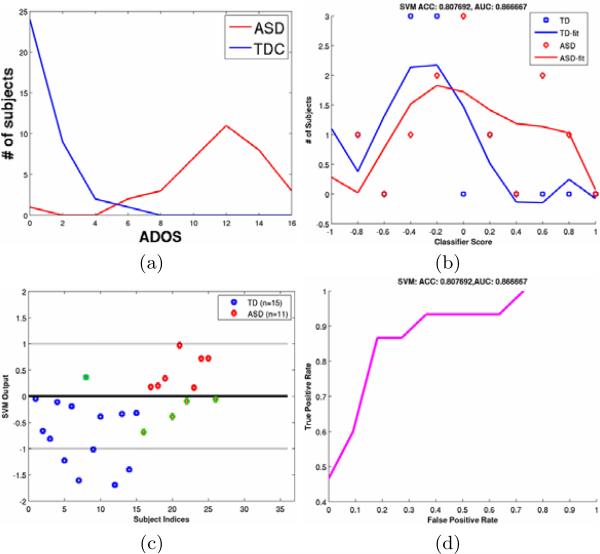
For each of the above set of features we use both linear and radial-basis kernels for SVM classification. To measure the discriminative capacity of the features, we report classification performance metrics in the leave-one-out cross-validation setting, for different bootstraps of the data. The different metrics are accuracy (ACC), specificity (SPEC), sensitivity (SENS) and area under receiver operating characteristic (ROC) curve (AUROC). For the various bootstraps, we include all the TDC subjects with ADOS < 1 and include ASD subjects for different lower thresholds of ADOS as shown in Fig. 5. As the lower threshold of the ADOS increases the classification task becomes easier as the goal becomes separating extreme cases of ASD from TDC. Figs. 6 and 7 show the classification outputs for a particular bootstrap with TDC (n = 15) and ASD (n = 11) with ADOS > 14 where the ACC and AUROC reach a maximum as shown in Fig. 5. Fig. 6 shows the sum of the kernels for VBM, ERN1 and ERN2 as well as the the improvement in classification metrics by the addition of ERN based features.
Fig. 5.
Classification performance metrics as a function of the ADOS cut off used for the inclusion of ASD subjects. The ACC and AUROC are stable and peak at a cut off of 14. The other metrics show increase and saturate around 14. The right figure shows the change in the ASD sample size as the cut off increases.
Fig. 6.
Different kernels (features) and their effect on the SVM classification performance metrics. The highlighted red boxes show intra-class similarities for ASD (top-left) and TDC (bottom-right). In an ideal situation the similarities within the boxes should be higher than the similarities outside the boxes. The improvement in classification metrics due to addition ERN features is shown in (d).
Fig. 7.
(a) Distribution of subjects according to ADOS. (b) Distribution of subjects according to SVM output. In an ideal situation it should be as similar to (a) as possible. (c) SVM output for different subjects. The misclassified ones are encircled in green. (d) The ROC curve for the leave-one-out cross-validation.
(5) Differences in long vs. short range and hemispheric connectivities
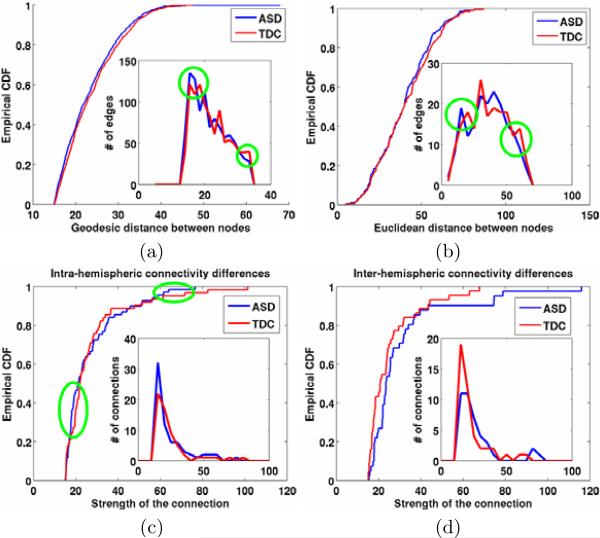
Such differences are one of the important hypotheses investigated in ASD. Indirect ways of characterizing these connectivities were proposed in the literature, e.g. using cortical thickness [20,21] and white matter volumes [14]. ERNs can provide a more direct way by looking at both the connectivities based on geodesic as well as euclidean distances between the node regions. Figs. 8 (a,b) show the group differences between these connectivities on ASDERG and TDCERG. It has been indicated that ASD group has decreased inter-hemispheric functional connectivity [15]. ERNs can also be effectively used to investigate hemispheric structural connectivity differences, both intra and inter. Group differences between intra and inter hemispheric connectivities by plotting the distribution of the edges (connections) across different edge strengths are shown in Figs. 8 (c,d). We can observe decreased inter-hemispheric connectivity and increased intra-hemispheric connectivity in the ASD group. We would like to note that intra and inter hemispheric connections can also be thought of as a proxy to the short and long range connections respectively. To be sensitive to the changes, the same “easy” bootstrap sample (i.e. ADOS > 14 for ASD and ADOS < 1 for TDC) that was used for classification was also used for these two analyses.
Fig. 8.
Top row: Differences between long vs. short range connectivities using geodesic (a) as well as euclidean (b) distances between nodes. The empirical CDFs and the distributions of the edges (connections) are shown as insets. Although the differences are statistically not very significant ((a): p = 0.0941, (b): p = 0.8723), the encircled regions indicate support for the increased short-range and decreased long-range connectivities in ASD. Bottom row: Differences between intra and inter hemispheric connectivities between average ERNs of ASD and TDC. (c) Although the difference is not statistically significant (p = 0.2443), the encircled regions indicate support for the increased intrahemispheric connectitvity for small and strong connections. (d) The inter-hemispheric connectivity is consistently lower for the ASD group (p = 0.0624) and is consistent with the finding in functional connecitvity [15].
4 Discussion
In this paper we extend recently proposed automatic, data-driven network extraction frameworks. These enhanced networks could potentially be more sensitive for network based analyses in population based neuroimaging studies. Such methods in addition to avoiding the bias of ill-posed inter-modality image registration (Fig. 1 of the supplementary material2) are computationally very efficient. However there are several limitations to be considered: (1) Tractography in the spatially normalized tensors needs to be validated against the tractography in the tensors native/acquired space. This is part of our on-going work. (2) The ϵ-radial nodes although cover important regions in the grey/white matter boundary, do not cover all possible regions of interest and can lead to false-negatives in group differences. Investigating potential extensions using techniques like Vietoris-Rips complex [22] are part of our future work. (3) The spatial normalization needed here may constrain the white matter topology to be too similar between subjects. The normalization causes the brain anatomy to have more consistent shape and size in the normalized space than they would in the native/acquired space. Hence, although the quantitative measures like FA, MD along the edges and node-regions might be preserved, this method may lose some sensitivity to individual differences of topology. Performing topological group differences without needing spatial normalization is also potentially an interesting line of work.
Supplementary Material
Footnotes
Please see Fig. 2 of the supplementary material2 for the matching information.
References
- 1.Chung M, Adluru N, Dalton K, Alexander A, Davidson R. Scalable brain network construction on white matter fibers. SPIE Medical Imaging. 2011 doi: 10.1117/12.874245. [DOI] [PMC free article] [PubMed] [Google Scholar]
- 2.Greicius M, et al. Functional connectivity in the resting brain: a network analysis of the default mode hypothesis. Proc. Natl. Acad. Sci. 2003;100:253–258. doi: 10.1073/pnas.0135058100. [DOI] [PMC free article] [PubMed] [Google Scholar]
- 3.Jones D, et al. Non-invasive assessment of axonal fiber connectivity in the human brain via diffusion tensor MRI. Magn. Reson. Med. 1999;42:37–41. doi: 10.1002/(sici)1522-2594(199907)42:1<37::aid-mrm7>3.0.co;2-o. [DOI] [PubMed] [Google Scholar]
- 4.Julien DJ, Peled S, Berezovskii V, Delzescaux T, et al. Comparison of fiber tracts derived from in-vivo DTI tractography with 3D histological neural tract tracer reconstruction on a macaque brain. NeuroImage. 2007;37(2):530–538. doi: 10.1016/j.neuroimage.2007.04.067. [DOI] [PubMed] [Google Scholar]
- 5.Catani M, Thiebaut de Schotten M. A diffusion tensor imaging tractography atlas for virtual in vivo dissections. Cortex. 2008;44(8):1105–1132. doi: 10.1016/j.cortex.2008.05.004. [DOI] [PubMed] [Google Scholar]
- 6.Hagmann P, Cammoun L, Gigandet X, Meuli R, Honey C, et al. Mapping the structural core of human cerebral cortex. PLoS Biol. 6(7):e159. doi: 10.1371/journal.pbio.0060159. [DOI] [PMC free article] [PubMed] [Google Scholar]
- 7.Adluru N, et al. Characterizing brain connectivity using ϵ-radial nodes: application for classifying autism. MICCAI Workshop on CDMRI. 2010 [Google Scholar]
- 8.Danielle S, et al. Efficient physical embedding of topologically complex information processing networks in brains and computer circuits. PLoS Comp. Biol. 2010:1–14. doi: 10.1371/journal.pcbi.1000748. [DOI] [PMC free article] [PubMed] [Google Scholar]
- 9.Zhang L, et al. Quantifying degeneration of white matter in normal aging using fractal dimension. Neurobiol. of Aging. 2007;28:1543–1555. doi: 10.1016/j.neurobiolaging.2006.06.020. [DOI] [PubMed] [Google Scholar]
- 10.Chen B, Hall D, Chklovskii D. Wiring optimization can relate neuronal structure and function. Proc. Natl. Acad. Sci. 103:4723–4728. doi: 10.1073/pnas.0506806103. [DOI] [PMC free article] [PubMed] [Google Scholar]
- 11.Watts D, Strogatz S. Collective dynamics of ’small-world’ networks. Nature. 1998;393:440–442. doi: 10.1038/30918. [DOI] [PubMed] [Google Scholar]
- 12.Rubinov M, Sporns O. Complex network measures of brain connectivity: Uses and interpretations. NeuroImage. 2010;52:1059–1069. doi: 10.1016/j.neuroimage.2009.10.003. [DOI] [PubMed] [Google Scholar]
- 13.Chang CC, Lin CJ. LIBSVM: a library for support vector machines. Software; 2001. http://www.csie.ntu.edu.tw/~cjlin/libsvm. [Google Scholar]
- 14.Jou R, et al. Reduced central white matter volume in autism: Implications for long-range connectivity. Psychiatry and Clinical Neurosci. 2011;65:98–101. doi: 10.1111/j.1440-1819.2010.02164.x. [DOI] [PMC free article] [PubMed] [Google Scholar]
- 15.Anderson J, et al. Decreased interhemispheric functional connectivity in autism. Cerebral Cortex. 2011;21(5):1134–1146. doi: 10.1093/cercor/bhq190. [DOI] [PMC free article] [PubMed] [Google Scholar]
- 16.Massey FJ. The kolmogorov-smirnov test for goodness of fit. J. Am. Stat. Assoc. 1951;46:68–78. [Google Scholar]
- 17.Adluru N, et al. Classification in DTI using shapes of white matter tracts. IEEE EMBS. 2009:2719–2722. doi: 10.1109/IEMBS.2009.5333386. [DOI] [PMC free article] [PubMed] [Google Scholar]
- 18.Ingalhalikar M, Parker D, Bloy L, Roberts T, Verma R. Diffusion based abnormality markers of pathology: Toward learned diagnostic prediction of ASD. doi: 10.1016/j.neuroimage.2011.05.023. [DOI] [PMC free article] [PubMed] [Google Scholar]
- 19.Lange N, et al. Atypical diffusion tensor hemispheric asymmetry in autism. Autism Research. :350–358. doi: 10.1002/aur.162. [DOI] [PMC free article] [PubMed] [Google Scholar]
- 20.Herbert M, et al. Localization of white matter volume increase in autism and developmental language disorder. Ann. Neurol. 2004;55:530–540. doi: 10.1002/ana.20032. [DOI] [PubMed] [Google Scholar]
- 21.Hardan A, Muddasani S, Vemulapalli M, et al. An MRI study of increased cortical thickness in autism. Am. J. Psychiatry. 2006;163:1290–1292. doi: 10.1176/appi.ajp.163.7.1290. [DOI] [PMC free article] [PubMed] [Google Scholar]
- 22.Hausmann J. On the Vietoris-Rips complexes and a cohomology theory for metric spaces. Annals of Mathematics Studies. 1995;138:175–188. [Google Scholar]
Associated Data
This section collects any data citations, data availability statements, or supplementary materials included in this article.


