

A simple 3D stochastic model captures key features of nuclei movements observed in the hyphae of Ashbya gossypii. These motions are driven by dynein motors pulling on microtubules, similar to the oscillations of the anaphase spindle in budding yeast, but the regulation of the two systems diverged, possibly as a result of evolutionary tinkering.
Abstract
Multinucleated cells are important in many organisms, but the mechanisms governing the movements of nuclei sharing a common cytoplasm are not understood. In the hyphae of the plant pathogenic fungus Ashbya gossypii, nuclei move back and forth, occasionally bypassing each other, preventing the formation of nuclear clusters. This is essential for genetic stability. These movements depend on cytoplasmic microtubules emanating from the nuclei that are pulled by dynein motors anchored at the cortex. Using three-dimensional stochastic simulations with parameters constrained by the literature, we predict the cortical anchor density from the characteristics of nuclear movements. The model accounts for the complex nuclear movements seen in vivo, using a minimal set of experimentally determined ingredients. Of interest, these ingredients power the oscillations of the anaphase spindle in budding yeast, but in A. gossypii, this system is not restricted to a specific nuclear cycle stage, possibly as a result of adaptation to hyphal growth and multinuclearity.
INTRODUCTION
Positioning of the nucleus and mitotic spindle appropriately within the cell is critical in eukaryotes during many processes, ranging from simple growth to tissue development (Morris, 2002; Dupin and Etienne-Manneville, 2011; Gundersen and Worman, 2013; Kiyomitsu, 2015). Accordingly, cells have evolved various strategies to place their nucleus or spindle in suitable locations. In most systems, this process is driven by dynein pulling on nuclei-associated cytoplasmic microtubules (cMTs). Dynein is a minus end–directed motor that can act primarily in two ways. End-on pulling occurs when cortex-anchored dynein captures a growing cMT plus end, thereby initiating its shrinkage while maintaining the attachment. Lateral or side-on pulling occurs when cortex-anchored dynein walks on cMTs toward the minus end using its motor activity. This mode of action is independent of cMT shrinkage and may result in cMT sliding parallel to the cortex (Kotak and Gönczy, 2013; McNally, 2013; Akhmanova and van den Heuvel, 2016).
A detailed mechanistic view for directing nuclei during the cell cycle is known in the budding yeast Saccharomyces cerevisiae, as outlined in Figure 1 and references therein. In contrast to most eukaryotic cells, the site of the cleavage plane in S. cerevisiae is selected early in the cell cycle by generating a ring structure (future bud neck) at the mother cell cortex at which the daughter cell (bud) will emerge. In addition, in budding yeast the nuclear envelope does not disassemble during mitosis, and nuclei are always attached to the minus end of cMTs via spindle pole bodies (SPBs) embedded in the nuclear envelope. The two pathways elucidated in S. cerevisiae involve cortical pulling, but only the second pathway relies on dynein. During the Kar9-Bim1-Myo2 pathway, the nucleus is directed toward the bud neck by transporting cMT plus ends first along bud neck–emerging actin cables, followed by depolymerization of the transported cMT. In metaphase, cMTs are transported along bud neck and bud tip–emerging actin cables, securing positioning of the nucleus close to the bud neck and correct orientation of the spindle along the mother–bud axis. At preanaphase, when the bud has reached its final size, actin cables no longer emerge from the bud tip, and the dynein-Num1 pathway takes over. At the onset of anaphase, dynein, transported at the plus end of cMTs to the bud cortex, starts pulling the spindle through the bud neck as soon as dynein is captured by the cortical anchor Num1. An essential step in the cortical pulling is the switch from inactive dynein at cMT plus ends to active dynein after its association with Num1. This is regulated to happen first in the bud and later also in the mother cell, explaining the observed back and forth movements of the anaphase spindle during mitosis in S. cerevisiae. The pulling of a cMT by “walking” of cortex-anchored dynein toward the cMT minus end at the SPB does not trigger depolymerization of this cMT, and the cMT slides head on with its plus end along the cortex. In addition, in contrast to higher eukaryotes, directing nuclei by dynein-mediated cortical pulling is restricted in S. cerevisiae to a small window of the cell cycle regulated by the inhibitor She1 (Woodruff et al., 2009; Markus et al., 2012).
FIGURE 1:
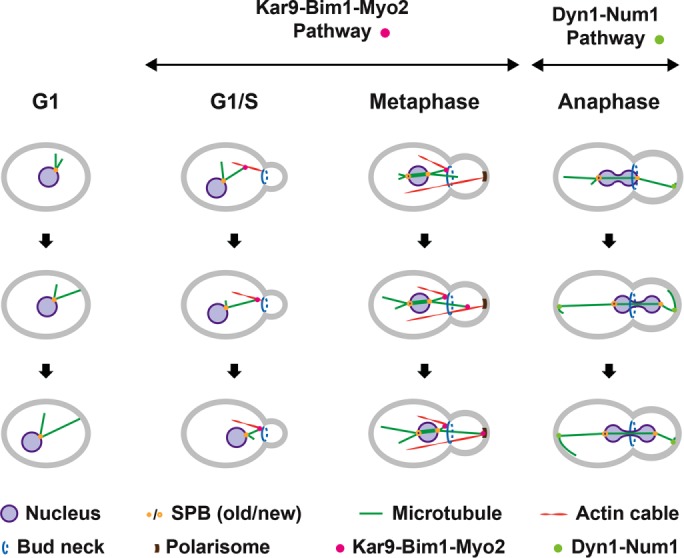
Nuclear movements in S. cerevisiae. Different modes of cMT plus-end capture and pulling on cMTs direct nuclei during the cell cycle of S. cerevisiae. G1 phase: cMTs arising from the SPB grow and shrink, but do so more slowly than cMTs in animal cells (Carminati and Stearns, 1997). Nuclei can be pushed when growing cMTs hit the cortex (Shaw et al., 1997). G1/S phase: actin cables emerge from the incipient bud site and the bud neck in small-budded cells and are used as transport tracks by the type V myosin Myo2 (Pruyne and Bretscher, 2000). cMT plus ends can be captured by Myo2 because Kar9 (APC tumor-suppressor homologue) connects the plus end–tracking Bim1 (EB1 homologue) and Myo2 indicated by the pink dot. Thus, the captured cMT is transported along actin cables to the bud neck, where shrinking of this cMT initiates pulling of the nucleus towards the bud neck, as necessary for nuclear positioning (Miller and Rose, 1998; Tirnauer et al., 1999; Adames and Cooper, 2000; Yin et al., 2000; Kusch et al., 2002; Hwang et al., 2003). Metaphase: after SPB duplication and separation, the old SPB stays close to the bud neck and accumulates Kar9 (Liakopoulos et al., 2003). Cytoplasmic MTs emanating from this SPB can be captured, as described earlier, at their plus end by Myo2 running at this cell cycle stage mainly along actin cables nucleated at the polarisome of medium- and larger-sized buds. Transport of captured cMTs along these cables secures the position of the nucleus and the correct orientation of the metaphase spindle. Anaphase: before the onset of anaphase, dynein accumulates at the bud-proximal SPB, but dynein assumes a symmetric distribution at both SPBs soon after the pulling of the anaphase spindle through the bud neck is initiated (Grava et al., 2006). Dynein is transported as an inactive complex with Pac1 (Lis1 homologue) at the plus ends of cMTs (not shown), searching the bud cortex and later also the mother cell cortex (Markus and Lee, 2011; Markus et al., 2011). When the immobile cortical Num1 captures dynein (light green dot), Pac1 is released, and the activated dynein, still bound to the cMT, starts pulling the anaphase spindle through the bud neck (Lammers and Markus, 2015). The pulled cMT glides along the bud cortex. Frequently, the elongating anaphase spindle is pulled back into the mother cell (Yeh et al., 1995; Adames and Cooper, 2000), most likely when dynein, captured and activated by Num1 at the mother cortex, exerts higher pulling forces on the mother cell SPB. This Dyn1-Num1–controlled oscillation of the anaphase pulling can repeat up to four times before the anaphase spindle is fully elongated.
The network of cMTs is also important in multinucleated cells (syncytia), which form at specific developmental stages in higher eukaryotes like the hundreds of nuclei in mammalian myotubes (Bruusgaard et al., 2003) or the thousands of nuclei in fertilized eggs of insects (Foe and Alberts, 1983). During development of myotubes by cell fusions, the cMT network is dramatically rearranged (Tassin et al., 1985), the cMT plus end–tracking protein EB3 regulates cMT dynamics at the cell cortex (Straube and Merdes, 2007), and nuclear movements depend on dynein and cMTs (Cadot et al., 2012). Fertilized insect eggs initially develop in the absence of cytokinesis, and at later stages contain thousands of nuclei that eventually form a very organized layer near the cortex before the formation of cells around these nuclei. Recent progress in manipulating this system (Telley et al., 2012) revealed that the spreading of nuclei depends on MT asters, F-actin, and the elongating anaphase spindle. However, it is not exactly known how nuclei move apart and which cortical forces dictate their dispersion and final positioning at the cortex. An essential role of dynein and cMTs in controlling movements and distribution of multiple nuclei in a common cytoplasm has also been documented for several filamentous fungi (Morris, 2002; Xiang and Fischer, 2004; Fink et al., 2006; Mouriño-Pérez et al., 2006). Attempts to analyze molecular mechanisms for controlling movements of multiple nuclei in these fungi were hampered by the fact that dynein and cMTs are also involved in essential transports of organelles. A notable exception is the plant-pathogenic fungus Ashbya gossypii, which, based on its genome, seems to have evolved from a budding yeast precursor (Dietrich et al., 2004, 2013) and which, like S. cerevisiae, exploits dynein and cMTs exclusively for nuclear movements in its multinucleated and constantly elongating cells, called hyphae (Figure 2A). Not only the genes but also cellular networks are highly conserved compared with S. cerevisiae. Thus, the different cellular life style of A. gossypii is driven by homologues of well-studied S. cerevisiae genes, in particular those implicated in the cell cycle, polar growth, and cytoskeleton. With respect to A. gossypii nuclear biology, we are beginning to fully understand asynchronous mitoses of multiple nuclei in a common cytoplasm (Gladfelter et al., 2006; Lee et al., 2013) but are still missing a comprehensive mechanism for the complex nuclear motility during hyphal growth.
FIGURE 2:

Nuclear movements in Ashbya gossypii. (A) Visualization of long-range nuclear migration and nuclear dynamics in hyphae of A. gossypii. Two merged differential interference contrast and fluorescence images of hyphae with histone H4-GFP–marked nuclei of Supplemental Video S1 were selected to show the efficient polar growth and maintenance of nuclear density. Bar, 10 µm. (B) Qualitative model of nuclear migration control in a hypha growing from left to right, which causes a cytoplasmic flow (arrow) in the growth direction. The indicated nuclei do not necessarily represent the apicalmost six nuclei. Nuclei are autonomous with respect to movements and mitosis (Alberti-Segui et al., 2001; Gladfelter et al., 2006; Lang et al., 2010b). Each SPB (yellow dots) nucleates three cMTs (green lines) based on electron tomography (Gibeaux et al., 2012). Very long cMTs can form because the dynamic cMT parameters are adapted to the very long cells (Grava and Philippsen, 2010; Lang et al., 2010b). As in S. cerevisiae, dynein localizes at the growing end of cMTs (Grava et al., 2011) and Num1 patches form at the cortex (Schmitz and Landmann, unpublished data). Therefore dynein can be captured at the cortex by Num1, which initiates pulling on the cMT, thereby moving the nucleus, essentially as described for pulling of the anaphase spindle in S. cerevisiae by the dynein off-loading model (Lee et al., 2003, 2005; Sheeman et al., 2003; Markus and Lee, 2011; Lammers and Markus, 2015). The cMT continues to grow during the pulling (Grava and Philippsen, 2010) until it eventually starts depolymerizing if its plus end undergoes a catastrophe. Nucleus 1 is pulled backward and nucleus 2 forward. The distances pulled are sufficiently long to cause nuclear bypassing. Next nucleus 1 stops moving due to balance of backward and forward pulling forces, whereas nucleus 2 continues to move forward. Nucleus 3 migrates with the cytoplasmic flow. No cortical contact of cMTs. Nucleus 4 first moves forward and then backward as the mitotic nucleus is pulled. Up to a certain length, elongating spindles can assume any angle with respect to the growth axis (Alberti-Segui et al., 2001; Grava et al., 2011). Nucleus 5 is immobile first and then moves backward because the backward-oriented cMT elongated and is pulled. Nucleus 6 moves forward and switches to backward movement because the forward-oriented cMT shrinks and the backward-oriented cMT grows, changing the balance of forces.
Within the hyphae of A. gossypii, nuclei permanently perform short-range back and forth excursions, which presumably help to avoid formation of nuclear aggregates, as well as longer-range movements, frequently leading to nuclear bypassing events that permute the order of the nuclei (Alberti-Segui et al., 2001; Gladfelter et al., 2006; Grava et al., 2011). This continuous reordering prevents a detrimental mutation acquired in the haploid genome of one nucleus from remaining concentrated in a hyphal segment, compromising it. Nuclear movements require cMTs and functional SPBs permanently embedded, as in S. cerevisiae, in the nuclear envelope. In the absence of cMTs or functional SPBs, oscillatory and bypassing movements do not occur, and nuclei are passively transported with the cytoplasmic stream in the direction of hyphal tip growth (Alberti-Segui et al., 2001; Gladfelter et al., 2006; Lang et al., 2010a, b). A. gossypii cMTs grow at 6 μm/min, three times faster than S. cerevisiae cMTs, and thus can always reach hyphal tips, the maximal speed of which is 3.3 μm/min (Grava and Philippsen, 2010).
Of interest, a single type of minus end–directed MT motor—dynein—is responsible for all active nuclear movements during hyphal growth. Indeed, reducing the expression level of the dynein heavy chain by truncating the AgDYN1 promoter led to the decrease of oscillatory and bypassing movement frequencies (Grava et al., 2011). Dynein is localized at different cMT positions: at cMT minus ends (SPBs), along cMTs, and at cMT plus ends, especially of long cMTs. It has been suggested that, once anchored to the hyphal cortex, dynein could exert pulling forces that would move the nuclei (Grava and Philippsen, 2010), essentially as proposed for the anaphase spindle pulling in S. cerevisiae (Lee et al., 2003; Sheeman et al., 2003). This is supported by the phenotype of hyphae lacking functional AgNum1 (Grava et al., 2011). In the same study, it was shown that AgKar9 and AgBim1 are not important for bidirectional movements and bypassing of nuclei, which is not surprising, because nuclear positioning is not an issue in growing A. gossypii hyphae. Electron tomography revealed that each SPB nucleates on average three cMTs and that SPBs are frequently found as duplicated side-by-side entities (G2 phase of the nuclear cycle; Gibeaux et al., 2012). This is in line with the in vivo observation that up to six cMTs emanate from one nucleus (Lang et al., 2010b).
Taken together, these observations suggest a mechanistic hypothesis for nuclear motility in A. gossypii hyphae: highly dynamic cMTs emanating in different directions from the nuclear envelope–embedded SPB would reach the cortex and be pulled by dynein anchored to it (Figure 2B). This model is appealing because it involves only one motor and seems qualitatively complete. It is not clear, however, whether a single mode of action could explain the complexity of the observed movements. A detailed quantitative analysis of the mechanism using simulations is thus essential to reveal whether certain features of nuclear positioning are not correctly captured by the proposed model and if this model needs to be refined or investigated further through additional experiments. To this end, we implemented this model with Cytosim (www.cytosim.org) to simulate the motion of multiple nuclei in a three-dimensional (3D) geometry, using flexible and dynamic cMTs. Using physically realistic equations of motion, the simulation computes the nuclei movements that can be directly compared with the movements observed in live-imaging experiments. With parameter values obtained from published experimental measurements, our simulation was able to match the basic characteristics of nuclei movements, and we could thus test different experimental settings relating to how cMT dynamics, cMT number per nucleus, cortical Num1 density, cytoplasmic streaming, or organelle crowding affect nuclear movements in multinucleated hyphae.
RESULTS
A computational method for validation of natural and simulated nuclear movements
The nuclei in live A. gossypii hyphae can easily be observed with fluorescence microscopy (Figure 2A and Supplemental Video S1), and their bidirectional movements, including bypassing, have been characterized (Alberti-Segui et al., 2001; Gladfelter et al., 2006; Grava and Philippsen, 2010; Grava et al., 2011; Lang et al., 2010b; Anderson et al., 2013). In these studies, different methods were used to measure nuclear movements, most not applicable for our computational simulation. Therefore we established an automatic method to measure nuclear motility parameters, which we first applied to reanalyze in vivo nuclear movements. Spatial and temporal information was extracted from videos of 12 hyphae expressing green fluorescent protein (GFP)–tagged histone H4 recorded every 30 s over 25–30 min (see example in Figure 2B and Supplemental Video S1). In each hypha, we tracked the two-dimensional (2D) positions of the first five nuclei (and in few cases their progeny) to accurately follow their movements. The data set was rotated to calculate the position of the nuclei along the hypha main axis. A global analysis, first, showed that nuclei move in the direction in which the hyphae grow (Supplemental Figure S1A) at a speed that matches the growing speed for nuclei located near the tip of the hyphae. We thus used the measured growth speed of the hyphal tip to set the flow in the simulation. On top of this streaming motion, the analysis showed that cMT-dependent nuclear motility is diffusive at long time scales, with an effective diffusion coefficient of ∼0.0113 µm2/s (Supplemental Figure S1B). By comparison, the Brownian motion of the nuclei leads to a diffusion coefficient of ∼0.0003 µm2/s, using Stokes’ law with our estimate of cytoplasmic viscosity. Hence, although cMT-driven motions of nuclei appear nondirected, they increase the diffusion speed dramatically. We also expect that Brownian forces alone would not be sufficient to permute the order of the nuclei such that nuclear bypassing is a hallmark of cMT-dependent movements.
We then performed a more detailed analysis, as illustrated in Figure 3, A–C, for one representative hypha. We first generated a standard representation of patterns of nuclear movement to allow visual comparisons to previously published analyses (Figure 3A) and then produced standardized schemes to document the frequent changes in the direction and speed of individual nuclei (Figure 3, B and C, respectively). Using the cytoplasmic flow speed, vh, as a threshold, we classified the movements in three categories: forward (vh < v), backward (v < 0), and tumbling (0 < v < vh). From this, we computed frequencies, durations, and average speed (i.e. average of the instantaneous velocities) for each class. The result of the analysis of the 12 hyphae (70 nuclei) is reported in Supplemental Table S1 and the average of each motility parameter in Table 1. As can be seen in the top row of this table, on average, nuclei performed 0.279 (±0.033 SD) forward movements per minute and 0.208 (±0.065 SD) backward movements per minute with an average speed of 0.864 (±0.209 SD) μm/min. The average ratio of forward to backward frequencies (here, 1.628 ± 1.190 SD) will be used later extensively for comparing simulation conditions because it is a simple yet sensitive readout of the movements. We also automatically detected nuclei-reordering events—when one nucleus bypasses another one. These events occur at a frequency of 0.026 (±0.023 SD) per minute, which means that ∼10% of the forward and 8% of backward movements lead to nuclear bypassing.
FIGURE 3:

Analyzing in vivo and simulated nuclear movements. (A) The position of five nuclei along time showing movement patterns. The centers of individual nuclei (1, blue; 2, turquoise; 3, green; 4, orange; 5, red) and the position of the hypha tip (black) were tracked along the course of the movie. Three reordering (bypassing) events can be seen by which two nuclei exchange their ranking along the hyphae. (B) The category of movement of each nucleus as a function of time. From the coordinates of each nucleus (1–5), the signed axial speed of movement, vx, was computed at every time point. The hypha growth speed, vh, was used as a threshold to categorize the movements as follows: forward, + (vh < vx); backward, – (vx < 0); and tumbling, 0 (0 < vx < vh). Colors match panel A. (C) Plots of absolute nuclei speed along time. Magnitude of nuclei speed along time (|v|) does not distinguish between forward and backward directions. Colors match panel A. (D) Snapshots of electron tomography models. Previously published data (Gibeaux et al., 2012, 2013) were used to generate snapshots showing (top) cMTs (green) and nucleation and organization from nuclei (purple)-embedded SPBs (yellow) and (bottom) the same nuclei within the cytoplasm crowd, including mitochondria (orange) and vacuoles (blue). (E) Snapshot of simulations. The simulations are performed in three dimensions within a cylinder with periodic boundaries in x, as indicated. The simulations contain five nuclei (dark violet), and each nucleus nucleates three (top) or six (bottom) cMTs (white lines). Cytoplasmic MTs are attached at their minus ends to one point at the surface of the nucleus (the SPB; orange ball) and grow at their plus ends. Inactive minus end–directed dynein motors are assumed to be present at each plus end. Each contact of a cMT plus end with a cortical dynein anchor (white dots) will induce pulling. The arrow indicates the direction of the applied cytoplasmic flow. (F) Nuclear positions along time taken from a simulation with six cMTs per nucleus. The x-coordinates of the center of individual nuclei are plotted in various colors (1, blue; 2, turquoise; 3, green; 4, orange; 5, red), and the dashed line indicates the applied flow speed. (G) The direction of motion of each nucleus along time. The motions were categorized exactly as in B. Colors match F. (H) Plots of absolute nuclei speed along time, exactly as in C. Colors match F.
TABLE 1:
Nuclear dynamics quantification averages from live-imaging experimental data and in silico experiments.
| Forward movements | Backward movements | Other movement features | Tumbling events | Bypassing events | |||||
|---|---|---|---|---|---|---|---|---|---|
| Hypha growth speed (μm/s) | Frequency (events/min) | Average duration (min) | Frequency (events/min) | Average duration (min) | Frequency ratio | Average speed (μm/min) | Average duration (min) | Frequency (events/min) | |
| All experiments (12 hyphae; 70 nuclei) | |||||||||
| Average | 0.009 | 0.279 | 1.703 | 0.208 | 1.076 | 1.628 | 0.864 | 0.736 | 0.026 |
| SD | 0.004 | 0.033 | 0.262 | 0.065 | 0.201 | 1.190 | 0.209 | 0.145 | 0.023 |
| Simulation with three cMTs per nucleus (200 simulations, 1000 nuclei) | |||||||||
| Average | 0.009 | 0.336 | 1.519 | 0.147 | 1.192 | 2.370 | 0.724 | 0.719 | 0.028 |
| SD | 0.031 | 0.176 | 0.026 | 0.237 | 0.512 | 0.030 | 0.057 | 0.021 | |
| Simulation with six cMTs per nucleus (200 simulations, 1000 nuclei) | |||||||||
| Average | 0.009 | 0.290 | 1.544 | 0.189 | 1.320 | 1.576 | 0.728 | 0.714 | 0.033 |
| SD | 0.031 | 0.208 | 0.030 | 0.217 | 0.331 | 0.037 | 0.061 | 0.022 | |
Implementation of a simulation system for nuclear movements in A. gossypii
Accumulated evidence summarized in the Introduction and the legend of Figure 2B supports a qualitative model for nuclear movements in A. gossypii: Cortex-anchored dynein exerts pulling forces on dynamic cMTs, nucleated from SPBs, and thus drives the movements of nuclei at all cell cycle stages (Figure 2B). To test whether this model is physically plausible and sufficient to explain the observed complex nuclear motility, we generated a computer simulation of the process within a hypha-like 3D geometry using the Cytosim platform (Nedelec and Foethke, 2007). For cell biological parameters of the simulation, we considered numerous live-cell imaging data mentioned earlier. We also considered high-resolution electron microscopic (EM) studies, including an EM tomography–based 3D model of an A. gossypii hypha (Lang et al., 2010b; Gibeaux et al., 2012, 2013). For example, nuclei with one SPB emanate three cMTs, but a high percentage of nuclei carry two side-by side SPBs emanating six cMTs (Figure 3D, top). We therefore implemented simulations with three cMTs and simulations with six cMTs per nucleus for each tested condition. To account for the organelle-crowded cytoplasm, we simulated mitochondria and vacuoles (Figure 3D, bottom, orange and blue organelles, respectively) as spheres, the number and volume of which matched the measurements discussed in more detail later in Figure 7. In all simulation images, these spheres are present but not displayed for clarity.
FIGURE 7:

Influence of organelle crowding on nuclear dynamics. (A) Snapshots of simulations with uncrowded and highly crowded cytoplasm. To represent the “wild-type” (WT) situation, the simulation included 550 “mitochondria” spheres of 0.4 μm diameter and 50 “vacuole” spheres of diameter 0.6 μm. These objects are removed in the uncrowded, empty case (top), and in the highly crowded case (bottom), the 50 “vacuoles” were enlarged to a diameter of 1.4 μm. (B) Box plots of nuclear dynamics measurements comparing the simulated “WT” situation to “empty” and “highly crowded” simulations. Average duration of forward movements (top left), average duration of backward movements (top right), frequency of bypassing events (bottom left), and frequency of tumbling events (bottom right). The “empty,” “WT,” and “highly crowded” data are plotted in blue, gray, and orange, respectively. Circles stand for individual simulations; the thick black line marks the average value, and the transparent gray box represents the SD. (C) Plots of the frequencies of forward (left) and backward (middle) movements and their ratio (right) as a function of increasing cytoplasmic flow (from 0 to 0.02 μm/s). Colors as in B.
We knew that 30-min monitoring of five nuclei in a 30-μm-long hyphal segment, corresponding to the average in vivo spacing of nuclei (Lang et al., 2010a), is sufficient to document nuclear motility parameters, and we therefore simulated a hyphal segment of this size as a cylindrical volume with periodic boundaries. In the graphical representations of simulated hyphae in Figure 3E, a nucleus or a cMT may thus leave the cylinder at the right side and reappear at the left side, or vice versa. There is, however, no edge in the simulated space. The two simulation images of Figure 3E display the elements that were implemented to test whether a nuclear motility pattern similar to that of wild-type hyphae can be reproduced. All cMTs (thin white rods) emanate from one site (SPB or duplicated SPB) of a nucleus, remain attached to this site while they elongate, and can undergo very fast shortening until they disappear, inducing at this SPB a new cMT to form immediately. Cytoplasmic MTs exclude each other and cannot penetrate nuclei and other simulated organelles, but they can elongate in all directions and, upon contact of a tip (plus end) with the cylinder boundary (cortex), continue to elongate while sliding along the cylinder boundary. They are programmed to engage in pulling forces (thereby moving the attached nucleus) when they hit one or more of the randomly distributed immobile white dots at the simulated cortex (patches of the dynein-activating anchor Num1), highlighted by increased dot intensity, and they are programmed to terminate pulling according to a detachment rate and in response to counteracting forces. All quantitative parameters used for implementing the simulation of nuclear movements, such as the viscosity of the cytoplasm, were obtained from the literature and are reported in Table 2, with the exception of the fitted cortical density of Num1 (see later discussion of Figure 5).
TABLE 2:
Parameters of the simulation.
| Parameter | Value | Note | Reference |
|---|---|---|---|
| Global | |||
| Hypha geometry | l = 30 µm | Cylindrical geometry, periodic along the symmetry axis to allow the simulation of infinitely growing hyphae | See Figure 1A for an example |
| r = 1.5 µm | |||
| Cytoplasm effective viscosity (pN s/µm2) | 0.9 | 900 times the viscosity of water | Tolić-Nørrelykke et al. (2004), Foethke et al. (2009) |
| Cytoplasmic flow (µm/s) | 0.009 | Impelled by hyphal growth speed | Lang et al. (2010b), Grava and Philippsen (2010), Grava et al. (2011), this study |
| Calculated average from experimental data | |||
| kT (pN µm) | 0.0042 | Thermal energy at 25°C | en.wikipedia.org/wiki/Boltzmann_constant |
| Large organelles | n = 550 beads; r = 200 nm | For mitochondria (8.8% of cytoplasm) and other organelles (2.5% of cytoplasm) | Gibeaux et al. (2013) |
| n = 50 beads; r = 300 nm | Randomly/uniformly distributed along the cell | ||
| Nuclei | n = 5; r = 700 nm | Average spacing of 5.75 µm | Lang et al. (2010b) |
| Time step (s) | 0.05 | Computational parameter | Nedelec and Foethke (2007) |
| Total time simulated, 30 min | |||
| Microtubule | |||
| Nucleators | n = 3 or 6 | This constitutes the SPB | Gibeaux et al. (2012) |
| Nucleation rate = 1 s–1 | The nucleators nucleate independently, but mechanically they behave as a single entity | ||
| Unbinding rate = 0 | |||
| Plus-end growth speed, vg0 (µm/s) | 0.108 (WT) | Growth speed sets to decrease to zero with force opposing the direction of growth | Grava and Philippsen (2010) |
| 0.086 (bik1∆) | |||
| 0.077 (kip3∆) | |||
| Plus-end shrink speed (µm/s) | 0.272 | Grava and Philippsen (2010) | |
| Catastrophe rate (s–1) | 0.023 (WT) | Calculated as the growing speed/average microtubule length, with the average microtubule length determined by fitting the truncated length distribution (see the text) | Grava and Philippsen (2010), this study |
| 0.083 (bik1∆) | |||
| 0.010 (kip3∆) | |||
| Rescue rate | 0 | The microtubule depolymerizes completely after a catastrophe | |
| Growing force, fg (pN) | 1.7 | Growing velocity is slowed down by antagonistic force (f < 0) on plus end as 
|
Dogterom and Yurke (1997) |
| Rigidity (pN µm2) | 20 | Gittes et al. (1993) | |
| Segmentation (µm) | 0.5 | Computational parameter | Nedelec and Foethke (2007) |
| Steric interaction | r = 25 nm | Microtubules exclude each other and cannot penetrate nuclei, mitochondria, or vacuoles | |
| Stiffness = 100 pN/µm | Nuclei, mitochondria, or vacuoles are also subject to steric interaction and repel each other | ||
| Dynein | |||
| Binding | Rate = 5 s–1 | Maximal distance to which a binder can bind a filament and rate at which possible binding can occur | Shingyoji et al. (1998), King and Schroer (2000), Gennerich et al. (2007), Ori-McKenny et al. (2010) |
| Range = 75 nm | |||
| Unbinding | Rate w0 = 0.64 s–1 | Unbinding is increased by force: 
|
|
| Characteristic force f0 = 7 pN | |||
| Motility | Stall force fs = 7 pN | The velocity is linearly dependent on force: 
|
|
| Unloaded speed vm = 0.025 µm/s |
 is the direction in which the motor would move along the microtubule if it was unloaded is the direction in which the motor would move along the microtubule if it was unloaded |
||
| Stiffness | k = 500 pN/µm | Stiffness of the Hookean spring between the anchoring point on the cell cortex and the position of attachment on the filament: 
|
FIGURE 5:

Importance of anchor density at the cell cortex. (A) The position of five nuclei along time in simulations containing 100 (left) and 20 (right) cortical anchors per 30 μm of hypha. The dashed line indicates the applied flow speed. (B) Quantification of nuclear movements in simulations with 200 (“wild-type”), 100, and 20 cortical anchors. Ratio of forward/backward movement frequencies (top), frequency of bypassing events (middle), and frequency of tumbling events (bottom). The dots stand for individual simulations, and the box indicates the mean and SDs. Results obtained with 200, 100, and 20 anchors are plotted in gray, turquoise, and lime green, respectively. (C) Frequencies of forward (lighter) and backward (darker) movements as a function of the number of anchors, with three cMTs (gray; top) or six cMTs (orange; bottom) per nucleus. Each vertical line at 20, 100, and 200 marks the position of the parameter values used in B. (D) Ratio of forward/backward movement frequencies (left) and frequencies of bypassing events (right) as a function of anchor density for three cMTs (gray) and six cMTs (orange). The three vertical lines mark the position of the parameter values used in B.
We also created a flow component to model the effect of the cytoplasmic streaming present in growing hyphae. Unlike in fungal colonies such as the ones made by Neurospora crassa (Ramos-García et al., 2009; Roper et al., 2013), the hyphae of A. gossypii do not fuse with each other, and the flow does not change directions. The flow is thus characterized by a speed vflow (Figure 3E), and, for simplicity, we neglected the detailed microflows that could arise around nuclei and their hydrodynamic interactions and only adjusted the viscous drag force in the equation of motion to −ξ(v − vflow), where ξ is the viscous drag coefficient. The flow affects all objects in the simulation, such that any object moves at the speed of the flow unless it is subjected to other forces than the drag. The average cytoplasmic streaming in our in vivo data set is 0.009 μm/s (Table 1), and we used this value for the parameter vflow in most simulations. The effects of much lower or faster cytoplasmic flow speeds on nuclear movements are discussed later (see later discussion of Figure 6).
FIGURE 6:

Influence of cytoplasmic flow on nuclear movements and role of cMT number in movement balance. (A) The frequency of forward movements as a function of increasing cytoplasmic flow (from 0 to 0.02 μm/s). Simulation values are plotted in gray (three cMTs per nucleus) and orange (six cMTs per nucleus) and experimental values in blue. (B) Plot of the frequency of backward movements as a function of increasing cytoplasmic flow (from 0 to 0.02 μm/s). Colors as in A. (C) The ratio of movement frequencies (forward/backward) as a function of increasing cytoplasmic flow (from 0 to 0.02 μm/s). Colors as in A. (D) Simulated nuclear positions along time without flow (speed of 0 μm/s). The x-coordinates of the center of individual nuclei (1–5) are plotted in different colors, and the dashed line indicates the applied flow speed. Top, example of a simulation with three cMTs. Bottom, example of a simulation with six cMTs. (E) Simulated nuclear positions along time with a flow speed of 0.02 μm/s. Same explanation as D. (F) The ratio of movement frequencies (forward/backward) as a function of increasing cytoplasmic flow (from 0 to 0.05 μm/s). Colors as in A.
A. gossypii nuclear movement patterns can be reproduced in silico
We computed 200 simulations (1000 nuclei) with three cMTs nucleated per nucleus (Supplemental Video S2) and another set with six cMTs per nucleus (Supplemental Video S3). To provide a visual readout and for comparison purpose, we plotted the patterns of nuclear movement for one simulation with six cMTs per nucleus (Figure 3, F–H). The short-range oscillations and long-range movements, as well as the patterns of direction changes and the speed of movements, were very similar to the in vivo measurements (compare Figure 3, A and C). This similarity also holds when the averages of all simulations are compared with the in vivo–measured values (Table 1). With three cMTs per nucleus, the frequencies of movements were, forward, 0.336 (±0.031 SD) min–1, and backward, 0.147 (± 0.026 SD) min–1, giving a ratio of 2.370 (±0.512 SD; Table 1). With six cMTs per nucleus, backward movements were more pronounced: forward, 0.290 (±0.031 SD) min–1, and backward, 0.189 (±0.03 SD) min–1, with a ratio of 1.576 (±0.331 SD; Table 1). Of interest, the simulations with six cMTs per nucleus better matched the values extracted from experimental data, which is consistent with the previous observation that A. gossypii hyphae contain more nuclei with duplicated side-by-side SPBs than with a single SPB (Gibeaux et al., 2012). Surprisingly, the change in cMT number does not seem to influence the frequency of bypassing events, although it affects the balance between forward and backward movements (Table 1).
Finally, it was previously observed that the SPB leads the nuclear mass during a pulling event. If the direction of pulling changes, the SPB relocates within 1 min to the opposite side of the nucleus, which becomes the new leading front (Lang et al., 2010a). These detailed SPB movements were well captured in the simulation (see Supplemental Video S4).
Phenotypes of mutations affecting microtubule dynamics are verified by simulations
Nuclei in hyphae lacking Bik1, the cMT plus end–stabilizing homologue of CLIP170, generate shorter cMTs than with wild type and show decreased frequencies of bidirectional movements and no bypassing. The growth of this deletion mutant is not affected because nuclei migrate with the cytoplasmic stream. In contrast, nuclei in hyphae lacking Kip3, the cMT-destabilizing homologue of kinesin-8, generate longer cMTs and display increased frequencies of bidirectional movements and bypassing than with wild type (Grava and Philippsen, 2010). We sought to know the degree to which simulations with altered cMT dynamic are able to reproduce known changes in nuclear mobility patterns caused by mutations affecting cMT dynamics. We thus decided to implement, in a new set of simulations, parameters representing the changed cMT dynamics in the bik1 and kip3 mutants. In addition, in a third set of simulations, we implemented the dynamic instability parameters of S. cerevisiae cMTs.
Figure 4A shows cMT length differences in simulations with altered cMT dynamics. The parameters for dynamic instability of cMTs in hyphae lacking Bik1 or Kip3 were modeled using the “classical” two-states model (Figure 4B). For this modeling, growth and shrinkage speeds are constant, and catastrophes occur stochastically as first-order events. Rescues are not considered because they have not been observed in A. gossypii, but new cMTs are nucleated by the SPB at each unoccupied site. We used the cMT polymerization rate, vg, measured in each mutant (Grava and Philippsen, 2010) and estimated the catastrophe rate from the lengths of cMTs that had been determined by light microscopy of fixed and immuno-labeled mutant hyphae. Specifically, we estimated the average length, L, by fitting an exponential on the truncated length distributions between 1 and 20 μm (Figure 4B and Materials and Methods). Unlike the average of all values, this procedure (Fraile and García-Ortega, 2005) avoided the bias in the data due to the fact that shorter cMTs would be missed in light microscopy. The longest cMT in the WT data set was 26.6 μm, and 20 μm was chosen as an upper limit to include most of the data in all conditions. The catastrophe rate was then calculated as vg/L, which, compared with wild type, increased about fourfold in the bik1 mutant and decreased about twofold in the kip3 mutant (Figure 4B). The catastrophe rates for S. cerevisiae and A. gossypii cMTs are similar, but the growth and shrinkage speeds are threefold slower in S. cerevisiae (Figure 4B) according to averaged published data (Tirnauer et al., 1999; Adames and Cooper, 2000; Kosco et al., 2001; Huang and Huffaker, 2006; Wolyniak et al., 2006; Caudron et al., 2008).
FIGURE 4:

Verification of nuclear-mobility phenotypes in mutants with altered cMT dynamics. (A) Snapshot of simulations with mutant cMT dynamics. The bik1Δ (top; green), kip3Δ (middle; magenta), and S. cerevisiae–like (bottom; dark turquoise) conditions. (B) Distributions of cMT length in WT, bik1Δ, and kip3Δ cells. Because, as shown by electron tomography, many cMTs are below the light microscopy resolution, only cMT length values (Grava and Philippsen, 2010) from 1 to 20 μm were used (n corresponds to the number of data point in this range). Frequency of each bin (circles) and an exponential fit on the truncated distribution (line; Fraile and García-Ortega, 2005). The corrected average cMT length, L, was determined. Data for WT are plotted in gray, for bik1Δ in green, and for kip3Δ in magenta. The tables summarize the determined catastrophe rates for WT and bik1Δ, kip3Δ, and S. cerevisiae–like mutants. The catastrophe rates were calculated (asterisk) by dividing the published cMT polymerization rate, vg, by L (see Results and Materials and Methods). (C) Plots of nuclear position along time in bik1Δ (left), kip3Δ (middle), and S. cerevisiae–like (right) simulations. The dashed line indicates the applied flow speed. (D) Box plots of nuclear dynamics measurements in “wild-type” and “mutant” simulations. Average duration of forward movements (left), average duration of backward movements (middle left), frequency of bypassing events (middle right), and frequency of tumbling events (right). Simulations representing “bik1Δ,” “WT,” and “kip3Δ” cells are plotted in green, gray, and magenta, respectively. Circles stand for individual simulations; the thick black line marks the average value, and the transparent gray box represents the SD.
Simulations with three and six cMTs were computed, and videos with three cMTs are documented for bik1Δ (Supplemental Video S5), kip3Δ (Supplemental Video S6), and S. cerevisiae cMT dynamics (Supplemental Video S7, discussed later). Already, the visual representation of one simulation each (Figure 4C) reveals the successful verification of the nuclear mobility in hyphae lacking Bik1 (mainly migration with the simulated flow) or Kip3 (extensive bidirectional movements and bypassing). For quantitative comparisons, number averages for all nuclear movement parameters are compiled in Supplemental Table S2. Box-plot diagrams (Figure 4D) representing 200 simulations each for the mutants and wild type confirm in a quantitative manner the decrease in active nuclear movements in the absence of Bik1 (shorter cMTs) and the increase in active nuclear movements in the absence of Kip3 (longer cMTs). Similar box-plot diagrams for simulations with six cMTs (Supplemental Figure S2A) confirm these conclusions. Of interest, nuclear movements increased monotonously as a function of the average cMT length (bik1Δ < “wild type” < kip3Δ). Between the two extremes (rare contact of nuclear cMTs with cortical Num1 in the bik1 mutant and more contact than for wild type in the kip3 mutant), the average duration of forward and backward movements increased ∼1.5- and 3.5-fold, respectively (Figure 4D). The frequency of bypassing events also increased (6.4-fold with three cMTs and 8.7-fold with six cMTs), and the frequency of tumbling events dropped ∼2-fold (Figure 4D and Supplemental Figure S2A). The flow speed of 0.009 μm/s used in the wild-type simulations (Figure 3) was also applied in these mutant simulations. Because the average cytoplasmic flow speed of the in vivo experiments was 0.013 μm/s (Grava and Philippsen, 2010), we repeated all simulations implementing this flow speed. The results were similar, except for an even higher reduction in backward movements in the simulated bik1 mutant, most likely due to the increased flow speed (see Supplemental Table S2). Taken together, these calculations demonstrate that the sole modification of cMT dynamics is sufficient to explain the phenotypes observed in bik1Δ and kip3Δ mutants, illustrating that cMT dynamics is a key parameter governing nuclear motions in hyphae.
The visualization of the simulated nuclear movements controlled by S. cerevisiae cMT dynamics (Figure 4C, right) shows a rather passive moving pattern of the five nuclei, which seem to mainly migrate with the applied flow speed. We computed 200 simulations (1000 nuclei) with three cMTs nucleated per nucleus (Supplemental Video S7), as well as another set with six cMTs per nucleus, and quantified the movements (see summary in Supplemental Table S2). Nuclei dynamic parameters are very similar to those observed in the simulated bik1Δ mutant, in which cMTs are also short and rarely reach a cortical activator to induce active movements. However, the S. cerevisiae simulation reveals longer-lasting backward movements and a still low but higher frequency of bypassing events compared with the bik1 mutant. We performed this experiment knowing that A. gossypii evolved from a S. cerevisiae–like ancestor, and we thus had wondered about the extent to which the adaptation of cMT dynamics has been important in switching from a budding mechanism to filamentous growth. The simulation indicates that an increase of the cMT growth rate, possibly through the adjusted influence of MT-associated proteins, without changing the catastrophe rate could have been sufficient to induce movements of nuclei against the cytoplasmic stream and also nuclear bypassing. This scenario, however, would have worked only with a simultaneous 10-fold density increase of cortical Num1 patches, as demonstrated in the next section.
Nuclear movements require an adapted density of cortical anchors
The minus end–directed MT motor dynein is responsible for all active nuclear movements in A. gossypii. It localizes to minus ends and plus ends of cMTs and also along cMTs. Hyphae with inactivated dynactin or Num1 show severely reduced active nuclear movements concomitant with enrichment of dynein at cMT plus ends (Grava et al., 2011). These phenotypes and the observed onset of pulling, when a cMT slides along the hyphal cortex, described by the same authors, support a mechanism for cortical pulling known from studies in S. cerevisiae. The dynein/dynactin complex is believed to be inactive while transported either by the kinesin Kip2 toward the cMT plus ends or directly recruited to plus ends from the cytoplasm (Markus et al., 2009; Markus and Lee, 2011; Roberts et al., 2014). When the cMT plus end associates with a cortical Num1 patch during sliding at the plasma membrane, the dynein/dynactin complex is off-loaded, anchored with the amino-terminal tail of Dyn1, the dynein heavy chain, to the amino-terminal binding domain of Num1, and the dynein motor is activated to eventually pull on the cMT on which it was previously hitchhiking (Lee et al., 2003; Moore et al., 2009; Markus and Lee, 2011). Recently it was demonstrated that dynein is directly switched on by the cortical anchor Num1 (Lammers and Markus, 2015).
The dynein-binding domain and the lipid-binding domain of ScNum1 are conserved in AgNum1, and recently patches of an AgNum1-GFP fusion were observed at the A. gossypii cortex (Doris Landmann, personal communication). Knowing the close evolutionary relation between S. cerevisiae and A. gossypii, we assumed a similar role of Num1 in anchoring and activating dynein in both organisms. Because the cortical density of Num1 patches is unknown, we ran simulations with different numbers of randomly distributed cortical anchors. As described earlier, we envisage that these anchors will engage cMTs that are within their reach and immediately recruit dynein. The duration of a pulling event is then determined by the off-rate of the motor domain to the cMT (see Materials and Methods). In terms of nuclear movements, this simplified model is sufficient because forces are created only when dynein is anchored at the cortex and engaged with a cMT. With this model, the density of anchors on the cortex (∼0.7 anchor/µm2 in all simulations discussed so far) is the key parameter controlling the efficacy of dynein-mediated cortical pulling. Hence, varying the absolute number of anchors in the simulation can be qualitatively compared with the phenotypes of changing the overall dynein expression level in live cells.
Experimentally reducing the expression level of the dynein heavy chain by truncating the AgDYN1 promoter decreases oscillatory and bypassing-movement frequencies (Grava et al., 2011). In simulations, reducing the amount of anchors 2-fold (Supplemental Video S8) or 10-fold (Supplemental Video S9) clearly reduced active nuclear movements (see also Figure 5A and Supplemental Table S3). The reduction in density also increases the movement frequency ratio (Figure 5B, top; by favoring forward movements induced by the cytoplasmic flow), decreases the frequency of bypassing events (Figure 5B, middle), and increases the frequency of tumbling events (Figure 5B, bottom), as previously described in vivo for the prom180-DYN1 and prom130-DYN1 strains, in which the DYN1 promoter was shortened to 180 or 130 base pairs of the original sequence upstream of the start codon, thereby reducing gene expression (Grava et al., 2011). We then continuously varied the anchor density from 0 to 1000 molecules per 30 μm of hypha (0–3.5 anchors/µm2). Above a certain threshold of anchor density, the pattern of nuclear movements is constant and determined purely by cMT encounters with cortex-bound Num1 patches. The value of the threshold is lower with six cMTs per nucleus (Figure 5C, bottom) than with three cMTs per nucleus (Figure 5C, top), indicating that increasing the density of anchors can compensate for a reduced count of cMTs. This can be understood in terms of dynein pulling on a single cMT being sufficient to move a nucleus. In the saturated regime in which anchors are in excess, the frequency ratio is close to 1 (Figure 5D, left). However, the value measured experimentally is ∼1.6, suggesting that active force generation is indeed limiting in vivo. In other words, not every cMT contacting the cortex in vivo is pulled by dynein. The same conclusion can be derived from the frequencies of bypassing events: the measured in vivo value of ∼0.026/min is only half of the predicted plateau value of 0.05/min (Figure 5D, right). Taken together, these results show that, despite necessary simplifications, our model has captured how nuclear movements depend on dynein as measured in vivo.
Of interest, an amount of 20 anchors per hypha segment, which corresponds to 0.07 anchor/µm2, also matches the observed density of Num1 patches in S. cerevisiae (∼8 patches/cell). The fact that at this density only very few movements are produced in our simulation (Figure 5, A and B) demonstrates that A. gossypii had to adjust the density of Num1 patches to be compatible with hyphal growth. Specifically, our simulations suggest that a 10-fold increase in anchor density would allow enough cMT capture to promote sufficient nuclear movements.
The effect of cytoplasmic streaming on nuclear movements depends on cMT number
To further explore the role of cMT number on the balance between forward and backward movements, we searched for its importance in the context of varying flow speeds. Indeed, hypha growth speed— and the resulting cytoplasmic flow—was previously shown to affect the balance between forward and backward movements (Lang et al., 2010b). However, the role of cMT number in this balance has not been investigated yet. We therefore ran simulations with flow speeds randomly varying between 0 and 0.02 µm/s, corresponding to the range of hypha growth speeds for which in vivo data were previously collected (Lang et al., 2010b). The cMT length was controlled as in wild type. For either condition, with three or six cMTs per nucleus, we generated 200 random values for the flow speed and ran three simulations for each of them. For both conditions, the frequency of forward movements was roughly independent of flow speed (frequencies being lower with six cMTs, on average; Figure 6A), whereas backward movements decreased with increasing flow speed, and this decrease was more pronounced if the nuclei nucleated three cMTs (Figure 6B). The movement-frequencies ratio thus remains quite stable for nuclei nucleating six cMTs but gets higher and highly biased toward forward movements with increasing flow speed for nuclei nucleating three cMTs (Figure 6C). Of note, the values of frequencies and ratios observed in our simulations are in agreement with the values measured experimentally, once these are plotted according to the naturally occurring variable hypha growth rates (Figure 6, A–C, blue dots). Visualizations of nuclear movement patterns for both conditions at a flow speed of 0 and 0.02 µm/s are presented in Figure 6, D and E, respectively. These patterns show that at a flow speed of 0 µm/s, there is no bias for any direction of movement (Figure 6D; three cMTs, Supplemental Video S10; six cMTs, Supplemental Video S11). However, at a flow speed of 0.02 µm/s, a clear bias for forward movements is visible, more significantly for nuclei nucleating three cMTs (Figure 6E; three cMTs, Supplemental Video S12; six cMTs, Supplemental Video S13). Is this clear difference between three and six cMTs per nucleus also seen when flow speeds are tested in hyphae with altered average cMT lengths, as in the bik1 or kip3 mutants? The answer is yes, when cMTs are slightly longer as in the kip3 mutant, and no, when the cMTs are too short in the bik1 mutant, either with three cMTs (Supplemental Figure S2B) or six cMTs (Supplemental Figure S2C).
Finally, because hyphal growth can reach speeds as high as 0.05 µm/s, we wondered whether the reduced bias for increased cMT number would still be true in such extreme cases. We thus ran additional simulations with flow speeds now randomly varying between 0 and 0.05 µm/s. For either condition, with three or six cMTs per nucleus, we generated 500 random values for the flow speed and ran three simulations for each of them. Of interest, the movement-frequencies ratios remained much lower for nuclei nucleating six cMTs than for nuclei nucleating three cMTs even at very high flow speeds (Figure 6F). Taken together, these results suggest that having additional cMTs may reduce the bias for forward movements that occurs at rapid hyphal growth, that is, large flow speeds. This also argues for an evolutionary advantage of spending more time in the G2 phase of the nuclear cycle as compared with a S. cerevisiae–like ancestor, allowing the nuclei to carry duplicated side-by-side SPBs for a longer time than in S. cerevisiae (Jaspersen and Winey, 2004).
Organelle crowding interferes with nuclear movements
The cytoplasm of A. gossypii hyphae is a crowded environment (Figure 3D), and, in particular, larger organelles may hinder the movements of the nuclei. We ran three sets of simulations to test the influence of organelles (Figure 7). In the first set, hyphae were lacking simulated organelles (Figure 7A). In the second set, mitochondria occupying 8.8% of the cytoplasm (Gibeaux et al., 2013) were represented as 550 (orange) spheres of 0.4 µm diameter, and other large organelles (mainly vacuoles) occupying 2.5% of the cytoplasm (Gibeaux et al., 2013) were represented as 50 (blue) spheres of 0.6 µm diameter. This condition, which is derived from electron tomography measurements, is referred to as “wild type” and was used for all simulations of this article. In the third set, referred to as “highly crowded,” “mitochondria” were unaltered, but the diameter of the “vacuoles” was inflated to 1.4 µm (Figure 7A), simulating the condition in older hyphae (Walther and Wendland, 2004). A soft excluded-volume interaction is present between all objects (see Materials and Methods). Similar results were obtained for simulations with either three cMTs (Figure 7, B and C, and Supplemental Videos S14 and S15) or six cMTs (Supplemental Figure S3, A and B) per nucleus. The averages for nuclear motility parameters determined from these simulations are summarized in Supplemental Table S4. Between the “empty” and the “highly crowded” simulations, the average duration of forward movements was reduced by ∼10% (the ratio was 1.16 with three and 1.10 with six cMTs). Crowding also reduced the average duration of backward movements by ∼5% (ratios were 1.05 and 1.04), reduced the frequency of bypassing events (ratios 1.05 and 1.30), and increased the frequency of tumbling events by ∼20% (ratios 1.18 and 1.17). All of these differences are small, which may indicate that the load on dynein motors is only a small fraction of their stall force, because the viscous drag on the nucleus and the impeding surrounding objects do not provide much resistance. We next asked whether, as for cMT number, the presence of organelles could also change the balance of movements as a function of hypha growth speed. We thus ran simulations with random flow speeds as described for Figure 6, with no or high crowding. For the two conditions, the curves representing the frequencies of forward and backward movements and their ratio overlapped for all values of the cytoplasmic flow speed (Figure 7C and Supplemental Figure S3B). Taken together, these computations show that the larger organelles affect nuclear dynamics. Unfortunately, the very likely additional influence of the different forms of the endoplasmic reticulum (ER) could not be investigated. ER structures close to the nuclear envelop, within hyphae, and close to the cortex were observed by electron tomography (Gibeaux et al., 2013), but the ER network is complex, as shown in budding yeast (West et al., 2011), and could not be modeled simply.
DISCUSSION
Prior genetic and live-imaging studies showed that cMT factors and the dynein motor protein were necessary for the active movements of nuclei in multinucleated hyphae of A. gossypii. From these data, it was possible to hypothesize that the oscillatory movements of nuclei in growing hyphae of A. gossypii evolved from the S. cerevisiae Dyn1-Num1 pathway, which is essential for the pulling of the anaphase spindle into the bud concomitant with its forth and back pulling through the bud neck. This now seems to be a viable hypothesis. By simulating the process from first principles, we demonstrated here that the pulling action of cortically anchored dynein motors on cMTs originating from the SPB is sufficient to explain active nuclear movements observed in vivo in a quantitative manner. Of importance, the obtained agreement between experiments and models was not achieved by adjusting various parameters to fit the desired behavior. Instead, the key parameters of the model, except one, were previously determined experimentally (see Table 2), including the diameter of the cell, the densities and dimensions of the nuclei and other objects (Gibeaux et al., 2013), the number of cMTs per nuclei (Gibeaux et al., 2012), the growth rate at the plus ends, and MT lengths in the mutants (Grava and Philippsen, 2010). These most recent values allowed us to estimate the catastrophe rate by fitting the length distribution. We used the motile and force parameters of yeast dynein, which had been measured in single-molecule biophysical studies. The only unknown biological parameter was the density of cortical anchors in the simulation, which encompasses unknown factors such as the concentration of dynein molecules in the cell and the effectiveness of the transport, activation, and anchoring mechanisms. We therefore explored the effect of this parameter systematically (Figure 5). As expected, reducing the quantity of anchors in the cell directly reduced or disabled nuclear movements, but increasing anchor density quickly led to a plateau in which every cMT contacting the cortex found at least one force generator (Figure 5C). We selected an intermediate value, which allowed us to fit all of the experimental data (see Figure 3 and summary of the quantifications in Table 1). The model reproduced the leading position of the SPB on the nucleus during the movements (Supplemental Video S4) and recapitulated the rates of forward and backward movements observed for different values of the cytoplasmic flow both qualitatively and quantitatively (Figure 6). By comparing the observed motion of the nuclei and the dependence in the simulation as a function of the density of cortical anchors, we concluded that not every cMT contacting the cortex would be pulled by dynein (Figure 5). This indicates that cytoplasmic flow and dynein-generated forces both contribute significantly to nuclear motions. This is interesting because the associated motions are physically of a different nature. Cytoplasmic flow is a convective motion, and the total distance traveled is proportional to time,  . The dynein-mediated movements, however, are stochastically directed toward or away from the hypha tip, producing without flow and at long time scales a diffusive motion characterized by the relation
  . Because dynein easily overcomes the hydrodynamic drag of the nuclei, the motion is purely diffusive also in the presence of flow when cortical anchors are in excess (Figure 5, when the ratio of forward/backward movement frequencies is ∼1). It seems more advantageous biologically to remain away from this regime in order to benefit both from a convective motion that keeps the nuclei equidistant to the growing tip of the hyphae and from the dynein-mediated active diffusion, which permutes nuclei. This means that the cell must avoid excessive cortical pulling on its cMTs by keeping the density of anchors below a certain threshold or via some other mechanism.
The model revealed some interesting findings that help us reinterpret recent experimental results. First, the simulations matched the in vivo observations better with six cMTs nucleated per nucleus than with three (Table 1). We interpret this to reflect that a high proportion of nuclei carry duplicated side-by-side SPBs, which is consistent with the fact that, although SPBs nucleate three cMTs on average (Gibeaux et al., 2012), up to six cMTs were observed in live imaging of GFP-AgTub1 “wild-type” cells (Lang et al., 2010b). Second, our analysis regarding cMT dynamics (Figure 4) demonstrated that the mutant behavior in bik1Δ and kip3Δ cells could be explained solely by a change in the cMT properties at the plus end (polymerization and catastrophe rate). Of importance, this model also highlighted several adjustments that A. gossypii had to undergo to adapt its nuclear movements to hyphal growth from a S. cerevisiae–like ancestor. Specifically, cMTs became 4-fold longer, mostly through an increased growth rate, making them able to reach the cortex (Figure 4). In addition, the density of anchors at the cortex also had to increase, possibly 10-fold, as suggested by our simulations, to allow enough cMT capture (Figure 5). Of interest, these adaptations seem enough to provide robustness with respect to the high, and changing, organelle density required for hyphal growth (Figure 7).
By keeping our model minimal, we could thus demonstrate that a small set of ingredients is enough to explain the basis of the nuclear movements observed in the growing hyphae of A. gossypii. Nevertheless, some open questions remain. For example, we did not include nuclear division, the true elongation of the hyphae, or their branching geometry. In addition, the growth of cMTs occurs at a constant speed in our model but could be regulated, for example, by cortical ER, which is substantial in budding yeast (West et al., 2011). The model omitted the formation of septa because this only occurs in older regions of the hyphae. These processes will all be exciting to simulate in the future, but additional work is required to extend and exploit the model.
A process of nuclear repulsion was proposed (Anderson et al., 2013) that leads to the creation of cytoplasmic territories and enables division autonomy in A. gossypii. These territories increase in size as a nucleus approaches mitosis. They might be mediated by cMT, as it was suggested earlier that cMTs from neighboring nuclei could interact with and repulse each other (Philippsen et al., 2005). However, live-cell imaging and high-resolution analysis of the cMT cytoskeleton by electron tomography did not reveal such interactions (Lang et al., 2010b; Gibeaux et al., 2012). The mechanism of the repulsion is thus unknown, precluding its implementation in the simulation. Nuclei repulsion in A. gossypii is inferred from the shape of the distribution of distances between pairs of adjacent nuclei (Anderson et al., 2013). We thus derived such distributions from the 12 reference live-cell movies and 12 simulations (Supplemental Figure S1D). We confirmed that nuclei are not distributed randomly in live hyphae but instead are separated by a characteristic distance. For the simulations, we found however, a distribution that is close to what would be expected if the nuclei were randomly positioned, with a minor indication for nuclear repulsion (Supplemental Figure S1D; see legend for more details).
Nuclear movements were different between three or six cMTs emanating per nucleus but remained similar in many aspects, especially with regard to their bypassing frequencies (Table 1). Still, the reported bypassing frequencies are six times higher for a nucleus in G1 than in G2 (Gibeaux et al., 2012). According to our model, the duplication state of the SPB, however, is not expected to account for this observation. This thus raises a more general and fascinating question: how can a nucleus control its movements while progressing through the nuclear cycle? Regulating cMT dynamics at the plus end can lead to direct changes in nuclear behavior (Figure 4 and Supplemental Figure S2), but how could different SPBs contained in a common cytoplasm provide variable cMT dynamics? The challenge is that both the site of force production and the plus end of the cMT that is pulling a nucleus may be distant from this nucleus. They may be located closer to another nucleus, such that any diffusible substance emitted by a nucleus would not target the productive cMT. Nature has found a solution, however: during mitosis in S. cerevisiae, for example, proteins are able to localize asymmetrically on the two SPBs, although the cytoplasm is shared. This is the case for Kar9 (Liakopoulos et al., 2003) and Bub2 (Pereira et al., 2000), for instance. Of interest, the asymmetric localization of Kar9 to one SPB (and MT plus ends) requires a fine regulation through the cyclin-dependent kinase Cdc28. Bik1 binds directly to Kar9 and promotes its phosphorylation, which affects its asymmetric localization to one SPB and associated cMTs (Moore et al., 2006; Moore and Miller, 2007). Moreover, it has also been shown that the XMAP215 homologue Stu2 localizes on the SPB and thus regulates the dynamics of the cMTs anchored to it (Usui et al., 2003). It is therefore possible to imagine that a nucleus, by adjusting the state of the SPBs, could control plus-end cMT dynamics throughout the nuclear cycle and therefore its movements. However, whether this is the case in the multinucleated hyphae of A. gossypii has not been investigated yet. It is relevant to note that dynein is symmetrically distributed to preanaphase SPBs of A. gossypii (Grava et al., 2011; Grava and Philippsen, unpublished data), whereas asymmetric distribution has been reported for the preanaphase SPBs in S. cerevisiae (Grava et al., 2006). Hence, investigating the nature of mechanisms able to regulate the motile machinery as a function of the nucleus cycle will be an exciting task for future research. Finally, our study highlights that, beyond its usefulness to validate a particular model, modular software such as Cytosim can be used to simulate the cytoskeleton in many different configurations and thus offers a way to unify our understanding of nuclear migration across the eukaryotic kingdoms.
MATERIALS AND METHODS
Extraction of nuclei 2D coordinates from live-imaging data
We used three recordings of live hyphae expressing GFP-tagged histone H4 (Supplemental Table S1 and Supplemental Video S1). The methods used to generate these movies are described in the corresponding references. From 12 hyphae recorded over 25–30 min, we extracted the 2D coordinates of the hypha tip and that of the first five proximal nuclei (and their progeny). Tracking was done in Fiji (Schindelin et al., 2012) using the tracking plug-in from Fabrice Cordelières (Institut Curie, Paris, France). Coordinates were exported as a text file and further processed with MATLAB (MathWorks). The vector described by the coordinates of the hypha basis and tip was used to apply a rotational matrix to the data points along the hypha axis so that all hyphae can be uniformly analyzed with each other and with the simulations. Except for the analysis presented in Supplemental Figure S1, we smoothed the trajectories using a Savitzky–Golay filter (smooth function, “sgolay” method, default span and degree) to account for pixel size–derived inaccuracy of tracking resulting in artifactual nuclear displacements. The average growth speed of each hypha was calculated from the tip positions at the start and end of the movies, and the resulting value was used as a threshold for the classification of the nuclear movements.
First-principles modeling of nuclear dynamics
The model of nuclear movements in A. gossypii was developed using Cytosim, a stochastic engine that can simulate flexible cytoskeletal fibers, diffusible particles, and other objects in a confined environment (Nedelec and Foethke, 2007). Cytosim is based on Brownian dynamics, as well as on a stochastic description of the most relevant microscopic processes, such as binding/unbinding of molecules. The motion of a sphere located at position x is defined by an overdamped Langevin equation, 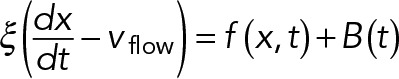 , where the right-hand terms are the deterministic and random forces, respectively, and ξ is a drag coefficient calculated with Stokes’ law from the viscosity and the size of the sphere. Such equations are suitable because they accurately describe the motion of small objects in a viscous fluid, characterized by a very low Reynolds number (Nedelec and Foethke, 2007). The equations for filaments are similar, and were given previously (Nedelec and Foethke, 2007). A soft excluded-volume interaction limits the overlapping of the objects in the simulation. If two spheres of radius R and R′ are at positions x and x′ such that
 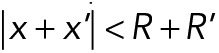 , a Hookean force of resting length
  and stiffness 100 pN/µm is applied between the two centers. Similarly, the objects are also confined within the cylinder by forces that are always perpendicular to the cylinder, corresponding to frictionless boundaries. For simplicity, the hypha cell is simulated as a cylinder with periodic boundaries, a standard approach to simulate an unbounded system. Its fluid is in uniform motion and drags along all objects within, but we neglected the variations of flow along the hyphae (Supplemental Figure S1C) because this would not be consistent with periodic boundaries. We also neglected the Poiseuille flow profile that is expected in the transverse section of the hypha and also all kinds of hydrodynamic interactions by which the motion of a nucleus could affect nearby nuclei. Cortical anchors are randomly positioned on the cylinder surface and remain immobile. An anchor can engage any cMT that comes within its capture radius (75 nm) at a specified rate (5 s−1). Engaged anchors immediately recruit a dynein force generator, which is governed by a linear force–velocity relationship: they move near their maximum speed (25 nm/s) toward the minus end if the resting force is small and stall at a force of 7 pN. The duration of the interaction is determined by the exerted force with detachment rate constant
 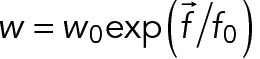 , with f0 = 7 pN and w0 = 0.64 s−1. At the start of the simulations, five nuclei are randomly positioned within the hypha, and spheres are added randomly to mimic volume occupancy due to large cytoplasmic organelles. We used 550 beads of 0.4 μm diameter to fill 8.8% of the cytoplasm and 50 beads of 0.6 μm diameter for 2.5%, as occupied by mitochondria and other large, spherical organelles, respectively (Gibeaux et al., 2013). The nuclei are spherical, and one point with three or six cMT nucleators on their surface represents the SPB. Each nucleator can generate one cMT and will stay attached and inactive to the minus end of this cMT, which is not dynamic. Cytoplasmic MTs are thus anchored through their minus ends to the SPB, allowing unrestricted rotational freedom so that they can orient in all directions as previously observed (Lang et al., 2010b; Gibeaux et al., 2012). Cytoplasmic MTs grow—and stochastically switch to shrinkage—from their plus ends at a constant speed and with previously described dynamics (Grava and Philippsen, 2010). When a cMT eventually disappears, it is replaced by a new one with a nucleation time of 1 s, such that the number of cMT per SPB is nearly always maximal. This new cMT is created with a random orientation. The number of cMT in the simulation is thus either three or six, corresponding to the average number of cMTs measured in cells for isolated or paired SPBs. We have not included the variability around the mean in the number of cMTs to better observe the difference between the two conditions. The key physical parameters of the model were obtained from the literature (Table 2). Numerical parameters are appropriately chosen to ensure sufficient precision (e.g., the time step was 50 ms). The MT assembly dynamics requires ∼100 s to equilibrate (this time is determined by the catastrophe time), whereas steric overlaps are resolved much faster. For extra safety, we skipped 600 s from the initial configuration and recorded the trajectories of the nuclei for 1800 s (30 min) at 2-s intervals. From these records, the 3D coordinates at 30-s intervals (to match the experimental data) and the flow speed (to be used as a threshold for the movement analysis) were directly processed with MATLAB for analysis. Cytosim is an Open Source project (www.github.com/nedelec/cytosim), and the configuration file to run the wild-type simulation is provided as supplementary material.
Automated analysis of nuclei dynamics
Nuclei coordinates along time from both experimental and simulation sources were analyzed similarly using MATLAB. Minor differences in the analysis were imposed by the fact that experimental data were effectively 2D, whereas the simulation data were 3D, with periodic boundaries limits. For individual nucleus, speeds and directions were calculated at each time point. From this and the flow speed (obtained from hypha growth speed or set parameter in the simulation and used as threshold), the durations of forward, backward, and tumbling events were calculated. The frequency, average duration, and average speed (i.e., average of the instantaneous velocities) of these events were then deducted. The x-position offset from the center of one nucleus to any other one was calculated, and a change in sign was used to indicate a bypassing event. The frequency of these events was deducted. Statistical tests and plots were performed in Microsoft Excel or MATLAB (box plots were generated using Rob Campbell's notBoxPlot function in MATLAB). All MATLAB scripts written for this article can be obtained upon request.
Supplementary Material
Acknowledgments
We thank the members of the Nédélec group for helpful discussions and support and especially all the people involved, past and present, in the development of Cytosim. We acknowledge European Molecular Biology Laboratory services for maintaining IT infrastructure and particularly the computer cluster. We are grateful to Sandrine Grava for providing raw data of microtubule length measured in A. gossypii mutants, Hans-Peter Schmitz and Doris Nordmann for AgNum1-GFP data, and Yves Barral for helpful discussions. We also thank Rebecca Heald for support and Christian Häring and Julio Belmonte for critical reading of the manuscript.
Abbreviations used:
- cMT
cytoplasmic microtubule
- 2D
two-dimensional
- 3D
three-dimensional
- EM
electron microscopy
- ER
endoplasmic reticulum
- GFP
green fluorescent protein
- MT
microtubule
- SPB
spindle pole body
- WT
wild type.
Footnotes
This article was published online ahead of print in MBoC in Press (http://www.molbiolcell.org/cgi/doi/10.1091/mbc.E16-11-0806) on January 11, 2017.
REFERENCES
- Adames NR, Cooper JA. Microtubule interactions with the cell cortex causing nuclear movements in Saccharomyces cerevisiae. J Cell Biol. 2000;149:863–874. doi: 10.1083/jcb.149.4.863. [DOI] [PMC free article] [PubMed] [Google Scholar]
- Akhmanova A, van den Heuvel S. Tipping the spindle into the right position. J Cell Biol. 2016;213:293–295. doi: 10.1083/jcb.201604075. [DOI] [PMC free article] [PubMed] [Google Scholar]
- Alberti-Segui C, Dietrich F, Altmann-Jöhl R, Hoepfner D, Philippsen P. Cytoplasmic dynein is required to oppose the force that moves nuclei towards the hyphal tip in the filamentous ascomycete Ashbya gossypii. J Cell Sci. 2001;114:975–986. doi: 10.1242/jcs.114.5.975. [DOI] [PubMed] [Google Scholar]
- Anderson CA, Eser U, Korndorf T, Borsuk ME, Skotheim JM, Gladfelter AS. Nuclear repulsion enables division autonomy in a single cytoplasm. Curr Biol. 2013;23:1999–2010. doi: 10.1016/j.cub.2013.07.076. [DOI] [PMC free article] [PubMed] [Google Scholar]
- Bruusgaard JC, Liestøl K, Ekmark M, Kollstad K, Gundersen K. Number and spatial distribution of nuclei in the muscle fibres of normal mice studied in vivo. J Physiol. 2003;551:467–478. doi: 10.1113/jphysiol.2003.045328. [DOI] [PMC free article] [PubMed] [Google Scholar]
- Cadot B, Gache V, Vasyutina E, Falcone S, Birchmeier C, Gomes ER. Nuclear movement during myotube formation is microtubule and dynein dependent and is regulated by Cdc42, Par6 and Par3. EMBO Rep. 2012;13:741–749. doi: 10.1038/embor.2012.89. [DOI] [PMC free article] [PubMed] [Google Scholar]
- Carminati JL, Stearns T. Microtubules orient the mitotic spindle in yeast through dynein-dependent interactions with the cell cortex. J Cell Biol. 1997;138:629–641. doi: 10.1083/jcb.138.3.629. [DOI] [PMC free article] [PubMed] [Google Scholar]
- Caudron F, Andrieux A, Job D, Boscheron C. A new role for kinesin-directed transport of Bik1p (CLIP-170) in Saccharomyces cerevisiae. J Cell Sci. 2008;121:1506–1513. doi: 10.1242/jcs.023374. [DOI] [PubMed] [Google Scholar]
- Dietrich F, Voegeli S, Brachat S, Lerch A, Gates K, Steiner S, Mohr C, Pöhlmann R, Luedi P, Choi S, et al. The Ashbya gossypii genome as a tool for mapping the ancient Saccharomyces cerevisiae genome. Science. 2004;304:304–307. doi: 10.1126/science.1095781. [DOI] [PubMed] [Google Scholar]
- Dietrich FS, Voegeli S, Kuo S, Philippsen P. Genomes of Ashbya fungi isolated from insects reveal four mating-type loci, numerous translocations, lack of transposons, and distinct gene duplications. G3 (Bethesda) 2013;3:1225–1239. doi: 10.1534/g3.112.002881. [DOI] [PMC free article] [PubMed] [Google Scholar]
- Dogterom M, Yurke B. Measurement of the force-velocity relation for growing microtubules. Science. 1997;278:856–860. doi: 10.1126/science.278.5339.856. [DOI] [PubMed] [Google Scholar]
- Dupin I, Etienne-Manneville S. Nuclear positioning: mechanisms and functions. Int J Biochem Cell Biol. 2011;43:1698–1707. doi: 10.1016/j.biocel.2011.09.004. [DOI] [PubMed] [Google Scholar]
- Fink G, Schuchardt I, Colombelli J, Stelzer E, Steinberg G. Dynein-mediated pulling forces drive rapid mitotic spindle elongation in Ustilago maydis. EMBO J. 2006;25:4897–4908. doi: 10.1038/sj.emboj.7601354. [DOI] [PMC free article] [PubMed] [Google Scholar]
- Foe VE, Alberts BM. Studies of nuclear and cytoplasmic behaviour during the five mitotic cycles that precede gastrulation in Drosophila embryogenesis. J Cell Sci. 1983;61:31–70. doi: 10.1242/jcs.61.1.31. [DOI] [PubMed] [Google Scholar]
- Foethke D, Makushok T, Brunner D, Nédélec F. Force- and length-dependent catastrophe activities explain interphase microtubule organization in fission yeast. Mol Syst Biol. 2009;5:241. doi: 10.1038/msb.2008.76. [DOI] [PMC free article] [PubMed] [Google Scholar]
- Fraile R, García-Ortega E. Fitting an exponential distribution. J Appl Meteorol. 2005;44:1620–1625. [Google Scholar]
- Gennerich A, Carter AP, Reck-Peterson SL, Vale RD. Force-induced bidirectional stepping of cytoplasmic dynein. Cell. 2007;131:952–965. doi: 10.1016/j.cell.2007.10.016. [DOI] [PMC free article] [PubMed] [Google Scholar]
- Gibeaux R, Hoepfner D, Schlatter I, Antony C, Philippsen P. Organization of organelles within hyphae of Ashbya gossypii revealed by electron tomography. Eukaryot Cell. 2013;12:1423–1432. doi: 10.1128/EC.00106-13. [DOI] [PMC free article] [PubMed] [Google Scholar]
- Gibeaux R, Lang C, Politi AZ, Jaspersen SL, Philippsen P, Antony C. Electron tomography of the microtubule cytoskeleton in multinucleated hyphae of Ashbya gossypii. J Cell Sci. 2012;125:5830–5839. doi: 10.1242/jcs.111005. [DOI] [PubMed] [Google Scholar]
- Gittes F, Mickey B, Nettleton J, Howard J. Flexural rigidity of microtubules and actin filaments measured from thermal fluctuations in shape. J Cell Biol. 1993;120:923–934. doi: 10.1083/jcb.120.4.923. [DOI] [PMC free article] [PubMed] [Google Scholar]
- Gladfelter AS, Hungerbuehler AK, Philippsen P. Asynchronous nuclear division cycles in multinucleated cells. J Cell Biol. 2006;172:347–362. doi: 10.1083/jcb.200507003. [DOI] [PMC free article] [PubMed] [Google Scholar]
- Grava S, Keller M, Voegeli S, Seger S, Lang C, Philippsen P. Clustering of nuclei in multinucleated hyphae is prevented by dynein-driven bidirectional nuclear movements and microtubule growth control in Ashbya gossypii. Eukaryot. Cell. 2011;10:902–915. doi: 10.1128/EC.05095-11. [DOI] [PMC free article] [PubMed] [Google Scholar]
- Grava S, Philippsen P. Dynamics of multiple nuclei in Ashbya gossypii hyphae depend on the control of cytoplasmic microtubules length by Bik1, Kip2, Kip3, and not on a capture/shrinkage mechanism. Mol Biol Cell. 2010;21:3680–3692. doi: 10.1091/mbc.E10-06-0527. [DOI] [PMC free article] [PubMed] [Google Scholar]
- Grava S, Schaerer F, Faty M, Philippsen P, Barral Y. Asymmetric recruitment of dynein to spindle poles and microtubules promotes proper spindle orientation in yeast. Dev Cell. 2006;10:425–439. doi: 10.1016/j.devcel.2006.02.018. [DOI] [PubMed] [Google Scholar]
- Gundersen GG, Worman HJ. Nuclear positioning. Cell. 2013;152:1376–1389. doi: 10.1016/j.cell.2013.02.031. [DOI] [PMC free article] [PubMed] [Google Scholar]
- Huang B, Huffaker TC. Dynamic microtubules are essential for efficient chromosome capture and biorientation in S. cerevisiae. J Cell Biol. 2006;175:17–23. doi: 10.1083/jcb.200606021. [DOI] [PMC free article] [PubMed] [Google Scholar]
- Hwang E, Kusch J, Barral Y, Huffaker TC. Spindle orientation in Saccharomyces cerevisiae depends on the transport of microtubule ends along polarized actin cables. J Cell Biol. 2003;161:483–488. doi: 10.1083/jcb.200302030. [DOI] [PMC free article] [PubMed] [Google Scholar]
- Jaspersen SL, Winey M. The budding yeast spindle pole body: structure, duplication, and function. Annu Rev Cell Dev Biol. 2004;20:1–28. doi: 10.1146/annurev.cellbio.20.022003.114106. [DOI] [PubMed] [Google Scholar]
- King SJ, Schroer TA. Dynactin increases the processivity of the cytoplasmic dynein motor. Nat Cell Biol. 2000;2:20–24. doi: 10.1038/71338. [DOI] [PubMed] [Google Scholar]
- Kiyomitsu T. Mechanisms of daughter cell-size control during cell division. Trends Cell Biol. 2015;25:286–295. doi: 10.1016/j.tcb.2014.12.003. [DOI] [PubMed] [Google Scholar]
- Kosco KA, Pearson CG, Maddox PS, Wang PJ, Adams IR, Salmon ED, Bloom KS, Huffaker TC. Control of microtubule dynamics by Stu2p is essential for spindle orientation and metaphase chromosome alignment in yeast. Mol Biol Cell. 2001;12:2870–2880. doi: 10.1091/mbc.12.9.2870. [DOI] [PMC free article] [PubMed] [Google Scholar]
- Kotak S, Gönczy P. Mechanisms of spindle positioning: cortical force generators in the limelight. Curr Opin Cell Biol. 2013;25:741–748. doi: 10.1016/j.ceb.2013.07.008. [DOI] [PubMed] [Google Scholar]
- Kusch J, Meyer A, Snyder MP, Barral Y. Microtubule capture by the cleavage apparatus is required for proper spindle positioning in yeast. Genes Dev. 2002;16:1627–1639. doi: 10.1101/gad.222602. [DOI] [PMC free article] [PubMed] [Google Scholar]
- Lammers LG, Markus SM. The dynein cortical anchor Num1 activates dynein motility by relieving Pac1/LIS1-mediated inhibition. J Cell Biol. 2015;211:309–322. doi: 10.1083/jcb.201506119. [DOI] [PMC free article] [PubMed] [Google Scholar]
- Lang C, Grava S, Finlayson M, Trimble R, Philippsen P, Jaspersen SL. Structural mutants of the spindle pole body cause distinct alteration of cytoplasmic microtubules and nuclear dynamics in multinucleated hyphae. Mol Biol Cell. 2010a;21:753–766. doi: 10.1091/mbc.E09-07-0555. [DOI] [PMC free article] [PubMed] [Google Scholar]
- Lang C, Grava S, van den Hoorn T, Trimble R, Philippsen P, Jaspersen SL. Mobility, microtubule nucleation and structure of microtubule-organizing centers in multinucleated hyphae of Ashbya gossypii. Mol Biol Cell. 2010b;21:18–28. doi: 10.1091/mbc.E09-01-0063. [DOI] [PMC free article] [PubMed] [Google Scholar]
- Lee C, Zhang H, Baker AE, Occhipinti P, Borsuk ME, Gladfelter AS. Protein aggregation behavior regulates cyclin transcript localization and cell-cycle control. Dev Cell. 2013;25:572–584. doi: 10.1016/j.devcel.2013.05.007. [DOI] [PMC free article] [PubMed] [Google Scholar]
- Lee W-L, Kaiser MA, Cooper JA. The offloading model for dynein function: differential function of motor subunits. J Cell Biol. 2005;168:201–207. doi: 10.1083/jcb.200407036. [DOI] [PMC free article] [PubMed] [Google Scholar]
- Lee W-L, Oberle JR, Cooper JA. The role of the lissencephaly protein Pac1 during nuclear migration in budding yeast. J Cell Biol. 2003;160:355–364. doi: 10.1083/jcb.200209022. [DOI] [PMC free article] [PubMed] [Google Scholar]
- Liakopoulos D, Kusch J, Grava S, Vogel J, Barral Y. Asymmetric loading of Kar9 onto spindle poles and microtubules ensures proper spindle alignment. Cell. 2003;112:561–574. doi: 10.1016/s0092-8674(03)00119-3. [DOI] [PubMed] [Google Scholar]
- Markus SM, Kalutkiewicz KA, Lee WL. She1-mediated inhibition of dynein motility along astral microtubules promotes polarized spindle movements. Curr Biol. 2012;22:2221–2230. doi: 10.1016/j.cub.2012.10.017. [DOI] [PMC free article] [PubMed] [Google Scholar]
- Markus SM, Lee W-LL. Regulated offloading of cytoplasmic dynein from microtubule plus ends to the cortex. Dev Cell. 2011;20:639–651. doi: 10.1016/j.devcel.2011.04.011. [DOI] [PMC free article] [PubMed] [Google Scholar]
- Markus SM, Plevock KM, St Germain BJ, Punch JJ, Meaden CW, Lee W-L. Quantitative analysis of Pac1/LIS1-mediated dynein targeting: Implications for regulation of dynein activity in budding yeast. Cytoskeleton (Hoboken) 2011;68:157–174. doi: 10.1002/cm.20502. [DOI] [PMC free article] [PubMed] [Google Scholar]
- Markus SM, Punch JJ, Lee W-L. Motor- and tail-dependent targeting of dynein to microtubule plus ends and the cell cortex. Curr Biol. 2009;19:196–205. doi: 10.1016/j.cub.2008.12.047. [DOI] [PMC free article] [PubMed] [Google Scholar]
- McNally FJ. Mechanisms of spindle positioning. J Cell Biol. 2013;200:131–140. doi: 10.1083/jcb.201210007. [DOI] [PMC free article] [PubMed] [Google Scholar]
- Miller RK, Rose MD. Kar9p is a novel cortical protein required for cytoplasmic microtubule orientation in yeast. J Cell Biol. 1998;140:377–390. doi: 10.1083/jcb.140.2.377. [DOI] [PMC free article] [PubMed] [Google Scholar]
- Moore JK, D'Silva S, Miller RK. The CLIP-170 homologue Bik1p promotes the phosphorylation and asymmetric localization of Kar9p. Mol Biol Cell. 2006;17:178–191. doi: 10.1091/mbc.E05-06-0565. [DOI] [PMC free article] [PubMed] [Google Scholar]
- Moore JK, Miller RK. The cyclin-dependent kinase Cdc28p regulates multiple aspects of Kar9p function in yeast. Mol Biol Cell. 2007;18:1187–1202. doi: 10.1091/mbc.E06-04-0360. [DOI] [PMC free article] [PubMed] [Google Scholar]
- Moore JK, Stuchell-Brereton MD, Cooper JA. Function of dynein in budding yeast: mitotic spindle positioning in a polarized cell. Cell Motil Cytoskeleton. 2009;66:546–555. doi: 10.1002/cm.20364. [DOI] [PMC free article] [PubMed] [Google Scholar]
- Morris NR. Nuclear positioning: the means is at the ends. Curr Opin Cell Biol. 2002;15:54–59. doi: 10.1016/s0955-0674(02)00004-2. [DOI] [PubMed] [Google Scholar]
- Mouriño-Pérez RR, Roberson RW, Bartnicki-García S. Microtubule dynamics and organization during hyphal growth and branching in Neurospora crassa. Fungal Genet Biol. 2006;43:389–400. doi: 10.1016/j.fgb.2005.10.007. [DOI] [PubMed] [Google Scholar]
- Nedelec F, Foethke D. Collective Langevin dynamics of flexible cytoskeletal fibers. New J Phys. 2007;9:427–427. [Google Scholar]
- Ori-McKenny KM, Xu J, Gross SP, Vallee RB. A cytoplasmic dynein tail mutation impairs motor processivity. Nat Cell Biol. 2010;12:1228–1234. doi: 10.1038/ncb2127. [DOI] [PMC free article] [PubMed] [Google Scholar]
- Pereira G, Höfken T, Grindlay J, Manson C, Schiebel E. The Bub2p spindle checkpoint links nuclear migration with mitotic exit. Mol Cell. 2000;6:1–10. [PubMed] [Google Scholar]
- Philippsen P, Kaufmann A, Schmitz HP. Homologues of yeast polarity genes control the development of multinucleated hyphae in Ashbya gossypii. Curr Opin Microbiol. 2005;8:370–377. doi: 10.1016/j.mib.2005.06.021. [DOI] [PubMed] [Google Scholar]
- Pruyne D, Bretscher A. Polarization of cell growth in yeast. J Cell Sci. 2000;113:571–585. doi: 10.1242/jcs.113.4.571. [DOI] [PubMed] [Google Scholar]
- Ramos-García SL, Roberson RW, Freitag M, Bartnicki-García S, Mouriño-Pérez RR, Freitage M, Bartnicki-García S, Mouriño-Pérez RR. Cytoplasmic bulk flow propels nuclei in mature hyphae of Neurospora crassa. Eukaryot Cell. 2009;8:1880–1890. doi: 10.1128/EC.00062-09. [DOI] [PMC free article] [PubMed] [Google Scholar]
- Roberts AJ, Goodman BS, Reck-Peterson SL. Reconstitution of dynein transport to the microtubule plus end by kinesin. Elife. 2014;3:e02641. doi: 10.7554/eLife.02641. [DOI] [PMC free article] [PubMed] [Google Scholar]
- Roper M, Simonin A, Hickey PC, Leeder A, Glass NL. Nuclear dynamics in a fungal chimera. Proc Natl Acad Sci USA. 2013;110:12875–12880. doi: 10.1073/pnas.1220842110. [DOI] [PMC free article] [PubMed] [Google Scholar]
- Schindelin J, Arganda-Carreras I, Kaynig V, Longair M, Pietzsch T, Preibisch S, Rueden C, Saalfeld S, Schmid B, et al. Fiji: an open-source platform for biological-image analysis. Nat Methods. 2012;9:676–682. doi: 10.1038/nmeth.2019. [DOI] [PMC free article] [PubMed] [Google Scholar]
- Shaw SL, Yeh E, Maddox PS, Salmon ED, Bloom KS. Astral microtubule dynamics in yeast: a microtubule-based searching mechanism for spindle orientation and nuclear migration into the bud. J Cell Biol. 1997;139:985–994. doi: 10.1083/jcb.139.4.985. [DOI] [PMC free article] [PubMed] [Google Scholar]
- Sheeman B, Carvalho P, Sagot I, Geiser J, Kho D, Hoyt MA, Pellman D. Determinants of S. cerevisiae dynein localization and activation: implications for the mechanism of spindle positioning. Curr Biol. 2003;13:364–372. doi: 10.1016/s0960-9822(03)00013-7. [DOI] [PubMed] [Google Scholar]
- Shingyoji C, Higuchi H, Yoshimura M, Katayama E, Yanagida T. Dynein arms are oscillating force generators. Nature. 1998;393:711–714. doi: 10.1038/31520. [DOI] [PubMed] [Google Scholar]
- Straube A, Merdes A. EB3 regulates microtubule dynamics at the cell cortex and is required for myoblast elongation and fusion. Curr Biol. 2007;17:1318–1325. doi: 10.1016/j.cub.2007.06.058. [DOI] [PMC free article] [PubMed] [Google Scholar]
- Tassin AM, Maro B, Bornens M. Fate of microtubule-organizing centers during myogenesis in vitro. J Cell Biol. 1985;100:35–46. doi: 10.1083/jcb.100.1.35. [DOI] [PMC free article] [PubMed] [Google Scholar]
- Telley IA, Gaspar I, Ephrussi A, Surrey T. Aster migration determines the length scale of nuclear separation in the Drosophila syncytial embryo. J Cell Biol. 2012;197:887–895. doi: 10.1083/jcb.201204019. [DOI] [PMC free article] [PubMed] [Google Scholar]
- Tirnauer JS, O’Toole ET, Berrueta L, Bierer BE, Pellman D. Yeast Bim1p promotes the G1-specific dynamics of microtubules. J Cell Biol. 1999;145:993–1007. doi: 10.1083/jcb.145.5.993. [DOI] [PMC free article] [PubMed] [Google Scholar]
- Tolic´-Nørrelykke IM, Munteanu EL, Thon G, Oddershede L, Berg-Sørensen K. Anomalous diffusion in living yeast cells. Phys Rev Lett. 2004;93:78102. doi: 10.1103/PhysRevLett.93.078102. [DOI] [PubMed] [Google Scholar]
- Usui T, Maekawa H, Pereira G, Schiebel E. The XMAP215 homologue Stu2 at yeast spindle pole bodies regulates microtubule dynamics and anchorage. EMBO J. 2003;22:4779–4793. doi: 10.1093/emboj/cdg459. [DOI] [PMC free article] [PubMed] [Google Scholar]
- Walther A, Wendland J. Apical localization of actin patches and vacuolar dynamics in Ashbya gossypii depend on the WASP homolog Wal1p. J Cell Sci. 2004;117:4947–4958. doi: 10.1242/jcs.01377. [DOI] [PubMed] [Google Scholar]
- West M, Zurek N, Hoenger A, Voeltz GK. A 3D analysis of yeast ER structure reveals how ER domains are organized by membrane curvature. J Cell Biol. 2011;193:333–346. doi: 10.1083/jcb.201011039. [DOI] [PMC free article] [PubMed] [Google Scholar]
- Wolyniak MJ, Blake-Hodek K, Kosco K, Hwang E, You L, Huffaker TC. The regulation of microtubule dynamics in Saccharomyces cerevisiae by three interacting plus-end tracking proteins. Mol Biol Cell. 2006;17:2789–2798. doi: 10.1091/mbc.E05-09-0892. [DOI] [PMC free article] [PubMed] [Google Scholar]
- Woodruff JB, Drubin DG, Barnes G. Dynein-driven mitotic spindle positioning restricted to anaphase by She1p inhibition of dynactin recruitment. Mol Biol Cell. 2009;20:3003–3011. doi: 10.1091/mbc.E09-03-0186. [DOI] [PMC free article] [PubMed] [Google Scholar]
- Xiang X, Fischer R. Nuclear migration and positioning in filamentous fungi. Fungal Genet Biol. 2004;41:411–419. doi: 10.1016/j.fgb.2003.11.010. [DOI] [PubMed] [Google Scholar]
- Yeh E, Skibbens RV, Cheng JW, Salmon ED, Bloom KS. Spindle dynamics and cell cycle regulation of dynein in the budding yeast, Saccharomyces cerevisiae. J Cell Biol. 1995;130:687–700. doi: 10.1083/jcb.130.3.687. [DOI] [PMC free article] [PubMed] [Google Scholar]
- Yin H, Pruyne D, Huffaker TC, Bretscher A. Myosin V orientates the mitotic spindle in yeast. Nature. 2000;406:1013–1015. doi: 10.1038/35023024. [DOI] [PubMed] [Google Scholar]
Associated Data
This section collects any data citations, data availability statements, or supplementary materials included in this article.