

Abstract
Objective:
To determine whether a Parkinson disease (PD)-specific biochemical signature might be found in the total body metabolic milieu or in the CSF compartment, especially since this disorder has systemic manifestations beyond the progressive loss of dopaminergic nigrostriatal neurons.
Methods:
Our goal was to discover biomarkers of PD progression. Using ultra-high-performance liquid chromatography linked to gas chromatography and tandem mass spectrometry, we measured concentrations of small-molecule (≤1.5 kDa) constituents of plasma and CSF from 49 unmedicated, mildly affected patients with PD (mean age 61.4 years; mean duration of PD 11.4 months). Specimens were collected twice (baseline and final) at intervals up to 24 months. During this time, mean Unified Parkinson’s Disease Rating Scale (UPDRS) parts 2 + 3 scores increased 47% (from 28.8 to 42.2). Measured compounds underwent unbiased univariate and multivariate analyses, including fitting data into multiple linear regression with variable selection using least absolute shrinkage and selection operator (LASSO).
Results:
Of 575 identified plasma and 383 CSF biochemicals, LASSO led to selection of 15 baseline plasma constituents with high positive correlation (0.87, p = 2.2e−16) to baseline-to-final change in UPDRS parts 2 + 3 scores. Three of the compounds had xanthine structures, and 4 were either medium- or long-chain fatty acids. For the 15 LASSO-selected biomarkers, pathway enrichment software found no overrepresentation among metabolic pathways. CSF concentrations of the dopamine metabolite homovanillate showed little change between baseline and final collections and minimal correlation with worsening UPDRS parts 2 + 3 scores (0.29, p = 0.041).
Conclusions:
Metabolomic profiling of plasma yielded strong prediction of PD progression and offered biomarkers that may provide new insights into PD pathogenesis.
There has been a continuing challenge for improved methods to diagnose Parkinson disease (PD) and to measure its progression. Despite extensive efforts to discover biochemical clues, biomarkers with high specificity and sensitivity have been elusive1 (even in CSF, a compartment contiguous with sites of neurodegeneration in the brain). This impasse applies also to measurements of substances integral to PD pathophysiology such as α-synuclein and dopamine metabolites, neither of which reliably differentiates individual cases of PD from controls.2
A fundamental challenge for biomarker discovery is to understand how broadly to seek the imprint of PD. An earlier era regarded the pathology of PD as limited to dopaminergic neurons in the substantia nigra, so focusing on diminished dopamine neurotransmission seemed reasonable for defining and monitoring the disease. However, manifestations of the core proteinopathy of PD (α-synuclein aggregates) are demonstrable throughout the body.3 Even the bacterial population in the colon is altered in PD.4 The subcellular influence of PD throughout the body also resides in mitochondria5 and the proteasome-lysosomal system.6 Hence, taking the search for PD biomarkers into the total biochemical environment of the body seems warranted. This approach, metabolomics, has become one of the most productive technologies in recent biomarker research.7 With the latest methodologies, metabolomic analysis is capable of measuring hundreds of low-molecular-weight (<1.5 kDa) compounds in biospecimens, characterizing a wide spectrum of the human metabolic milieu.8–10 The unbiased analytic methods for discerning biomarkers do not depend on functional relationships between biochemicals such as established metabolic pathways. However, subsequent analysis can investigate whether biomarker findings conform to known pathways11 and can search for shared physicochemical properties (such as evidence of oxidative stress).
Our goal was to learn whether metabolomic profiling of CSF and plasma could help to predict the progression of PD. Specifically, we questioned how informative an initial biochemical profile or its change in a later specimen collection might be for predicting disease progression. We also investigated whether the CSF concentration of homovanillate, the major metabolite of dopamine,12 predicted worsening PD.
METHODS
Participants.
Participants with relatively mild parkinsonism provided CSF and plasma samples in the DATATOP (Deprenyl and Tocopherol Antioxidative Therapy of Parkinsonism) clinical trial.13 During this trial, participants underwent blinded assessments with the Unified Parkinson’s Disease Rating Scale (UPDRS).14 In the current study, we measured change in parkinsonism over time with UPDRS questions pertaining to activities of daily living (part 2) and motor examination (part 3). A composite index (CI) of parkinsonism was the sum of scores from both parts (UPDRS2 + 3).
In the DATATOP study, participants could not receive symptomatic treatment for PD.13 Our study used specimens from 49 randomly selected placebo-treated participants for whom the enrolling investigator confirmed (retrospectively with ≥90% certainty) that the PD diagnostic impression was correct. Specimens came from 33 men (67% of total group; mean age at enrollment 61.4 years, range 38–74 years) and 16 women (mean age 65.9 years, range 46–78 years). The total group mean ± SD age was 62.9 ± 7.7 years. Mean duration of parkinsonian symptoms before initial (baseline) assessment was 11.4 ± 4.7 months (range 3.0–22.3 months). At baseline, mean UPDRS part 2 score was 8.5 (range 3–15) and mean part 3 score was 20.3 (range 3–38.5). At the second (final) specimen collection, mean part 2 score was 12.9 (range 4–22) and part 3 score was 29.3 (range 6–49).
Standard protocol approvals, registrations, and patient consents.
At each study site, the DATATOP trial received approval from institutional ethics standards committees on human experimentation. Written informed consent was obtained from all patients participating in the study.
Collection procedures.
Lumbar puncture CSF and venous plasma specimens were collected by standardized methods at study enrollment (baseline) and at trial completion (final)13,15 when UPDRS assessments also were conducted. While DATATOP study participation was up to 2 years, intervals between baseline and final testing were shorter if participants met endpoint criteria (defined as worsening of parkinsonism requiring start of dopaminergic therapy13).
CSF and blood specimens were collected after overnight bed rest (between 6 and 10 am before breakfast). Lumbar CSF was removed in sequential measured aliquots. We used the specimen pooled from 12 to 14 mL and without blood contamination. Specimens were immediately chilled and stored at −70°C until assayed.15
Assay methods.
Detailed methods for the metabolomic profiling of the CSF and plasma specimens have been reported.8–10,16 In summary, samples were extracted and split into aliquots for analysis on 3 separate mass spectrometers (Thermo Scientific, Waltham, MA): ultra-high-performance liquid chromatography–mass spectrometry (MS) OrbiElite System for detecting positive and negative ions and a Trace Ultra Gas Chromatograph-DSQ-MS system. For the 2 liquid chromatography methods, chromatographic separation followed by full-scan mass spectra was carried out to record retention time, molecular weight (m/z), and tandem MS of all detectable ions. For gas chromatography, the samples were derivatized with bistrimethyl-silyl-triflouroacetamide. Retention time and m/z were measured.
Bioinformatics.
Data extracted from the raw MS data files were loaded into a relational database and evaluated without binary large-object manipulation.10 Peaks were identified with proprietary peak integration software,17 and components were stored in a specifically designed complex data structure. Compounds were identified by comparison of the ion features of each sample to reference library entries of chemical standard entries (retention time, m/z, preferred adducts, and in-source fragments) and their associated tandem MS spectra.17 Several quality control and curation procedures were conducted for a high-quality data set with accurate and consistent identification of chemical entities and for removing system artifacts, misassignments, and background noise.8,10
Statistical analysis.
The 49 samples per group (baseline and final) exceeded the group size of 20 to 25 generally required for adequate statistical modeling of metabolomic data.18 Any compound for which data had missing values (due to thresholding of MS data, for example) was imputed by use of minimum detection level. Data was log2 transformed. To detect biochemicals of interest, data underwent a strategy of feature selection through univariate analysis followed by multivariable modeling. False discovery rate–adjusted p values were calculated for the univariate analysis.19
To investigate for biomarkers of PD progression, we took several approaches. With baseline assay data, a univariate analysis determined whether any of the biochemicals was associated with PD progression, defined as change in parkinsonian severity (difference between UPDRS parts 2 + 3 scores at baseline and final assessments [ΔUPDRS2 + 3]). This analysis involved calculation of the Pearson correlation. Another investigation was for a possible association between ΔUPDRS2 + 3 and the CSF concentration of the dopamine metabolite homovanillate. A third analysis was to develop a multimarker predictive model with the goal of determining a panel of compounds that might predict ΔUPDRS2 + 3. The method chosen was multiple linear regression with variable selection using least absolute shrinkage and selection operator (LASSO).20 Ten-fold cross-validation was performed on LASSO to yield an unbiased estimate of prediction error so that the best number for the combination of markers could be selected.
Another data analysis approach was to determine which plasma and CSF biochemicals had changed in concentration from baseline to the final collection. Similar to the analytic methods described above, a univariate analysis determined whether individual compounds showing baseline-to-final change was associated with ΔUPDRS2 + 3. Finally, we generated a multimarker model with LASSO to explore for a panel of CSF and plasma compounds for which a change in concentration could predict PD progression.
Metabolomic data also can be studied from known metabolic relationships between assayed biochemicals with KEGG pathway maps (www.genome.jp) and other sources of biochemical information. For this investigation, results obtained from pathway enrichment analysis were combined with a topology analysis (Ingenuity Pathway Analysis, Ingenuity Systems, Mountain View, CA) to discern where there was overrepresentation by any of the detected biomarkers.
RESULTS
Assay findings.
The assays detected and measured 575 structurally distinct plasma and 283 CSF biochemicals. Each compound was identified by reference to entries in the Metabolon chemical library.17
Analysis of baseline metabolomic data.
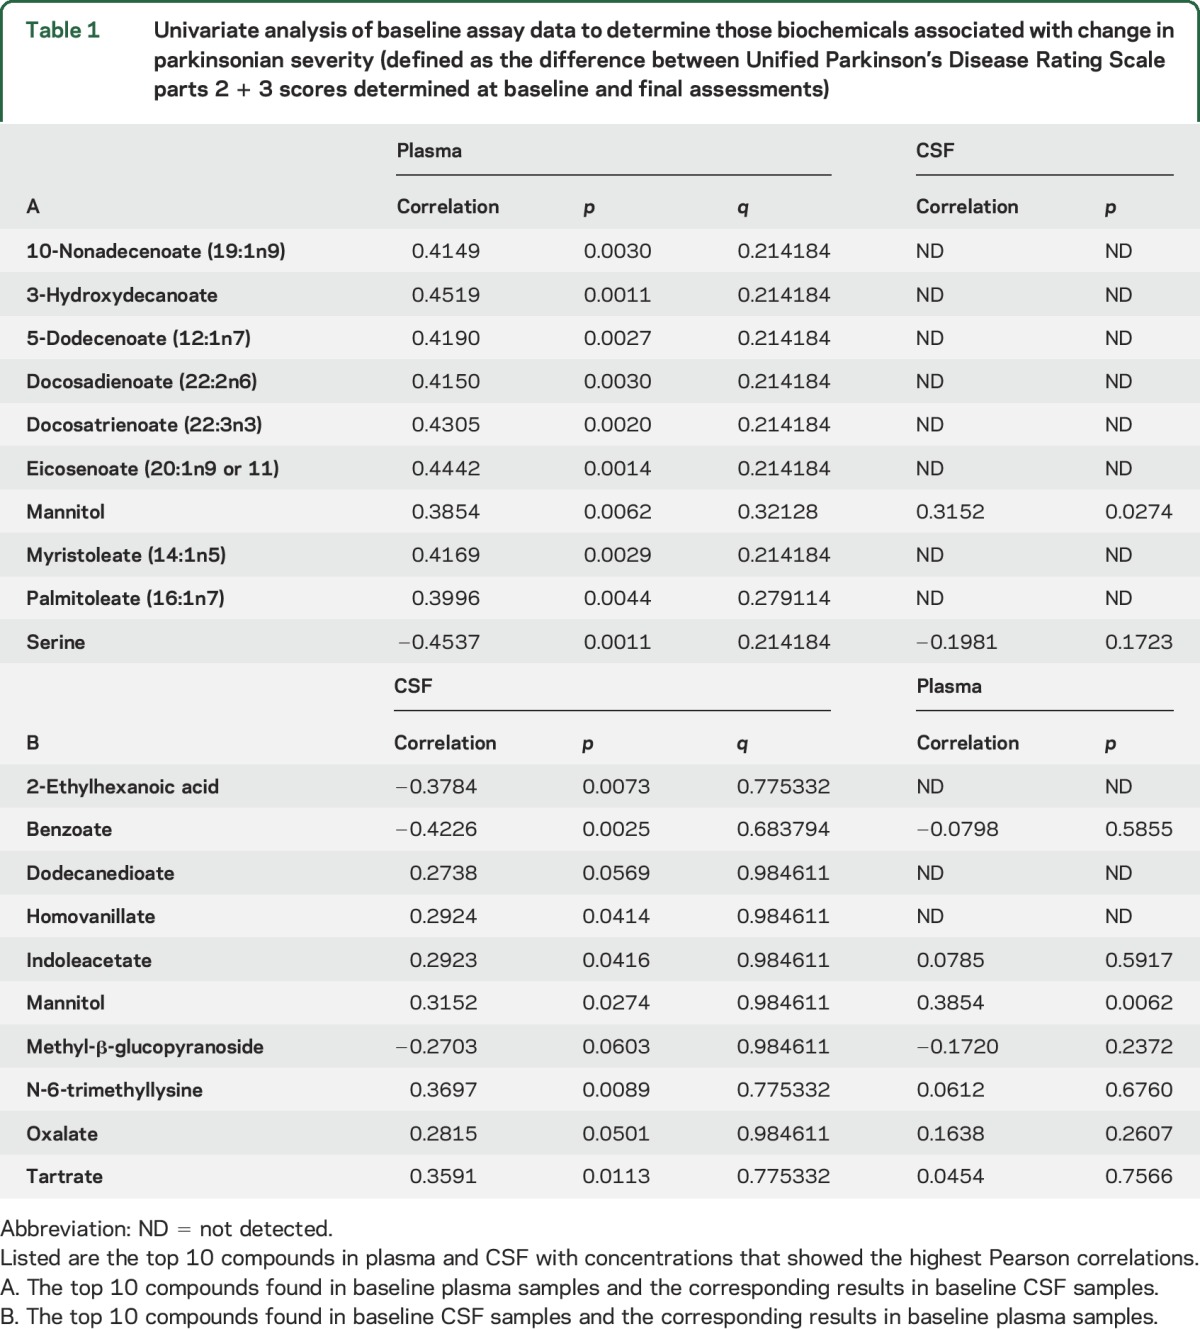
Pearson correlation coefficients and corresponding p and q values were calculated for concentrations of biochemicals measured in CSF and plasma samples. Some of the data showed up to a moderate correlation with ΔUPDRS2 + 3 (approximately ±0.4, with corresponding values of p <0.01). However, none of these compounds maintained statistical significance in their correlations after p value adjustment. Correlations found in plasma samples were, in general, consistent with the correlations found in the CSF samples, although there was some variability. Because none of the measured plasma or CSF biochemicals achieved statistical significance after adjustment, we created lists of the top 10 compounds that, of all the measured compounds, showed the greatest correlations to ΔUPDRS2 + 3 (table 1). For example, analysis of the baseline plasma specimens listed in table 1 found that serine concentration was inversely correlated with ΔUPDRS2 + 3 (−0.45, p = 0.0011). In CSF, serine was not as strongly inversely correlated with ΔUPDRS2 + 3 (−0.20, p = 0.17). For the top 10 compounds in CSF samples with correlations to ΔUPDRS2 + 3 (table 1), the strongest relationship was an inverse correlation with benzoate (−0.42, p = 0.0025). Measurement of benzoate in plasma samples did not correlate with ΔUPDRS2 + 3.
Table 1.
Univariate analysis of baseline assay data to determine those biochemicals associated with change in parkinsonian severity (defined as the difference between Unified Parkinson’s Disease Rating Scale parts 2 + 3 scores determined at baseline and final assessments)
In a further analysis using LASSO (table 2), we identified 15 compounds from profiling baseline plasma specimens that, together as a group, best predicted ΔUPDRS2 + 3. From these data, we created a CI based on a linear combination of these compounds using the coefficients listed in table 2 (figure, A). This analysis yielded a high correlation coefficient (0.87, p = 2.2e−16) between the CI and ΔUPDRS2 + 3. A similar analysis with LASSO was carried out for compounds in the baseline CSF profiles, which identified 2 biochemicals, benzoate and N-6-trimethyllysine, that best predicted ΔUPDRS2 + 3 (table 2). Using a similar calculation for CI, we then fitted the coefficients for the baseline CSF compounds in the linear regression model. Figure, B shows that this CI was moderately correlated (0.58, p = 1.33e−5) with ΔUPDRS2 + 3.
Table 2.
From baseline plasma and CSF assay results, the best combination of compounds with concentrations selected by least absolute shrinkage and selection operator20 and fitted in a linear regression
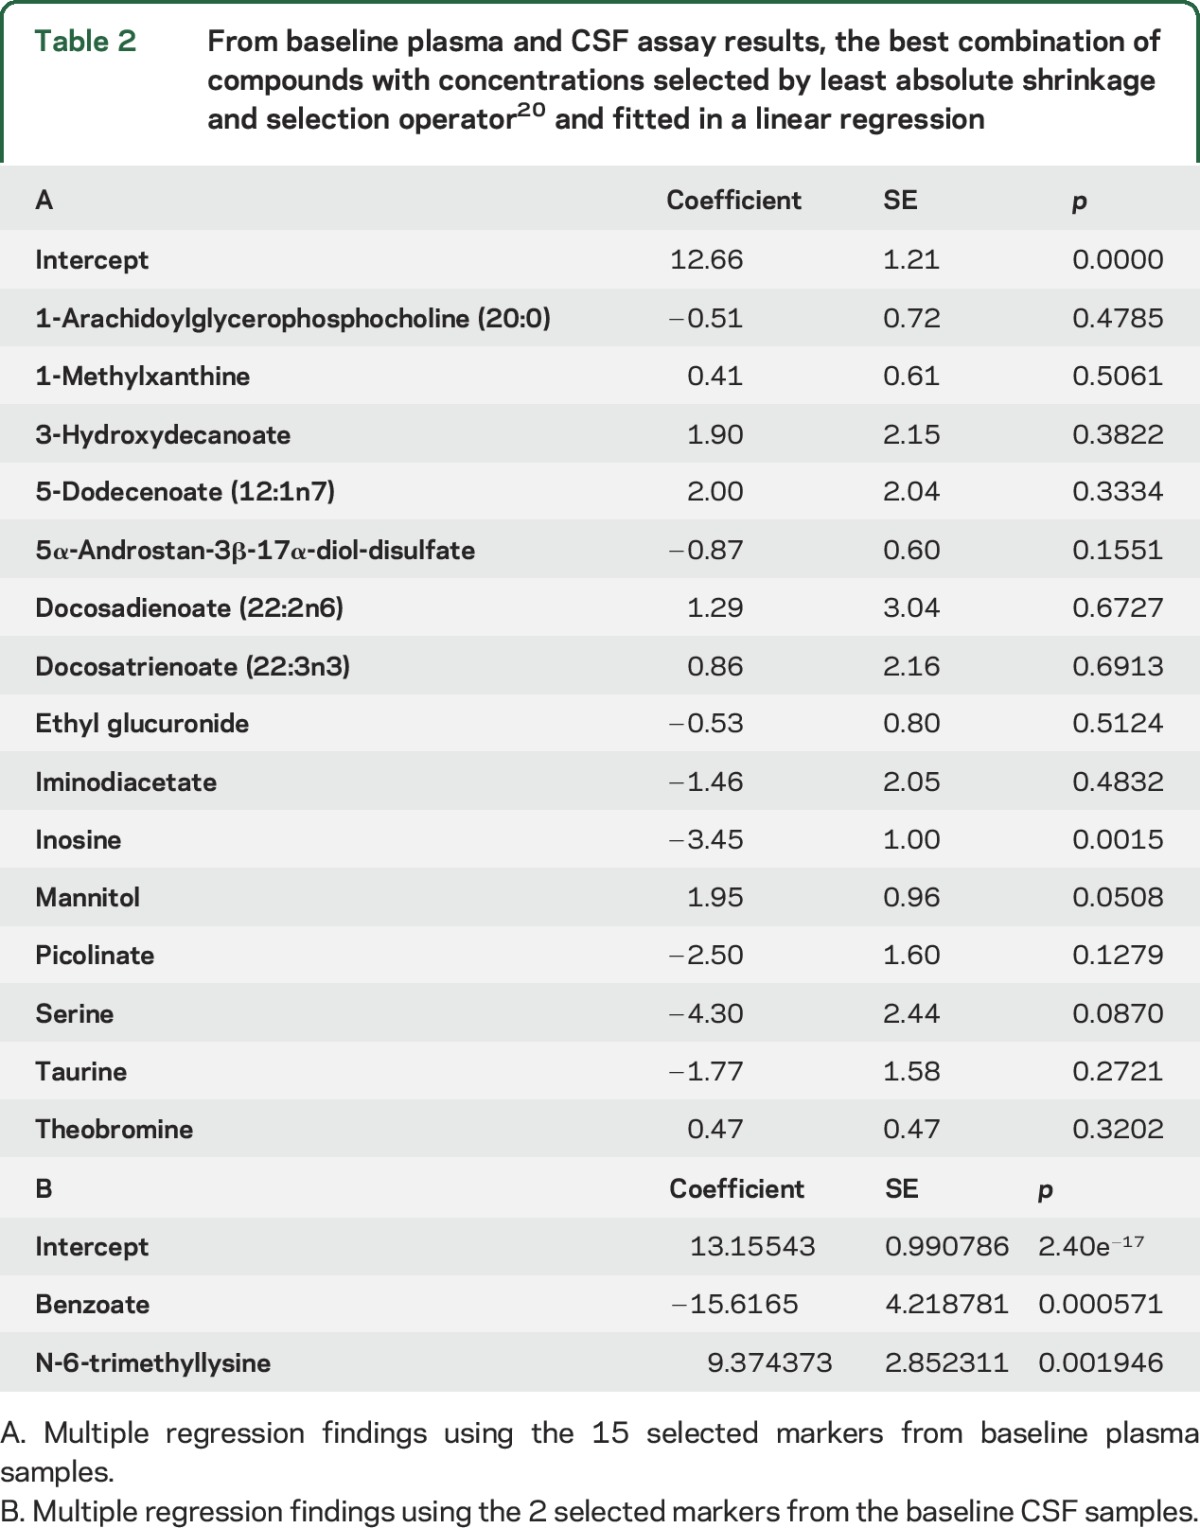
Figure. Correlations between composite indexes and baseline-to-final changes in UPDRS parts 2 + 3 scores.

(A) Composite index for baseline plasma specimens (correlation coefficient = 0.87, p = 2.2e−16). (B) Composite index for baseline CSF specimens (correlation coefficient = 0.58, p = 1.33e−5). UPDRS = Unified Parkinson’s Disease Rating Scale.
Analysis of metabolomic data that showed change from baseline to final collections.
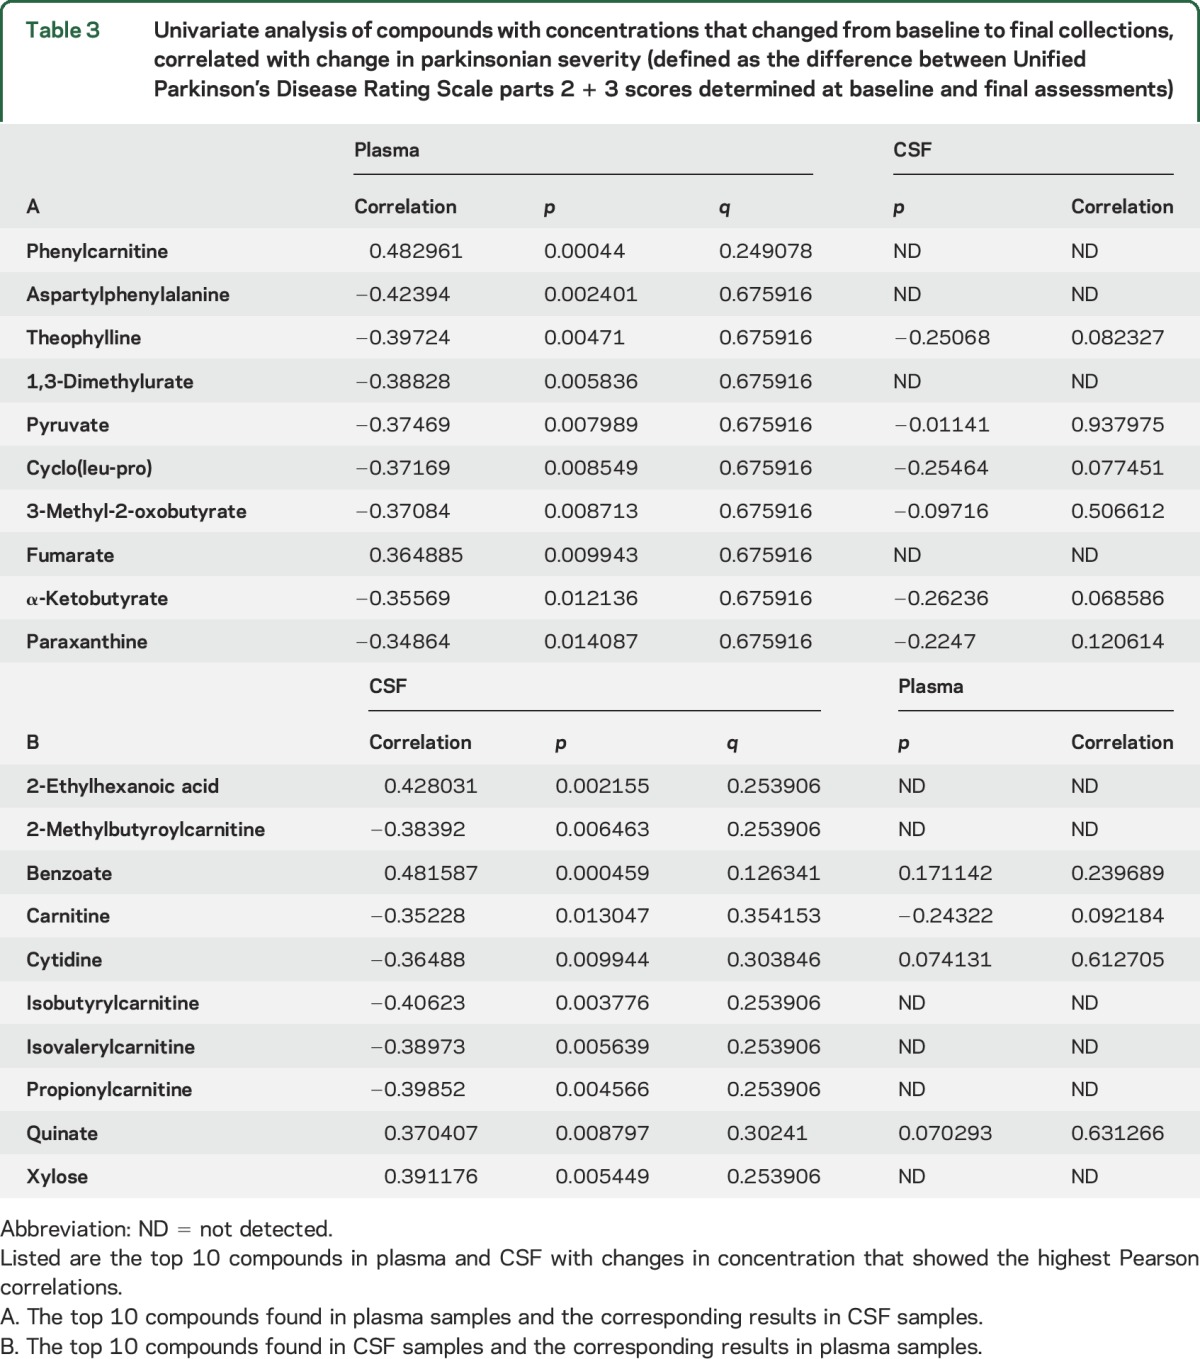
Correlation coefficients and corresponding p values were investigated for CSF and plasma samples; they showed moderate (>±0.4) correlations between concentration changes and ΔUPDRS2 + 3. We created a list of the top 10 compounds with changes from baseline to final that showed the greatest correlation to ΔUPDRS2 + 3 (table 3). For example, the change in plasma phenylcarnitine concentrations was moderately correlated with ΔUPDRS2 + 3 (0.48, p ≈ 0.0004). The concentration of phenylcarnitine in CSF was below the detection limit. In CSF, the strongest correlation with ΔUPDRS2 + 3 was change in benzoate concentration (0.48, p ≈ 0.0005).
Table 3.
Univariate analysis of compounds with concentrations that changed from baseline to final collections, correlated with change in parkinsonian severity (defined as the difference between Unified Parkinson’s Disease Rating Scale parts 2 + 3 scores determined at baseline and final assessments)
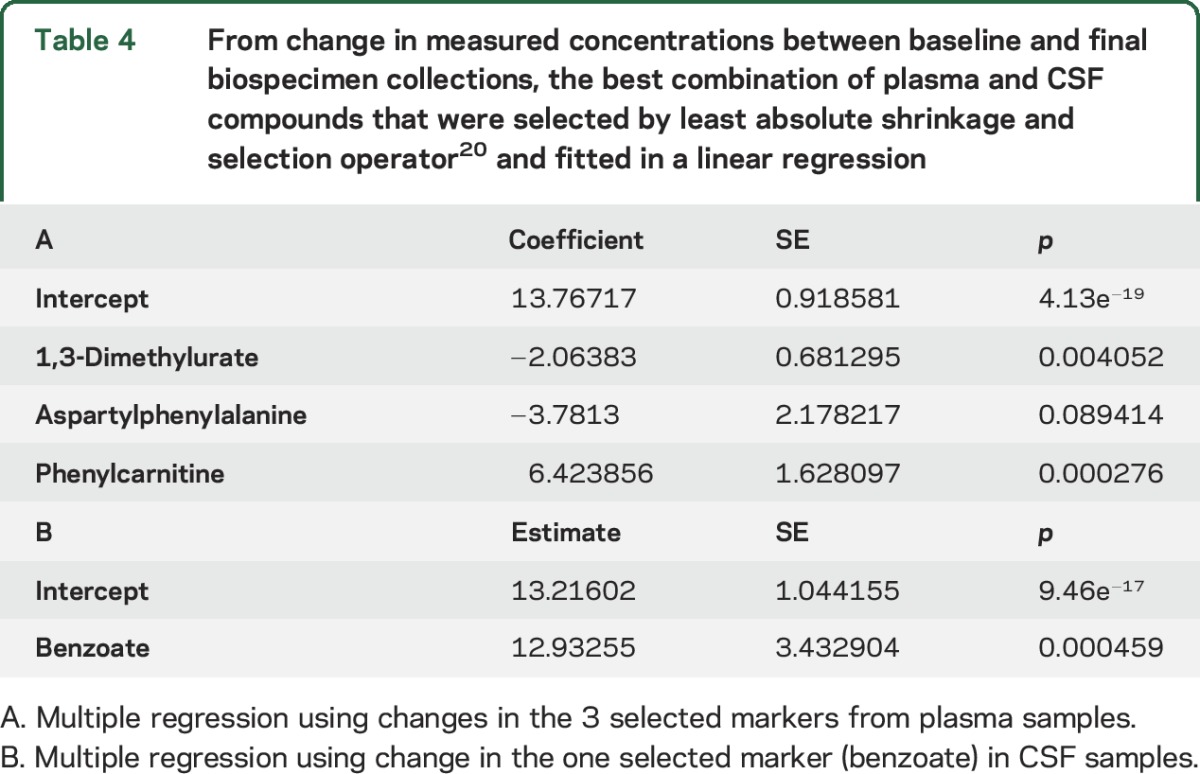
For plasma specimens, change in concentration from baseline to final for a group of 3 compounds (1,3-dimethylurate, aspartylphenylalanine, and phenylcarnitine) best predicted ΔUPDRS2 + 3 (table 4). From these data, we created a CI based on the coefficient for changes in each marker. This CI correlated with ΔUPDRS2 + 3 (0.67, p = 1.54e−16). For similar analysis of CSF, benzoate was the only compound selected by LASSO; hence, its result was the same as that shown by univariate analysis (0.48, p = 0.00045). Between baseline and final, the mean CSF concentration of the dopamine metabolite homovanillate showed little change and only weakly correlated with ΔUPDRS2 + 3 (0.29, p = 0.041).
Table 4.
From change in measured concentrations between baseline and final biospecimen collections, the best combination of plasma and CSF compounds that were selected by least absolute shrinkage and selection operator20 and fitted in a linear regression
DISCUSSION
This study combined analysis of CSF and plasma samples in an effort to discover PD state (disease progression) markers. These observations underscore the value of untargeted metabolomic screening of clues for a disorder that is known to have diverse systemic manifestations. Although our analysis discerned a biochemical profile linked to PD progression, these findings do not clarify whether the observed markers represent primary biochemical manifestations of the disease process or “downstream” changes (or even epiphenomena of PD). Regardless of their origins, discovery of compounds with CIs that are highly predictive of ΔUPDRS2 + 3 may provide a useful supplement to clinical monitoring of PD progression (and might constitute a preclinical indicator). The information from this metabolomic investigation might also have a place in a meta-analysis for which other biomarker candidates (such as α-synuclein, Aβ1-42, or fraktaline measurements21) might be incorporated for enhancing correlations to PD progression.
In contrast to several earlier metabolomic methodologies used with PD biospecimens,22–26 our analytic platform possesses greatly improved capabilities for biochemical detection and identification. We also avoided the potentially confounding effects of PD drugs (such as levodopa27) by using samples only from unmedicated participants. Earlier biomarker investigations into PD progression have focused on measures of striatal dopaminergic neurotransmission. While homovanillate is the predominant metabolite and the end product of dopamine catabolism in humans,12 previous studies of CSF homovanillate concentration have yielded inconsistent results as to the utility of this compound for cross-sectional analysis of PD severity or for distinguishing patients with PD from healthy controls.28 The current study confirms that CSF homovanillate is not a useful biomarker of PD progression.
CSF specimen findings.
Of the 373 biochemicals identified in CSF, benzoate was the only one with a change in concentration from baseline to final that provided even moderate prediction of ΔUPDRS2 + 3 (0.48, p = 0.00045). This compound, which is derived from the catabolism of phenylalanine (a precursor of catecholamines), is also a common food additive. Because CSF benzoate concentrations exceed those in plasma, it likely originates from endogenous metabolism rather than diet. In plasma specimens, another metabolite derived from phenylalanine, the dipeptide aspartylphenylalanine, also changed substantially between the baseline and final collections. The LASSO-selected combination of aspartylphenylalanine, 1,3-dimethylurate, and phenylcarnitine (table 4) provided a correlation coefficient of 0.67 (p = 1.54e−16) with ΔUPDRS2 + 3. Surprisingly, neither of these biochemicals was among the 15 plasma constituents selected from baseline data (table 2) that, as a group, provided strong prediction of ΔUPDRS2 + 3.
Plasma specimen findings.
As illustrated in the figure, the best prediction of PD progression arose from a panel of compounds measured in plasma specimens, with a remarkably high correlation coefficient of 0.87 (p = 2.2e−16). Furthermore, the best predictor for ΔUPDRS2 + 3 was in baseline specimen data rather than the change in concentrations from baseline to final.
Purine metabolism findings.
For the 15 plasma biochemicals selected by LASSO for fitting in linear regression analysis (table 2), a search with pathway enrichment software found no overrepresentation among metabolic pathways. However, we found some classes of biochemicals (including several purine compounds) that were predictive of worsening parkinsonism. A previous metabolomic study also found several purines with concentrations that differentiated PD plasma samples from controls.24 Our prior metabolomic analysis of postmortem CSF (which compared PD to control samples) also reported that the purine inosine was among 19 compounds found to offer the best differentiation.16 The current data for baseline plasma inosine (table 2) reveal that this compound has a moderate inverse correlation with ΔUPDRS2 + 3 (−3.53, p = 0.013). Four metabolites of the purine compound caffeine were among the biochemicals found to be biomarkers of PD progression: theobromine, theophylline, paraxanthine, and 1-methylxanthine. Between the baseline and final specimen collections, the mean plasma concentration of one of them, theobromine, decreased by ≈8%. While this change could be attributed to diminished dietary intake of caffeine at the time when final specimens were collected, another explanation might be a progressive change for overall purine metabolism (as reflected in the metabolism of both endogenous and dietary xanthine compounds). The latter hypothesis has support from our findings with inosine, the mean plasma concentration of which at the final collection was decreased by almost one-third from baseline.
Evidence from other sources also implicates altered purine metabolism in PD. One study found that several purine-metabolism genes in the PD brain were either upregulated or downregulated compared to controls.29 Epidemiologic research has also highlighted relationships between PD and purine compounds. For example, habitual dietary intake of caffeine imparts a strong inverse association in the risk for developing PD.30 Other inverse correlates of risk for either the acquisition or progression of PD are reported with both plasma and CSF concentrations of urate (2,6,8-trioxypurine).31 The depletion of striatal dopamine in the PD brain might also influence purine metabolism.32
Fatty acids and lipid metabolism findings.
In the baseline plasma specimens, we found another category of biochemicals among the 15 compounds predictive of PD progression (table 2): 4 medium- and long-chain fatty acids (5-dodecanoate, 3-hydroxydecanoate, docosadienoate, and docosatrienoate) and the lysolipid 1-arachidoylglycerophosphocholine. Although these and related compounds have not been implicated previously in the neurodegenerative process of PD, experimental evidence from toxin-induced rodent models of parkinsonism offers some insights. In one study, exposure to the mitochondrial toxin rotenone led to marked changes in brain and systemic fatty acid metabolism.33 Another investigation of 6-hydroxydopamine-treated rats found that the substantia nigra underwent marked alterations of lipid metabolism, including either downregulation or upregulation for the synthesis of several phosphatidylcholine and lysophosphotidylcholine lipid species.34
To date, no other biospecimen marker studies have offered correlations as strong as that found for the prediction of change in the clinical measures of PD progression used in this study, which, in our participants, increased by ≈47% over a mean of 11 months. Our untargeted approach resulted in the discovery of some biomarkers not previously recognized as involved in PD neurodegeneration. For example, serine, which was inversely correlated with ΔUPDRS2 + 3 (−0.45, p = 0.0011), provided the strongest association between biochemicals in baseline plasma concentrations and PD progression (table 2). Serine has neurochemical properties that may be pertinent to PD, including interactions with NMDA-induced neurodegeneration.35 Additionally, serine is involved in a key step of synthesis for the CNS antioxidant glutathione,36 which is diminished in PD.16
Although a powerful tool for unbiased biomarker discovery, metabolomic analysis is an evolving technology and subject to certain limitations. Measurements for some constituents of biospecimens are made close to instrument limits of detection. Assay conditions are not necessarily optimized for all of the chemical species measured. Furthermore, the metabolomic platform we used separates only electrochemically charged compounds. Various factors such as instrument assay drift can influence the precision of measurements. In general, given the assay methodology, metabolomic data are best regarded as relational rather than as precise concentration determinations. Interpretation of metabolomic findings needs to recognize that, beyond profiling biochemicals involved in endogenous metabolism, the measured compounds also can originate from diet, other ingested substances, and gut flora. Standardized biospecimen collection methods and participant groups of adequate size18 are critical for reducing some of the potential artifacts in metabolomic studies.
Our findings offer biomarkers for studying PD progression and, with them, several new directions for investigation of PD pathogenesis. We intend to replicate these findings using other sample sets and hope to determine whether the compounds found to predict PD progression might also serve to differentiate those with PD from healthy controls or from those with other neurodegenerative disorders.
Supplementary Material
ACKNOWLEDGMENT
Michael Schwarzschild, MD, PhD, provided valuable feedback from his review of this manuscript. The authors express their appreciation to the 800 patients participating in the DATATOP study13 whose enduring contributions as research participants made this investigation possible.
GLOSSARY
- CI
composite index
- DATATOP
Deprenyl and Tocopherol Antioxidative Therapy of Parkinsonism
- LASSO
least absolute shrinkage and selection operator
- MS
mass spectrometry
- PD
Parkinson disease
- UPDRS
Unified Parkinson's Disease Rating Scale
Footnotes
Supplemental data at Neurology.org
AUTHOR CONTRIBUTIONS
Conception and design of the study: P.A.L., J.L., M.L. Acquisition and analysis of data: P.A.L., J.L., M.L., L.G., P.A. Drafting a significant portion of the manuscript: P.A.L., J.L., M.L., L.G. Clinical data and biospecimens: P.A.L., P.A., Parkinson Study Group DATATOP study investigators, coordinators, and other researchers (a full listing is provided at Neurology.org).
STUDY FUNDING
This study was supported by grants from the Michael J. Fox Foundation for Parkinson's Research and by the NIH, Bethesda, MD (NS-24788). Assays for this study were conducted by Metabolon, Inc (Durham, NC) with payment of a standard commercial fee. Lining Guo, PhD, who participated in this research and preparation of the report, is an employee of Metabolon, Inc.
DISCLOSURE
P. LeWitt, J. Li, and M. Lu report no disclosures relevant to the manuscript. L. Guo is an employee of Metabolon, Inc (Durham, NC), which carried out the assays reported in this article under contract from the principal investigator. P. Auinger reports no disclosures relevant to the manuscript. Go to Neurology.org for full disclosures.
REFERENCES
- 1.Andersen AD, Binzer M, Stenager E, Gramsbergen JB. Cerebrospinal fluid biomarkers for Parkinson's disease: a systematic review. Acta Neurol Scand 2017;135:34–56. [DOI] [PubMed] [Google Scholar]
- 2.Hall S, Surova Y, Öhrfelt A, Zetterberg H, Lindqvist D, Hansson O. CSF biomarkers and clinical progression of Parkinson disease. Neurology 2015;84:57–63. [DOI] [PMC free article] [PubMed] [Google Scholar]
- 3.Gelpi E, Navarro-Otano J, Tolosa E, et al. Multiple organ involvement by alpha-synuclein pathology in Lewy body disorders. Mov Disord 2014;29:1010–1018. [DOI] [PubMed] [Google Scholar]
- 4.Derkinderen P, Shannon KM, Brundin P. Gut feelings about smoking and coffee in Parkinson's disease. Mov Disord 2014;29:976–979. [DOI] [PMC free article] [PubMed] [Google Scholar]
- 5.Carvalho C, Correia SC, Cardoso S, et al. The role of mitochondrial disturbances in Alzheimer, Parkinson and Huntington diseases. Expert Rev Neurother 2015;15:867–884. [DOI] [PubMed] [Google Scholar]
- 6.Vilchez D, Saez I, Dillin A. The role of protein clearance mechanisms in organismal ageing and age-related diseases. Nat Commun 2014;5:5659. [DOI] [PubMed] [Google Scholar]
- 7.Caudle WM, Bammler TK, Lin Y, Pan S, Zhang J. Using “omics” to define pathogenesis and biomarkers of Parkinson's disease. Expert Rev Neurother 2010;10:925–942. [DOI] [PMC free article] [PubMed] [Google Scholar]
- 8.Evans AM, DeHaven CD, Barrett T, Mitchell M, Milgram E. Integrated, nontargeted ultrahigh performance liquid chromatography/electrospray ionization tandem mass spectrometry platform for the identification and relative quantification of the small-molecule complement of biological systems. Anal Chem 2009;81:6656–6667. [DOI] [PubMed] [Google Scholar]
- 9.Lawton KA, Berger A, Mitchell M, et al. Analysis of the adult human plasma metabolome. Pharmacogenomics 2008;9:383–397. [DOI] [PubMed] [Google Scholar]
- 10.Guo L, Milburn MV, Ryals JA, et al. Plasma metabolomic profiles enhance precision medicine for volunteers of normal health. Proc Natl Acad Soc USA 2015;112:E4901–E4910. [DOI] [PMC free article] [PubMed] [Google Scholar]
- 11.Hiller K, Hangebrauk J, Jäger C, Spura J, Schreiber K, Schomburg D. MetaboliteDetector: comprehensive analysis tool for targeted and nontargeted GC/MS based metabolome analysis. Anal Chem 2009;81:3429–3439. [DOI] [PubMed] [Google Scholar]
- 12.LeWitt P, Galloway M, Matson W, et al. Markers of dopamine metabolism in Parkinson's disease. Neurology 1992;42:2111–2117. [DOI] [PubMed] [Google Scholar]
- 13.Parkinson Study Group. Effect of deprenyl on the progression of disability in early Parkinson's disease. N Engl J Med 1989;321:1364–1371. [DOI] [PubMed] [Google Scholar]
- 14.Fahn S, Elton RL. UPDRS Program Members. Unified Parkinson's Disease Rating Scale. In: Fahn S, Marsden CD, Goldstein M, Calne DB, editors. Recent Developments in Parkinson's Disease, Vol. 2. Florham Park: Macmillan Healthcare Information; 1987:153–163. [Google Scholar]
- 15.Parkinson Study Group. CSF homovanillic acid in the DATATOP study on Parkinson's disease. Arch Neurol 1995;52:237–245. [DOI] [PubMed] [Google Scholar]
- 16.LeWitt PA, Li J, Lu M, Beach TG, Adler CH, Guo L; Arizona Parkinson's Disease Consortium. 5-Hydroxykynurenine and other biomarkers of Parkinson's disease discovered by metabolomic analysis. Mov Disord 2013;28:1653–1660. [DOI] [PubMed] [Google Scholar]
- 17.Dehaven CD, Evans AM, Dai H, Lawton KA. Organization of GC/MS and LC/MS metabolomics data into chemical libraries. J Cheminform 2010;2:9. [DOI] [PMC free article] [PubMed] [Google Scholar]
- 18.Nyamundanda G, Gormley IC, Fan Y, Gallagher WM, Brennan L. MetSizeR: selecting the optimal sample size for metabolomic studies using an analysis based approach. BMC Bioinformatics 2013;14:338. [DOI] [PMC free article] [PubMed] [Google Scholar]
- 19.Storey JD, Tibshirani R. Statistical significance for genomewide studies. Proc Natl Acad Sci USA 2003;100:9440–9445. [DOI] [PMC free article] [PubMed] [Google Scholar]
- 20.Tibshirani R. Regression shrinkage and selection via the lasso. J R Statist Soc B 1996;58:267–288. [Google Scholar]
- 21.Shi M, Bradner J, Hancock AM, et al. Cerebrospinal fluid biomarkers for Parkinson disease diagnosis and progression. Ann Neurol 2011;69:570–580. [DOI] [PMC free article] [PubMed] [Google Scholar]
- 22.Michell AW, Mosedale D, Grainger DJ, Barker RA. Metabolomic analysis of urine and serum in Parkinson's disease. Metabolomics 2008;4:191–201. [Google Scholar]
- 23.Bogdanov M, Matson WR, Wang L, et al. Metabolomic profiling to develop blood biomarkers for Parkinson's disease. Brain 2008;131:389–396. [DOI] [PubMed] [Google Scholar]
- 24.Johansen KK, Wang L, Aasly JO, et al. Metabolomic profiling in LRRK2-related Parkinson's disease. PLoS One 2009;4:e7551. [DOI] [PMC free article] [PubMed] [Google Scholar]
- 25.Roede JR, Uppal K, Park Y, et al. Serum metabolomics of slow vs. rapid motor progression Parkinson's disease: a pilot study. PLoS One 2013;8:e77629. [DOI] [PMC free article] [PubMed] [Google Scholar]
- 26.Luan H, Liu LF, Meng N, et al. LS-MC-based urinary metabolite signatures in idiopathic Parkinson's disease. J Proteome Res 2015;14:467–468. [DOI] [PubMed] [Google Scholar]
- 27.Hatano T, Saiki S, Okuzumi A, Mohney RP, Hattori N. Identification of novel biomarkers for Parkinson's disease by metabolomic technologies. J Neurol Neurosurg Psychiatry 2016;87:295–301. [DOI] [PubMed] [Google Scholar]
- 28.LeWitt PA, Huber BR, Zhang J. An update on CSF biomarkers of Parkinson's disease. In: Mandel S, editor. Neurodegenerative Diseases: Integrative PPPM Approach as the Medicine of the Future: Advances in Predictive, Preventive, and Personalized Medicine, Vol. 2. Dordrecht: Springer; 2013:161–184. [Google Scholar]
- 29.Garcia-Esparcia P, Hernández-Ortega K, Ansoleaga B, Carmona M, Ferrer I. Purine metabolism gene deregulation in Parkinson's disease. Neuropathol Appl Neurobiol 2015;41:926–940. [DOI] [PubMed] [Google Scholar]
- 30.Palacios N, Gao X, McCullough ML, et al. Caffeine and the risk of Parkinson's disease in a large cohort of men and women. Mov Disord 2013;27:1276–1282. [DOI] [PMC free article] [PubMed] [Google Scholar]
- 31.Ascherio A, LeWitt PA, Xu K, et al. Urate as a predictor of the rate of clinical decline in Parkinson disease. Arch Neurol 2009;66:1460–1468. [DOI] [PMC free article] [PubMed] [Google Scholar]
- 32.Loeffler DA, LeWitt PA, Juneau PL, et al. Altered guanosine and guanine concentrations in rabbit striatum following increased dopamine turnover. Brain Res Bull 1998;45:297–299. [DOI] [PubMed] [Google Scholar]
- 33.Tyurina YY, Polimova AM, Maciel E, et al. LC/MS analysis of cardiolipins in substantia nigra and plasma of rotenone-treated rats: implication for mitochondrial dysfunction in Parkinson's disease. Free Radic Res 2015;49:681–691. [DOI] [PMC free article] [PubMed] [Google Scholar]
- 34.Farmer K, Smith CA, Hayley S, Smith J. Major alterations of phosphatidylcholine and lysophosphotidyl lipids in the substantia nigra using an early stage model of Parkinson's disease. Int J Mol Sci 2015;16:18865–18877. [DOI] [PMC free article] [PubMed] [Google Scholar]
- 35.Katsuki H, Nonaka M, Shirakawa H, Kume T, Akaike A. Endogenous D-serine is involved in induction of neuronal death by N-methyl-D-aspartate and simulated ischemia in rat cerebrocortical slices. J Pharmacol Exp Ther 2004;311:836–844. [DOI] [PubMed] [Google Scholar]
- 36.Meiser J, Delcambre S, Wegner A, et al. Loss of DJ-1 impairs antioxidant response by altered glutamine and serine metabolism. Neurobiol Dis 2016;89:112–125. [DOI] [PubMed] [Google Scholar]
Associated Data
This section collects any data citations, data availability statements, or supplementary materials included in this article.