Significance
It is widely presumed that there is a relationship between sleep and the gut microbiome because both sleep restriction and dysbiosis of the gut microbiome are associated with metabolic diseases such as obesity and diabetes. Here, we report sleep restriction over several consecutive days does not overtly influence the composition of the microbiome of either rats or humans, despite both species showing other changes associated with sleep loss. These analyses suggest that sleep loss and microbial dysbiosis have independent effects on the development of metabolic diseases.
Keywords: sleep restriction, microbiome, sleep deprivation, gut, cognition
Abstract
Insufficient sleep increasingly characterizes modern society, contributing to a host of serious medical problems. Loss of sleep is associated with metabolic diseases such as obesity and diabetes, cardiovascular disorders, and neurological and cognitive impairments. Shifts in gut microbiome composition have also been associated with the same pathologies; therefore, we hypothesized that sleep restriction may perturb the gut microbiome to contribute to a disease state. In this study, we examined the fecal microbiome by using a cross-species approach in both rat and human studies of sleep restriction. We used DNA from hypervariable regions (V1-V2) of 16S bacteria rRNA to define operational taxonomic units (OTUs) of the microbiome. Although the OTU richness of the microbiome is decreased by sleep restriction in rats, major microbial populations are not altered. Only a single OTU, TM7-3a, was found to increase with sleep restriction of rats. In the human microbiome, we find no overt changes in the richness or composition induced by sleep restriction. Together, these results suggest that the microbiome is largely resistant to changes during sleep restriction.
Sufficient sleep is important for maintaining physical and mental health, yet nearly one-third of adults receive less than six hours of sleep per day (1). Chronic sleep deficiency is linked to a multitude of health conditions such as cardiovascular diseases and metabolic diseases including obesity and diabetes (2, 3). Even acute periods of sleep restriction or loss can result in altered glucose metabolism, changes in hormone production, and weight gain (4–7). Decreased sleep amounts also result in impaired cognitive performance (8).
An unhealthy shift in the gut microbiome, known as dysbiosis, is associated with diabetes, metabolic syndrome, and fat storage (9, 10). Fecal transplantation experiments from obese to lean mice transmit dysbiosis (11). Dysbiosis has also been shown to affect cognitive performance through the “gut-brain” axis (12). Because metabolic diseases and cognitive impairments are associated with both an imbalanced microbiome and reduced sleep, we sought to determine whether sleep restriction causes microbiome changes. We hypothesized that sleep restriction would result in proinflammatory changes to the microbiome that would drive metabolic and cognitive changes observed following sleep restriction (13–15).
We examined the fecal microbiome via 16S tag sequencing in both rats and humans following sleep restriction. We extracted and analyzed the hypervariable V1-V2 region of the 16S bacterial rRNA. We grouped these reads into clusters of 97% identity for analysis as operational taxonomic units (OTUs). The resulting analyses show that sleep deprivation was associated with modest but statistically significant differences in the rat microbiome. By contrast, no statistically significant changes were detected, after corrections for multiple testing, in the human microbiome after sleep restriction, despite deficits in cognitive function. Together, these results show that sleep restriction is unlikely to induce large-scale shifts in the composition of the microbiome over the time scales studied. These results suggest that pathways independent of gut microbial composition affect metabolism and cognition during sleep deprivation.
Materials and Methods
Rat Sleep Restriction and Sample Collection.
Adult male Sprague–Dawley rats 12 wk of age (Harlan) were individually housed under 12 h:12 h light-dark conditions with lights on from 0400 h to 1600 h. Standard laboratory chow food and water were provided ad libitum. Rats were randomly assigned to a control or sleep restriction group. The sleep-restricted animals were kept awake by forced activity in slowly rotating drums 20 h per day for 7 d (drum diameter 40 cm, rotation speed 40 cm/min) and were allowed to rest during the last 4 h of the light phase (standard rat cage) (16, 17). Four hours before the end of the light phase, sleep-restricted rats and control rats were transferred from their drums or home cages to a second home cage for collection of fecal pellets during the remainder of the light phase (ZT8–12). Fecal pellets were collected, flash frozen, and stored at −80 °C for later analysis. Body weight was recorded every day at the end of the light phase (ZT12), just before the animals of the sleep restriction group were placed back into the rotating drums. Experimental protocols were reviewed and approved by the Institutional Animal Care and Use Committee of the University of Groningen.
Human Subjects and Sample Collection.
Eleven healthy subjects, aged 24–49 y (37.6 ± 8.8 y; 5 females), participated in a controlled sleep restriction experimental protocol. To be eligible for study participation, subjects met the following inclusionary criteria: age range from 22 to 50 y; physical and psychological health, as assessed by physical examination and history; no clinically significant abnormalities in blood chemistry; drug-free urine samples; good habitual sleep, between 6.5 and 8.5 h daily duration with habitual bedtimes between 2200 and 0000, and habitual awakenings between 0600 and 0900 (verified by sleep logs and wrist actigraphy for at least 1 wk before study entry); absence of extreme morningness or extreme eveningness, as assessed by questionnaire (18); absence of sleep or circadian disorders, as assessed by questionnaire (19) and polysomnography; no history of psychiatric illness and no previous adverse neuropsychiatric reaction to sleep deprivation; no history of alcohol or drug abuse; and no current use of medical or drug treatments (excluding oral contraceptives). The protocols were approved by the Institutional Review Board of the University of Pennsylvania. For all subjects, written informed consent was obtained according to the principles expressed in the Declaration of Helsinki before entry; all subjects received compensation for participation. Table 1 contains subject demographic data.
Table 1.
Demographic and polysomnographic sleep information for the study population
| Subject | Age, y | Sex | Race | BMI prestudy, kg/m2 | BMI poststudy, kg/m2 | PSG TST B, h | PSG TST first SR, h | PSG TST first R, h | PSG TST second SR, h | PSG TST second R, h |
| 1 | 47 | F | C | 27.5 | 28.00 | 8.60 | 3.76 | 8.37 | N/A | N/A |
| 2 | 32 | F | C | 20.6 | 21.20 | 10.82 | 3.92 | 10.13 | N/A | N/A |
| 3 | 24 | F | AA | 19.6 | 20.10 | 10.02 | 3.61 | 8.6 | N/A | N/A |
| 4 | 42 | M | C | 23.64 | 23.35 | 8.98 | 3.82 | 8.97 | 3.91 | 11.36 |
| 5 | 32 | M | AA | 19.08 | 21.52 | 8.75 | 3.73 | 8.82 | 3.83 | 9.2 |
| 6 | 35 | M | C | 19.77 | 20.76 | 8.98 | 3.87 | 8.29 | 3.93 | 11.07 |
| 7 | 42 | M | AA | 27.72 | 28.05 | 8.13 | 3.65 | 7.02 | 3.80 | 8.58 |
| 8 | 49 | M | AA | 25.97 | 27.29 | 9.23 | 3.73 | 7.96 | 3.86 | 11.36 |
| 9 | 46 | M | AA | 28.24 | 28.73 | 7.41 | 3.88 | 8.40 | 3.93 | 9.38 |
| 10 | 24 | F | C | 20.57 | 19.85 | 9.56 | 3.49 | 10.29 | 3.93 | 11.42 |
| 11 | 41 | F | AA | 25.69 | 26.88 | 8.30 | 3.76 | 7.73 | 3.90 | 11.07 |
AA, African American; B, baseline; BMI, Body Mass Index; C, Caucasian; F, female; M, male; N/A, not applicable; PSG, polysomnography; R, recovery; SR, sleep restriction; TST, total sleep time.
Subjects participated in one of two protocols in the Sleep and Chronobiology Laboratory at the Hospital of the University of Pennsylvania and were studied for 14 or 20 consecutive days continuously, in a laboratory protocol with daily clinical checks of vital signs and symptoms by nurses (with an independent physician on call). In one protocol, subjects received two baseline nights of 10 h or 12 h time-in-bed (TIB) per night (B; 2200–0800/1000) followed by five nights of sleep restriction of 4 h TIB per night (first SR; 0400–0800) and four nights of 12 h TIB recovery sleep (first R; 2200–1000). In the second protocol, subjects received two baseline nights of 10 h TIB per night (B; 2200–0800) followed by five nights of sleep restriction of 4 h TIB per night (first SR; 0400–0800) and five nights of 12h TIB recovery sleep (first R; 2200–1000). They then underwent a second bout of five nights of sleep restriction of 4 h TIB per night (second SR; 0400–0800), followed by two recovery nights (second R; 12 h TIB per night; 2200–1000). The first 11 nights of the two protocols were procedurally identical.
Throughout the study, laboratory conditions were highly controlled in terms of environmental conditions and scheduled activities. Ambient light was fixed at <50 lx during scheduled wakefulness, and <1 lx (darkness) during scheduled sleep periods. Ambient temperature was maintained between 22° and 24 °C. Subjects were restricted from exercising or engaging in strenuous activities, although they were allowed to read, play video or board games, watch television, and interact with laboratory staff to help remain awake (no visitors were permitted). Subjects were continuously monitored by trained staff to ensure adherence.
Subjects had ad libitum access to food/drink throughout the protocol. Subjects were allowed to consume food and drink at any time during the protocol other than when they were completing neurobehavioral tests or sleeping, or when they were undergoing three 10- to 12-h fasting periods. Full descriptions of ad libitum access can be found in Spaeth et al. (7, 20).
Each subject collected fecal samples via sterile tissue paper at the time of defecation throughout the study. The samples were then stored in a −80 °C freezer until analysis.
Fecal Processing.
Powersoil DNA isolation kit (MO BIO) was used to extract DNA from the pellets (rat) or tissue paper (human). DNA extraction included a negative control in which water or tissue was used instead of feces. Controls were processed, amplified, and sequenced along with samples.
V1-V2 16S rRNA Gene Region Amplification and Sequencing.
Each amplicon library was constructed by amplifying the 16S rRNA gene using the BSF8 and the BSR357 primer pair. DNA samples were PCR amplified by using bar-coded primers flanking the V1V2 region of the 16S rRNA gene. PCRs were performed on a thermocycler by using the following conditions: 95 °C for 5 min followed by 20 cycles of 95 °C for 30 s, 56 °C for 30 s, and 72 °C for 90 s, and a final extension step at 72 °C for 8 min. The amplicons from each DNA sample were amplified in quadruplicate and pooled and purified by using Agencourt AMPure XP beads. Purified DNA samples were sequenced by using Illumina Miseq. After forming operational taxonomic units at 97% identity, a total of 187,378 and 168,152 OTUs were recovered from the rat and human analyses, respectively.
16S rRNA Gene Sequence Analysis.
The sequenced 16S reads were analyzed by using the QIIME software package (21) and the R programming language (R Core Team 2014). Reads were removed from the analysis if they did not match a 12-base golay-barcode with one or fewer errors, if the reads failed to overlap by 35 bases, if the overlapped region differed by more than 15%, or if they had more than three base calls below Q20. OTUs were created by clustering the reads at 97% identity using UCLUST (22). Representative sequences from each OTU were aligned by using PyNAST (23), and a phylogenetic tree was inferred by using FastTree version 2.1.3 (24) after applying the standard Lane mask for 16S sequences (25). Pairwise UniFrac distances were computed by using QIIME (26), and permutational tests of distance were performed by using the vegan library for the R programming language (27). Principal coordinates analysis was performed with the APE library for R (28). Taxonomic assignments were generated by the UCLUST consensus method of QIIME 1.9.1 (29), using the GreenGenes 16S database v. 13_8 (30).
Results
Microbiome of Rats Following Sleep Restriction.
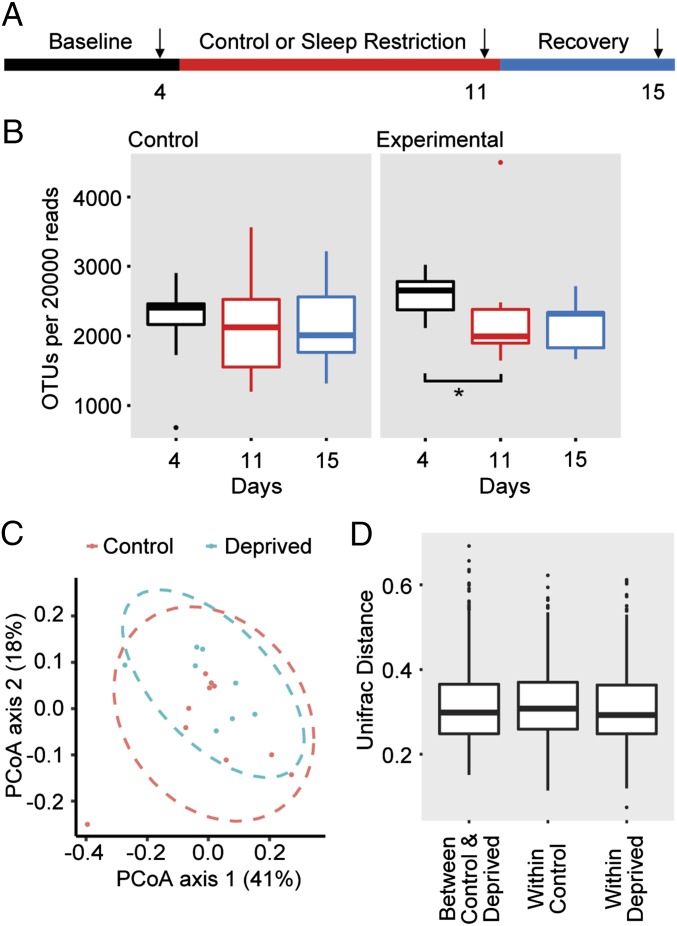
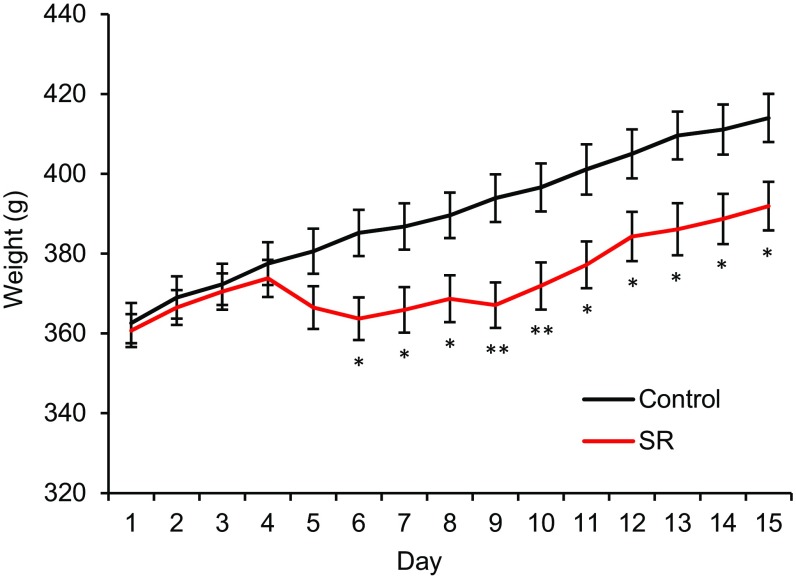
The microbiota of rats was assessed by sampling fecal pellets from individually housed rats during the rest period (ZT8–12). Rats were kept for 4 d for baseline measurements, and then subjected to 7 d of sleep restriction, during which they were limited to 4 h of sleep per night by forced activity. Sleep-restricted rats and handling controls were then allowed 4 d of recovery (Fig. 1A). Rats that were sleep restricted had reduced age-related weight gain compared with controls (Fig. S1), consistent with previous reports (31). The fecal bacterial load, as measured by the total 16S rRNA gene copy numbers, of control rats did not change over the duration of the experiment; however, the sleep-restricted rats had reduced OTU richness (a count of the number of unique OTUs in 20,000 reads) after restriction compared with their own baseline (Fig. 1B). The bacterial load increased, but did not completely normalize with 4 d of recovery sleep. There was no statistical difference in the OTU richness between controls and sleep-restricted rats at any time point.
Fig. 1.
Rat microbiome maintains overall composition following sleep restriction. (A) Schematic of experimental design. Arrows indicate the days on which the fecal pellets were collected for analysis. DNA was collected from rat feces and analyzed by V1-V2 rRNA sequencing. (B) Box-and-whiskers plots of OTUs per 20,000 reads sequenced. n = 10 for the controls, n = 8 for sleep-restricted. *P < 0.05 using paired Student’s t test. (C) PCoA plots explaining 41% and 18% of the variance of OTUs adjusted for abundance of control and sleep-restricted rats at day 11. (D) Box-and-whiskers plots of Unifrac distances comparing control and deprived at day 11 “between control & deprived,” control day 4 to day 11 “within control,” and deprived day 4 to day 11 “within deprived.”
Fig. S1.
Sleep-restricted rats have reduced age-related weight gain. Weight (grams) of control rats compared with sleep-restricted rats for the duration of the study. Means ± SEM are shown. *P < 0.05, **P < 0.01 using paired Student’s t test.
To estimate the relatedness of the microbial communities, we calculated pairwise distances between samples by using the weighted UniFrac metric (26), which takes into account phylogenetic distances among microbes and their relative abundance. Principal coordinate analysis (PCoA) of control and sleep-restricted rats from samples taken after restriction (day 11) do not suggest differences between the two groups (Fig. 1C). We performed PERMANOVA analyses (Adonis function in vegan) with 999 permutations and found insufficient evidence to reject the hypothesis that sleep-restricted populations were similar to those at baseline. These data suggest that the overall composition of the microbial community was not different in the sleep-restricted animals. To determine whether the composition of the microbiota changed within individual sleep-restricted rats, we examined the within-group and between-group weighted UniFrac distances after sleep restriction (Fig. 1D). There were no statistically notable shifts evident in the microbial community in the sleep-restricted rats.
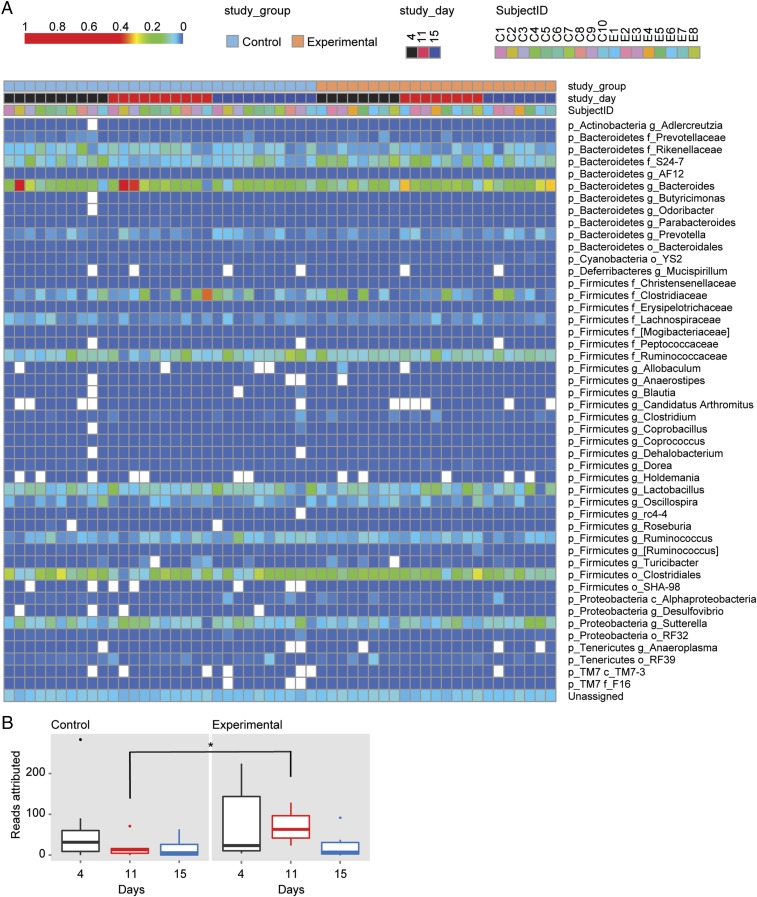
We then examined whether groups of OTUs with commonly assigned taxonomic ranks of the fecal microbiome were changed by sleep restriction (Fig. 2A). Some studies have shown that a higher firmicutes:bacteroidetes (F:B) ratio is associated with changes in fat mass and inflammation (32). In our study, we found no differences in the F:B ratio after sleep restriction. In fact, when the false discovery rate (FDR) threshold of 20% was applied, we found three OTUs to be statistically different between the microbiome of control rats and that of sleep-restricted rats after 7 d of sleep restriction. Two of these OTUs were also different at baseline and could not be attributed to the sleep restriction. Only one OTU, TM7-3a, was higher in the feces of sleep-restricted rats only after restriction, but not at baseline (Fig. 2B). A high abundance of candidate phylum TM7 has been implicated in inflammatory mucosal diseases (33–35), and a particular TM7 phylotype was shown to be parasitic and a potential immune suppressant (36). An increase in TM7 abundance from 1 to 21% in the oral cavity is associated with periodontal disease (37). The observed increase in TM7-3a abundance in the microbiome of sleep-restricted rats was only twofold, so it is unclear whether this difference would be an indicator of inflammation in the absence of additional inflammation-associated gut microbial changes. These data indicate that although OTU richness decreases with sleep restriction in rats, changes in specific gut bacterial species are rare.
Fig. 2.
Individual OTUs of rat microbiome do not exhibit large shifts following sleep deprivation. (A) Heat map of rat microbiome from study days 4, 11, and 15. Blue to red gradient indicates low to high relative levels of OTUs within the given taxonomic unit. White spaces indicate that no reads were observed. (B) Box-and-whiskers plot of the reads attributed to the class of bacteria TM7a-3. n = 10 for the controls, n = 8 for sleep-restricted. *P < 0.05 using Kruskall–Wallis test.
Microbiome Analysis of Sleep-Restricted Human Subjects.
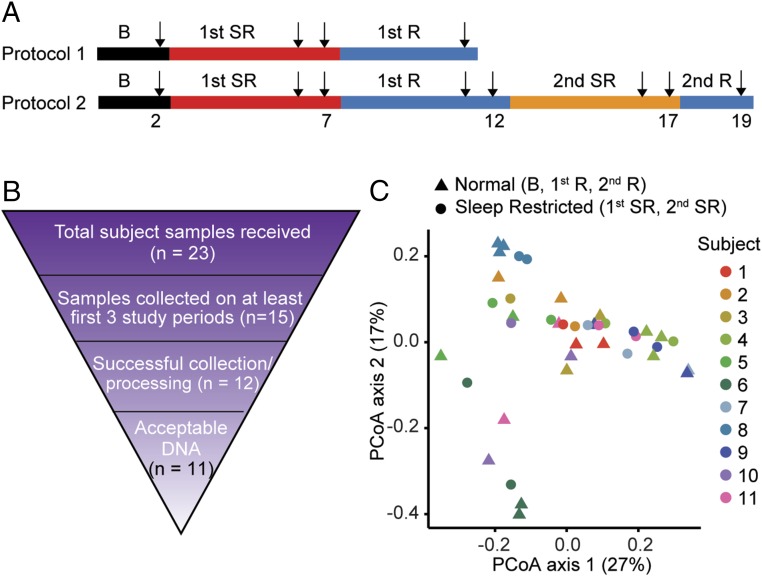
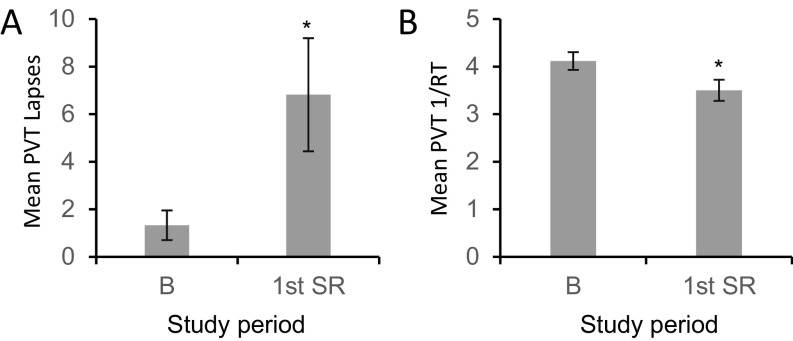
Healthy human subjects were monitored for the entire duration of the experiment. Two days of baseline recording were followed by the period of sleep restriction, during which subjects were allowed 4 h of time in bed for sleep for 5 consecutive days. Fecal samples were used from samples produced on the second day after admission [baseline (B)], after 4 or 5 d of sleep restriction (first SR), after 4 or 5 d of recovery (first R), after 4 or 5 d of a second sleep restriction protocol (second SR), and after 2 d of recovery (second R) (Fig. 3A). Following sleep restriction, 9 of 11 subjects had increased body mass index (BMI) (P < 0.05, paired Student’s t test), suggesting metabolic change consistent with sleep restriction (7). Subjects also displayed deficits in the PVT, which measures behavioral alertness (Fig. S2), consistent with known cognitive responses to sleep restriction by using the same experimental paradigm (38–40).
Fig. 3.
Large variations in the microbiome of individual humans. (A) Schematic of experimental design. Arrows indicate the days on which the samples were collected for analysis. (B) Rationale for final subject exclusion or selection in microbiome analysis. DNA was collected from human feces and analyzed by V1-V2 rRNA sequencing. (C) PCoA plots explaining 27% and 17% of the variance of weighted UniFrac distances from individual subjects.
Fig. S2.
Sleep restriction of human subjects decreased behavioral alertness. The PVT was administered to individuals during the study. Data are shown as means ± SEM. (A) Mean PVT lapses of attention (≥500 ms reaction times) across 10 min are shown for subjects at baseline and after sleep deprivation. *P < 0.05 using paired Student’s t test. (B) Mean reciprocal response time (1/RT; response speed) during the 10-min PVT are shown for subjects at baseline and after sleep deprivation. *P < 0.05 using paired Student’s t test.
Although we obtained samples from 23 subjects, a number of confounding factors reduced the number of subjects included within our final analysis (Fig. 3B). A sample was included only if it was produced between ZT0 and ZT6 (0800–1400), because the microbiome is known to display circadian oscillations (41, 42). In our initial analysis, only the samples from subjects who produced and collected fecal samples during the first three study periods (B, first SR, first R) were processed (n = 15). If subjects produced more than one fecal sample between ZT0 and ZT6 (0800–1400), only the first sample was processed. Three subjects were excluded because no fecal DNA was recoverable from the material submitted. The bacterial DNA samples from the remaining subjects were submitted for sequencing (n = 12). DNA samples of one subject had poor sequencing quality; the samples of remaining subjects were analyzed (n = 11).
The microbiota from individuals were clustered together by weighted UniFrac. No consistent shifts in UniFrac distance were observed following sleep restriction compared with either baseline or recovery (Fig. 3C). These results suggest that sleep restriction does not have overt effects on the beta diversity, which is a measure of similarity or difference in organismal composition between samples. Large genetic differences in humans may contribute to variability in the responses to sleep loss, as is the case with different strains of mice (43). However, we did not detect changes with an acceptable FDR even within the same individual.
Microbiome Analysis of Human Subjects After Two Rounds of Sleep Restriction.
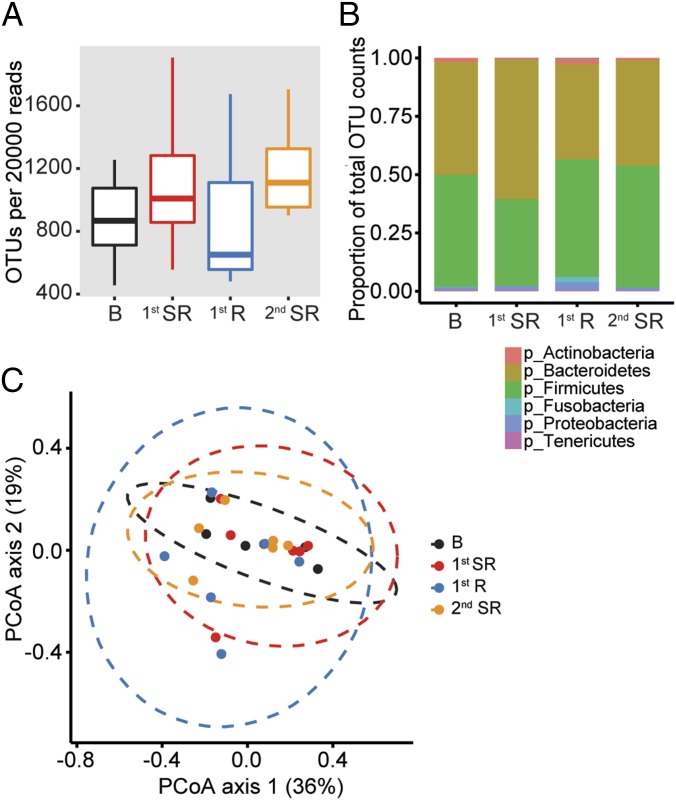
We further analyzed the data from the six individuals who were subjected to two rounds of sleep restriction (see protocol 2; Fig. 3A) and had completed microbiome profiles from baseline, the first period of SR, the first period of recovery, and the second period of SR. We excluded the second period of recovery in our analyses because only three subjects had complete samples from that period. We hypothesized that changes in the microbiome from baseline to the first period of SR would be repeated, and perhaps more pronounced, in samples collected on the second period of SR and could be better detected in our analyses. We measured the beta diversity of the microbiome during each of the study periods and found that the number of observed OTUs per 20,000 reads trended higher after sleep restriction, but was not statistically significant (P > 0.05; Fig. 4A). Examining the microbiome using a phylum-level analysis also showed no significant changes in the ratios of the various phyla (Fig. 4B). Weighted UniFrac measurements comparing the study groups also did not display shifts in microbial communities after sleep restriction (Fig. 4C).
Fig. 4.
Human microbiome maintains overall composition following sleep deprivation. Fecal samples from subjects who completed two rounds of sleep deprivation (n = 6). (A) Box-and-whiskers plots of OTUs per 20,000 reads sequenced. (B) Composition of microbiome by phylum as a proportion of total OTUs. (C) PCoA plots explaining 36% and 19% of the variance of weighted UniFrac distances.
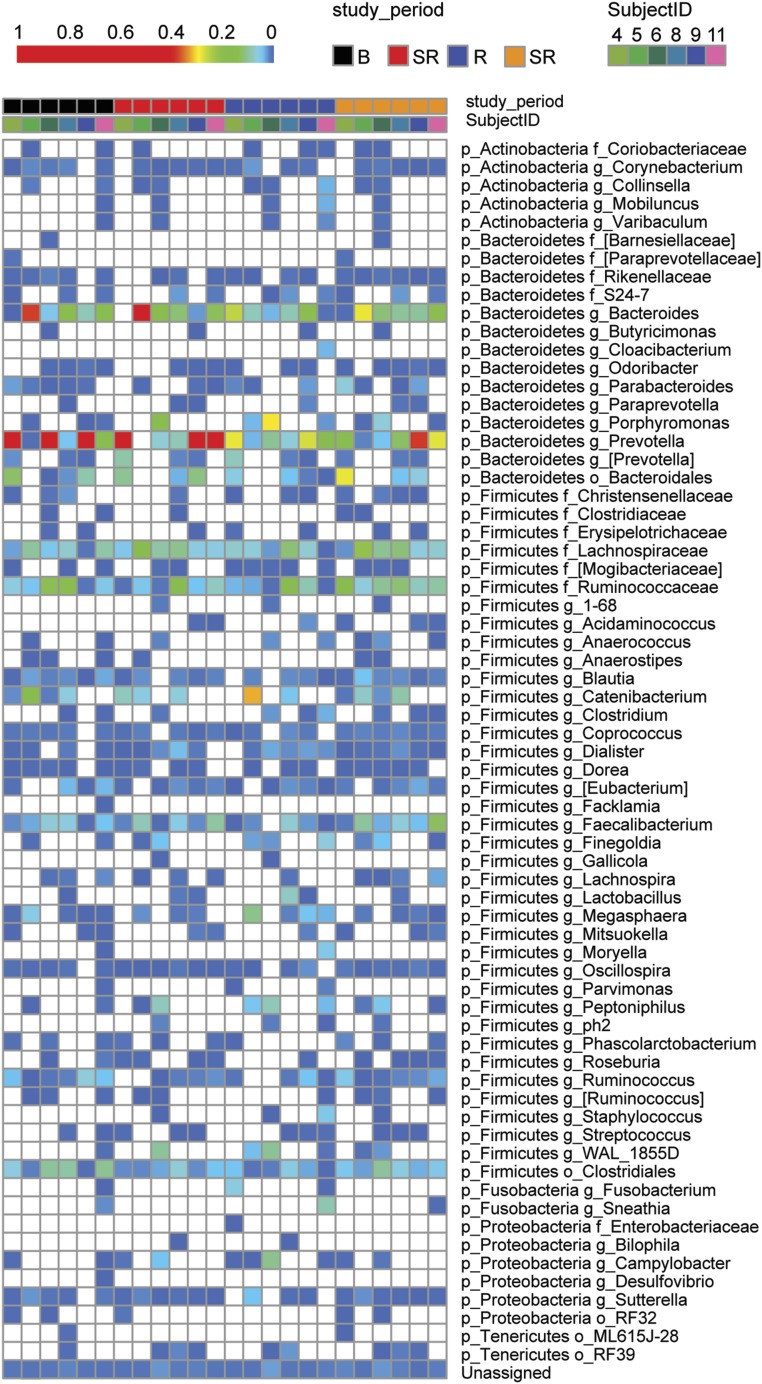
We then tested whether any individual OTUs within the microbiome were altered by sleep restriction (Fig. 5). We sought to identify differing taxa by Kruskall–Wallis comparing baseline to the first period of SR, baseline to the second period of SR, and grouping baseline with the first period of recovery “normal” compared with grouping the first and the second period of SR “restricted.” To our surprise, we found no differences in any OTU abundance with a P < 0.05 even with a generous FDR of 20%. Because there has been a report of male-female differences in microbiome (44), we examined only males (n = 5) in a separate analysis and still found no differences within our parameters. TM7-3a abundance was comparable between the normal and restricted gut microbiome in humans. Taken together, these results suggest that short-term sleep restriction in humans does not drive any specific changes in OTU abundance or population shifts of the microbiome.
Fig. 5.
Individual OTUs of human microbiome do not exhibit large shifts following sleep deprivation. Heat map from individual human samples at baseline, after sleep restriction, after recovery, after the second round of sleep restriction. Blue to red gradient indicates low to high relative levels of OTUs within the given taxonomic unit. White spaces indicate that no reads were observed.
Discussion
Sleep restriction of rats decreased the beta diversity of the microbiome. A single OTU (TM7a-3) representing <1% of fecal bacteria was observed to be statistically different between control and sleep-restricted rats; other OTUs were unaffected in the sleep-restricted group as a whole. We infer that the decline in OTU after sleep restriction results from changes in different low abundance species across individual rats. In human subjects, we observed no significant changes to beta diversity or changes in OTU abundance in the gut microbiome. One key difference between the rat and human study was the method of sleep restriction. The human subjects were kept awake by cognitive activities and interactions with staff, whereas the rats were subjected to forced activity; however, the protocols used are standard for the two species. A previous study using the same rat protocol, with additional activity controls, found that many metabolic differences seen after sleep restriction are not due to exercise, and the required locomotion produces mild increases in the stress hormone corticosterone (14, 16). Another difference between the studies is the percentage of sleep loss from normal levels, which was higher for the rats (∼67% compared with ∼50% in humans) as sleep was restricted to 4 h for both studies, but normal sleep amount is higher in rats (∼12 h compared with 8 h for humans). Despite these differences between humans and rats, shifts in the microbiome by weighted UniFrac distance were not significant for either study. We demonstrate that the composition of the microbiome is remarkably resistant to sleep deprivation across species, in both rats and humans.
A recent study examined the microbiome in humans after sleep restriction and found that beta diversity was not altered by sleep restriction, similar to our results; however, they suggest that the F:B ratio is altered by only 2 d of sleep restriction (45). We do not find evidence of changes to the F:B ratio in our study in either the rat or the human microbiome. This discrepancy with respect to the human fecal microbiome might be attributed to the protocol Benedict et al. (45) used for these experiments, which had baseline measurements taken in the subject’s home; in our protocol, all samples were produced in a controlled laboratory environment. A shift from home to hospital environment can alter gut microbiome within days (46), potentially accounting for the differences in the findings of these two studies. We also included a second bout of sleep restriction in our protocol, which reduces the likelihood of false positive correlations. Finally, our protocol examined the microbiome at a consistent circadian time, because time of day has also been shown to influence gut microbiota (41, 42).
A study in mice found shifts in the microbiome after longer term (4 wk) sleep fragmentation (47); however, it is unclear whether the changes to the microbiome were a primary effect of sleep fragmentation or a secondary effect of increased food intake and increased fat mass. Regardless, the microbiome may be more affected by the quality of sleep long term rather than quantity of sleep acutely. Detrimental effects of acute bouts of sleep restriction, such as during mating or migration, may be compensated (48). In our results, we see minor differences in the rat microbiome after 7 d of sleep deprivation, which is a much greater proportion of the rat lifespan than 10 d in humans. Thus, we cannot not discount the possibility that human microbiome dysbiosis might result with chronic sleep restriction on a timescale of weeks or months, which would be a more similar proportion to human lifespan as the sleep-restricted period in the rat protocol.
Taking our data together, we do not find strong evidence for dysbiosis of the gut microbiome following five consecutive days of sleep restriction, yet there is evidence for weight gain, metabolic changes in glucose tolerance, and insulin resistance during a similar timeframe in human adults (4, 7). Changes in the peripheral circulating metabolome are even detected after a single day of sleep restriction (13, 14). In addition, sleep restriction increases plasma levels of proinflammatory cytokines within a week (49). We conclude that metabolic changes due to sleep restriction are not caused by dysbiosis; however, it is clear that dysbiosis of the gut microbiome can directly affect metabolism (50). We suggest that sleep deficiency and microbiome dysfunction might be separate risk factors for metabolic diseases.
Our studies of sleep restriction and the microbiome were in healthy animals and healthy adults who were normal weight or overweight and followed normal diets. In healthy adults, the beta diversity of the microbiome remains relatively stable once established (51). Perhaps a study in obese or diabetic individuals, or one that includes a high-fat diet in addition to the sleep restriction, would reveal shifts in the gut microbiome. Future work might also consider metagenomic sequencing to determine whether sleep restriction alters the functional potential of the microbiome.
SI Materials and Methods
Human Cognitive Tests.
Subjects underwent computerized cognitive tests every 2 h during scheduled wakefulness. The cognitive test battery included the 10-min Psychomotor Vigilance Test (PVT), a test of sustained attention using reaction times as an assay of behavioral alertness (26–28). Subjects remained seated throughout the cognitive test periods and were behaviorally monitored. Subjects were instructed to perform to the best of their ability and to use compensatory effort to maintain performance. Daily values for each performance task were calculated by averaging scores from all test bouts that day (1000–2000 for B and first SR). Outcome measures were PVT lapses (≥500 ms reaction times) and PVT mean response speed or reciprocal response time (1/RT).
Acknowledgments
We thank Judith Kreutzmann for her help with setting up the experiment and collecting the data, Han Wang for sample preparation and processing, the subjects who participated in the experiments, and the staff of the Division of Sleep and Chronobiology who helped acquire the data. This work was supported by National Institutes of Health Grants T32HL07713, R25MH060490 (to S.L.Z.), and R01 NR004281 (to D.F.D.); the Howard Hughes Medical Institute (A.S.); PennCHOP Microbiome Program and Penn Center for AIDS Research P30 Grant AI 045008 (to F.D.B.); the Groningen Institute of Evolutionary Life Sciences at the University of Groningen; Department of the Navy, Office of Naval Research Award N00014-11-1-0361 (to N.G.); and NASA Grant NNX14AN49G (to N.G.).
Footnotes
The authors declare no conflict of interest.
Data deposition: The data reported in this paper have been deposited in the National Center for Biotechnology Information (NCBI) Bioproject, https://www.ncbi.nlm.nih.gov/bioproject/ (accession no. PRJNA368998).
This article contains supporting information online at www.pnas.org/lookup/suppl/doi:10.1073/pnas.1620673114/-/DCSupplemental.
References
- 1.National Health Interview Survey QuickStats: Percentage of Adults Who Average ≤6 Hours of Sleep,* by Family Income Group† and Metropolitan Status of Residence§ — National Health Interview Survey, United States, 2013¶. 2015;64(12):335. [Google Scholar]
- 2.Mullington JM, Haack M, Toth M, Serrador JM, Meier-Ewert HK. Cardiovascular, inflammatory, and metabolic consequences of sleep deprivation. Prog Cardiovasc Dis. 2009;51(4):294–302. doi: 10.1016/j.pcad.2008.10.003. [DOI] [PMC free article] [PubMed] [Google Scholar]
- 3.Beccuti G, Pannain S. Sleep and obesity. Curr Opin Clin Nutr Metab Care. 2011;14(4):402–412. doi: 10.1097/MCO.0b013e3283479109. [DOI] [PMC free article] [PubMed] [Google Scholar]
- 4.Knutson KL, Spiegel K, Penev P, Van Cauter E. The metabolic consequences of sleep deprivation. Sleep Med Rev. 2007;11(3):163–178. doi: 10.1016/j.smrv.2007.01.002. [DOI] [PMC free article] [PubMed] [Google Scholar]
- 5.Spiegel K, Leproult R, Van Cauter E. Impact of sleep debt on metabolic and endocrine function. Lancet. 1999;354(9188):1435–1439. doi: 10.1016/S0140-6736(99)01376-8. [DOI] [PubMed] [Google Scholar]
- 6.VanHelder T, Symons JD, Radomski MW. Effects of sleep deprivation and exercise on glucose tolerance. Aviat Space Environ Med. 1993;64(6):487–492. [PubMed] [Google Scholar]
- 7.Spaeth AM, Dinges DF, Goel N. Effects of experimental sleep restriction on weight gain, caloric intake, and meal timing in healthy adults. Sleep. 2013;36(7):981–990. doi: 10.5665/sleep.2792. [DOI] [PMC free article] [PubMed] [Google Scholar]
- 8.Goel N, Rao H, Durmer JS, Dinges DF. Neurocognitive consequences of sleep deprivation. Semin Neurol. 2009;29(4):320–339. doi: 10.1055/s-0029-1237117. [DOI] [PMC free article] [PubMed] [Google Scholar]
- 9.Larsen N, et al. Gut microbiota in human adults with type 2 diabetes differs from non-diabetic adults. PLoS One. 2010;5(2):e9085. doi: 10.1371/journal.pone.0009085. [DOI] [PMC free article] [PubMed] [Google Scholar]
- 10.Bäckhed F, et al. The gut microbiota as an environmental factor that regulates fat storage. Proc Natl Acad Sci USA. 2004;101(44):15718–15723. doi: 10.1073/pnas.0407076101. [DOI] [PMC free article] [PubMed] [Google Scholar]
- 11.Turnbaugh PJ, et al. An obesity-associated gut microbiome with increased capacity for energy harvest. Nature. 2006;444(7122):1027–1031. doi: 10.1038/nature05414. [DOI] [PubMed] [Google Scholar]
- 12.Carabotti M, Scirocco A, Maselli MA, Severi C. The gut-brain axis: Interactions between enteric microbiota, central and enteric nervous systems. Ann Gastroenterol. 2015;28(2):203–209. [PMC free article] [PubMed] [Google Scholar]
- 13.Davies SK, et al. Effect of sleep deprivation on the human metabolome. Proc Natl Acad Sci USA. 2014;111(29):10761–10766. doi: 10.1073/pnas.1402663111. [DOI] [PMC free article] [PubMed] [Google Scholar]
- 14.Weljie AM, et al. Oxalic acid and diacylglycerol 36:3 are cross-species markers of sleep debt. Proc Natl Acad Sci USA. 2015;112(8):2569–2574. doi: 10.1073/pnas.1417432112. [DOI] [PMC free article] [PubMed] [Google Scholar]
- 15.Dinges DF, et al. Cumulative sleepiness, mood disturbance and psychomotor vigilance performance decrements during aweek of sleep restricted to 4-5 hours per night. Sleep. 1997;20(4):267–77. [PubMed] [Google Scholar]
- 16.Roman V, Walstra I, Luiten PGM, Meerlo P. Too little sleep gradually desensitizes the serotonin 1A receptor system. Sleep. 2005;28(12):1505–1510. [PubMed] [Google Scholar]
- 17.Novati A, et al. Chronically restricted sleep leads to depression-like changes in neurotransmitter receptor sensitivity and neuroendocrine stress reactivity in rats. Sleep. 2008;31(11):1579–1585. doi: 10.1093/sleep/31.11.1579. [DOI] [PMC free article] [PubMed] [Google Scholar]
- 18.Smith CS, Reilly C, Midkiff K. Evaluation of three circadian rhythm questionnaires with suggestions for an improved measure of morningness. J Appl Psychol. 1989;74(5):728–738. doi: 10.1037/0021-9010.74.5.728. [DOI] [PubMed] [Google Scholar]
- 19.Douglass AB, et al. The Sleep Disorders Questionnaire. I: Creation and multivariate structure of SDQ. Sleep. 1994;17(2):160–167. doi: 10.1093/sleep/17.2.160. [DOI] [PubMed] [Google Scholar]
- 20.Spaeth AM, Dinges DF, Goel N. Sex and race differences in caloric intake during sleep restriction in healthy adults. Am J Clin Nutr. 2014;100(2):559–566. doi: 10.3945/ajcn.114.086579. [DOI] [PMC free article] [PubMed] [Google Scholar]
- 21.Caporaso JG, et al. QIIME allows analysis of high-throughput community sequencing data. Nat Methods. 2010;7(5):335–336. doi: 10.1038/nmeth.f.303. [DOI] [PMC free article] [PubMed] [Google Scholar]
- 22.Edgar RC. Search and clustering orders of magnitude faster than BLAST. Bioinformatics. 2010;26(19):2460–2461. doi: 10.1093/bioinformatics/btq461. [DOI] [PubMed] [Google Scholar]
- 23.Caporaso JG, et al. PyNAST: A flexible tool for aligning sequences to a template alignment. Bioinformatics. 2010;26(2):266–267. doi: 10.1093/bioinformatics/btp636. [DOI] [PMC free article] [PubMed] [Google Scholar]
- 24.Price MN, Dehal PS, Arkin AP. FastTree 2--approximately maximum-likelihood trees for large alignments. PLoS One. 2010;5(3):e9490. doi: 10.1371/journal.pone.0009490. [DOI] [PMC free article] [PubMed] [Google Scholar]
- 25.Weisburg WG, Barns SM, Pelletier DA, Lane DJ. 16S ribosomal DNA amplification for phylogenetic study. J Bacteriol. 1991;173(2):697–703. doi: 10.1128/jb.173.2.697-703.1991. [DOI] [PMC free article] [PubMed] [Google Scholar]
- 26.Lozupone C, Knight R. UniFrac: A new phylogenetic method for comparing microbial communities. Appl Environ Microbiol. 2005;71(12):8228–8235. doi: 10.1128/AEM.71.12.8228-8235.2005. [DOI] [PMC free article] [PubMed] [Google Scholar]
- 27.Oksanen J, Blanchet F, Kindt R. 2013 Package “vegan.” Community Ecol. Available at: https://CRAN.R-project.org/package=vegan [Accessed November 28, 2016]
- 28.Paradis E, Claude J, Strimmer K. APE: Analyses of Phylogenetics and Evolution in R language. Bioinformatics. 2004;20(2):289–290. doi: 10.1093/bioinformatics/btg412. [DOI] [PubMed] [Google Scholar]
- 29.Bokulich NA, et al. 2015. A standardized, extensible framework for optimizing classification improves marker-gene taxonomic assignments. PeerJ PrePrints 3:e934v2.
- 30.McDonald D, et al. An improved Greengenes taxonomy with explicit ranks for ecological and evolutionary analyses of bacteria and archaea. ISME J. 2012;6(3):610–618. doi: 10.1038/ismej.2011.139. [DOI] [PMC free article] [PubMed] [Google Scholar]
- 31.Barf RP, et al. Metabolic consequences of chronic sleep restriction in rats: Changes in body weight regulation and energy expenditure. Physiol Behav. 2012;107(3):322–328. doi: 10.1016/j.physbeh.2012.09.005. [DOI] [PubMed] [Google Scholar]
- 32.Ley RE, et al. Obesity alters gut microbial ecology. Proc Natl Acad Sci USA. 2005;102(31):11070–11075. doi: 10.1073/pnas.0504978102. [DOI] [PMC free article] [PubMed] [Google Scholar]
- 33.Kuehbacher T, et al. Intestinal TM7 bacterial phylogenies in active inflammatory bowel disease. J Med Microbiol. 2008;57(Pt 12):1569–1576. doi: 10.1099/jmm.0.47719-0. [DOI] [PubMed] [Google Scholar]
- 34.Brinig MM, Lepp PW, Ouverney CC, Armitage GC, Relman DA. Prevalence of bacteria of division TM7 in human subgingival plaque and their association with disease. Appl Environ Microbiol. 2003;69(3):1687–1694. doi: 10.1128/AEM.69.3.1687-1694.2003. [DOI] [PMC free article] [PubMed] [Google Scholar]
- 35.Fredricks DN, Fiedler TL, Marrazzo JM. Molecular identification of bacteria associated with bacterial vaginosis. N Engl J Med. 2005;353(18):1899–1911. doi: 10.1056/NEJMoa043802. [DOI] [PubMed] [Google Scholar]
- 36.He X, et al. Cultivation of a human-associated TM7 phylotype reveals a reduced genome and epibiotic parasitic lifestyle. Proc Natl Acad Sci USA. 2015;112(1):244–249. doi: 10.1073/pnas.1419038112. [DOI] [PMC free article] [PubMed] [Google Scholar]
- 37.Liu B, et al. Deep sequencing of the oral microbiome reveals signatures of periodontal disease. PLoS One. 2012;7(6):e37919. doi: 10.1371/journal.pone.0037919. [DOI] [PMC free article] [PubMed] [Google Scholar]
- 38.Goel N, Banks S, Mignot E, Dinges DF. PER3 polymorphism predicts cumulative sleep homeostatic but not neurobehavioral changes to chronic partial sleep deprivation. PLoS One. 2009;4(6):e5874. doi: 10.1371/journal.pone.0005874. [DOI] [PMC free article] [PubMed] [Google Scholar]
- 39.Goel N, Banks S, Mignot E, Dinges DF. DQB1*0602 predicts interindividual differences in physiologic sleep, sleepiness, and fatigue. Neurology. 2010;75(17):1509–1519. doi: 10.1212/WNL.0b013e3181f9615d. [DOI] [PMC free article] [PubMed] [Google Scholar]
- 40.Goel N, Banks S, Lin L, Mignot E, Dinges DF. Catechol-O-methyltransferase Val158Met polymorphism associates with individual differences in sleep physiologic responses to chronic sleep loss. PLoS One. 2011;6(12):e29283. doi: 10.1371/journal.pone.0029283. [DOI] [PMC free article] [PubMed] [Google Scholar]
- 41.Thaiss CA, et al. Transkingdom control of microbiota diurnal oscillations promotes metabolic homeostasis. Cell. 2014;159(3):514–529. doi: 10.1016/j.cell.2014.09.048. [DOI] [PubMed] [Google Scholar]
- 42.Liang X, Bushman FD, FitzGerald GA. Rhythmicity of the intestinal microbiota is regulated by gender and the host circadian clock. Proc Natl Acad Sci USA. 2015;112(33):10479–10484. doi: 10.1073/pnas.1501305112. [DOI] [PMC free article] [PubMed] [Google Scholar]
- 43.Franken P, Malafosse A, Tafti M. Genetic determinants of sleep regulation in inbred mice. Sleep. 1999;22(2):155–169. [PubMed] [Google Scholar]
- 44.Haro C, et al. Intestinal microbiota is influenced by gender and body mass index. PLoS One. 2016;11(5):e0154090. doi: 10.1371/journal.pone.0154090. [DOI] [PMC free article] [PubMed] [Google Scholar]
- 45.Benedict C, et al. Gut microbiota and glucometabolic alterations in response to recurrent partial sleep deprivation in normal-weight young individuals. Mol Metab. 2016;5(12):1175–1186. doi: 10.1016/j.molmet.2016.10.003. [DOI] [PMC free article] [PubMed] [Google Scholar]
- 46.McDonald D, et al. Extreme dysbiosis of the microbiome in critical illness. mSphere. 2016;1(4):e00199–16. doi: 10.1128/mSphere.00199-16. [DOI] [PMC free article] [PubMed] [Google Scholar]
- 47.Poroyko VA, et al. Chronic sleep disruption alters gut microbiota, induces systemic and adipose tissue inflammation and insulin resistance in mice. Sci Rep. 2016;6:35405. doi: 10.1038/srep35405. [DOI] [PMC free article] [PubMed] [Google Scholar]
- 48.Siegel JM. Suppression of sleep for mating. Science. 2012;337(6102):1610–1611. doi: 10.1126/science.1228466. [DOI] [PMC free article] [PubMed] [Google Scholar]
- 49.Vgontzas AN, et al. Adverse effects of modest sleep restriction on sleepiness, performance, and inflammatory cytokines. J Clin Endocrinol Metab. 2004;89(5):2119–2126. doi: 10.1210/jc.2003-031562. [DOI] [PubMed] [Google Scholar]
- 50.Cani PD, et al. Metabolic endotoxemia initiates obesity and insulin resistance. Diabetes. 2007;56(7):1761–1772. doi: 10.2337/db06-1491. [DOI] [PubMed] [Google Scholar]
- 51.Zoetendal EG, Akkermans AD, De Vos WM. Temperature gradient gel electrophoresis analysis of 16S rRNA from human fecal samples reveals stable and host-specific communities of active bacteria. Appl Environ Microbiol. 1998;64(10):3854–3859. doi: 10.1128/aem.64.10.3854-3859.1998. [DOI] [PMC free article] [PubMed] [Google Scholar]


