

Abstract
Half the human genome is made of transposable elements (TEs), whose ongoing activity continues to impact our genome. LINE-1 (or L1) is an autonomous non-LTR retrotransposon in the human genome, comprising 17% of its genomic mass and containing an average of 80–100 active L1s per average genome that provide a source of inter-individual variation. New LINE-1 insertions are thought to accumulate mostly during human embryogenesis. Surprisingly, the activity of L1s can further impact the somatic human brain genome. However, it is currently unknown whether L1 can retrotranspose in other somatic healthy tissues or if L1 mobilization is restricted to neuronal precursor cells (NPCs) in the human brain. Here, we took advantage of an engineered L1 retrotransposition assay to analyze L1 mobilization rates in human mesenchymal (MSCs) and hematopoietic (HSCs) somatic stem cells. Notably, we have observed that L1 expression and engineered retrotransposition is much lower in both MSCs and HSCs when compared to NPCs. Remarkably, we have further demonstrated for the first time that engineered L1s can retrotranspose efficiently in mature nondividing neuronal cells. Thus, these findings suggest that the degree of somatic mosaicism and the impact of L1 retrotransposition in the human brain is likely much higher than previously thought.
Mammalian genomes contain a high number of transposable element (TE)-derived sequences, and up to 70% of our genome represents TE-derived sequences (de Koning et al. 2011; Richardson et al. 2015). During evolution, the human genome has accumulated millions of TE insertions that have shaped its structure and function (Beck et al. 2011; Richardson et al. 2015). The activity of TEs continues to impact the human genome, and a fraction of non-LTR retrotransposons continue to mobilize in our genome (Mills et al. 2007; Beck et al. 2011; Richardson et al. 2015). Approximately one-half million Long INterspersed Element class 1 (LINE-1 or L1) retrotransposons comprise almost a fifth of the human genome (International Human Genome Sequencing Consortium 2001; Beck et al. 2011; Richardson et al. 2015). Although the great majority of LINE-1s are molecular fossils that have lost the ability to mobilize due to the accumulation of mutations and other DNA rearrangements, an average human genome contains 80–100 potentially active retrotransposition-competent L1s (RC-L1s) (Brouha et al. 2003; Beck et al. 2010). LINE-1s are non-LTR retrotransposons that mobilize by a “copy-and-paste” mechanism using an intermediate RNA (Luan et al. 1993; Beck et al. 2011; Richardson et al. 2015). RC-L1s are 6-kb-long elements and encode two proteins (ORF1p and ORF2p) that are strictly required for retrotransposition (Moran et al. 1996). ORF1 codes for an RNA-binding protein with nucleic acid chaperone activity (Hohjoh and Singer 1996, 1997; Martin and Bushman 2001; Khazina and Weichenrieder 2009), whereas ORF2 encodes a protein with ENdonuclease (EN) and Reverse Transcriptase (RT) activities (Mathias et al. 1991; Feng et al. 1996). Retrotransposition starts with the transcription of a full-length RC-L1 mRNA, using an internal promoter located in the L1-5′ untranslated region (UTR) (Swergold 1990). The L1 mRNA is translated in the cytoplasm (Alisch et al. 2006; Dmitriev et al. 2007), and ORF1 and ORF2 proteins preferentially bind back to their same encoding mRNA to form a ribonucleoprotein particle (L1-RNP) (Wei et al. 2001). Numerous host factors are known to interact with L1-RNPs, and some of these factors control the rate of retrotransposition (Goodier et al. 2013; Taylor et al. 2013; Moldovan and Moran 2015). Studies in transformed cell lines have demonstrated that L1-RNPs can enter the nucleus without cell division (Kubo et al. 2006), where retrotransposition takes place by a mechanism termed Target Primed Reverse Transcription (TPRT) (for review, see Beck et al. 2011; Richardson et al. 2015; Goodier 2016). The result is a new L1 insertion that is usually 5′ truncated and flanked by short Target Site Duplications (TSDs) (Beck et al. 2011; Richardson et al. 2015; Goodier 2016).
RC-L1s continue to impact the germline genome (i.e., the genome that passes to the next generation) and new insertions can sporadically act as human germline mutagens (for review, see Beck et al. 2011; Hancks and Kazazian 2012; Richardson et al. 2015; Goodier 2016). The use of cultured cells, animal models, and patient characterization has so far suggested that most de novo L1 retrotransposition events in humans accumulate during early embryogenesis (Garcia-Perez et al. 2007; van den Hurk et al. 2007; Kano et al. 2009; Wissing et al. 2012; Klawitter et al. 2016). Interestingly, LINE-1 activity is not restricted to the germline and embryonic genomes, and new L1 insertions can accumulate in tumors (for review, see Carreira et al. 2013) and in the brain (for review, see Singer et al. 2010; Richardson et al. 2014a). Indeed, using a cell-based engineered L1-retrotransposition assay, previous studies have demonstrated ongoing L1 retrotransposition in tumor cells (Moran et al. 1996; Ostertag et al. 2000) and in mammalian neuronal progenitor cells (NPCs) (Muotri et al. 2005, 2010; Coufal et al. 2009, 2011). Additionally, next-generation DNA sequencing approaches have demonstrated that the human brain is a mosaic of genomes due to ongoing L1 activity (Baillie et al. 2011; Evrony et al. 2012; Upton et al. 2015; Erwin et al. 2016).
The somatic activity of L1s suggest that new L1 insertions might shape the structure/function of the human brain genome, although the extent and type of cells that can accumulate new L1 insertions in the brain remain largely unexplored. Additionally, it is currently unknown whether other adult nonbrain somatic stem cells also accommodate the activity of RC-L1s.
Results
L1 expression and engineered retrotransposition in human ectodermal cells
To explore L1 expression and retrotransposition in human NPCs, we exploited the differentiation potential of human embryonic stem cells (H9-hESCs) (Thomson et al. 1998) to obtain homogenous populations of NPCs (Supplemental Fig. S1A). Consistent with previous findings (Coufal et al. 2009, 2011), H9-derived NPCs express canonical neuronal markers (Fig. 1E; Supplemental Fig. S1B) and abundant L1 mRNAs (Fig. 1B). These data were confirmed using Western-blotting and confocal microscopy analyses (Fig. 1A; Supplemental Fig. S1C,D). Pluripotent H9-hESCs and human foreskin fibroblasts (HFFs) were used as positive and negative controls of L1 expression, respectively (Garcia-Perez et al. 2007, 2010; Wissing et al. 2011, 2012). Importantly, an engineered retrotransposition assay confirmed that NPCs support elevated rates of L1 mobilization (Fig. 1C). In this assay, an enhanced green fluorescent protein (EGFP) reporter gene cassette (megfpI) (Ostertag et al. 2000), interrupted by a backward intron and inserted in opposite transcriptional orientation into the 3′ UTR of an RC-L1 (Supplemental Fig. S1E, plasmid 99-gfp-LRE3) (Coufal et al. 2009; Garcia-Perez et al. 2010), is expressed only when the L1 transcript is spliced, reverse transcribed, its cDNA inserted in the genome, and the EGFP reporter gene expressed from its own promoter (Fig. 1C; Supplemental Fig. S1E). As a control, an allelic plasmid containing two missense mutations in L1-ORF1p (RR261/62AA) failed to retrotranspose in NPCs, as expected (Moran et al. 1996; Coufal et al. 2009, 2011). These data were further confirmed using a PCR-based assay and a set of primers flanking the engineered intron in the megfpI cassette (Table 1; Fig. 1C; Supplemental Fig. S10G).
Figure 1.

LINE-1 retrotransposition in human neuronal progenitor cells. (A) Confocal analyses of L1-ORF1p expression in H9-hESC (top) and H9-hESC-derived NPCs (bottom). A merged image of nuclear DNA stained with DAPI (blue) and L1-ORF1p staining (green) is shown. An enlargement of a portion of the image is shown at the right; (scale bars) 10 µm. (B) L1Hs mRNA expression analyses by RT-qPCR. A cartoon of an active L1Hs element is shown, in which the relative positions of the 5′ UTR, ORF1, ORF2, and 3′ UTR sequences are indicated. Also indicated is the relative position of the primer pair used to analyze L1 expression (N-51 pair). The numbering refers to the nucleotide sequence of L1.3 (Sassaman et al. 1997). The bar graph shows expression data in the indicated sample (n = 3 biological replicas). The expression level of H9-hESCs was designated 1 for comparison. Also indicated is the significance of the statistical method applied (one-way ANOVA with Tukey, P-value 0.0257 and 0.0072) and SEM (Methods). (C) Representative retrotransposition results in hESC-derived NPCs 7 d post-transfection using plasmid 99-gfp-LRE3 (Supplemental Fig. S1E). A FACS histogram plot (SSC-A versus EGFP, the percentage of EGFP-expressing cells is indicated, in triplicate) and a merged image (bright field/EGFP) of transfected NPCs with plasmid 99-gfp-LRE3 are shown. The rightmost panel contains results from the PCR intron assay. pk87 cells (Garcia-Perez et al. 2010) were used as a positive amplification control of spliced L1-EGFP. The amplification of a portion of the SV40 polyadenylation sequence was used as a control (present in the transfected plasmid) (Supplemental Fig. S1E, black lollipop). (D) Rationale of the retrotransposition assay using the Ad-L1 virus: (gray arrows) exogenous promoters (PGK1, upstream tagged L1; SV40, beta-gal; CMV, EGFP); (blue box) independent beta-gal expression cassette; (Ad-ITR) inverted terminal repeats of human adenovirus type 5; (ψ) packaging signal. With this configuration, expression of EGFP can only be activated after a round of retrotransposition (Supplemental Fig. S1E). (E) Representative retrotransposition assays using the Ad-L1 in hESC-derived NPCs. A merged image of Ad-L1-infected NPCs analyzed 3 d after infection and stained with antibodies against NES (pink) and EGFP (green) is shown; nuclear DNA was stained with DAPI (blue). The left side contains the captured images used in the merged image; (white bars) 5 µm.
Table 1.
Summary of expression and retrotransposition in somatic stem cells
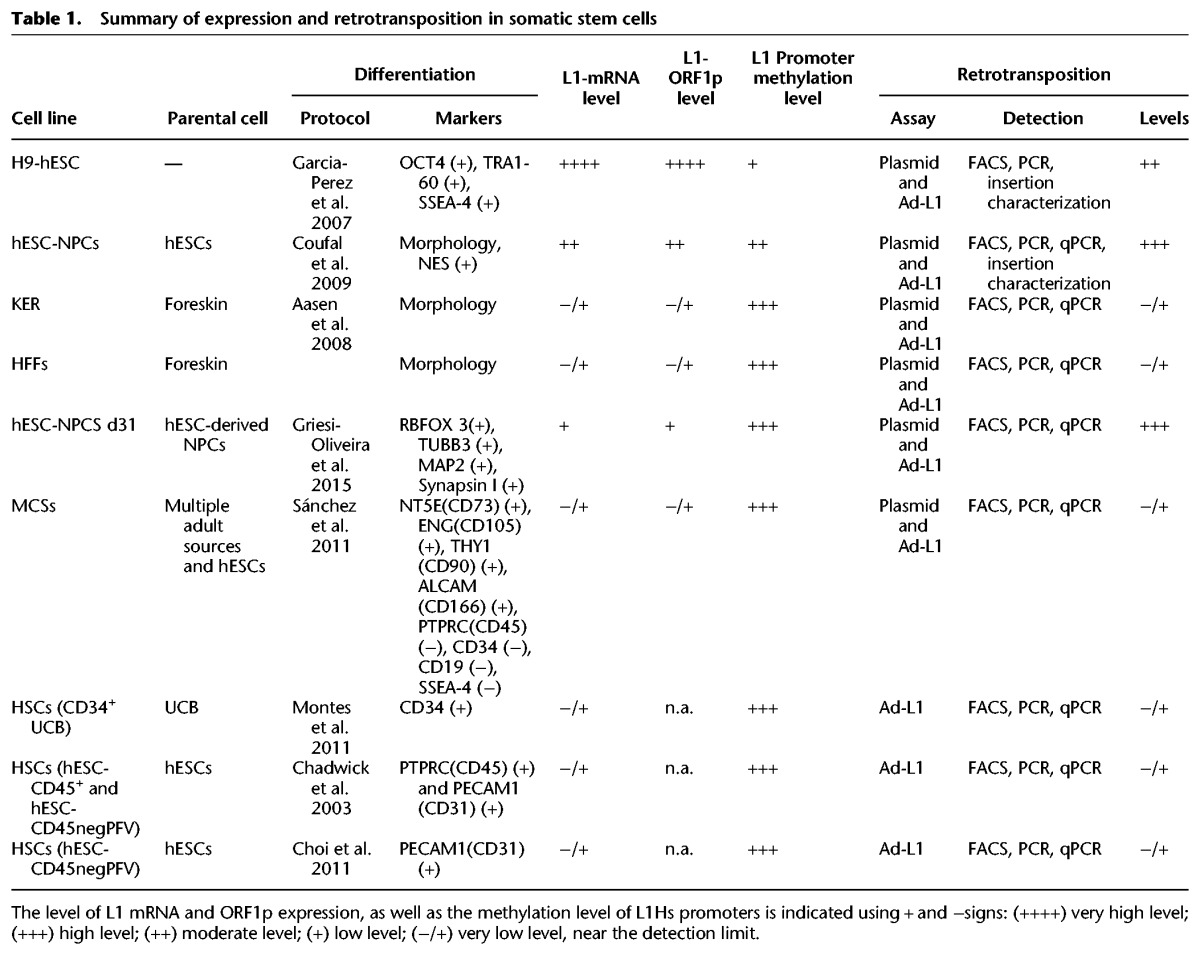
To support these findings and to avoid limitations of plasmid transfections, we next took advantage of a previously developed adenovirus-retrotransposon hybrid virus (A/RT-pgk-L1RP-EGFP, herein named Ad-L1) (Kubo et al. 2006). The hybrid adenovirus contains a human RC-L1 (L1-RP) (Kimberland et al. 1999) tagged with the megfpI retrotransposition cassette (Ostertag et al. 2000); additionally, the Ad-L1 contains an exogenous phosphoglycerate kinase-1 (PGK1) promoter to increase L1 expression and to correct for expression differences among transduced cell types; finally, the Ad-L1 also contains an independent SV40-driven beta-galactosidase (beta-gal) expression cassette (Fig. 1D; Kubo et al. 2006). Notably, the Ad-L1 allows introduction of the L1-reporter into cultured cells by infection, solving difficulties associated to transfection (Kubo et al. 2006). Additionally, the beta-gal expression cassette allows controlling infection efficiency. Controls revealed efficient transduction and L1 retrotransposition in NPCs (Fig. 1E; Supplemental Fig. S2C) and HeLa cells (Supplemental Fig. S2A,B) using the Ad-L1. Thus, these data corroborate that hESC-derived NPCs express moderate levels of endogenous L1s (∼40% of the level detected in hESCs) and can accommodate significant levels of L1 retrotransposition (Table 1).
We next examined L1 expression in other ectodermal-derived cells, including keratinocytes (KER) and HFFs. KERs are considered multipotent embryonic progenitor cells that generate the epidermal barrier as well as hair and nail (Fuchs 2007). Despite their shared ontological origin with NPCs, both adult KERs and HFFs express low levels of endogenous L1 mRNAs, as revealed by RT-qPCR and Western-blot analyses (Fig. 2A,B; Supplemental Fig. S1D). These data were confirmed by semiquantitative RT-PCR (Supplemental Fig. S1I). Notably, when we analyzed the DNA-methylation status of L1 human-specific (L1Hs) promoters (Coufal et al. 2009; Muñoz-Lopez et al. 2012; Wissing et al. 2012), we detected hypermethylated promoters in HFFs and KERs when compared to hESCs (Supplemental Fig. S1F,G,H), consistent with L1 expression levels. Next, we used the Ad-L1 adenovirus to analyze L1 retrotransposition in KERs and HFFs. Despite efficient transduction of both cell types, we observed very low L1 retrotransposition (Fig. 2C; Supplemental Fig. S2D,E). Thus, these data reveal that not all human ectodermal multipotent cells express significant amounts of L1 mRNAs or support L1-retrotransposition (Table 1).
Figure 2.

LINE-1 retrotransposition in human KERs and foreskin fibroblasts. (A) L1Hs mRNA expression analyses by RT-qPCR following the nomenclature and method described in Figure 1B. The graph shows expression data in the indicated sample and SEM (n = 2 biological replicas; one-way ANOVA with Tukey was used, P-value 0.0025 and 0.0040). (B) Western-blot analyses of L1-ORF1p expression in the indicated cell type (above each lane). Beta actin was used as a loading control. (C) Representative retrotransposition data using the Ad-L1 vector in the indicated cell type (7 d post infection). Below the cartoon of Ad-L1, bright field images of each cell type and representative FACS histograms are shown (the percentage of EGFP-expressing cells is indicated, triplicate). Only H9-hESCs accommodated detectable levels of Ad-L1 retrotransposition.
L1 expression and engineered retrotransposition in multipotent human mesenchymal stem cells (MSCs)
To explore whether L1 expression and retrotransposition is restricted to human ectodermal NPCs, we next analyzed L1 expression and retrotransposition in mesenchymal stem cells (MSCs). In these assays, we used H9-hESC-derived MSCs (Sánchez et al. 2011) and MSCs isolated from adult sources: bone marrow (BM), umbilical cord (UC), and adipose tissues (ASC). Notably, using H9-hESCs to differentiate MSCs allowed us to compare different cell types that contain the same genetic background. All MSCs cultured had similar fibroblast-like morphology and expressed canonical markers: NT5E (also known as CD73), ENG (also known as CD105), THY1 (also known as CD90), and ALCAM (also known as CD166) and did not express PTPRC (also known as CD45), CD34, CD19, and SSEA4 (Fig. 3A; Dominici et al. 2006). Controls demonstrated the ability of hESC-derived MSCs to differentiate to adipose, osteogenic, and chondrocyte lineages, consistent with their multipotent capability (Fig. 3G; Supplemental Fig. S4H,I; Dominici et al. 2006). However, RT-qPCR and semiquantitative RT-PCR experiments revealed that all MSCs tested (despite their origin) expressed very low levels of L1 mRNAs (Fig. 3B; Supplemental Fig. S3C,D). These data were confirmed by Western-blotting, and we observed a low level of L1-ORF1p expression in hESC-derived MSCs (Fig. 3C); quantification revealed approximately fivefold less L1-ORFp when compared to H9-hESCs (Supplemental Fig. S3A,B). Notably, when we analyzed the methylation status of L1Hs promoters, we observed highly methylated L1 promoters in MSCs (Supplemental Fig. S3F,G,H), consistent with the low level of L1 mRNA expression detected. Additionally, we also explored whether human MSCs grown as mesenspheres, which allows MSCs to better preserve their immature phenotype (HSPH cells) (Isern et al. 2013), influence L1 expression. However, under our experimental conditions, RT-qPCR revealed that HSPHs express low levels of L1 mRNAs (Table 1; Supplemental Fig. S3E).
Figure 3.

LINE-1 retrotransposition in mesenchymal stem cells. (A) Representative bright field images of cultured MSCs isolated from the indicated tissue/cell type. FACS histograms acquired in pooled MSCs for NT5E, ENG, THY1, ALCAM, PTPRC, CD34, CD19, and SSEA4 are shown below. (B) L1Hs mRNA expression analyses by RT-qPCR in MSCs. The graph shows expression data in the indicated sample (n = 3 biological replicas), the SEM, and the significance of the statistical method (one-way ANOVA with Tukey, P-value < 0.0001). (C) Western-blot analyses of L1-ORF1p in the indicated cell type (above each lane). Beta actin is used as a loading control. (D) L1-retrotransposition in MSCs using Ad-L1. An image from a representative infection of MSCs with Ad-L1 and stained for beta-gal 3 d post-infection is shown. An enlarged region is also shown in the bottom-right corner. In the middle, RT-PCR analyses for EGFP and GAPDH on the indicated cell type. Cells were either infected (Ad-L1 lanes) or incubated with 1×PBS (nonlabeled lanes). The bottom panel shows a representative FACS histogram acquired from Ad-L1 infected MSCs 7 d post-infection. The percentage of EGFP-expressing cells is indicated as determined in triplicate. (E) L1Hs mRNA expression analysis in differentiating MSCs as measured by RT-qPCR (SEM is indicated; n = 2 biological replicas). Statistical method applied is one-way ANOVA with Tukey, P-value <0.0001. (F) Western-blot analyses of L1-ORF1p expression in the indicated cell type (above each lane). Beta actin was used as a loading control. (G) L1-retrotransposition in differentiating MSCs using Ad-L1. The top shows representative images of Oil Red O staining at the indicated time after the initiation of MSC differentiation. The bottom contains representative FACS histograms that indicate the percentage of EGFP-expressing (triplicate) at the indicated time.
We next analyzed L1 retrotransposition in hESC-derived MSCs using the Ad-L1. Despite efficient transduction of MSCs as revealed by beta-gal staining, we reproducibly observed a very low level of L1 retrotransposition (Fig. 3D). Additional RT-PCR controls revealed that the tagged L1 was efficiently expressed in Ad-L1 infected MSCs, but that L1 retrotransposition is very inefficient in these cells (Fig. 3D; Supplemental Fig. S4D). We confirmed these data using the PCR-intron assay (Supplemental Fig. S11G). Further experiments using plasmid 99-gfp-LRE3 confirmed efficient transfection of MSCs but inefficient L1 retrotransposition (Supplemental Figs. S3I,J, S4A–C) when compared to HeLa cells transfected in parallel (Supplemental Fig. S3K). A previous report described fast epigenetic silencing of engineered L1 insertions in human pluripotent cells (Garcia-Perez et al. 2010). However, we ruled out epigentic silencing of de novo L1 insertions in MSCs by conducting retrotransposition assays with inhibitors of histone deacetylases (IHDACs) as described (Supplemental Fig. S3I; Garcia-Perez et al. 2010). In sum, embryonic and adult multipotent MSCs express low levels of L1 mRNAs and do not accommodate efficient L1 retrotransposition (Table 1).
L1 expression and engineered retrotransposition in differentiating human MSCs
Because of their multipotent potential, we next tested whether L1 expression and retrotransposition change during MSC differentiation to osteogenic and adipogenic cell types. We confirmed robust osteogenic and adipogenic differentiation of hESC-derived MSCs (Fig. 3G; Supplemental Fig. S4H). However, we observed no significant changes on L1 expression during differentiation, and L1 expression remained very low (Fig. 3E,F; Supplemental Fig. S4E). Notably, the promoter of L1Hs elements remained hypermethylated in differentiated MSCs, consistent with L1 expression levels (Supplemental Fig. S4F,G). Similarly, when we analyzed engineered L1 retrotransposition using the Ad-L1 virus, we reproducibly detected very low levels of L1 retrotransposition during MSC differentiation to either adipogenic or osteogenic cells, despite their efficient transduction (Fig. 3G; Supplemental Fig. S4H). The intron-PCR assay confirmed lack of engineered L1 retrotransposition in differentiating MSCs (see below). In sum, pluripotent MSCs and differentiated cell types derived from MSCs are characterized for expressing low levels of endogenous L1mRNAs and L1-ORF1p and by accommodating a very low level of L1 retrotransposition (Table 1).
L1 expression and engineered retrotransposition in hematopoietic stem cells (HSCs)
We next tested L1 expression and retrotransposition in human hematopoietic stem cells (HSCs). As above, we isolated HSCs from either pluripotent H9-hESCs or from UC blood samples. We used a ficoll and magnetic anti-CD34 microbeads to isolate a homogenous population of multipotent CD34-expressing HSCs from UC blood (>85% purity as revealed by FACS analyses) (Supplemental Fig. S5A,B). As expected, multipotent CD34+-HSCs could differentiate to erythrocyte, monocyte and granulo-monocyte Colony-Forming Units (CFUs) when plated in methylcellulose (Supplemental Fig. S5B). When we analyzed L1 mRNA expression in CD34+-HSCs, we observed very low levels of L1 expression when compared to H9-hESCs and similar to those detected in HFFs (Fig. 4A), consistent with the hypermethylation status of L1Hs promoters in these cells (Fig. 4B; Supplemental Fig. S5D,E). These data were confirmed by semiquantitative RT-PCR (Supplemental Fig. S5C). Additionally, when we analyzed Ad-L1 retrotransposition, we reproducibly detected a very low level of L1 retrotransposition (Fig. 4C), despite efficient Ad-L1 transduction (Supplemental Fig. S11G). Thus, CD34+-HSCs express low levels of endogenous L1 mRNAs and support very low levels of L1 retrotransposition (Table 1).
Figure 4.

LINE-1 retrotransposition in hematopoietic stem cells. (A) L1Hs mRNA expression analysis in CD34+-HSCs cells isolated from UC blood as measured by RT-qPCR (n = 3 biological replicas). Also indicated is the P-value (0.0047, one-way ANOVA with Tukey) of the comparisons and the SEM. (B) L1Hs promoter methylation in CD34+-HSCs as measured by bisulfite-PCR assays. The graph shows the percentage of methylation detected in the indicated sample and the SEM. Also indicated is the P-value of the comparisons: P < 0.0001 or not significant (n.s.), one-way ANOVA with Tukey. (C) L1-retrotransposition in CD34-expressing HSCs using the Ad-L1 virus. Shown is a representative FACS histogram acquired 4 d post-infection. The percentage of EGFP-expressing cells is indicated within the histogram as determined in triplicate. (D) Scheme of the EB-based protocol to differentiate HSCs from hESCs. CD45+ and CD45negPFV populations are pictured using yellow and orange spheres, and black spheres are the remaining cells. (Right) FACS analysis of EBs after the differentiation protocol (PTPRC versus PECAM1). Representative images of the three identified populations are shown below. (REB) remaining cells; (white bars) 20 µm. (E) L1Hs mRNA expression analysis in CD45+ and CD45negPFV populations as measured by RT-qPCR (n = 2 biological replicas). The SEM and P-value of the comparisons (0.0138, 0.0152, one-way ANOVA with Tukey) are indicated. (F) L1-retrotransposition in CD45+ and CD45negPFV populations using Ad-L1. Shown are representative FACS histograms acquired 4 d post-infection: CD45+ (right); CD45negPFV (left). The percentage of EGFP-expressing cells is indicated within the histogram as determined in duplicate. (G) Scheme of the OP9-based protocol to differentiate HSCs from hESCs. (Right) Representative histogram (PTPRC versus PECAM1) 8 d after initiation of OP9 coculture. (H) L1-retrotransposition in the CD45negPFV population isolated using the OP9 method. Representative FACS histogram (SSC-A versus L1-EGFP) acquired 4 d post-infection. Also indicated is the percentage of EGFP-expressing cells as determined in triplicate.
To corroborate these findings, we next used H9-hESCs and two differentiation protocols to analyze L1 expression/retrotransposition in more primitive HSCs. We used an embryoid body (EB) protocol (Chadwick et al. 2003) to isolate hemogenic precursors with hemangioblast properties (CD45negPFVs population: CD34+, PTPRC [also known as CD45−], PECAM1 [also known as CD31+], CDH5 [also known as CD144+], and KDR [also known as FLK1+]) and immature HSCs (CD45+ population: CD34+, PTPRC−, and PECAM1+) (Fig. 4D; Supplemental Fig. S5F). However, we detected very low levels of L1 mRNAs in both CD45negPFVs and CD45+ populations (Fig. 4E). Notably, as observed with UC-derived CD34+-HSCs, we reproducibly detected very low levels of engineered L1 retrotransposition using the Ad-L1 virus in these cells (Table 1; Fig. 4F).
Next, we used a stroma cell-based differentiation protocol (Choi et al. 2011) and mouse OP9 BM-stromal cells to differentiate CD45negPFV and CD45+ populations from H9-hESCs (Fig. 4G; Supplemental Fig. S6A,B). However, as observed with the EB-based method, we detected a very low level of L1 mRNA expression in these cells (Supplemental Fig. S6C) and very low levels of L1 retrotransposition in CD45negPFV cells despite efficient Ad-L1 transduction (Fig. 4H). Consistently, the low level of L1 mRNA expression parallels the DNA-hypermethylation status of the L1Hs promoter in CD45negPFV and CD45+ populations (Supplemental Fig. S5G,H). Thus, different populations of human HSCs characteristically express low levels of endogenous L1 mRNAs and support a very low level of L1 retrotransposition (Table 1).
L1 expression and engineered retrotransposition in human mature neuronal cells
Because of the apparent restriction of L1 expression/retrotransposition to NPCs, we next exploited the Ad-L1 vector to analyze retrotransposition in mature neuronal cells, which are the most abundant cell type in the human brain (Tang et al. 2001). To do that, we derived mature neuronal cells from H9-hESC-derived NPCs using established protocols (Muotri et al. 2005, 2010; Coufal et al. 2009, 2011). Indeed, after 31 d of NPC differentiation, we routinely obtained a population of cells expressing pan-neuronal markers including RBFOX3 (also known as NeuN), TUBB3, MAP2, and Synapsin I (Supplemental Figs. S7A,B, S9C). With this protocol, we routinely obtained homogenous populations of mature neuronal cells expressing TUBB3 in 80%–90% of cells. We also identified minor populations of neuronal cells expressing subtype-specific markers, including TH (tyrosine hydroxylase), GABA (gamma-aminobutyric acid), and CHAT (choline acetyltransferase) (Supplemental Fig. S7B). Using terminally differentiated neuronal-enriched populations of cells, we next analyzed L1 expression and retrotransposition. Intriguingly, we reproducibly detected a moderately higher level of L1 mRNA expression in neurons (∼25% of levels detected in H9-hESCs) and slightly higher than that detected in HFFs (Fig. 5A; Supplemental Fig. S8C, reaching statistical significance). However, L1 mRNA expression levels in differentiated neuronal cells are lower than that detected in NPCs and hESCs (Figs. 1B, 5A). These data were confirmed by Western-blot analyses (Fig. 5B; Supplemental Fig. S8A). Overall, mature neuronal cells express detectable levels of L1 mRNAs and L1-ORF1p at levels moderately higher than those detected in HFFs, MSCs, and HSCs (Table 1). DNA-methylation analyses revealed that L1Hs promoters are heavily methylated in differentiated neurons (Supplemental Fig. S8D). Next, we analysed L1 retrotransposition in mature nondividing neuronal cells using Ad-L1. To do that, and because L1 retrotransposition is very efficient in undifferentiated NPCs (Fig. 1), we added 5-Bromo-2′-deoxyuridine (BrdU) to the culture media together with the Ad-L1, to confirm that retrotransposition was occurring in terminally differentiated nondividing neuronal cells (i.e., L1-EGFP-expressing cells that do not stain with anti-BrdU) (Fig. 5C). Thus, we added BrdU and Ad-L1 at different time points during the 31-d-long NPC-differentiation protocol and analyzed L1 retrotransposition by confocal microscopy using anti-BrdU and anti-EGFP antibodies and an optimized protocol (Supplemental Fig. S9A). Control microscopy analyses revealed that there was a drastic reduction in BrdU incorporation as NPCs differentiate (Supplemental Fig. S9B,D). Indeed, the rate of BrdU labeling is <0.9% at day 31 post-differentiation, and BrdU labeling is detected in low-abundant cells that do not express TUBB3 (Supplemental Fig. S9C). When NPCs were infected at day 0 of the differentiation protocol, we detected high levels of L1-EGFP/BrdU/NES-positive cells, as expected (Figs. 1, 5D, d0 panel). PCR-controls using a set of primers in the EGFP retrotransposition cassette confirmed efficient retrotransposition in NPCs infected at day 0 (Fig. 5E). When differentiated NPCs were infected at day 5, we detected fewer L1-EGFP/BrdU-positive cells; notably, L1-EGFP/BrdU-positive cells did not express the neuronal marker TUBB3 (Fig. 5D, d5 panel) and we speculate that these L1 retrotransposition events could have occurred in nondifferentiated NPCs present in the culture at the time of Ad-L1 infection. Similar data was obtained when the Ad-L1/BrdU was added at day 10 or 15 after the initiation of NPC differentiation (Supplemental Fig. S9E). When the Ad-L1/BrdU was added at day 25 or 31 post-initiation of NPC differentiation, the level of BrdU incorporation observed was <1%, and we reproducibly observed high levels of TUBB3 expressing cells; however, we failed to detect L1-EGFP expressing cells (Fig. 5D, d31 panels). Beta-gal control staining experiments revealed efficient Ad-L1 transduction in differentiating NPCs at days 0, 5, and 31 (Supplemental Fig. S8B), suggesting efficient transduction but low retrotransposition levels in nondividing mature neuronal cells. Intriguingly however, PCR assays using primers flanking the intron in the megfpI cassette revealed the presence of spliced (retrotransposition) products in NPCs infected with the Ad-L1 at day 31, suggesting ongoing L1 retrotransposition in mature neuronal cells but an inability to express the retrotransposed EGFP reporter (Fig. 5E, hESC-NPCs d31 AdL1 lane). Sanger DNA sequencing controls revealed that the amplified EGFP product at day 31 corresponded to a bona fide spliced EGFP retrotransposition product, marked by a unique engineered PvuII site in the EGFP gene.
Figure 5.

LINE-1 expression and retrotransposition in differentiating NPCs. (A) L1Hs mRNA expression analysis in differentiated NPCs (after 31 d of differentiation) as measured by RT-qPCR (n = 3 biological replicas). Also shown is the P-value (0.0004 and 0.0001, one-way ANOVA with Tukey) of the comparisons and the SEM. (B) Western-blot analyses of L1-ORF1p expression in the indicated cell type (above each lane). Beta actin was included as an internal control. (C) Rationale of the NPC differentiation Ad-L1 retrotransposition assay. A representative picture of NPCs and of mature neuronal cells is shown. At days 0, 5, 10, 15, 25, or 31, plated cells were infected with Ad-L1 in the presence of BrdU and analyzed 5–7 d later. (D) Representative results from retrotransposition assays conducted in differentiating NPCs using the Ad-L1. Each panel shows a merged image of Ad-L1 infected NPCs analyzed 5–7 d after infection and stained with an antibody against NES or TUBB3 (pink) and BrdU (red); nuclear DNA was stained with DAPI (blue) and L1-EGFP was stained with an EGFP polyclonal antibody (green). The small pictures at the left side contain the independent captured images used in the merged picture. (White bars) 10 µm in the d0 panel, and 20 µm in the d5 and d31 panels. Also indicated in each panel is the day when infection was performed (white letters on DAPI panels). (E) Results from the PCR-intron assay conducted on gDNAs isolated from Ad-L1 infected NPCs at the indicated time. In the PCR assay, gDNA isolated from pk87 cells (Garcia-Perez et al. 2010) and a vector containing the unspliced megfpI cassette (99-gfp-LRE3) were included as controls. (C- lane) PCR negative control without template.
We next tested whether lack of expression from the inserted L1-EGFP cassette in mature neuronal cells is caused by epigenetic silencing of de novo retrotransposition events (Garcia-Perez et al. 2010). However, neither treatment with IHDACs (trichostatin A, sodium butyrate, or valproic acid) at day 5 post-infection (i.e., d36 since the initiation of differentiation) or treatment with the de novo methylation inhibitor 5-azacytidine for 5 d led to reactivation of L1-EGFP expression (Supplemental Fig. S9F,G). These data suggest that de novo L1 insertions in mature neuronal cells are not silenced by histone modifications as described in pluripotent embryonic cells (Garcia-Perez et al. 2010). However, it is likely that the immediate early cytomegalovirus (CMV) promoter used to drive EGFP expression from the retrotransposed reporter in Ad-L1 (Ostertag et al. 2000; Kubo et al. 2006) fails to efficiently express EGFP in cultured mature neuronal cells, at least under our experimental conditions. Consistently, there are numerous reports suggesting that the CMV promoter is not pan-active in neuronal cells (Fritschy et al. 1996; van den Pol and Ghosh 1998), consistent with lack of L1-EGFP expression in these cells despite efficient Ad-L1 retrotransposition. To test this hypothesis, we generated plasmid DNA 99-gfp-LRE3-UB* containing an RC-L1 (LRE3) (Brouha et al. 2002) tagged with a modified megfpI cassette, where the CMV promoter that drives EGFP expression was replaced by a ubiquitously expressed human UBC promoter (Fig. 6A). Notably, the UBC promoter used in this construct is characterized for its enrichment in acetylated H3K27. Controls in HeLa revealed efficient engineered L1 retrotransposition with plasmid 99-gfp-LRE3-UB* (Supplemental Fig. S10A,B). Next, we used either nucleofection or a calcium-based protocol (Methods) to transfect plasmid 99-gfp-LRE3-UB* in differentiating NPCs at day 31, in the presence of BrdU. Remarkably, and despite reduced efficiency of transfection in neuronal cells at day 31, we readily detected cells expressing mature neuronal markers (MAP2 or TUBB3) and the L1-EGFP retrotransposed cassette (i.e., L1-EGFP), but that did not stain positive for BrdU, suggesting efficient engineered L1 retrotransposition in nondividing mature neuronal cells (Fig. 6A; Supplemental Fig. S10C). Additional controls confirmed specificity of the staining and lack of retrotransposition from an allelic mutant L1 construct (RR261/62AA mutation, plasmid 99-gfp-JM111-UB*) in nondividing mature neurons (Supplemental Fig. S10D,E). To further confirm these findings, transfected hESC-NPCs-d31 cells were analyzed using the PCR intron assay (Ostertag et al. 2000). Notably, we observed amplification of a product corresponding to the transfected vector in all samples, that is, cells transfected with an active (99-gfp-LRE3-UB*) or inactive (99-gfp-JM111-UB*) L1 construct; importantly, we only amplified the spliced EGFP (i.e., retrotransposition product) in neurons transfected with the active LINE-1 and not in cells transfected with the inactive allelic LINE-1 (Supplemental Fig. S10F). As expected, similar results were observed in transfected hESC-NPCs at day 0 (Supplemental Fig. S10G). In sum, these data reveal that engineered human L1s driven from their own promoter can efficiently retrotranspose in mature nondiving neuronal cells (Table 1).
Figure 6.

Efficient LINE-1 retrotransposition in differentiating NPCs. (A) Scheme of plasmid 99-gfp-LRE3-UB* and of DNA transfection-based experiments conducted in differentiating NPCs. (Below) Representative image of differentiating NPCs transfected at day 31 in the presence of BrdU and stained with L1-EGFP (green), MAP2 (pink), and BrdU (red); nuclear DNA was stained with DAPI (blue). The small pictures at the left side contain the independent captured images used in the merged picture. A white arrow marks a MAP2/L1-EGFP single cell that stains negative for BrdU. (White bar) 50 µm. (B) L1-EGFP copy number quantification in differentiating NPCs infected at the indicated time. The graph shows the normalized number of L1-EGFP sequences detected (L1 insertions) and has been corrected with infection efficiency values (using beta gal qPCR data) and for cell proliferation values. The P-value of the comparison (0.0027) and the SEM are also indicated. (C) Rationale of the RBFOX3 sorting-based assay. Differentiated NPCs (at day 31) were infected with the Ad-L1, and 5 d later RBFOX3-expressing cells were FACS-sorted and gDNA isolated. (Right) Representative FACS histogram plots of cells incubated (bottom) or not (top) with the anti-RBFOX3 antibody. (D) Results from the PCR-intron assay conducted on gDNAs isolated from Ad-L1 infected NPCs at day 31 and FACS-sorted (using a RBFOX3 antibody) 5 d after the infection. gDNA isolated from unsorted infected differentiated NPCs and infected HeLa cells were used as controls in these assays. (C- lane) PCR negative control without template. (E) L1-EGFP copy number quantification in differentiated Ad-L1 infected NPCs sorted for RBFOX3 expression. The graph shows normalized L1 insertions (i.e., the number of L1-EGFP sequences detected); for comparison, the value obtained in unsorted Ad-L1 infected hESC-NPCs at day d31 post-differentiation was designated 1. (n.s.) not significant. The SEM is also shown. In B and E, an unpaired Student's t-test was applied.
Efficient engineered L1 retrotransposition in human mature neuronal cells
Because of the toxicity of mature neuronal cells upon DNA-transfection and in order to quantify the level of engineered L1 retrotransposition, we next used the Ad-L1 and a specific set of qPCR primers to the spliced EGFP retrotransposed reporter cassette (retrotransposition product) (Del Re et al. 2010) to calculate the efficiency of retrotransposition in neurons. Additionally, we designed and validated qPCR primers for beta-gal, allowing us to calculate the number of EGFP insertions per infected cell (Supplemental Fig. S11A). As a copy number control in qPCRs, we used a previously characterized cell line containing two L1-EGFP insertions (pk87 cells) (Supplemental Fig. S11B; Garcia-Perez et al. 2010). Using qPCR, we determined that the copy number of L1-EGFP sequences accumulated in HeLa cells is ∼10-fold higher than in NPCs, at least using the Ad-L1 (Supplemental Fig. S11C–E). Additionally, we further validated and used this qPCR assay to confirm that engineered L1 retrotransposition is extremely low in Ad-L1 infected HSCs and MSCs (Table 1; Supplemental Fig. S11G,I).
We next compared the number of L1-EGFP insertions detected in differentiating NPCs that were infected at day 0 (i.e., multipotent NPCs) and at day 31 (i.e., mature neuronal cells). We also measured the proliferation values of differentiating NPCs at days 0 and 31 to control for different cell division rates, which could lead to amplification of L1-EGFP insertions in dividing cells (Supplemental Fig. S11F,H). Thus, we used proliferation values to correct the accumulated number of L1-EGFP sequences in each cell type. Remarkably, we observed that the amount of L1-EGFP copies detected in mature neuronal cells was approximately sixfold higher than in multipotent NPCs (Fig. 6B), suggesting very efficient engineered L1 retrotransposition, or more insertions per cell, in differentiated NPCs infected at day 31.
Next, and to rule out that a fraction of detected L1-EGFP sequences corresponded to L1 retrotransposition events accumulated in non-neuronal cells (i.e., low abundant cells present in the differentiating NPC culture at day 31), we isolated RBFOX3-expressing cells by FACS-sorting and then conducted the qPCR (Fig. 6C). Briefly, differentiated NPCs at day 31 were infected with the Ad-L1, and 4 d later mature neuronal cells were FACS-sorted using RBFOX3, a marker of mature post-mitotic neurons. Consistently, >80% of cells expressed RBFOX3 at day 35 after initiation of NPC differentiation (Fig. 6C). Next, the qPCR was done on genomic DNAs isolated from RBFOX3-sorted cells. Control PCRs indicated efficient L1 retrotransposition in RBFOX3-sorted cells (Fig. 6D) and qPCR revealed that the copy number of L1-EGFP in RBFOX3-sorted cells is almost identical to the level detected in nonsorted cells (Fig. 6E). These data suggest that the majority of L1-EGFP sequences (i.e., retrotransposition) accumulate in RBFOX3-expressing cells. In sum, these data indicate that L1 retrotransposition is very efficient in RBFOX3-expressing mature neuronal cells.
Discussion
In this study, we have compared L1 expression and engineered L1 retrotransposition among different human cell types differentiated from the same hESC line (H9), ensuring that all cell types analyzed have the same genetic background. Additionally, we have further explored L1 expression and retrotransposition in KERs, HFFs, MSCs, and HSCs derived from adult sources (Table 1). Finally, we have exploited a helper adenovirus-based vector (Ad-L1) to overcome inherent limitations to DNA-transfection experiments (Villa-Diaz et al. 2010). Indeed, the Ad-L1 system allows introduction of the L1-reporter into cultured cells by infection, solving difficulties in transfecting different cell types (Kubo et al. 2006). Using this design, our data indicate that the somatic retrotransposition of L1s is not a generic property of all somatic stem cell types of the human body. On the contrary, our data suggest that L1 expression and the capability to support L1 retrotransposition is restricted to a minor population of neuronal cells with multipotent characteristics. Indeed, these data are in agreement with previous reports that analyzed L1 expression in several somatic human tissues, revealing detectable but low L1 expression in stomach, esophagus, prostate, and heart muscle, whereas expression in the adrenal gland, kidney, spleen, and cervix was below the detection limit (Faulkner et al. 2009; Belancio et al. 2010). Regarding expression of L1 mRNAs, we have observed a very good correlation between the DNA-methylation status of the L1Hs promoter and the expression level of L1 mRNAs detected, consistent with DNA-methylation being a main host factor restricting human retrotransposition in somatic cells (Bestor 2003; Coufal et al. 2009). Using the Ad-L1 as well as conventional plasmid-based retrotransposition assays, we have demonstrated that L1 retrotransposition is very low in KERs, HFFs, MSCs, and HSCs when compared with isogenic NPCs. Our data further demonstrated that de novo L1 insertions in KERs, HFFs, MSCs, and HSCs are not strongly silenced by histone modifications as described for human embryonic carcinoma cells (Garcia-Perez et al. 2010). Conventional intron-PCR assays, as well as a qPCR-based assay that quantify infected cells (beta-gal copy number) and L1 insertions (spliced EGFP copy number), have further demonstrated that retrotransposition is extremely low in MSCs and HSCs when compared with isogenic NPCs. Although we do not know why we observed very low L1 retrotransposition in KERs, HFFs, MSCs, and HSCs compared with NPCs, we speculate that differential expression of host factors that are required for efficient retrotransposition (Goodier et al. 2013; Taylor et al. 2013; Moldovan and Moran 2015) may explain the observed differences in retrotransposition rates among cells. However, recent data acquired on human tumors suggest that selected somatic tissues may normally tolerate a low level of somatic LINE-1 retrotransposition, as recently described in normal gastrointestinal tissues (Ewing et al. 2015). Indeed, it is also possible that the differential expression of restriction factors may affect the rate of L1 retrotransposition in a defined cell type. Intriguingly, exploiting publicly available RNA-seq data from ENCODE (The ENCODE Project Consortium 2012) revealed that HSCs express threefold more APOBEC3A mRNA than hESC-derived NPCs (Supplemental Fig. S12); as APOBEC3A is known to inhibit LINE-1, we speculate that APOBEC3A expression in HSCs might explain the low level of LINE-1 retrotransposition detected in HSCs (Table 1). However, we also observed that the difference in gene expression for APOBEC3A among HSCs and hESCs is not statistically significant, suggesting that additional host factors might influence and regulate LINE-1 retrotransposition in HSCs. Clearly, future studies are required to distinguish between these possibilities.
We have additionally tested L1 expression and engineered L1 retrotransposition in mature neuronal cells, which are orders of magnitude more abundant than NPCs in the human brain. Notably, our data demonstrate that engineered L1 retrotransposition can take place in nondividing mature neuronal cells. The use of the beta-gal/EGFP qPCR assay strongly suggests that retrotransposition in mature nondividing neuronal cells might be even more efficient than in NPCs. There are, however, caveats to these calculations because we are (1) comparing dividing cells versus nondividing cells, and (2) using a plasmid-based reporter system to quantify number of insertions. Thus, our rate of engineered L1 retrotransposition in mature neuronal cells might not be an absolute number. However, the rate of engineered L1 retrotransposition in mature neuronal cells detected in this study suggests that retrotransposition in the human brain might be much more abundant than previously anticipated (Evrony et al. 2012; Erwin et al. 2016). Indeed, our in vitro data is in agreement with a recent study in which genomic mosaicism due to retrotransposition in the human brain was explored at the single-cell level (Upton et al. 2015).
In sum, here we demonstrate that retrotransposition can occur with high efficiency in mature neuronal cells. However, it remains to be determined whether all mature neuronal cell types have the same capability to support L1 retrotransposition or whether aging affects the rate of endogenous L1 retrotransposition in neurons. Indeed, we speculate that L1 retrotransposition might be very efficient in the human brain, raising the possibility that each neuronal cell in our brain may contain a unique genome, characterized by its own unique set of retrotransposon somatic insertions. This concept has implications for both the development of neuronal plasticity and brain pathology. We further speculate that misregulation of L1 expression, already elevated in the brain, could be influenced by natural polymorphisms on host restriction factors, and this could alter the impact of retrotransposon-induced changes in neuronal genomes, and maybe the possibility of developing a neurological disorder.
Methods
Cell-line culturing
Standard procedures were used to culture and derivate all cellular types used in this study (for a detailed description, see Supplemental Methods).
Neuronal, mesenchymal, and hematopoietic differentiation assays
NPCs, MSCs, and HSCs were obtained from H9-hESCs using established methods (Chadwick et al. 2003; Wang 2006; Wang et al. 2006; Vodyanik and Slukvin 2007; Ji et al. 2008; Coufal et al. 2009; Raya et al. 2009; Muotri et al. 2010; Choi et al. 2011; Sánchez et al. 2011). See Supplemental Methods for additional details and quality controls used to confirm the identity of derived somatic cells.
Plasmid constructs
All plasmids used in this study have been previously described (Alisch et al. 2006; Garcia-Perez et al. 2007, 2010; Coufal et al. 2009; Richardson et al. 2014b) except: (1) p99-gfp-LRE3-UB* that is a derivative of plasmid p99-gfp-LRE3, in which the CMV promoter that drives expression of EGFP in the megfpI cassette has been replaced by the human UBC promoter (nucleotides 125398319–125399530 of human Chromosome 12); and (2) p99-gfp-JM111-UB* that is a derivative of plasmid p99-gfp-JM111, in which the CMV promoter that drives expression of EGFP in the megfpI cassette has been replaced by the human UBC promoter (nucleotides 125398319–125399530 of human Chromosome 12).
Transfection of cultured cells and retrotransposition assays using plasmids
Retrotransposition assays in HeLa-JVM cells were conducted as described (Wei et al. 2000). H9-hESCs, MSCs, hESC-derived MSCs, hESC-derived NPCs, MSCs, and HFFs were transfected by Nucleofection (Amaxa) as previously described (Garcia-Perez et al. 2007; Coufal et al. 2009; Wissing et al. 2012). hESC-derived neurons were transfected using the AD1 Primary Cell 4D-Nucleofector Y Kit (Lonza) and program EH-158. Briefly, 1 × 10⁵ hESC-derived NPCs were differentiated during 31 d (Coufal et al. 2009; Muotri et al. 2010); next, adhered mature neuronal cells were transfected with 15 µg of the indicated plasmid using nucleofection in the presence of 4 µM BrdU (Sigma). After transfection, hESC-derived neurons were fed with a 1:1 mixture of the collected NB-conditioned media and fresh NB media supplemented with 10 µM iRock (Y-27632, Sisma) and 4 µM BrdU during 5 d. L1-EGFP-expression was next monitored by immunostaining. Additional transfection experiments of hESC-derived neurons were conducted using a CalPhos Mammalian Transfection Kit (Clontech) and following the manufacturer's instructions using 1 µg of each plasmid DNA in 24-well tissue culture plates containing differentiated neurons at day 31.
Ad-L1 construct, virus preparation, and transduction of cultured cells
The helper-dependent adenovirus construct A/RT-pgk-L1RP-EGFP has been previously described (Soifer et al. 2001; Kubo et al. 2006) and was prepared as described (Kubo et al. 2006; Palmer and Ng 2008). All cell types were transduced as described (Kubo et al. 2006). In this study, we used three batches of Ad-L1, averaging ∼7.6 × 10¹² viral particles/mL.
Immunocytochemistry analyses
Immunocytochemistry assays were conducted as described (Garcia-Perez et al. 2007; Coufal et al. 2009; Wissing et al. 2012), and slides were imaged using a Zeiss LSM-710 confocal microscope (Leica) unless otherwise indicated. In experiments conducted with BrdU, we first stained with the indicated antibody and then conducted the BrdU labeling. Antibodies and dilutions used can be found in the Supplemental Methods.
Fluorescence-activated cell-sorting analyses of RBFOX3-expressing cells
FACS sorting assays were conducted as previously described (Upton et al. 2015), 31 d after initiation of NPC differentiation.
Genomic DNA isolation, conventional PCR, and quantitative PCR assays
We used standard procedures to isolate DNA and for conventional PCRs. qPCRs were performed using a StepOne Real-Time PCR System (Applied Biosystems) and GoTaq qPCR MasterMix (Promega). Quantitative PCR reactions were carried out using 40 ng of genomic DNA. To minimize calculation errors, in each qPCR, we determined the copy number of the 5S ribosomal RNA gene because there are 47 copies in the human genome (Muotri et al. 2010). To calculate the copy number of L1-EGFP sequences, we validated and used qPCR primers from Giorgi et al. (2011); in calculations, we considered that a normal dipliod cell contains 6.6 pg of gDNA (Coufal et al. 2009). Results are shown as the number of L1-EGFP copies per every 100 cells. To compare insertion rates between different samples, we normalized L1-EGFP copy number values obtained with qPCR primers directed to the SV40 sequence present in all DNA constructs (in plasmid transfection experiments) or to the beta-gal sequence (in Ad-L1 transduction experiments). Primers used are listed in Supplemental Table S1.
RNA extraction and LINE-1 expression analyses by RT-qPCR and semiquantitative RT-PCR
Standard procedures were used to isolate RNA, and RT-qPCRs were conducted as described (Muñoz-Lopez et al. 2012). In semiquantitative RT-PCR experiments, we used a previously described protocol (Garcia-Perez et al. 2007).
Whole-cell extract (WCE) and ribonucleoprotein particle (RNP) isolation and Western-blot analyses
Whole-cell extracts (WCE) or L1-ribonucleoprotein particle (RNP) preparations derived from the indicated cell type were prepared as described (Garcia-Perez et al. 2007, 2010; Muñoz-Lopez et al. 2012). Antibodies and dilutions used can be found in the Supplemental Methods.
L1 promoter methylation studies
Bisulfite analyses were performed as previously described (Coufal et al. 2009; Muñoz-Lopez et al. 2012; Wissing et al. 2012).
Cell proliferation analyses
To quantify cell proliferation in NPCs during neuronal differentiation, 30 randomly captured fields were acquired at days 0, 15, and 31. BrdU positive cells were quantified and normalized to DAPI staining.
Gene expression analyses using ENCODE data
Using ENCODE data (The ENCODE Project Consortium 2012), we analyzed expression of host factors known to interact (Goodier et al. 2013; Taylor et al. 2013; Moldovan and Moran 2015) or to regulate LINE-1 retrotranspositon (Beck et al. 2011; Richardson et al. 2014a,b; Goodier 2016) in fibroblasts, HSCs H7-hESCs, MSCs, and NPCs derived from H9-hESCs. Sequencing data used are available under accession numbers ENCSR000CUH, ENCSR000CUA, ENCSR490SQH, ENCSR000CTZ, and ENCSR244ISQ. Briefly, we explored gene expression differences and selected those genes whose expression levels were significantly changed (Rapaport et al. 2013).
Statistical analyses
Ordinary one-way ANOVA was used to compare three or more groups. The Tukey method was used for post-test analysis. Student's t-test was applied to compare two groups. P < 0.05 was considered significant in all analyses.
Data access
Bisulfite Sanger sequencing traces from this study have been submitted to the NCBI GenBank (https://www.ncbi.nlm.nih.gov/genbank/) under the following accession numbers: H9-hESCs (KY120517–KY120529), MSCs (KY120530–KY120546 and KY120585–KY120598), MSCs differentiated to osteogenic cells at day 8 (KY120547–KY120566) and 15 (KY120567–KY120584), MSCs differentiated to adipose cells at day 10 (KY120599–KY120620) and 21 (KY120621–KY120632), UC-derived CD34+HSCs (KY120633–KY120650), HFFs (KY120651–KY120670), hESC-derived CD45+ HSCs (OP9 method, KY120671–KY120688), hESC-derived CD45negPFV HSCs (OP9 method, KY120689–KY120706), KER (KY120707–KY120718), and hESC-derived NPCs differentiated at day 31 (KY120719–KY120734).
Supplementary Material
Acknowledgments
We thank current members of the J.L.G.-P. laboratory for helpful discussions. We also thank Drs. Geoffrey Faulkner (Mater Research, Australia) and John V. Moran (University of Michigan) for sharing unpublished data and for critical input during the project; Ms. Raquel Marrero (Microscopy Unit, Genyo) for technical support; Simon Mendez-Ferrer (CNIC, Spain) for providing total RNA isolated from human mesenspheres; Dr. Oliver Weichenrieder (Max-Planck, Tubingen, Germany) for providing a polyclonal L1-ORF1p antibody; and Dr. Aurelien Doucet (IRCAN, Nice, France) for providing a plasmid containing an UBC-driven EGFP retrotransposition indicator cassette. J.L.G. was funded by the US Department of Defense, Breast Cancer Research Program (award #BC051386), the National Institutes of Health (NIH) National Institute of Neurological Disorders and Stroke (1R03NS087290-01), and the ALS Therapy Alliance (2013-F-067). A.M. has been partially funded by a Marie Curie IRG project (FP7-PEOPLE-2007-4-3-IRG: SOMATIC LINE-1). J.L.G.-P's laboratory is supported by CICE-FEDER-P09-CTS-4980, CICE-FEDER-P12-CTS-2256, Plan Nacional de I+D+I 2008–2011 and 2013–2016 (FIS-FEDER-PI11/01489 and FIS-FEDER-PI14/02152), PCIN-2014-115-ERA-NET NEURON II, the European Research Council (ERC-Consolidator ERC-STG-2012-233764), by an International Early Career Scientist grant from the Howard Hughes Medical Institute (IECS-55007420), and by The Wellcome Trust–University of Edinburgh Institutional Strategic Support Fund (ISFF2).
Author contributions: A.M. and J.L.G.-P. directed, designed, and performed experiments with the help of L.S., T.J.W., S.R.H., M.B.-B., S.A.-C., M.M.-L., E.B.-J. and V.A. A.R.M., P.M., and J.G.-C. provided expertise in Neural, Hematopoietic, and Mesenchymal Cell culturing/manipulation, respectively. J.L.G. and P.N. provided adenoviral samples, and J.L.G. provided valuable input throughout the project. All authors commented on or contributed to the final manuscript.
Footnotes
[Supplemental material is available for this article.]
Article published online before print. Article, supplemental material, and publication date are at http://www.genome.org/cgi/doi/10.1101/gr.206805.116.
References
- Aasen T, Raya A, Barrero MJ, Garreta E, Consiglio A, Gonzalez F, Vassena R, Bilić J, Pekarik V, Tiscornia G, et al. 2008. Efficient and rapid generation of induced pluripotent stem cells from human keratinocytes. Nat Biotechnol 26: 1276–1284. [DOI] [PubMed] [Google Scholar]
- Alisch RS, Garcia-Perez JL, Muotri AR, Gage FH, Moran JV. 2006. Unconventional translation of mammalian LINE-1 retrotransposons. Genes Dev 20: 210–224. [DOI] [PMC free article] [PubMed] [Google Scholar]
- Baillie JK, Barnett MW, Upton KR, Gerhardt DJ, Richmond TA, De Sapio F, Brennan PM, Rizzu P, Smith S, Fell M, et al. 2011. Somatic retrotransposition alters the genetic landscape of the human brain. Nature 479: 534–537. [DOI] [PMC free article] [PubMed] [Google Scholar]
- Beck CR, Collier P, Macfarlane C, Malig M, Kidd JM, Eichler EE, Badge RM, Moran JV. 2010. LINE-1 retrotransposition activity in human genomes. Cell 141: 1159–1170. [DOI] [PMC free article] [PubMed] [Google Scholar]
- Beck CR, Garcia-Perez JL, Badge RM, Moran JV. 2011. LINE-1 elements in structural variation and disease. Annu Rev Genomics Hum Genet 12: 187–215. [DOI] [PMC free article] [PubMed] [Google Scholar]
- Belancio VP, Roy-Engel AM, Pochampally RR, Deininger P. 2010. Somatic expression of LINE-1 elements in human tissues. Nucleic Acids Res 38: 3909–3922. [DOI] [PMC free article] [PubMed] [Google Scholar]
- Bestor TH. 2003. Cytosine methylation mediates sexual conflict. Trends Genet 19: 185–190. [DOI] [PubMed] [Google Scholar]
- Brouha B, Meischl C, Ostertag E, de Boer M, Zhang Y, Neijens H, Roos D, Kazazian HH Jr. 2002. Evidence consistent with human L1 retrotransposition in maternal meiosis I. Am J Hum Genet 71: 327–336. [DOI] [PMC free article] [PubMed] [Google Scholar]
- Brouha B, Schustak J, Badge RM, Lutz-Prigge S, Farley AH, Moran JV, Kazazian HH Jr. 2003. Hot L1s account for the bulk of retrotransposition in the human population. Proc Natl Acad Sci 100: 5280–5285. [DOI] [PMC free article] [PubMed] [Google Scholar]
- Carreira PE, Richardson SR, Faulkner GJ. 2013. L1 retrotransposons, cancer stem cells and oncogenesis. FEBS J 281: 63–73. [DOI] [PMC free article] [PubMed] [Google Scholar]
- Chadwick K, Wang L, Li L, Menendez P, Murdoch B, Rouleau A, Bhatia M. 2003. Cytokines and BMP-4 promote hematopoietic differentiation of human embryonic stem cells. Blood 102: 906–915. [DOI] [PubMed] [Google Scholar]
- Choi KD, Vodyanik M, Slukvin II. 2011. Hematopoietic differentiation and production of mature myeloid cells from human pluripotent stem cells. Nat Protoc 6: 296–313. [DOI] [PMC free article] [PubMed] [Google Scholar]
- Coufal NG, Garcia-Perez JL, Peng GE, Yeo GW, Mu Y, Lovci MT, Morell M, O'Shea KS, Moran JV, Gage FH. 2009. L1 retrotransposition in human neural progenitor cells. Nature 460: 1127–1131. [DOI] [PMC free article] [PubMed] [Google Scholar]
- Coufal NG, Garcia-Perez JL, Peng GE, Marchetto MC, Muotri AR, Mu Y, Carson CT, Macia A, Moran JV, Gage FH. 2011. Ataxia telangiectasia mutated (ATM) modulates long interspersed element-1 (L1) retrotransposition in human neural stem cells. Nat Protoc 108: 20382–20387. [DOI] [PMC free article] [PubMed] [Google Scholar]
- de Koning AP, Gu W, Castoe TA, Batzer MA, Pollock DD. 2011. Repetitive elements may comprise over two-thirds of the human genome. PLoS Genet 7: e1002384. [DOI] [PMC free article] [PubMed] [Google Scholar]
- Del Re B, Marcantonio P, Capri M, Giorgi G. 2010. Evaluation of LINE-1 mobility in neuroblastoma cells by in vitro retrotransposition reporter assay: FACS analysis can detect only the tip of the iceberg of the inserted L1 elements. Exp Cell Res 316: 3358–3367. [DOI] [PubMed] [Google Scholar]
- Dmitriev SE, Andreev DE, Terenin IM, Olovnikov IA, Prassolov VS, Merrick WC, Shatsky IN. 2007. Efficient translation initiation directed by the 900-nucleotide-long and GC-rich 5′ untranslated region of the human retrotransposon LINE-1 mRNA is strictly cap dependent rather than internal ribosome entry site mediated. Mol Cell Biol 27: 4685–4697. [DOI] [PMC free article] [PubMed] [Google Scholar]
- Dominici M, Le Blanc K, Mueller I, Slaper-Cortenbach I, Marini F, Krause D, Deans R, Keating A, Prockop D, Horwitz E. 2006. Minimal criteria for defining multipotent mesenchymal stromal cells. The International Society for Cellular Therapy position statement. Cytotherapy 8: 315–317. [DOI] [PubMed] [Google Scholar]
- The ENCODE Project Consortium. 2012. An integrated encyclopedia of DNA elements in the human genome. Nature 489: 57–74. [DOI] [PMC free article] [PubMed] [Google Scholar]
- Erwin JA, Paquola AC, Singer T, Gallina I, Novotny M, Quayle C, Bedrosian TA, Alves FI, Butcher CR, Herdy JR, et al. 2016. L1-associated genomic regions are deleted in somatic cells of the healthy human brain. Nat Neurosci 19: 1583–1591. [DOI] [PMC free article] [PubMed] [Google Scholar]
- Evrony GD, Cai X, Lee E, Hills LB, Elhosary PC, Lehmann HS, Parker JJ, Atabay KD, Gilmore EC, Poduri A, et al. 2012. Single-neuron sequencing analysis of L1 retrotransposition and somatic mutation in the human brain. Cell 151: 483–496. [DOI] [PMC free article] [PubMed] [Google Scholar]
- Ewing AD, Gacita A, Wood LD, Ma F, Xing D, Kim MS, Manda SS, Abril G, Pereira G, Makohon-Moore A, et al. 2015. Widespread somatic L1 retrotransposition occurs early during gastrointestinal cancer evolution. Genome Res 25: 1536–1545. [DOI] [PMC free article] [PubMed] [Google Scholar]
- Faulkner GJ, Kimura Y, Daub CO, Wani S, Plessy C, Irvine KM, Schroder K, Cloonan N, Steptoe AL, Lassmann T, et al. 2009. The regulated retrotransposon transcriptome of mammalian cells. Nat Genet 41: 563–571. [DOI] [PubMed] [Google Scholar]
- Feng Q, Moran JV, Kazazian HH Jr, Boeke JD. 1996. Human L1 retrotransposon encodes a conserved endonuclease required for retrotransposition. Cell 87: 905–916. [DOI] [PubMed] [Google Scholar]
- Fritschy JM, Brandner S, Aguzzi A, Koedood M, Luscher B, Mitchell PJ. 1996. Brain cell type specificity and gliosis-induced activation of the human cytomegalovirus immediate-early promoter in transgenic mice. J Neurosci 16: 2275–2282. [DOI] [PMC free article] [PubMed] [Google Scholar]
- Fuchs E. 2007. Scratching the surface of skin development. Nature 445: 834–842. [DOI] [PMC free article] [PubMed] [Google Scholar]
- Garcia-Perez JL, Marchetto MC, Muotri AR, Coufal NG, Gage FH, O'Shea KS, Moran JV. 2007. LINE-1 retrotransposition in human embryonic stem cells. Hum Mol Genet 16: 1569–1577. [DOI] [PubMed] [Google Scholar]
- Garcia-Perez JL, Morell M, Scheys JO, Kulpa DA, Morell S, Carter CC, Hammer GD, Collins KL, O'Shea KS, Menendez P, et al. 2010. Epigenetic silencing of engineered L1 retrotransposition events in human embryonic carcinoma cells. Nature 466: 769–773. [DOI] [PMC free article] [PubMed] [Google Scholar]
- Giorgi G, Marcantonio P, Del Re B. 2011. LINE-1 retrotransposition in human neuroblastoma cells is affected by oxidative stress. Cell Tissue Res 346: 383–391. [DOI] [PubMed] [Google Scholar]
- Goodier JL. 2016. Restricting retrotransposons: a review. Mobile DNA 7: 16. [DOI] [PMC free article] [PubMed] [Google Scholar]
- Goodier JL, Cheung LE, Kazazian HH Jr. 2013. Mapping the LINE1 ORF1 protein interactome reveals associated inhibitors of human retrotransposition. Nucleic Acids Res 41: 7401–7419. [DOI] [PMC free article] [PubMed] [Google Scholar]
- Griesi-Oliveira K, Acab A, Gupta AR, Sunaga DY, Chailangkarn T, Nicol X, Nunez Y, Walker MF, Murdoch JD, Sanders SJ, et al. 2015. Modeling non-syndromic autism and the impact of TRPC6 disruption in human neurons. Mol Psychiatry 20: 1350–1365. [DOI] [PMC free article] [PubMed] [Google Scholar]
- Hancks DC, Kazazian HH Jr. 2012. Active human retrotransposons: variation and disease. Curr Opin Genet Dev 22: 191–203. [DOI] [PMC free article] [PubMed] [Google Scholar]
- Hohjoh H, Singer MF. 1996. Cytoplasmic ribonucleoprotein complexes containing human LINE-1 protein and RNA. EMBO J 15: 630–639. [PMC free article] [PubMed] [Google Scholar]
- Hohjoh H, Singer MF. 1997. Sequence-specific single-strand RNA binding protein encoded by the human LINE-1 retrotransposon. EMBO J 16: 6034–6043. [DOI] [PMC free article] [PubMed] [Google Scholar]
- International Human Genome Sequencing Consortium. 2001. Initial sequencing and analysis of the human genome. Nature 409: 860–921. [DOI] [PubMed] [Google Scholar]
- Isern J, Martín-Antonio B, Ghazanfari R, Martín AM, López JA, del Toro R, Sánchez-Aguilera A, Arranz L, Martín-Pérez D, Suárez-Lledó M, et al. 2013. Self-renewing human bone marrow mesenspheres promote hematopoietic stem cell expansion. Cell Rep 3: 1714–1724. [DOI] [PubMed] [Google Scholar]
- Ji J, Vijayaragavan K, Bosse M, Menendez P, Weisel K, Bhatia M. 2008. OP9 stroma augments survival of hematopoietic precursors and progenitors during hematopoietic differentiation from human embryonic stem cells. Stem Cells 26: 2485–2495. [DOI] [PubMed] [Google Scholar]
- Kano H, Godoy I, Courtney C, Vetter MR, Gerton GL, Ostertag EM, Kazazian HH Jr. 2009. L1 retrotransposition occurs mainly in embryogenesis and creates somatic mosaicism. Genes Dev 23: 1303–1312. [DOI] [PMC free article] [PubMed] [Google Scholar]
- Khazina E, Weichenrieder O. 2009. Non-LTR retrotransposons encode noncanonical RRM domains in their first open reading frame. Proc Natl Acad Sci 106: 731–736. [DOI] [PMC free article] [PubMed] [Google Scholar]
- Kimberland ML, Divoky V, Prchal J, Schwahn U, Berger W, Kazazian HH Jr. 1999. Full-length human L1 insertions retain the capacity for high frequency retrotransposition in cultured cells. Hum Mol Genet 8: 1557–1560. [DOI] [PubMed] [Google Scholar]
- Klawitter S, Fuchs NV, Upton KR, Muñoz-Lopez M, Shukla R, Wang J, Garcia-Cañadas M, Lopez-Ruiz C, Gerhardt DJ, Sebe A, et al. 2016. Reprogramming triggers endogenous L1 and Alu retrotransposition in human induced pluripotent stem cells. Nat Commun 7: 10286. [DOI] [PMC free article] [PubMed] [Google Scholar]
- Kubo S, Seleme MC, Soifer HS, Perez JL, Moran JV, Kazazian HH Jr, Kasahara N. 2006. L1 retrotransposition in nondividing and primary human somatic cells. Proc Natl Acad Sci 103: 8036–8041. [DOI] [PMC free article] [PubMed] [Google Scholar]
- Luan DD, Korman MH, Jakubczak JL, Eickbush TH. 1993. Reverse transcription of R2Bm RNA is primed by a nick at the chromosomal target site: a mechanism for non-LTR retrotransposition. Cell 72: 595–605. [DOI] [PubMed] [Google Scholar]
- Martin SL, Bushman FD. 2001. Nucleic acid chaperone activity of the ORF1 protein from the mouse LINE-1 retrotransposon. Mol Cell Biol 21: 467–475. [DOI] [PMC free article] [PubMed] [Google Scholar]
- Mathias SL, Scott AF, Kazazian HH Jr, Boeke JD, Gabriel A. 1991. Reverse transcriptase encoded by a human transposable element. Science 254: 1808–1810. [DOI] [PubMed] [Google Scholar]
- Mills RE, Bennett EA, Iskow RC, Devine SE. 2007. Which transposable elements are active in the human genome? Trends Genet 23: 183–191. [DOI] [PubMed] [Google Scholar]
- Moldovan JB, Moran JV. 2015. The zinc-finger antiviral protein ZAP inhibits LINE and alu retrotransposition. PLoS Genet 11: e1005121. [DOI] [PMC free article] [PubMed] [Google Scholar]
- Montes R, Ayllón V, Gutierrez-Aranda I, Prat I, Hernández-Lamas MC, Ponce L, Bresolin S, Te Kronnie G, Greaves M, Bueno C, et al. 2011. Enforced expression of MLL-AF4 fusion in cord blood CD34+ cells enhances the hematopoietic repopulating cell function and clonogenic potential but is not sufficient to initiate leukemia. Blood 117: 4746–4758. [DOI] [PubMed] [Google Scholar]
- Moran JV, Holmes SE, Naas TP, DeBerardinis RJ, Boeke JD, Kazazian HH Jr. 1996. High frequency retrotransposition in cultured mammalian cells. Cell 87: 917–927. [DOI] [PubMed] [Google Scholar]
- Muñoz-Lopez M, Garcia-Cañadas M, Macia A, Morell S, Garcia-Perez JL. 2012. Analysis of LINE-1 expression in human pluripotent cells. Methods Mol Biol 873: 113–125. [DOI] [PubMed] [Google Scholar]
- Muotri AR, Chu VT, Marchetto MC, Deng W, Moran JV, Gage FH. 2005. Somatic mosaicism in neuronal precursor cells mediated by L1 retrotransposition. Nature 435: 903–910. [DOI] [PubMed] [Google Scholar]
- Muotri AR, Marchetto MC, Coufal NG, Oefner R, Yeo G, Nakashima K, Gage FH. 2010. L1 retrotransposition in neurons is modulated by MeCP2. Nature 468: 443–446. [DOI] [PMC free article] [PubMed] [Google Scholar]
- Ostertag EM, Prak ET, DeBerardinis RJ, Moran JV, Kazazian HH Jr. 2000. Determination of L1 retrotransposition kinetics in cultured cells. Nucleic Acids Res 28: 1418–1423. [DOI] [PMC free article] [PubMed] [Google Scholar]
- Palmer DJ, Ng P. 2008. Methods for the production of helper-dependent adenoviral vectors. Methods Mol Biol 433: 33–53. [DOI] [PubMed] [Google Scholar]
- Rapaport F, Khanin R, Liang Y, Pirun M, Krek A, Zumbo P, Mason CE, Socci ND, Betel D. 2013. Comprehensive evaluation of differential gene expression analysis methods for RNA-seq data. Genome Biol 14: R95. [DOI] [PMC free article] [PubMed] [Google Scholar]
- Raya A, Rodríguez-Pizà I, Guenechea G, Vassena R, Navarro S, Barrero MJ, Consiglio A, Castellà M, Río P, Sleep E, et al. 2009. Disease-corrected haematopoietic progenitors from Fanconi anaemia induced pluripotent stem cells. Nature 460: 53–59. [DOI] [PMC free article] [PubMed] [Google Scholar]
- Richardson SR, Morell S, Faulkner GJ. 2014a. L1 retrotransposons and somatic mosaicism in the brain. Annu Rev Genet 48: 1–27. [DOI] [PubMed] [Google Scholar]
- Richardson SR, Narvaiza I, Planegger RA, Weitzman MD, Moran JV. 2014b. APOBEC3A deaminates transiently exposed single-strand DNA during LINE-1 retrotransposition. eLife 3: e02008. [DOI] [PMC free article] [PubMed] [Google Scholar]
- Richardson SR, Doucet AJ, Kopera HC, Moldovan JB, Garcia-Perez JL, Moran JV. 2015. The influence of LINE-1 and SINE retrotransposons on mammalian genomes. Microbiol Spectr 3: MDNA3-0061-2014. [DOI] [PMC free article] [PubMed] [Google Scholar]
- Sánchez L, Gutierrez-Aranda I, Ligero G, Rubio R, Muñoz-López M, García-Pérez JL, Ramos V, Real PJ, Bueno C, Rodríguez R, et al. 2011. Enrichment of human ESC-derived multipotent mesenchymal stem cells with immunosuppressive and anti-inflammatory properties capable to protect against experimental inflammatory bowel disease. Stem Cells 29: 251–262. [DOI] [PubMed] [Google Scholar]
- Sassaman DM, Dombroski BA, Moran JV, Kimberland ML, Naas TP, DeBerardinis RJ, Gabriel A, Swergold GD, Kazazian HH Jr. 1997. Many human L1 elements are capable of retrotransposition. Nat Genet 16: 37–43. [DOI] [PubMed] [Google Scholar]
- Singer T, McConnell MJ, Marchetto MC, Coufal NG, Gage FH. 2010. LINE-1 retrotransposons: mediators of somatic variation in neuronal genomes? Trends Neurosci 33: 345–354. [DOI] [PMC free article] [PubMed] [Google Scholar]
- Soifer H, Higo C, Kazazian HH Jr, Moran JV, Mitani K, Kasahara N. 2001. Stable integration of transgenes delivered by a retrotransposon–adenovirus hybrid vector. Hum Gene Ther 12: 1417–1428. [DOI] [PubMed] [Google Scholar]
- Swergold GD. 1990. Identification, characterization, and cell specificity of a human LINE-1 promoter. Mol Cell Biol 10: 6718–6729. [DOI] [PMC free article] [PubMed] [Google Scholar]
- Tang Y, Nyengaard JR, De Groot DM, Gundersen HJ. 2001. Total regional and global number of synapses in the human brain neocortex. Synapse 41: 258–273. [DOI] [PubMed] [Google Scholar]
- Taylor MS, Lacava J, Mita P, Molloy KR, Huang CR, Li D, Adney EM, Jiang H, Burns KH, Chait BT, et al. 2013. Affinity proteomics reveals human host factors implicated in discrete stages of LINE-1 retrotransposition. Cell 155: 1034–1048. [DOI] [PMC free article] [PubMed] [Google Scholar]
- Thomson JA, Itskovitz-Eldor J, Shapiro SS, Waknitz MA, Swiergiel JJ, Marshall VS, Jones JM. 1998. Embryonic stem cell lines derived from human blastocysts. Science 282: 1145–1147. [DOI] [PubMed] [Google Scholar]
- Upton KR, Gerhardt DJ, Jesuadian JS, Richardson SR, Sánchez-Luque FJ, Bodea GO, Ewing AD, Salvador-Palomeque C, van der Knaap MS, Brennan PM, et al. 2015. Ubiquitous L1 mosaicism in hippocampal neurons. Cell 161: 228–239. [DOI] [PMC free article] [PubMed] [Google Scholar]
- van den Hurk JA, Meij IC, Seleme MC, Kano H, Nikopoulos K, Hoefsloot LH, Sistermans EA, de Wijs IJ, Mukhopadhyay A, Plomp AS, et al. 2007. L1 retrotransposition can occur early in human embryonic development. Hum Mol Genet 16: 1587–1592. [DOI] [PubMed] [Google Scholar]
- van den Pol AN, Ghosh PK. 1998. Selective neuronal expression of green fluorescent protein with cytomegalovirus promoter reveals entire neuronal arbor in transgenic mice. J Neurosci 18: 10640–10651. [DOI] [PMC free article] [PubMed] [Google Scholar]
- Villa-Diaz LG, Garcia-Perez JL, Krebsbach PH. 2010. Enhanced transfection efficiency of human embryonic stem cells by the incorporation of DNA liposomes in extracellular matrix. Stem Cells Dev 19: 1949–1957. [DOI] [PMC free article] [PubMed] [Google Scholar]
- Vodyanik MA, Slukvin II. 2007. Hematoendothelial differentiation of human embryonic stem cells. Curr Protoc Cell Biol Chapter 23: Unit 23 26. [DOI] [PubMed] [Google Scholar]
- Wang L. 2006. Endothelial and hematopoietic cell fate of human embryonic stem cells. Trends Cardiovasc Med 16: 89–94. [DOI] [PubMed] [Google Scholar]
- Wang L, Cerdan C, Menendez P, Bhatia M. 2006. Derivation and characterization of hematopoietic cells from human embryonic stem cells. Methods Mol Biol 331: 179–200. [DOI] [PubMed] [Google Scholar]
- Wei W, Morrish TA, Alisch RS, Moran JV. 2000. A transient assay reveals that cultured human cells can accommodate multiple LINE-1 retrotransposition events. Anal Biochem 284: 435–438. [DOI] [PubMed] [Google Scholar]
- Wei W, Gilbert N, Ooi SL, Lawler JF, Ostertag EM, Kazazian HH, Boeke JD, Moran JV. 2001. Human L1 retrotransposition: cis preference versus trans complementation. Mol Cell Biol 21: 1429–1439. [DOI] [PMC free article] [PubMed] [Google Scholar]
- Wissing S, Montano M, Garcia-Perez JL, Moran JV, Greene WC. 2011. Endogenous APOBEC3B restricts LINE-1 retrotransposition in transformed cells and human embryonic stem cells. J Biol Chem 286: 36427–36437. [DOI] [PMC free article] [PubMed] [Google Scholar]
- Wissing S, Muñoz-Lopez M, Macia A, Yang Z, Montano M, Collins W, Garcia-Perez JL, Moran JV, Greene WC. 2012. Reprogramming somatic cells into iPS cells activates LINE-1 retroelement mobility. Hum Mol Genet 21: 208–218. [DOI] [PMC free article] [PubMed] [Google Scholar]
Associated Data
This section collects any data citations, data availability statements, or supplementary materials included in this article.