

Abstract
Recent studies have established that a complex community of microbes colonize the human urinary tract; however their role in kidney transplant patients treated with prophylactic antibiotics remains poorly investigated. Our aim was to investigate the urinary microbiome of kidney transplant recipients. Urine samples from 21 patients following kidney transplantation and 8 healthy controls, were collected. All patients received prophylactic treatment with the antibiotic trimethoprim/sulfamethoxazole. Metagenomic DNA was isolated from urine samples, sequenced using metagenomics shotgun sequencing approach on Illumina HiSeq2000 platform, and analyzed for microbial taxonomic and functional annotations. Our results demonstrate that the urine microbiome of kidney transplants was markedly different at all taxonomic levels from phyla to species, had decreased microbial diversity and increased abundance of potentially pathogenic species compared to healthy controls. Specifically, at the phylum level we detected a significant decrease in Actinobacteria and increase in Firmicutes due to increases in Enterococcus faecalis. In addition, there was an increase in the Proteobacteria due to increases in E. coli. Analysis of predicted functions of the urinary metagenome revealed increased abundance of enzymes in the folate pathway including dihydrofolate synthase that are not inhibited by trimethoprim/sulfamethoxazole, but can augment folate metabolism. This report characterizes the urinary microbiome of kidney transplants using shotgun metagenomics approach. Our results indicate that the urinary microbiota may be modified in the context of prophylactic antibiotics, indicating that a therapeutic intervention may shift the urinary microbiota to select bacterial species with increased resistance to antibiotics. The evaluation and development of optimal prophylactic regimens that do not promote antibiotic resistance is an important future goal.
Keywords: Kidney, Metagenomics, Microbiome, Microbiota, Next-generation sequencing, NGS, Shotgun Sequencing, Transplantation
INTRODUCTION
Dysbiosis of the microbiome is associated with multiple diseases including obesity, pulmonary disease, inflammatory bowel disease, and colon cancer, among others 1,2. In parallel, numerous components of the microbiome also perform essential functions including production of cofactors and vitamins, metabolism of essential compounds and barrier protection from pathogens 3,4. It is estimated that the human body harbors same order of bacteria compared to mammalian cells and such bacteria are likely essential for health5. The human gut microbiome is extensively investigated importantly, there is emerging evidence that the urinary microbiome also has important biologic functions. Previous dogma suggested that urine was normally sterile in healthy subjects; however, recent studies have established that a complex microbial community containing hundreds of bacteria colonize the healthy urinary tract 6–8. A complex urinary microbiome has been documented by diverse collection methods including mid-stream clean-catch, transurethral catheters and percutaneous bladder puncture indicating that the urinary microbiome is not simply due to contamination or urethral colonization 8,9.
Culture methods to diagnose clinical urinary tract infections (UTI) are designed to preferentially identify fast growing bacterial species (e.g. E. coli and Enterococcus sp.), yet many fastidious species do not grow under typical laboratory conditions. Also, a clinical diagnosis of a UTI is based on a quantitative threshold (e.g., >104 CFU/ml) and excludes polymicrobial growth as contamination 10. Thus, investigation of the roles of commensal versus pathogenic bacteria in the urinary microbiome require improved methods such as the culture- and cloning-independent detection of microbiome by high-throughput shotgun metagenome sequencing, which is used in this study. Several previous microbiome studies sequenced only a portion of the 16S ribosomal RNA gene that is then used to predict the bacterial taxa. For example, the Human Microbiome Project focuses on the V1–V3 and V3–V5 region of the 16S rRNA gene to determine taxonomy. However, precise identification, particularly at the species and strain level, is challenging by this approach due to horizontal gene transfer among bacteria. Thus, shotgun metagenomics may provide increased power to investigate the microbiome11. An essential component of microbiome analysis is the emergence of databases of bacterial genes and genomes. Currently, greater than 6,000 bacterial genomes have been sequenced and compiled in Genomes OnLine Database and Ensembl Bacteria, and greater than 9.3 million unique bacterial genes have been collated to date 12,13. Compared with the approximately 23,000 annotated genes in the human genome, the large number of bacterial genes illustrates the complex biological processes that can be contributed by the microbiome.
We investigated the urinary microbiome in kidney transplant patients. Following transplantation patients are exposed to prophylactic antibiotics and immunosuppressive agents which could modulate the microbiome and potentially result in dysbiosis. In this study we employed shotgun metagenomics to enhance the identification of bacterial genes and genomes in the urinary microbiome.
Materials and Methods
Study design, patient cohort and ethics statement
The objective of this study was to investigate the urinary microbiome in kidney transplant recipients and healthy controls using shotgun metagenomic sequencing. Urine samples were collected post-transplant from 21 kidney transplant recipients with known comorbidities and 8 control subjects. The controls included healthy adult subjects with no known comorbidities nor any history of UTI. Adult kidney transplant patients who received kidney transplants at the Washington University Medical Center, St. Louis, MO, were included in the study. All patients were treated with a standard of care protocol. Patients received a total of four doses of rabbit anti-thymocyte globulin [Thymoglobulin (TMG) (1.5 mg/kg each), Sang-Stat Medical Corp., Fremont, CA] for induction. The first dose was given intra-operatively followed by doses on post-operative days 1–3. Calcineurin inhibitors (CNI) were instituted upon a brisk diuresis but no later than 4 days postoperatively. Target Cyclosporine levels were 200–250 ng/ml during the first 3 months. Tacrolimus target levels were between 5–10 ng/ml. Maintenance immunosuppression included a CNI of either tacrolimus or cyclosporin, an antimetabolite and prednisone. Clinical information including laboratory results, infections, and medications were collected for each subject at the time of each clinic visit. Comorbidities including Type 1 Diabetes Mellitus (T1DM), Type 2 Diabetes Mellitus (T2DM), hypertension (HTN), and “Other” (which included focal segmental glomerulosclerosis, post-streptococcal glomerulonephritis, nephrocalcinosis, polycystic kidney disease, reflux nephritis, systemic lupus erythematous and vasculitis) were documented and listed in Table 1. All patients received Thymoglobulin for induction and a calcineurin inhibitor along with mycophenolate and prednisone for maintenance. Ureteral stents were removed at 1 month post transplantation. Samples were collected during the first 12 months post transplantation prior to the reported complications. The demographics of the transplant patients were 67% male, 33% female, 81% Caucasian, 19% African-American, with an age range 31–76. The demographics of the control healthy subjects were 37.5% male, 62.5% female, 62.5% Caucasian, 37.5% Asian, with an age range 27–63 years (Table 1). The control group did not have any pre-existing medical conditions such as kidney disease, UTI, etc. The control group did not consume any antibiotics (for at least 6 months) prior to participation in the study. Controls did not report any history of over the counter (OTC) medications such as antipyretics or pain-relievers. Informed consent was obtained from all subjects. This study was approved by the Washington University School of Medicine Institutional Review Board, St. Louis, Missouri (IRB ID # 201102312, Protocol Number # 07-0430) and by the University of Illinois Institutional Review Board, Chicago, Illinois (IRB # 2014-1227).
Table 1.
Characteristics of kidney transplant patients and control subjects.
| Patient | Age (Years) | Gender | Ethnicity | Clinical Diagnosis | Calcineurin Inhibitor | Stent | Creatinine | Rejection | Bacterial infection | |||
|---|---|---|---|---|---|---|---|---|---|---|---|---|
| Sample collection | 6 M | 12 M | 1 year (Avg.) | |||||||||
| 1 | 59 | M | Caucasian | T1DM | FK | No | 2.2 | 3.3 | 2.7 | 2.5 | Yes | UTI^ |
| 2 | 76 | M | African American | T2DM | FK | No | 1.6 | 1.2 | 0.9 | 4.3 | No | No |
| 3 | 31 | M | Caucasian | PSGN | FK | Yes | 1.9 | 1.6 | 1.6 | 3 | No | No |
| 4 | 47 | M | Caucasian | PKD* | CYA | No | 1.3 | 1.4 | 1.2 | 1.5 | No | No |
| 5 | 59 | M | Caucasian | HTN | FK | No | 1.5 | 1.4 | 1.4 | 1.4 | No | No |
| 6 | 65 | M | Caucasian | HTN | FK | Yes | 1.2 | 1.2 | 1.2 | 2 | Yes | - |
| 7 | 66 | M | Caucasian | T2DM | FK | Yes | 1.3 | 1.3 | 1.3 | 1.4 | No | UTI^ |
| 8 | 52 | M | African American | HTN | CYA | No | 2.4 | 2.6 | 2.2 | 3.9 | No | urosepsis^ |
| 9 | 62 | F | African American | T1DM | FK | No | 1.2 | 1.2 | 1.2 | 1.6 | No | No |
| 10 | 40 | F | Caucasian | Vasculitis* | CYA | No | 1.2 | 1.7 | 1.5 | 3.9 | No | No |
| 11 | 45 | F | African American | FSGS* | CYA | No | No | 1.1 | 0.9 | 3.1 | No | No |
| 12 | 51 | M | Caucasian | T2DM | FK | No | 0.9 | 1.5 | 1.5 | 1.1 | No | No |
| 13 | 41 | M | Caucasian | HTN | FK | No | 1.3 | 1.9 | 1.3 | 2.1 | No | No |
| 14 | 51 | F | Caucasian | Lupus* | FK | Yes | 0.9 | 0.7 | 0.8 | 0.9 | No | UTI/wound infection^ |
| 15 | 46 | F | Caucasian | RN* | FK | No | NA | 0.8 | 0.9 | 0.85 | No | No |
| 16 | 54 | M | Caucasian | HTN | FK | No | 1.7 | 2.6 | 1.7 | 3.3 | No | No |
| 17 | 74 | F | Caucasian | HTN | FK | No | 1.2 | 1.2 | 1.2 | 2.6 | No | No |
| 18 | 46 | M | Caucasian | HTN | FK | No | 1.9 | 1.7 | 1.5 | 5.5 | No | No |
| 19 | 54 | M | Caucasian | PKD* | FK | No | 1.2 | 1.2 | 1 | 1.8 | No | Knee wound infection^ |
| 20 | 32 | F | Caucasian | T1DM | FK | Yes | 1.3 | 1.3 | 1.5 | 1.5 | No | No |
| 21 | 68 | M | Caucasian | Nephrocalcinosis* | FK | No | 1.3 | 1.4 | 1.3 | 1.5 | No | No |
| Control | Age (Years) | Gender | Ethnicity |
|---|---|---|---|
| C2 | 31 | F | Caucasian |
| C3 | 30 | F | Caucasian |
| C4 | 29 | M | Asian |
| C5 | 32 | F | Asian |
| C6 | 30 | M | Caucasian |
| C7 | 63 | M | Caucasian |
| C8 | 27 | F | Caucasian |
Demographic data including sample number, gender, age, ethnicity, ESRD cause, calcineurin inhibitor, and use of ureteral stent for anastomosis (stents were removed at 1 month post-transplant). T1DM (Type 1 Diabetes Mellitus); T2DM ( Type 2 Diabetes Mellitus); HTN (Hypertension); FSGS (Focal Segmental Glomerulosclerosis); PSGN (Post Streptococcal Glomerulonephritis); PKD (Polycystic Kidney Disease); RN (Reflux Nephropathy).All rejection episodes were treated with steroids.
Grouped as ‘other’ category for analysis.
FK: Tacrolimus (FK-506); CYA: cyclosporine A; ^: bacterial infections were reported post-sample collection and from 3–6 months post-transplant; NA: not available.
Metagenome DNA isolation and sequencing
Urine obtained by mid-stream clean catch was processed in positive pressure airflow sterile hoods. One ml of urine from all samples was processed, and was centrifuged at low speed at 180×g for 15 min at 4°C to remove the mammalian cells, and the supernatant was stored at −80°C until further processing. The urine samples were thawed and centrifuged at 100,000×g for 2 h at 4°C in an ultra-centrifuge (Sorvall WX 80 Ultracentrifuge, Thermo Fisher Scientific Inc) to pellet down the microbial contents. The pellet was resuspended with 100 μL 1×PBS (Cellgro, Mediatech Inc.), and subjected to DNaseI treatment (Invitrogen) for 15 mins at 37°C, and the reaction was stopped by adding 2 mM EDTA, and heating the content for 10 min at 65°C. The contents were subjected to enzymatic treatment by adding AL Buffer (DNAeasy kit (Qiagen), Lysozyme (Fisher Bio Reagents) and enzyme solution (DNAeasy kit Handbook, Qiagen) for 2h at 37°C. Proteinease K was added to the mixture and the DNA was eluted using the DNAeasy kit (Qiagen) protocol. The purified DNA was quantified using a Qubit fluorometer (Life Technologies Corporation), and equal amount of DNA from all samples were mechanically fragmented using a Covaris S220 (Covaris Inc). The DNA libraries for sequencing were prepared using the NEBNext DNA library prep kit for Illumina (New England BioLabs Inc). The quality and quantity of all the DNA libraries were analyzed with a Bioanalyzer 2100 (Agilent Technologies) and Qubit fluorometer. Equal amount of all the DNA libraries were sequenced on an Illumina HiSeq 2000 generating 50 base single end reads (BGI Americas). Control libraries were prepared by using 1×PBS buffer instead of urine, and were subjected to the same DNA isolation protocol as for test urine samples. As expected there was no detectable DNA by Qubit analysis. The control DNA was then used to prepare metagenome libraries, and no libraries were detected by Bioanalyzer analysis and thus not quantifiable. The control libraries were pooled and sequenced with the test libraries. After de-multiplexing of the sequence reads, no reads were assigned to the control libraries.
Bioinformatics analyses, taxonomic and metabolic annotation
Raw DNA sequence reads were quality trimmed, and filtered to remove human DNA sequences by mapping against the human reference genome using standard default parameters (CLC Genomics Workbench, CLC Bio, Aarhus, Denmark). Filtered (non-human) sequences were assembled into contigs using the minimum contig length above 300 bp for each sample. Taxonomic and functional annotations of the contigs were obtained using the automated annotation pipeline at MG-RAST web server [http://metagenomics.anl.gov/] using the maximum e-value 1e−5 cutoff, and minimum 80 % identity cutoff using M5NR and KEGG databases, respectively 14. The contigs were assigned to KEGG Orthology (KO) gene identifiers and frequencies in the transplant and control groups were determined 15. The KOs were constructed into metabolic pathways and biological processes using a KEGG mapper. Each sample was compared at the phylum, genus and species level, as well as at the KEGG pathway levels I, II, III and functional level 15. Taxa at the species level with ≥1% of the reads were defined as abundant. Relative abundance for each taxon and metabolic feature were normalized by the percentages of total assigned reads of the metagenome.
Statistical analyses
Data corresponding to both functional and taxonomical distributions were analyzed as described16. Differences between two groups were assessed using the Mann-Whitney U test. Data sets that involved more than two groups were assessed by analysis of variance (ANOVA) followed by Tukey’s multiple comparison post hoc tests. Data were analyzed using GraphPad Prism (GraphPad Software, San Diego, CA, USA). Data were considered as statistically significant with p<0.05 unless otherwise indicated. Wilcoxon-rank sum test was used for comparison between the two groups, with p-value of <0.05 considered as a significant difference after multiple test correction with Benjamini-Hochberg false discovery rate (FDR). Principal Coordinate Analysis (PCoA) was performed to find the axis that best explains the variance in the data set. The PCoA plot was generated using the Bray-Curtis dissimilarity matrix for phylum and species between transplant and control group. Microbiome profile at species level were also analyzed by partial least squares discriminant analysis (PLS-DA) 17. Cluster analysis was performed using the Pearson’s correlation distance with Ward method between the transplant and control groups at phylum and species level, as described 17. In order to test for significant differences in the transplant and control group, a one-way analysis of similarity (ANOSIM) was conducted as described 18.
High-throughput sequencing data availability
The sequence data has been submitted to the MG-RAST web-server under following accession numbers: 4504962.3, 4532153.3, 4505561.3, 4505562.3, 4505340.3, 4505341.3, 4524189.3, 4524191.3, 4524193.3, 4524195.3, 4524197.3, 4554299.3, 4559944.3, 4554300.3, 4554302.3, 4554303.3, 4554304.3, 4554305.3, 4554306.3, 4554307.3, 4554308.3, 4555679.3, 4555680.3, 4555681.3, 4555682.3, 4556080.3 4556081.3, 4557780.3, 4557851.3.
RESULTS
Modulation of the urinary microbiome following kidney transplantation
To investigate the urinary microbiome in kidney transplant recipients, we used shotgun metagenomics approach. The DNA was isolated from the urine, libraries were constructed and sequenced using high throughput metagenome shotgun sequencing on an Illumina HiSeq 2000. Sequencing of DNA libraries generated 288 million reads with 150,347 de novo assembled contigs. Sequencing statistics are given in Table S1. A Principal Coordinate Analysis (PCoA) identified distinct clusters of the transplant and control groups at both the phylum and species level (Figure 1). The first principal component contributed 25.5% and 17.7% to the variance of the phyla and species, respectively (Figure 1). We also determined the separation of the transplant and control microbiomes by Ward’s hierarchical clustering method using the Pearson’s correlation similarity measure (Figure S1). The dendrogram confirmed segregation of the transplant and control microbiomes similar to the PCoA analysis. To determine the effects of kidney transplantation on the urinary microbiome, we analyzed the microbial taxa in the urine of kidney transplant recipients and healthy controls (Table 2). These analyses indicate that the transplant and control groups have markedly different microbial compositions. PLS-DA (Partial least squares discriminant analysis) was performed on all samples with grouping according to transplant and control status. This analysis revealed 2 separate microbiome profiles in the transplant and control groups (Figure S2a). The pairwise one-way analysis of similarity (ANOSIM) test showed that the transplant and control group differ significantly (one-way ANOSIM, Global R = 0.37, p<0.001, number of permutations = 9999) and within-group variability was low compared to between-group variability (Figure S2b).
Figure 1. Principal Coordinate Analysis.

Principal coordinate analysis (PCoA) at (a) phylum and (b) species level in kidney transplant and control groups. The transplant and the control group are well separated and could be differentiated readily, using the % variation explained by the first two components (PC1 and PC2) of the PCoA plot. Similar direction and magnitude of clustering indicate a highly positive association. The percentage of total variance explained by each axis is noted in both the axis labels. Dark circles represents the transplant, and light circles represent control group samples.
Table 2.
Abundance of bacterial phylum.
| Phylum | Transplant (%) | Control (%) |
|---|---|---|
| Firmicutes* | 39.5 | 11.6 |
| Actinobacteria** | 6.4 | 41.0 |
| Proteobacteria | 49.5 | 37.0 |
| Bacteroidetes | 2.6 | 9.0 |
| Other Phyla | 1.9 | 1.5 |
The difference between the relative abundance of individual phylum in the transplant and control microbiomes was computed using a Wilcoxon rank-sum test *p<0.05, **p<0.005, (FDR corrected). Other phyla included 23 different phyla with an abundance <2%.
Analysis of the microbial taxa
We analyzed the microbiome profile in transplant and control samples, and the major phyla are shown in Figure S3a. The urinary microbiome of the transplant group is dominated by two major bacterial phyla, Firmicutes and Proteobacteria, whereas the control group is dominated by Actinobacteria and Proteobacteria (Table 2). Other minor phyla detected were Bacteroidetes and “other phyla” which included 23 low abundant phyla (each detected with an abundance <2%). We detected major alterations in the proportions of two phyla revealing an expansion of Firmicutes from 11.6% to 39.5% (p<−0.05) and a reduction of Actinobacteria from 41.0% to 6.4% (p<0.005) in the transplant group compared to controls. A small increase in the phylum Proteobacteria and decrease in Bacteroidetes was observed in the transplant group; however, these trends did not reach statistical significance. To focus on a more specific level of classification, we next analyzed the data at the species level which is feasible with the application of shotgun metagenomics (Table 3). First, we observed that only 8 species (among the top 21 species identified as abundant species in both groups) were shared between the groups, whereas 13 species were specific to a single group. We observed a significant increase in the transplant group in multiple species including Enterococcus faecalis, E. faecium, Enterococcus sp., E. coli, and Escherichia sp., compared to low levels of these species in the control group (p<0.05). In contrast, there was a significantly higher abundance of the species Propionibacterium acnes (17.8%) in the control group (p<0.05). The abundance of E. faecalis, E. coli and P. acnes in the transplant and control samples are given in Figures S3 b–d. The species Corynebacterium amycolatum, Neisseria meningitidis, and Mobiluncus curtisii were high in abundance (more than 1%) in the control group, although none of these species were detected in high abundance in the transplant group (Table 3).
Table 3.
Abundance of bacterial species.
| Transplant | Control | ||
|---|---|---|---|
| Species | % Abundance | Species | % Abundance |
| Enterococcus faecalis* | 22.51 | Propionibacterium acnes* | 17.89 |
| Escherichia coli* | 9.50 | Ralstonia solanacearum | 3.03 |
| Propionibacterium acnes* | 4.85 | Ralstonia pickettii | 2.74 |
| Ralstonia pickettii | 4.28 | Corynebacterium amycolatum | 2.24 |
| Proteus mirabilis | 4.14 | Neisseria meningitidis | 2.04 |
| Ralstonia solanacearum | 3.17 | Mobiluncus curtisii | 1.68 |
| Bacteroides vulgatus | 2.36 | Enhydrobacter aerosaccus | 1.51 |
| Enterococcus faecium | 1.92 | Escherichia coli* | 1.34 |
| Enterococcus sp. | 1.90 | Corynebacterium jeikeium | 1.13 |
| Escherichia sp. 4_1_40B | 1.66 | Enterococcus faecalis* | 1.01 |
| Salmonella enterica | 1.57 | Porphyromonas uenonis | 0.98 |
| Enterococcus sp. 7L76 | 1.56 | Ralstonia sp. 5_7_47FAA | 0.91 |
| Shigella sonnei | 1.41 | Ralstonia sp. | 0.90 |
| Shigella dysenteriae | 1.34 | Corynebacterium aurimucosum | 0.88 |
| Lactobacillus crispatus | 1.25 | Enterococcus faecium | 0.86 |
| Shigella flexneri | 1.24 | Corynebacterium efficiens | 0.84 |
| Shigella sp. D9 | 1.19 | Prevotella timonensis | 0.84 |
| Shigella sp. | 1.18 | Neisseria mucosa | 0.80 |
| Ralstonia sp. | 1.08 | Neisseria lactamica | 0.80 |
| Shigella boydii | 1.07 | Streptococcus pneumoniae | 0.77 |
| Ralstonia sp. 5_7_47FAA | 1.03 | Mobiluncus mulieris | 0.76 |
Bacterial species identified in transplant and control group (selected on the basis of >1% abundance in transplant group). Species identified in both the groups are shown in bold letters, whereas non-bold are the species specific to each group. Statistical significance was determined by Wilcoxon rank-sum test.
p<0.05.
We also compared the microbiomes at the genus level which was consistent with our analyses of the phyla and species. For example, the increase in the phylum Firmicutes in the transplant group was to a large extent due to an increase in the genus Enterococcus which includes four Enterococcus species (Table S2). The increase in the phylum Actinobacteria in the control group corresponded with an enrichment of genera Propionibacterium, Corynebacterium, and Mobiluncus which includes a large increase in the species Propionibacterium acnes, a smaller increase in Mobiluncus curtisii and increases in 4 species of Corynebacterium. Thus, the changes observed in phyla, genera and species were internally consistent with bacterial taxonomy, but the analysis at the species level provided the most detailed discrimination. There was no significant correlation with the time following transplantation and the abundance of the major bacterial phyla - Actinobacteria, Bacteroidetes, Firmicutes and Proteobacteria (Figure S7).
Decreased bacterial diversity of the urinary microbiome of transplant patients
Overall, the urinary microbiome of the transplant group included a total of 1210 species, whereas a total of 1420 species were identified in control group (Figure 2). Both groups shared 1016 (62.9%) bacterial species, but with variable relative abundance. The number of species unique to the transplant (194) and control group (404) revealed that only 12% and 25% of the species were unique to transplant and control group, respectively. To assess the ecological structure of the urinary microbiomes, we estimated the diversity and evenness of the bacterial populations. The Shannon diversity index for the transplant group (2.8±0.2) was significantly lower than the control group [4.8±0.2, p<0.0001] (Figure 3a, Table S3). The Inverse Simpson index was also significantly lower in the transplant group (Table S3). However species evenness values were similar in both the groups (Figure 3b, Table S3). These results indicated a significant decrease in community diversity in the transplant group as measured by both the Shannon and Simpson indices.
Figure 2. Detection of a core bacterial population in the transplant and control microbiome.
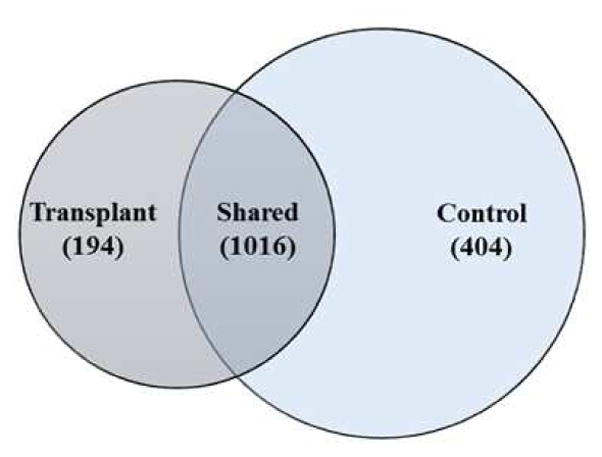
Venn-diagram indicating the shared and unique bacterial species in the transplant and control microbiomes. Overall, 1016 bacterial species were shared among the transplant and control groups.
Figure 3. Decreased bacterial diversity in the transplant group.

Box plot showing the Shannon diversity index in transplant and control group. Based on Mann Whitney U test the Shannon index is significantly different between the groups. ***p<0.0001.
No effect of different primary diagnoses of ESRD on microbial composition
The transplant patient population in our study includes several diagnoses; categorized in to 4 subgroups including Type 1 Diabetes Mellitus (T1DM), Type 2 Diabetes Mellitus (T2DM), hypertension (HTN), and Other. We further investigated whether the differences in the composition of the urinary microbiome were associated with specific diagnoses. An ANOVA comparison of the proportion of bacterial phyla and species in the 4 clinical diagnoses revealed no significant differences in microbial composition among the 4 clinical diagnoses (Tables S4 and S5). However, similar to results for the whole transplant group, these categories were significantly different at the phylum and species level compared to the control group (Figure S4a). Also, the Shannon diversity index calculated for the 4 subgroups of clinical diagnosis showed no significant difference among clinical diagnoses, however they were significantly different from controls (Figure S4b and Table S5). These data suggest that there may be no effect of different primary diagnoses of ESRD on microbial composition.
Analysis of folate metabolic pathway
To determine if the metabolic potential of the urinary microbiome was different in the transplant and control groups, we analyzed the bacterial metagenomes in each group for biological functions with the Kyoto Encyclopedia of Genes and Genomes (KEGG) catalog and assigned KEGG identifiers (KO) for predicted genes. Our analysis of the level 1 KEGG categories, which includes the most general functional classifications, showed a major contribution of metabolism (58–61%) to the overall KEGG processes; however, there were no significant differences between the transplant and control groups (Figure S5 and Table S6). In contrast, analysis at the more specific level 4 (functional level) showed a significant difference in folate metabolism. Thus, the transplant and control groups had similar general metabolic processes (Level 1), but exhibited distinct differences in the more specific enzymes in the pathways (Level 4). Of note, we observe an increase in enzymes in the folate pathway by the transplant microbiome (Figure 4) including increases in dihydrofolate synthase/folypolyglutamate synthase (Figure 5). We compared the abundance of genes (at functional level) involved in the folate metabolism pathway in the three major phyla – Firmicutes, Proteobacteria, and Actinobacteria in transplant and control groups. These phyla were major contributors to the changes in the bacterial diversity following transplantation. At phylum level Firmicutes and Proteobacteria in transplant group and Proteobacteria and Actinobacteria in control group, were enriched for folate biosynthesis genes (Figure S6a). However no predicated folate functions were detected in Actinobacteria and Firmicutes, of transplant and control group, respectively. We further compared these changes in the bacterial species which were highly abundant in each group. E. faecalis (Phylum – Firmicutes), and E. coli (Phylum – Proteobacteria) in transplant group; whereas in control group P. acnes (Phylum – Actinobacteria) was enriched for folate biosynthesis genes (Figure S6b).
Figure 4. The KEGG folate metabolic pathway.
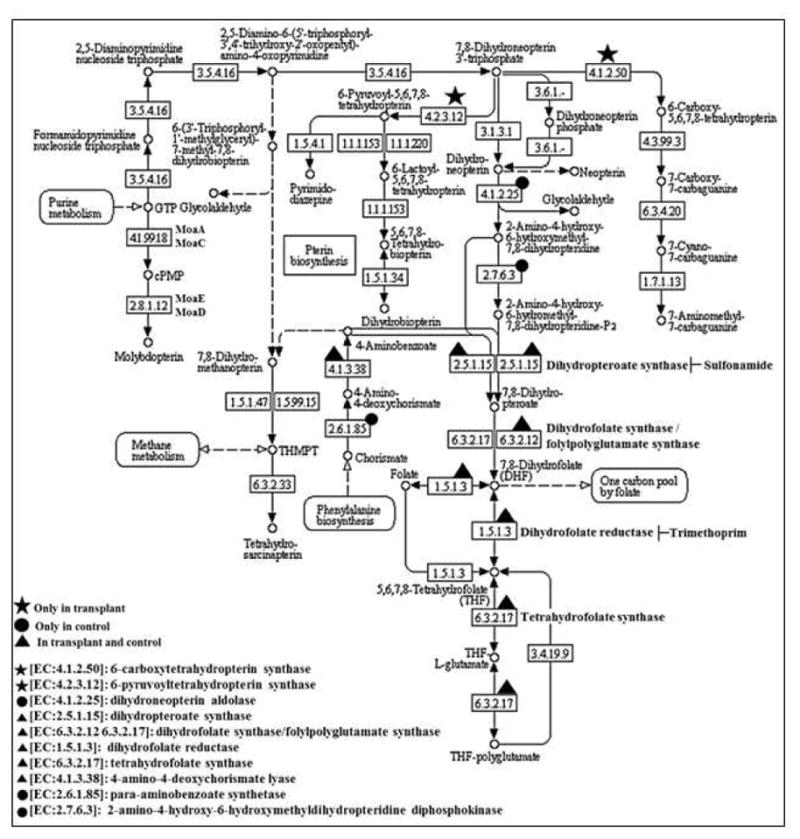
The gene IDs are indicated with symbols. star present in transplant; circle present in control; triangle present in both. The gene IDs not identified in this study are not denoted by any symbols.
Figure 5. Abundance of enzymes in KEGG folate pathway.

The enzyme name/ID and their respective values of the samples were obtained from MG-RAST KEGG database, and differential abundance of (a) dihydrofolate reductase [EC:1.5.1.3], (b) dihydropteroate synthase [EC:2.5.1.15] and (c) dihydrofolate synthase/folylpolyglutamate synthase [EC:6.3.2.12 6.3.2.17], among transplant and control group was compared. The significance of the difference was computed using Mann-Whitney U test among the groups. *p<0.05. ns: not significant.
DISCUSSION
Our study identified major changes in the urinary microbiome following kidney transplantation. These changes were detected in the all of the major taxa including phyla, genera and species based on both PCoA, hierarchical clustering and multivariate analysis (Figures 1, S1 and S2). The richness and α-diversity of the bacterial species detected in the transplant and control urines was significant between the groups (Figure 3, Table S3). At the phyla level, the transplant group had a significant decrease in Actinobacteria and increase in Firmicutes, whereas the other major phyla including Proteobacteria and Bacteroidetes did not show significant changes (Table 2). At the species level, the transplant group had significant increases in E. coli and E. faecalis, two potentially pathogenic species, and decreases in P. acnes, a non-pathogenic species (Table 3). The ecological structure of the microbiomes was also significantly different. Both the Shannon and Simpson indices (see Table S3) showed significantly lower diversity in the transplant microbiome which is consistent with the observations that diversity is often lower in a disease state than in health 19. Thus by inference, the kidney transplant urine microbiome is more susceptible to dysbiosis. In addition, we show that the complexity of the microbiome in the transplant population is significantly lower than that of healthy controls which is suggestive of a less stable bacterial community.
In an analysis of predicted functions, the transplant microbiome has increased abundance of genes that produce enzymes in the folate metabolic pathway (Figures 4 and 5). Interestingly, the increased genes are not direct targets of the antibiotic which could reduce sensitivity to trimethoprim/sulfamethoxazole, a commonly administered antibiotic that is used as a prophylactic treatment in the transplant patients. The taxonomic analysis establishes several important observations. First, the urine of the healthy non-transplant controls contained a diverse microbiome consisting of 10 different abundant bacterial species (>1%), plus >990 non-abundant (<1%) species. Thus, the urine was not sterile in either the healthy controls or the transplant patients, but colonized with a complex community of bacteria. We underscore that the clinical diagnosis of a UTI depends on growth of greater than a defined threshold number of colonies (e.g., >105 CFU/ml) whereas the significance of the presence of a smaller colony number is not clear. Our method employing cloning- and culture-independent high throughput DNA sequencing of bacterial DNA is exquisitely sensitive and advantageous to investigate the microbiome since there are no known laboratory techniques to culture > 90 % of bacterial species 20.
It is possible that some or all of the abundant colonizing bacteria in the healthy controls are beneficial and perhaps prevent the invasion of pathogenic species. Following transplantation, patients are exposed to multiple stressors including treatment with prophylactic antibiotics and immunosuppressive drugs. Our data suggests that these stressors precipitate changes in the urinary microbiome including the expansion of potentially pathogenic bacterial species. This is consistent with a previous report showing a greater change in the urinary microbiome between time 0 and 1 months than between 1 and 6 months following transplantation 21. Of note, out of 21 urine samples, 11 samples had high abundance of E. faecalis, defined as greater than 10% relative abundance, established through metagenome sequencing and E. faecalis UTI developed within this group. A total number of patients with culture positive UTI is 4 (Table 4), with E. faecalis abundance of >10% and with elevated dihydrofolate synthetase gene. Interestingly, Enterococcus is also abundant in the transplant recipients without a UTI, and it was also detected in control samples, although at lower abundance. These results suggest that the bacterial species causing a clinical UTI may be members of the colonizing microbiome present prior to the development of a clinical infection. This interpretation suggests that clinical UTIs may not be only due to the invasion of a pathogenic strain that ascends the urinary tract or traverses from the blood, but also, to the emergence of a pathogenic strain after a perturbation that disrupts the homeostasis that was maintaining the microbial community. Therapeutic or probiotic modification of the colonizing microbiome may be effective in ameliorating the severity and frequency of clinical UTIs and urosepsis.
Table 4.
List of patients who developed a clinical UTI.
| Patient | Urine culture | Percent abundance of bacteria identified by metagenome sequencing | |||
|---|---|---|---|---|---|
| E. faecalis | E. coli | Enterobacter | P. aeruginosa | ||
| 1 | Enterococcus faecalis | 41.0 | 9.0 | 0.0 | 0.0 |
| 7 | Enterobacter | 27.0 | 13.0 | 0.2 | 0.0 |
| 8 | Enterococcus faecalis | 28.0 | 10.0 | 0.2 | 0.0 |
| 14 | Pseudomonas aeruginosa | 0.2 | 21.0 | 1.0 | 0.1 |
Since our transplant patient population had multiple primary diagnoses associated with the development of end stage renal disease including T1DM, T2DM, HTN, and “Other”, we evaluated the possibility that changes in the transplant urinary microbiome were due to these primary diagnoses. Our results suggests that there were no significant differences in the taxa among the 4 diagnoses; however, as expected, each diagnosis was significantly different from the healthy controls. Similar results were observed in the analysis of diversity with no differences observed among the 4 diagnoses, but again each diagnosis showed significantly decreased diversity compared to the healthy controls. Thus, metabolic effects due to DM or other primary diseases were not the source of the changes in the microbiome following transplantation (Figure S4).
A similar profile of bacterial diversity including Corynebacterium, Staphylococcus, Streptococcus, Propionibacterium and Ralstonia has been reported previously 6,22,23. A recent study by Fricke et al., using 16S rRNA amplicon sequencing also analyzed the microbiome in renal transplant patients 21, and, similar to our results, detected increasing abundance of Firmicutes with time following transplantation. However, whereas their study detected <350 OTUs per sample, our data detected 1210 total species. The difference is likely due to the technical difference between the targeted 16S rRNA amplicon and shotgun metagenomics sequencing that detected an average of 4,652 versus 140,918 sequence reads per sample, respectively. In addition, the study by Fricke et al., detected bacteria in 33% of the urine samples, whereas our data detected bacteria in 100% of the samples. Importantly, the increased sequencing depth and shotgun approach facilitated our analysis of KEGG pathways at the species level. The overall observations in our study are enhanced by the use of shotgun metagenomics which permits more precise identification of the bacterial genes and genomes in the sample than 16S rRNA based methods, which rely on sequencing a fragment of the 16S rRNA gene and then predicting the associated taxa. More accurate identification of the bacterial genomes strengthens both the classification of the species and the predictions of putative biologic functions 11. For example, our analysis predicts increased folate production by the transplant microbiome. Following transplantation, the standard of care treatment includes prophylactic trimethoprim/sulfamethoxazole, which inhibits two enzymes in the folate metabolic pathway, to prevent urinary tract infections. The extensive use of this antibiotic has led to widespread resistance in up to 25% of some bacterial species. The resistance has been shown to occur by a number of different mechanisms including synthesis of drug-resistant plasmid-encoded dihydrofolate synthetase, hyper-production of para-aminobenzoic acid or metabolic alteration of the drug entity 24,25. Our data show that opportunistic pathogenic bacterial species (Eg., E. faecalis and E. coli) may develop mechanisms to resist the prophylactic antibiotics in the transplant group.
Our study did not detect significant changes in the levels of genes for both dihydropteroate synthase and dihydrofolate reductase in the transplant, which are targets of trimethoprim/sulfamethoxazole. However, dihydrofolate synthase/folylpolyglutamate synthase, which has the potential to promote folate production from THF-polyglutamate by enzymes not directly inhibited by trimethoprim/sulfamethoxazole is produced in the transplant group. Thus, the microbiome in the transplant group has the potential to express metabolic pathways that could bypass the inhibition by trimethoprim/sulfamethoxazole. These results suggest that prophylactic antibiotic treatment could alter the urinary microbiome following transplantation to select bacterial species with resistance to antibiotics. Since the observed shift in the microbiome following transplantation is towards potentially pathogenic bacterial species, it will be important in future studies to confirm the changes in folate metabolism with meta-transcriptomics and to evaluate optimal prophylactic regimens.
Supplementary Material
Acknowledgments
Conflicts of Interest: All authors have read the journal’s policy on disclosure of potential conflicts of interest and have none to declare.
This work was supported in part by RO1 HL081663 and RO1 AI053878 to PWF and DLP, T32 HL082547 to PWF, and DK02886 and DK079333 to DCB.
All authors have read the journal’s authorship agreement and the manuscript has been reviewed by and approved by all the authors.
Footnotes
AUTHOR CONTRIBUTIONS
DLP, PWF, and DCB designed the study; AR, RR and HSM performed the data analysis; KEA and DVP prepared metagenomic libraries; AR, RR, PWF and DLP wrote and edited the manuscript; ZH edited the manuscript.
Publisher's Disclaimer: This is a PDF file of an unedited manuscript that has been accepted for publication. As a service to our customers we are providing this early version of the manuscript. The manuscript will undergo copyediting, typesetting, and review of the resulting proof before it is published in its final citable form. Please note that during the production process errors may be discovered which could affect the content, and all legal disclaimers that apply to the journal pertain.
References
- 1.Cho I, Blaser MJ. The human microbiome: at the interface of health and disease. Nat Rev Genet. 2012;13(4):260–270. doi: 10.1038/nrg3182. [DOI] [PMC free article] [PubMed] [Google Scholar]
- 2.Pflughoeft KJ, Versalovic J. Human microbiome in health and disease. Annu Rev Pathol. 2012;7:99–122. doi: 10.1146/annurev-pathol-011811-132421. [DOI] [PubMed] [Google Scholar]
- 3.Kau AL, Ahern PP, Griffin NW, Goodman AL, Gordon JI. Human nutrition, the gut microbiome and the immune system. Nature. 2011;474(7351):327–336. doi: 10.1038/nature10213. [DOI] [PMC free article] [PubMed] [Google Scholar]
- 4.Khosravi A, Yanez A, Price JG, et al. Gut microbiota promote hematopoiesis to control bacterial infection. Cell Host Microbe. 2014;15(3):374–381. doi: 10.1016/j.chom.2014.02.006. [DOI] [PMC free article] [PubMed] [Google Scholar]
- 5.Sender R, Fuchs S, Milo R. Revised estimates for the number of human and bacteria cells in the body. 2016 doi: 10.1371/journal.pbio.1002533. bioRxiv. [DOI] [PMC free article] [PubMed] [Google Scholar]
- 6.Whiteside SA, Razvi H, Dave S, Reid G, Burton JP. The microbiome of the urinary tract-a role beyond infection. Nat Rev Urol. 2015;12(2):81–90. doi: 10.1038/nrurol.2014.361. [DOI] [PubMed] [Google Scholar]
- 7.Hilt EE, McKinley K, Pearce MM, et al. Urine is not sterile: use of enhanced urine culture techniques to detect resident bacterial flora in the adult female bladder. J Clin Microbiol. 2014;52(3):871–876. doi: 10.1128/JCM.02876-13. [DOI] [PMC free article] [PubMed] [Google Scholar]
- 8.Wolfe AJ, Toh E, Shibata N, et al. Evidence of uncultivated bacteria in the adult female bladder. J Clin Microbiol. 2012;50(4):1376–1383. doi: 10.1128/JCM.05852-11. [DOI] [PMC free article] [PubMed] [Google Scholar]
- 9.Lewis DA, Brown R, Williams J, et al. The human urinary microbiome; bacterial DNA in voided urine of asymptomatic adults. Front Cell Infect Microbiol. 2013;3(Article 41):1–14. doi: 10.3389/fcimb.2013.00041. [DOI] [PMC free article] [PubMed] [Google Scholar]
- 10.Orenstein R, Wong ES. Urinary tract infections in adults. American family physician. 1999;59(5):1225–1234. 1237. [PubMed] [Google Scholar]
- 11.Ranjan R, Rani A, Metwally A, McGee HS, Perkins DL. Analysis of the microbiome: Advantages of whole genome shotgun versus 16S amplicon sequencing. Biochem Biophys Res Commun. 2016;469(4):967–977. doi: 10.1016/j.bbrc.2015.12.083. [DOI] [PMC free article] [PubMed] [Google Scholar]
- 12.Arumugam M, Raes J, Pelletier E, et al. Enterotypes of the human gut microbiome. Nature. 2011;473(7346):174–180. doi: 10.1038/nature09944. [DOI] [PMC free article] [PubMed] [Google Scholar]
- 13.Li J, Jia H, Cai X, et al. An integrated catalog of reference genes in the human gut microbiome. Nat Biotechnol. 2014;32(8):834–841. doi: 10.1038/nbt.2942. [DOI] [PubMed] [Google Scholar]
- 14.Meyer F, Paarmann D, D’Souza M, et al. The metagenomics RAST server - a public resource for the automatic phylogenetic and functional analysis of metagenomes. BMC Bioinformat. 2008;9:386. doi: 10.1186/1471-2105-9-386. [DOI] [PMC free article] [PubMed] [Google Scholar]
- 15.Kanehisa M, Goto S, Sato Y, Kawashima M, Furumichi M, Tanabe M. Data, information, knowledge and principle: back to metabolism in KEGG. Nucleic Acids Res. 2014;42(Database issue):D199–205. doi: 10.1093/nar/gkt1076. [DOI] [PMC free article] [PubMed] [Google Scholar]
- 16.Parks DH, Tyson GW, Hugenholtz P, Beiko RG. STAMP: statistical analysis of taxonomic and functional profiles. Bioinformatics. 2014;30(21):3123–3124. doi: 10.1093/bioinformatics/btu494. [DOI] [PMC free article] [PubMed] [Google Scholar]
- 17.Arndt D, Xia J, Liu Y, et al. METAGENassist: a comprehensive web server for comparative metagenomics. Nucleic Acids Res. 2012;40(Web Server issue):W88–95. doi: 10.1093/nar/gks497. [DOI] [PMC free article] [PubMed] [Google Scholar]
- 18.Janssen A, Kaiser S, Meissner K, Brenke N, Menot L, Martinez Arbizu P. A reverse taxonomic approach to assess macrofaunal distribution patterns in abyssal Pacific polymetallic nodule fields. PLoS One. 2015;10(2):e0117790. doi: 10.1371/journal.pone.0117790. [DOI] [PMC free article] [PubMed] [Google Scholar]
- 19.Ott SJ, Musfeldt M, Wenderoth DF, et al. Reduction in diversity of the colonic mucosa associated bacterial microflora in patients with active inflammatory bowel disease. Gut. 2004;53(5):685–693. doi: 10.1136/gut.2003.025403. [DOI] [PMC free article] [PubMed] [Google Scholar]
- 20.Stewart EJ. Growing unculturable bacteria. J Bacteriol. 2012;194(16):4151–4160. doi: 10.1128/JB.00345-12. [DOI] [PMC free article] [PubMed] [Google Scholar]
- 21.Fricke WF, Maddox C, Song Y, Bromberg JS. Human microbiota characterization in the course of renal transplantation. Am J Transplant. 2014;14(2):416–427. doi: 10.1111/ajt.12588. [DOI] [PubMed] [Google Scholar]
- 22.Stelzmueller I, Biebl M, Wiesmayr S, et al. Ralstonia pickettii—innocent bystander or a potential threat? Clin Microbiol Infect. 2006;12(2):99–101. doi: 10.1111/j.1469-0691.2005.01309.x. [DOI] [PubMed] [Google Scholar]
- 23.Nelson DE, Dong Q, Van der Pol B, et al. Bacterial communities of the coronal sulcus and distal urethra of adolescent males. PLoS One. 2012;7(5):e36298. doi: 10.1371/journal.pone.0036298. [DOI] [PMC free article] [PubMed] [Google Scholar]
- 24.Huovinen P, Sundstrom L, Swedberg G, Skold O. Trimethoprim and sulfonamide resistance. Antimicrob Agents Chemother. 1995;39(2):279–289. doi: 10.1128/aac.39.2.279. [DOI] [PMC free article] [PubMed] [Google Scholar]
- 25.Then RL. Mechanisms of resistance to trimethoprim, the sulfonamides, and trimethoprim-sulfamethoxazole. Rev Infect Dis. 1982;4(2):261–269. doi: 10.1093/clinids/4.2.261. [DOI] [PubMed] [Google Scholar]
Associated Data
This section collects any data citations, data availability statements, or supplementary materials included in this article.