

Abstract
An Adverse Event Following Immunization (AEFI) is an adverse reaction to a vaccination that goes above and beyond the usual side effects associated with vaccinations. One serious AEFI related to the smallpox vaccine is myopericarditis. Metabolomics involves the study of the low molecular weight metabolite profile of cells, tissues, and biological fluids, and provides a functional readout of the phenotype. Metabolomics may help identify a particular metabolic signature in serum of subjects who are predisposed to developing AEFIs. The goal of this study was to identify metabolic markers that may predict the development of adverse events following smallpox vaccination. Serum samples were collected from military personnel prior to and following receipt of smallpox vaccine. The study population included five subjects who were clinically diagnosed with myopericarditis, 30 subjects with asymptomatic elevation of troponins, and 31 subjects with systemic symptoms following immunization, and 34 subjects with no AEFI, serving as controls. Two-hundred pre- and post-smallpox vaccination sera were analyzed by untargeted metabolomics using 1H nuclear magnetic resonance (NMR) spectroscopy. Baseline (pre-) and post-vaccination samples from individuals who experienced clinically verified myocarditis or asymptomatic elevation of troponins were more metabolically distinguishable pre- and post-vaccination compared to individuals who only experienced systemic symptoms, or controls. Metabolomics profiles pre- and post-receipt of vaccine differed substantially when an AEFI resulted. This study is the first to describe pre- and post-vaccination metabolic profiles of subjects who developed an adverse event following immunization. The study demonstrates the promise of metabolites for determining mechanisms associated with subjects who develop AEFI and the potential to develop predictive biomarkers.
Keywords: Metabolomics, Vaccinations, Immunizations, Myocarditis, Subclinical Myocarditis, Adverse Events Following Immunizations (AEFI)
1. Introduction
Vaccinations are generally regarded as one of the most important public health achievements in the last century and have dramatically reduced the morbidity and (+Trop–Sx), Group 2 Subjects vaccine events resulting in asymptomatic elevation of troponins mortality from numerous infections caused by various bacteria and viruses. The literature is replete with data demonstrating vaccination safety and efficacy [1]. However, on rare occasions, immunization can be associated with an adverse event. An Adverse Event Following Immunization (AEFI) is an adverse reaction to a vaccination that goes above and beyond the usual side effects that are known to be associated with vaccinations. Some common side effects include redness at the local site of the vaccination, or rarely, a severe allergic reaction such as anaphylaxis [1]. Similarly, AEFI can vary in clinical severity from very mild to incapacitating. One serious AEFI related to the current smallpox vaccine is myopericarditis, which refers to inflammation of the myocardium, pericardium, or both. This inflammation can clinically manifest with symptoms such as chest pain, dyspnea, and palpitations [2], and it has been estimated that myopericarditis and subclinical myopericarditis (elevated cardiac biomarkers in the absence of clinical symptoms) occurs in 4.6 and 28.7 per 1,000 smallpox vaccinees, respectively [3]. Since 2002, millions of military service members have received the smallpox vaccine containing the vaccinia virus due to the potential use of smallpox as a bioterrorism agent [2]. In fact, if such an act were to occur, nearly 300 million doses of smallpox vaccine are available to immunize the US population [4]. Knowing and preparing for adverse events associated with this vaccine in a setting of a mass immunization campaign would be critical to providing quality immunization healthcare.
The ability to predict who may experience an AEFI could significantly impact immunization healthcare outcomes. Metabolomics, which is the study of the low molecular weight complement of a biological system, may be able to identify a metabolic signature or metabotype to identify individuals who may be predisposed to developing a serious AEFI [5, 6]. Metabolomics provides a point-in-time functional readout of the phenotype of an individual as determined by the influence of the sum total of genetic and environmental factors such as nutrition, medications, health or disease status and treatments or exposures [7]. Identification of a predictive metabotype or selected metabolites would allow clinicians to potentially mitigate serious AEFI and ultimately improve the quality of immunization healthcare. If identified, the contributing molecules might represent novel biomarkers of risk that can supplement existing clinical decision making for risk stratification or vaccine exemptions, as well as help identify vaccine candidates that are more reactogenic before they undergo large-phased studies seeking FDA approval [3]. Leveraging the science of metabolomics in an effort to improve the benefit-to-risk ratio of an immunization given to a healthy population might improve the quality of immunization programs, which is critically important in an era of increasing vaccine hesitancy. Therefore, this exploratory study was undertaken to determine whether a) metabotypes of baseline samples could be used for predicting adverse events following smallpox immunization, and b) to reveal potential biomarkers of AEFI by comparing case and control samples. This study compared the metabolic signatures from a subset of healthy military personnel who had reported adverse events following smallpox immunization compared to individuals reporting no symptoms.
2. Material & Methods
2.1. Study Subjects and Samples
Serum samples were collected from a subset of subjects who were previously enrolled in a multi-center, prospective, active surveillance cohort study of healthy subjects receiving the smallpox vaccine (DryVax® or ACAM 2000®) whose results have been published previously [3]. Samples from 100 active-duty military personnel who had previously provided informed consent for future vaccine research were obtained for analysis. Paired samples obtained prior to and 13-28 days following smallpox immunization (with or without other concomitant vaccines) were identified for analysis. The study population was broken down into four distinct clinical groups: five subjects with clinically diagnosed myopericarditis following immunization (Group 1, +MyoC); thirty subjects with asymptomatic elevation of troponins, often referred to as subclinical myocarditis (Group 2, +Trop–Sx); thirty-one subjects with a variety of systemic symptoms following immunization (SSFI) including arthralgias, myalgias, fevers and/or headache (Group 3); and thirty-four subjects with no reported symptoms or AEFI, which served as controls for immunization response (Group 4). All samples used in this study were stored in an ultralow, -80°C freezer and had no previous freeze/thaw cycles prior to preparation for metabolomics analysis. The Institutional Review Board of Womack Army Medical Center approved the study and informed consent for future vaccine research was obtained from all participants during the time of enrollment when the serum samples were originally obtained.
2.2. Metabolomics Sample Preparation and Data Acquisition
Serum samples (100 pre-vaccination and 100 post-vaccination) were extracted and analyzed by broad spectrum (untargeted) metabolomics using 1H NMR spectroscopy, as described previously [8-14]. Briefly, each serum sample was prepared by mixing an aliquot (400 μL) of each of the study serum samples with methanol. A 3:1 ratio of MeOH:Serum (1200:400 uL) was used for extraction to prepare the samples for metabolomics data acquisition and analysis. Samples were vortexed and centrifuged and 1000 μL of supernatant was transferred to new tubes and lyophilized to dryness. Samples were reconstituted in 700 μL of phosphate-buffered D2O master mix containing Chenomx ISTD (0.6 mM 4,4-dimethyl-4-silapentane-1-sulfonic acid (DSS-D6, Chemical Shift Indicator)) and 0.2 % NaN3. The samples were vortexed and centrifuged at 16,000 rcf for 5 min, then a 600 μL aliquot of each sample supernatant was transferred into 5 mm NMR tubes (Bruker-BioSpin, Switzerland) for data acquisition. In addition, phenotypic pooled serum samples were made by combining aliquots from each of the study samples that belong to the same phenotype (Groups 1-4). A representative pooled sample was also made using aliquots from 25 randomly selected samples. Three aliquots of each of the phenotypic pooled serum samples and ten aliquots of the representative pooled sample (400 μL each) were created and prepared identical to the individual serum samples. NMR spectra were acquired for the individual study samples and the pooled samples on a Bruker Avance III 700 MHz NMR spectrometer (Bruker-Biospin, Rheinstetten, Germany) using a cryogenically cooled 5 mm ATMA probe at 25 °C and a 1D NOESY presaturation pulse sequence (noesypr1d) [9]. 1H NMR spectra were preprocessed using ACD NMR Processor 12.0 software (Advanced Chemistry Development, Toronto, ON, Canada). Spectra were binned (0.07-8.50 ppm) using intelligent bucketing integration with a 0.04 ppm bucket width and a 50% looseness factor. Chemical shift regions for water (4.66-5.16 ppm) and methanol (3.30-3.37 ppm) were excluded from binning. Each of the bin integrals were normalized to the total integral of each spectrum.
2.3. Multivariate and Statistical Analysis
Multivariate analysis, including principal component analysis (PCA) and orthogonal partial least squares discriminant analysis (OPLS-DA), using the normalized binned data that was first Pareto scaled and mean centered was performed using MKS Data Analytics Solutions' SIMCA 14.1 (Umetrics, Umeå, Sweden). The PCA scores plots were inspected to ensure that the phenotypic pooled samples were tightly clustered in the center of phenotypic groups and that the pools created from the representative sample were clustered in the center of samples used to create this pool, a quality control method that is widely used in metabolomic studies [15]. Loadings plots and variable influence on projection (VIP) plots were inspected. The VIP statistic summarizes the importance of the bin in differentiating the study groups and for pre-versus post-vaccination comparisons within a study group in multivariate space [15]. All models used a 7-fold cross-validation to assess the predictive variation of the model (Q2).
Statistical analyses were conducted using SAS 9.4 (SAS Institute Inc., Cary, NC). Statistical tests for pre- and post-vaccination comparisons of continuous variables used either the paired t-test or the Wilcoxon Signed Rank test when the sample sizes were small. In this exploratory analysis, p-values were not adjusted for multiple testing [16].
Bins that met one of the following three criteria were determined to be important for differentiating the study groups: 1) VIP ≥ 1.0 with a jack-knife confidence interval that did not include 0, 2) magnitude of the fold change ≥ 2, or 3) p-value < 0.10. The range of the fold change is provided for cases where metabolites signals are in more than one bin and the direction of change is not related to the magnitude of the VIP, and cannot be directly correlated. The peaks found in bins that were important to differentiating the study groups were matched to metabolites using Chenomx NMR Suite 8.1 Professional software (Edmonton, Alberta, Canada), which has a library of approximately 350 compounds.
All raw and processed analytical data and associated de-identified metadata have been uploaded to the public accessible NIH Common Fund Metabolomics Data Repository(http://www.metabolomicsworkbench.org/data/DRCCMetadata.php?Mode=Project&ProjectID=PR000339).
3. Results
3.1. Characteristics of the study participants
Population demographics by phenotypic group are outlined in Table 1. The mean age of participants was 23.3 years (standard deviation 6.1) and 90% of the study participants were males. This population reflects the general population of our recruitment pool, which consisted of active-duty military personnel. Self-reported data on race and ethnicity was collected during the consent process of the original study and this sample included 72% Caucasians, 9% African-Americans, 9% Hispanics, 5% Asians, and 5% reported “other” for ethnicity. The average weight of the study population was 78.86 kg (standard deviation 10.02 kg). Prior to immunization, 70% of study participants considered themselves in excellent health while 29% considered themselves in good health. Post-vaccination, 54% of participants considered themselves in excellent health; the remaining participants considered themselves in good health (43%) or fair health (3%) post-vaccination.
Table 1.
Characteristics of study participants by immunization group.
| Characteristic | + MyoC (n=5) | +Trop - Sx (n=30) | SSFI (n=31) | no AEFI (n=34) | Overall Sample (n=100) |
|---|---|---|---|---|---|
| Age, years (Mean, SD) | 26.6 (6.9) | 21.7 (3.3) | 24.4 (7.4) | 23.2 (6.5) | 23.3 (6.1) |
| Male, n(%) | 4 (80%) | 29 (96.7%) | 27 (87.1%) | 30 (88.24%) | 90 (90%) |
| Race/Ethnicity, n(%) | |||||
| White | 5 (100%) | 21 (70%) | 23 (74.2%) | 23 (67.7%) | 72 (72%) |
| Black | 0 | 1 (3.3%) | 3 (9.7%) | 5 (14.7%) | 9 (9%) |
| Hispanic | 0 | 3 (10%) | 4 (12.9%) | 2 (5.9%) | 9 (9%) |
| Asian | 0 | 3 (10%) | 0 | 2 (5.9%) | 5 (5%) |
| Other | 0 | 2 (6.7%) | 1 (3.2%) | 2 (5.9%) | 5 (5%) |
| Non-Smoker * | 2 (40%) | 22 (73.3%) | 13 (41.9%) | 21 (61.8%) | 58 (58%) |
| Pre-Vaccine Health Self-Assessment | |||||
| Excellent | 3 (60%) | 23 (76.7%) | 16 (51.6%) | 28 (82.4%) | 70 (70%) |
| Good | 1 (20%) | 7 (23.3%) | 15 (48.4%) | 6 (17.6%) | 29 (29%) |
| Fair | 1 (20%) | 0 (0%) | 0 (0%) | 0 (0%) | 1 (1%) |
| Poor | 0 (0%) | 0 (0%) | 0 (0%) | 0 (0%) | 0 (0%) |
| Post-Vaccine Health Self-Assessment | |||||
| Excellent | 1 (20%) | 20 (66.7%) | 10 (32.2%) | 23 (67.6%) | 54 (54%) |
| Good | 4 (80%) | 9 (30%) | 19 (61.3%) | 11 (32.4%) | 43 (43%) |
| Fair | 0 (0%) | 1 (3.3%) | 2 (6.5%) | 0 (0%) | 3 (3%) |
| Poor | 0 (0%) | 0 (0%) | 0 (0%) | 0 (0%) | 0 (0%) |
| Family History of CAD | 1 (20%) | 2 (6.9%) | 2 (6.5%) | 6 (17.7%) | 11 (11%) |
never smoker, former (>1 year). Participants in Group 1 had clinically diagnosed myocarditis (+MyoC), in Group 2 had subclinical myocarditis and exhibited elevated serum levels of troponin T (+Trop–Sx), Group 3 only reported systemic symptoms following immunization (SSFI) and Group 4 participants reported no symptoms and thus had no adverse event following immunization (no AEFI). Coronary artery disease (CAD).
Group 1 subjects represented a clinical cohort of five participants identified from our original study [3] who met the clinical case definition of myocarditis or pericarditis by evidence of cardiac symptoms of chest pain and/or dyspnea and palpitation with objective evidence of myocardial injury based upon electrocardiogram (ECG) changes and/or elevated troponin T values. Thirty subjects were retrospectively assigned to Group 2 and represented subjects without reported symptoms, but who were found to have elevated serum Troponin T levels, consistent with our previously proposed case definition of subclinical myocarditis [3]. The clinical significance of these asymptomatic elevations remains unknown but in general, release of cardiac biomarker indicates myocardial injury [17-19]. None of these subjects reported symptoms of chest pain, dyspnea or palpitations, and none had significant ECG changes. Thirty-one subjects were retrospectively assigned to Group 3 and represented a cohort of subjects with a myriad of subjective symptoms, such as myalgias, arthralgias, headaches and/or fevers. No one in Group 3 experienced chest pain, dyspnea or palpitations or had elevated serum troponins or abnormal ECG findings. Finally, subjects assigned to Group 4 represented our control group for vaccination response. This group consisted of 34 subjects without any systemic symptoms or AEFI and lacked any objective evidence of myocardial injury.
3.2. Metabolomics
An untargeted 1H NMR metabolomics exploratory study was conducted on pre- and post-vaccination serum samples to investigate whether a distinct metabolic signature could be identified that distinguished individuals who suffered AEFI following smallpox vaccination from those who experienced no symptoms (Groups 1 - 3 vs. Group 4). No clear separation of the different vaccination study groups were observed in the unsupervised PCA analysis using either all pre-vaccine samples (Figure 1A) or all post-vaccine samples (Figure 1B) for this cohort. The results of the supervised OPLS-DA analysis comparing pre- and post-vaccine samples within an individual phenotypic group indicate that there is a metabolic signature that differentiates pre- and post-vaccine samples from subjects exhibiting myocarditis (Group 1, Figure 2A [R2X(cum) = 0.867, R2Y(cum) = 0.948, Q2(cum) = 0.332]) and from those subjects exhibiting asymptomatic elevation of troponins (Group 2, Figure 2B [R2X(cum) = 0.763, R2Y(cum) = 0.597, Q2(cum) = 0.219]). Less clear separations were observed between the pre-and post-vaccination samples for those subjects who experienced only systemic symptoms (Group 3, Figure 2C [R2X(cum) = 0.696, R2Y(cum) = 0.458, Q2(cum) = -0.749]) or reported no symptoms (Group 4, Figure 2D [R2X(cum) = 0.849, R2Y(cum) = 0.471, Q2(cum) = -0.108]). Additionally, the multivariate models for Groups 3 and 4 have a negative Q2, which indicates the model results may not be consistent in a different study sample. Thus, the groups of individuals who either experienced myocarditis or asymptomatic elevation of troponin (subclinical myocarditis) were more distinguishable by metabolic profiles following vaccination with the smallpox vaccine from their pre-vaccination profiles compared to either groups of individuals that only experienced systemic symptoms (Group 3) or controls (Group 4).
Figure 1. Unsupervised multivariate analyses comparing all pre-vaccine and post-vaccine samples.
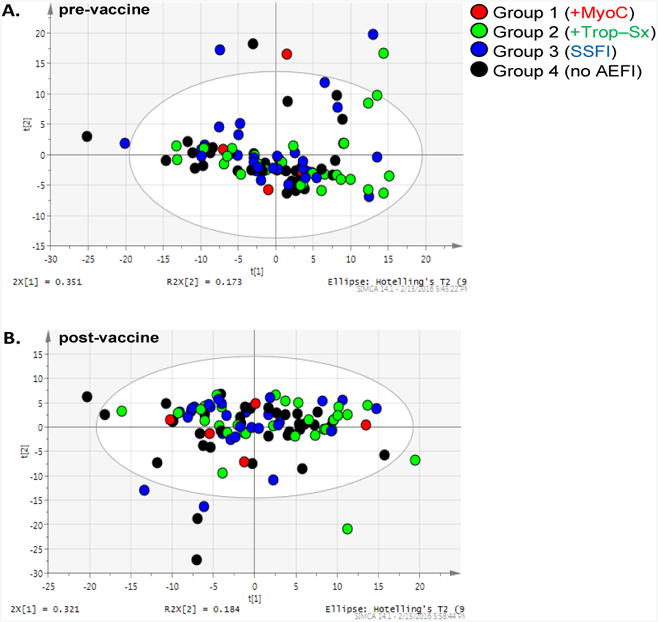
(A.) Principal Components Analysis (PCA) of all pre-vaccine serum samples across four immunization Groups. [R2X(cum) = 0.911, Q2(cum) = 0.683]. (B.) PCA of all post-vaccine samples across four Groups. [R2X(cum) = 0.908, Q2(cum) = 0.615].
Figure 2. Supervised multivariate analyses comparing pre-vaccine to post-vaccine profiles for each immunization Group.
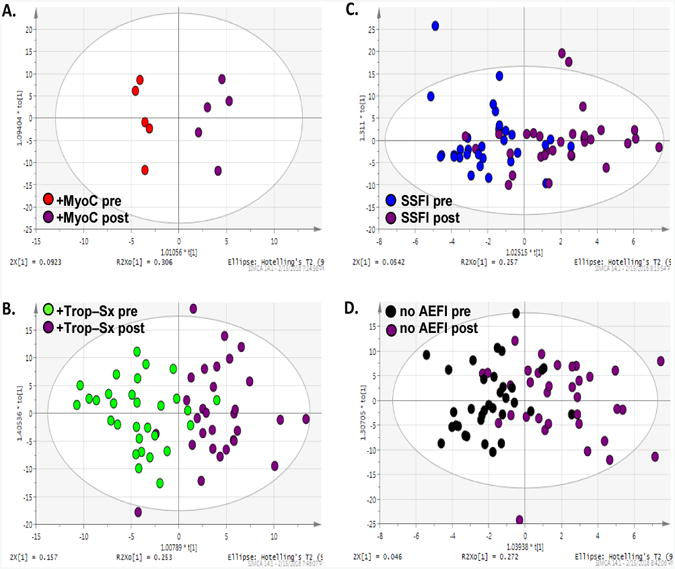
The scores plots of pairwise orthogonal least squares discriminant analyses (OPLS-DA). (A.) Group 1 (+MyoC) pre-versus post-vaccination profiles, [R2X(cum) = 0.867, R2Y(cum) = 0.948, Q2(cum) = 0.332]. (B.) Group 2 (+Trop–Sx) pre- versus post-vaccination profiles, [R2X(cum) = 0.763, R2Y(cum) = 0.597, Q2(cum) = 0.219]. (C.) Group 3 (SSFI) pre- versus post-vaccination profiles, [R2X(cum) = 0.696, R2Y(cum) = 0.458, Q2(cum) = -0.749]. (D.) Group 4 (no AEFI) pre- versus post-vaccination profiles, [R2X(cum) = 0.849, R2Y(cum) = 0.471, Q2(cum) = -0.108].
Bins important for differentiating pre- and post-vaccine samples in the subjects with clinically diagnosed myopericarditis (Group 1) or asymptomatic elevations of troponins without any clinical symptoms (Group 2) were library-matched and are listed in Table 2 with their corresponding VIP, p-values and fold changes. Metabolites important for differentiating pre- and post-vaccination samples for Group 1 (myocarditis) included creatinine/creatine/creatine phosphate/lysine and propylene glycol. Metabolites important for differentiating Group 2 (asymptomatic elevations of troponins) included lactate/threonine, alanine and lactate. There were 30 metabolites identified in the Control Group and at least one of the AEFI Groups. These metabolites are not discussed because our study questions focus on the differences among the AEFI groups. Table 3, lists all identified metabolites important to differentiating the pre- and post-vaccination samples for Group 1 (myocarditis) and that were also important to differentiating Group 2 (asymptomatic elevations of troponins) samples (excluding those metabolites that were also in common with the Control Group). Some of the metabolites unique to differentiating pre- and post-vaccination samples for Group 2 and not identified in the Control Group included 2-Aminobutyrate, Choline, Glutamate, Glutamine and Methionine (Table 3). There were 4 metabolites found in common between the three clinical groups with reported AEFI that were not found to be important in differentiating the pre- and post-vaccine profiles in our control group (Group 4) (Figure 3). Specifically, creatinine, fructose, histidine and serine were unique to those with AEFI. Creatinine was decreased in all the groups with AEFI post-vaccination and was not found to be a significant metabolite in the control group post-vaccination. Histidine, fructose and serine were all decreased post-vaccination in those with evidence of myocardial injury (Groups 1 and 2) but elevated in those with systemic symptoms without myocardial injury (Group 3) post-vaccination. Histidine, fructose and serine were not identified as significant metabolites in the control group post-vaccination. A similar discordance was found among the lipid metabolites, with post-vaccination subjects with evidence of myocardial injury having significantly elevated VLDL and LDL levels. Whereas those subjects with systemic symptoms without any evidence of myocardial injury, as well as the control group, had decreased levels of VLDL and LDL post-vaccination.
Table 2.
Library-matched metabolites from NMR bins important to differentiating pre-and post-vaccine samples for Group 1 (+MyoC) or Group 2 (+Trop–Sx).
| Group 1 Library-matched Metabolites | VIP | p-value* | Fold Change** |
|---|---|---|---|
| 2-oxoisocaproate | 0.5 | 0.063 | 1.1 |
| 3-Methyl-2-oxovalerate | 0.6 | 0.063 | -1.1 |
| Acetate | Lysine | Arginine | 1.8 | 0.063 | -1.1 |
| Creatine | Creatine Phosphate | Tyrosine | 1.3 | 1 | -1.3 |
| Creatinine | Creatine | Creatine phosphate | Lysine | 2.7 | 0.063 | -1.3 |
| Fructose | Histidine | Phenylalanine | Serine | 1.4 | 1 | -1.2 |
| Glucose (5 bins) | 1.3 - 2.5 | 0.063 - 0.625 | -1 - 1 |
| Glucose | Unsaturated lipids | 1.2 | 0.813 | 1.1 |
| Lactate | 1.5 | 0.625 | -1.2 |
| Leucine (2 bins) | 1 - 2.1 | 0.063 | -1.1 - -1.1 |
| Lipids (2 bins) | 0.7 - 0.9 | 0.063 | -1.1 - -1.1 |
| Lysine | Arginine | 0.8 | 0.063 | -1.1 |
| Overlap (4 bins) | 0.6 - 1.5 | 0.063 - 1 | 1.3 - 7.8 |
| Proline | 1 | 0.063 | -1.1 |
| Propylene glycol | 1.6 | 0.063 | -1.4 |
| Taurine | Betaine | Glucose | TMAO | 2 | 0.813 | -1 |
| Unknown | 0.9 | 0.625 | -5.6 |
| VLDL | LDL | HDL | Isocaproate | 1.4 | 0.438 | 1.1 |
|
| |||
| Group 2 Library-matched Metabolites | VIP | p-value† | Fold Change†† |
|
| |||
| 2-Aminobutyrate (2 bins) | 0.4 - 0.5 | 0.003 - 0.02 | -1.1 - -1.1 |
| 2-oxoisocaproate | 0.4 | 0.034 | -1.1 |
| 3-Hydroxybutyrate | VLDL | LDL | 2.1 | 0.451 | -1.1 |
| 3-Methyl-2-oxovalerate | 0.6 | 0.006 | -1.1 |
| Acetate | Lysine | Arginine | 0.9 | 0.017 | -1.1 |
| Alanine | 2.8 | <.001 | -1.2 |
| Arabinose | 0.1 | 0.282 | 2.4 |
| Asparagine (3 bins) | 0.4 - 0.9 | 0.005 - 0.027 | -1.2 - -1.1 |
| Asparagine | N,N-Dimethylglycine | 0.6 | 0.013 | -1.1 |
| Choline | O-Phosphocholine | sn-Glycero-3-phosphocholine | 1.8 | 0.008 | -1.1 |
| Citrate (2 bins) | 0.7 - 0.9 | <.001 - 0.002 | -1.2 - -1.1 |
| Citrate | Glutamine | 0.5 | 0.095 | -1.1 |
| Creatine | Creatine Phosphate | Tyrosine | 1.1 | 0.476 | -1.1 |
| Creatinine | Creatine | Creatine phosphate | Lysine | 1.3 | 0.006 | -1.1 |
| Fructose | Histidine | Phenylalanine | Serine | 1.3 | 0.315 | -1.1 |
| Glucose (8 bins) | 1.6 - 3.9 | <.001 - 0.017 | 1 - 1.2 |
| Glucose | Glycerol | 2 | 0.001 | 1.1 |
| Glucose | Unsaturated lipids | 2 | <.001 | 1.1 |
| Glutamate | Proline | 0.8 | 0.001 | -1.1 |
| Glutamine (3 bins) | 0.8 - 1.6 | <.001 - 0.051 | -1.1 - -1.1 |
| Isoleucine | 3-Methyl-2-isovalerate | 0.6 | 0.012 | -1.1 |
| Isoleucine | Leucine | 1.3 | 0.629 | -1 |
| Isoleucine | Valine | 1.1 | 0.372 | -1 |
| Lactate | 2.3 | 0.025 | -1.2 |
| Lactate | Threonine | 4.7 | 0.014 | -1.2 |
| Leucine (2 bins) | 0.4 - 1 | 0.068 - 0.125 | -1.1 - -1.1 |
| Lipids (3 bins) | 0.5 - 1.1 | <.001 - 0.002 | -1.2 - -1.1 |
| Lysine (2 bins) | 0.5 - 0.5 | 0.02 - 0.069 | -1.1 - -1.1 |
| Lysine | Arginine | 0.6 | 0.002 | -1.1 |
| Overlap (9 bins) | 0.2 - 1.3 | 0.004 - 0.476 | -1.2 - 3.3 |
| Proline (2 bins) | 0.7 - 1.3 | <.001 - 0.006 | -1.1 - -1.1 |
| Propylene glycol | 0.9 | 0.003 | -1.2 |
| Taurine | Betaine | Glucose | TMAO | 1.9 | 0.507 | 1 |
| Trimethylamine | 0.4 | 0.033 | -1.1 |
| Unknown (2 bins) | 0.3 - 0.6 | 0.001 - 0.103 | -1.1 - 4.8 |
| Unsaturated lipids | 1 | 0.212 | -1.1 |
| VLDL | LDL | 1.3 | 0.934 | 1 |
| VLDL | LDL | HDL | Isocaproate | 1.4 | 0.11 | -1.1 |
| sn-Glycero-3-phosphocholine | 0.9 | 0.094 | -1.3 |
The metabolites listed in the top section of the table are important to differentiating the metabolic profiles between Group 1 (+MyoC) pre-vaccine compared to post-vaccine serum samples, and are based on VIP ≥ 1 with a confidence interval not including 0 or a p-value < 0.10. VIP = variable influence on projection.
Wilcoxon Signed Rank Test.
A positive fold change indicates the median bin intensity of post-vaccine > median of pre-vaccine. The range of the fold change is provided for cases where metabolites signals are in more than one bin. The metabolites listed in the bottom section of the table are important to differentiating the metabolic profiles between Group 2 (+Trop-Sx) pre-vaccine compared to post-vaccine serum samples, and are based on the same criteria.
Paired t-test.
A positive fold change indicates the mean bin intensity of post-vaccine > mean of pre-vaccine.
Table 3.
Metabolites common and unique between Group 1 (+MyoC) and Group 2 (+Trop–Sx).
| Common Library-matched Metabolites | Unique Group 2 Metabolites |
|---|---|
|
| |
| 2-oxoisocaproate | 2-Aminobutyrate |
| 3-Methyl-2-oxovalerate | 3-Hydroxybutyrate |
| Acetate | 3-Methyl-2-isovalerate |
| Arginine | Alanine |
| Betaine | Arabinose |
| Creatine | Asparagine |
| Creatine Phosphate | Choline |
| Creatinine | Citrate |
| Fructose | Glutamate |
| Glucose | Glutamine |
| Histidine | Isoleucine |
| Isocaproate | Methionine |
| LDL | O-Phosphocholine |
| Leucine | sn-Glycero-3-phosphocholine |
| Lipids | Threonine |
| Lysine | Trimethylamine |
| Phenylalanine | Valine |
| Proline | |
| Propylene glycol | |
| Serine | |
| Taurine | |
| TMAO | |
| Tyrosine | |
| Unsaturated lipids | |
| VLDL | |
There were no unique library-match ed metabolites for Group 1 (+MyoC) compared to Group 2, and 19 metabolites unique to Group 2 (+Trop–Sx).
Figure 3. Venn diagram of common and unique metabolites for all AEFI Groups.
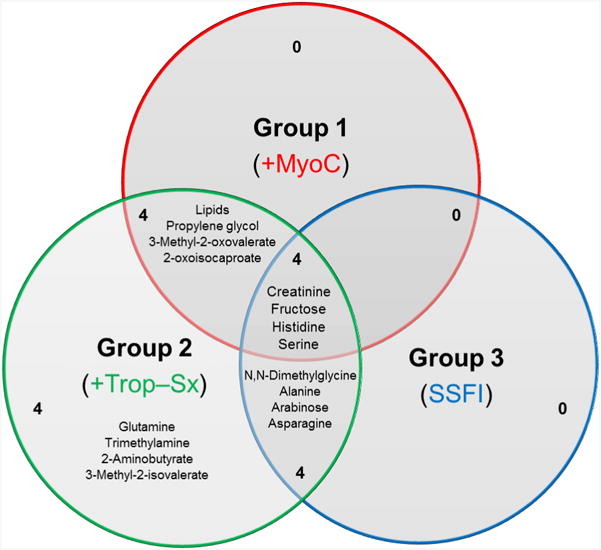
A comparison of the library-matched metabolites important for differentiating the pre- and post-vaccination profiles for the three AEFI Groups. The diagram highlights the number of common and unique metabolites for the Groups that reported an AEFI.
4. Discussion
Metabolomics is an emerging field capable of identifying biomarkers and alterations in biochemical pathways that has great promise in better understanding a myriad of medical conditions and may ultimately help scientists develop new and improved strategies for prevention and treatment of disease. Our exploratory study is the first to look at the metabolic profile of a large cohort of active duty military personnel who received a live virus vaccine (DryVax® or ACAM 2000® smallpox vaccine), and includes vaccine recipients who subsequently developed an adverse event following immunization. Here we describe for the first time the pre- and post-vaccination metabolic profiling of subjects who received the live virus smallpox vaccine, as well as the metabolic profiles of participants who developed adverse effects following immunization.
Identifying a metabolic signature that could detect individuals at risk for AEFI was one of the goals of this exploratory study. Such ability could drastically change the approach to immunizations and help vaccinologists cross the threshold of personalized immunization healthcare. This exploratory study did not identify any unique metabotypes or metabolic signatures pre-vaccination that were able to predict which individuals developed an adverse event following immunization. However, additional metabolomics analysis with different vaccines and better defined AEFI such as Brighton Collaboration case definitions may lead to such metabotype identifications in the future. We suggest that additional metabolomics analysis in the field of vaccinology is warranted.
On the other hand, broad spectrum metabolomics differentiated pre- and post-vaccination samples for those individuals with serious AEFIs (myopericarditis or asymptomatic elevation of cardiac biomarkers). There was less clear differentiation among participants who had only systemic symptoms following immunizations or no adverse events following immunizations.
Interestingly, there were a few metabolites unique to the three clinical groups with AEFI. These metabolites included creatinine, fructose, histidine and serine. Although the clinical significance of these unique metabolites remains to be clearly elucidated, previous research has demonstrated similar findings in those with systemic lupus erythematosus (SLE) [20]. In fact, Ouyang et al. and colleagues identified a very similar metabotype in patients with SLE using NMR spectroscopy [21]. They demonstrated that subjects with SLE had serum samples with decreased concentrations of histidine and creatinine and increased levels of VLDL and LDL not unlike our subjects. We suggest that such a metabotype may predispose individuals to myocardial injury, warranting further investigation.
Others have also noticed a correlation between inflammation, heart disease, and low levels of the amino acid histidine [22]. Watanabe and colleagues clearly demonstrated that plasma histidine levels were significantly lower in patients with chronic kidney disease and a history of cardiovascular disease as well as inflammation. They concluded that low plasma concentrations of this amino acid were associated with inflammation, oxidative stress and greater mortality in their patient population of chronic kidney disease patients.
Serine was another amino acid found to be decreased in subjects with myocardial injury following vaccination (groups 1 and 2) compared to these subjects' pre-vaccination levels and other investigators have noticed this metabolite to be associated with cerebral ischemia [23]. Serine is a known amino acid neurotransmitter that can inhibit glutamate and GABA receptors, and elevated levels have been demonstrated in rat cerebral ischemia [23]. However, its role in human myocarditis and general inflammation is not as well defined. We suggest that further research into this metabolite and its role, if any, in myocarditis should be further explored, especially in the context of vaccination response.
In summary, there is increasing evidence on the underlying mechanism of inflammation and the role of metabolites as both mediators and by-products of this process [20, 24], which upon further investigation may be found to play an important role in serious adverse events following immunization. We describe for the first time the differences in the pre-vaccine and post-vaccine metabolic profiles of subjects with AEFI with a live virus vaccine. Our findings are consistent with previous studies showing that certain metabolites are closely associated with inflammation and possibly myocardial injury. The metabolites identified by our study as well as others warrant further research into their role in inflammatory processes, to include their possible role in myocarditis in general and as a complication from smallpox vaccination, as well as potential novel biomarkers for AEFI.
5. Conclusions
This exploratory study is the first to describe the metabolic profile that differentiates individuals (pre- and post-vaccination) who developed an adverse event following the smallpox immunization. Although we identified some metabolites unique among the subjects with AEFI (Groups 1-3), the clinical significance remains unknown, but the metabotypes identified with our subjects with evidence of myocardial injury is not inconsistent with previously described metabotypes found in other systemic inflammatory states such as SLE. The results of this exploratory study suggest that individuals may have differential responses to smallpox vaccination that can be detected by metabolic profiling. Baseline and post-vaccination metabolic profiles from subjects who experienced AEFI with clinically verified myocarditis or subclinical (elevated cardiac biomarkers) were more clearly differentiated in the multivariate analysis compared to subjects who experienced only systemic symptoms or no AEFI. These results need to be validated in a larger cohort. The current results demonstrate that additional metabolomics research is warranted in the field of vaccinology.
Highlights.
Metabolomics is the study of the small-molecule metabolite profile of an organism.
Metabolomics may help identify individuals predisposed to developing adverse events after vaccines.
Our study is first to describe pre- and post-vaccination metabolic profiles.
Profiles differ substantially when an adverse event after vaccination develops.
Acknowledgments
The authors thank the Service Member volunteers who participated in the parent study and permitted use of their serum for future research such as this study. The authors would also like to thank Dr. Renata Engler, the Principal Investigator of the original study, as without her tireless efforts, this study would not have been possible. Finally, we would like to thank Mr. Zachary Acuff (RTI) for assistance with preparation of tables for the manuscript, as well as Mrs. Nora Rachels and Mrs. Gervon Collins for assistance with data extraction.
Funding: The study was sponsored in part by the Defense Health Agency Immunization Healthcare Branch. The metabolomics study and analysis was funded by the NIH Common Fund Metabolomics Program (1U24DK097193, Sumner, PI).
Abbreviations
- AEFI
Adverse Events Following Immunizations
- NMR
nuclear magnetic resonance
- SSFI
systemic symptoms following immunization
- CAD
coronary artery disease
- DSS-D6
4-dimethyl-4-silapentane-1-sulfonic acid
- PCA
principal components analysis
- OPLS-DA
orthogonal partial least squares discriminant analysis
- VIP
Variable Influence on Projection
- ECG
electrocardiogram
- +MyoC
Group 1 Subjects vaccine events resulting in myocarditis
- +Trop-Sx
Group 2 Subjects vaccine events resulting in asymptomatic elevation of troponins
Footnotes
Contributors: All authors reviewed, edited and approved the manuscript.
Authorship: BMM, CES, YSC and SCJS conceived the experiments and designed the study. DAS, WWP, JPB and SLM prepared samples, acquired the data and performed the associated analyses. All authors were involved in drafting and revising the article for final approval prior to submission.
Conflicts of Interest: Study support (grant) as detailed above. Otherwise, no potential conflicts of interest relevant to this article are reported for any of the authors.
Disclaimer: The views expressed herein are those of the authors and do not reflect the official policy of the US Army Medical Department, Department of the Army, Department of Defense, or the U.S. Government; which played no role in study design, the collection, analysis, or interpretation of data, the writing of this article, or in the decision to submit this paper for publication.
Publisher's Disclaimer: This is a PDF file of an unedited manuscript that has been accepted for publication. As a service to our customers we are providing this early version of the manuscript. The manuscript will undergo copyediting, typesetting, and review of the resulting proof before it is published in its final citable form. Please note that during the production process errors may be discovered which could affect the content, and all legal disclaimers that apply to the journal pertain.
References
- 1.The National Academies, C.t.R.A.E.o.V.I.o.M. Adverse Effects of Vaccines: Evidence and Causality. In: Stratton K, et al., editors. Adverse Effects of Vaccines: Evidence and Causality. Washington (DC): 2011. [PubMed] [Google Scholar]
- 2.Eligibility, D.M.S.S.D.D.E. and R.S.D.I. Registry. [cited 2016 June 2016];Smallpox Vaccine Doses Data obtained from the Armed Forces Health Surveillance Center. 2012 Mar 14; Available from: AFHSC: www.afhsc.mil/home.
- 3.Engler RJ, et al. A prospective study of the incidence of myocarditis/pericarditis and new onset cardiac symptoms following smallpox and influenza vaccination. PLoS One. 2015;10(3):e0118283. doi: 10.1371/journal.pone.0118283. [DOI] [PMC free article] [PubMed] [Google Scholar]
- 4.Nalca A, Zumbrun EE. ACAM2000: the new smallpox vaccine for United States Strategic National Stockpile. Drug Des Devel Ther. 2010;4:71–9. doi: 10.2147/dddt.s3687. [DOI] [PMC free article] [PubMed] [Google Scholar]
- 5.Gavaghan CL, et al. An NMR-based metabonomic approach to investigate the biochemical consequences of genetic strain differences: application to the C57BL10J and Alpk:ApfCD mouse. FEBS Lett. 2000;484(3):169–74. doi: 10.1016/s0014-5793(00)02147-5. [DOI] [PubMed] [Google Scholar]
- 6.Stewart D, Dhungana S, Clark R, Pathmasiri W, McRitchie S, Sumner S. Omics technologies used in systems biology in environmental health and toxicology: From the genome to the epigenome. In: Fry R, editor. Systems Biology in Toxicology and Environmental Health. Academic Press; Waltham, MA: 2015. pp. 57–84. [Google Scholar]
- 7.Mayr M. Metabolomics: ready for the prime time? Circ Cardiovasc Genet. 2008;1(1):58–65. doi: 10.1161/CIRCGENETICS.108.808329. [DOI] [PubMed] [Google Scholar]
- 8.Banerjee R, et al. Metabolomics of brain and reproductive organs: characterizing the impact of gestational exposure to butylbenzyl phthalate on dams and resultant offspring. Metabolomics. 2012;8(6):1012–1025. [Google Scholar]
- 9.Beckonert O, et al. Metabolic profiling, metabolomic and metabonomic procedures for NMR spectroscopy of urine, plasma, serum and tissue extracts. Nat Protoc. 2007;2(11):2692–703. doi: 10.1038/nprot.2007.376. [DOI] [PubMed] [Google Scholar]
- 10.Church RJ, et al. A systems biology approach utilizing a mouse diversity panel identifies genetic differences influencing isoniazid-induced microvesicular steatosis. Toxicol Sci. 2014;140(2):481–92. doi: 10.1093/toxsci/kfu094. [DOI] [PMC free article] [PubMed] [Google Scholar]
- 11.Pathmasiri W, et al. Integrating metabolomic signatures and psychosocial parameters in responsivity to an immersion treatment model for adolescent obesity. Metabolomics. 2012;8(6):1037–1051. [Google Scholar]
- 12.Sumner S, et al. Metabolomics in the assessment of chemical-induced reproductive and developmental outcomes using non-invasive biological fluids: application to the study of butylbenzyl phthalate. Journal of Applied Toxicology. 2009;29(8):703–714. doi: 10.1002/jat.1462. [DOI] [PMC free article] [PubMed] [Google Scholar]
- 13.Sumner SC, et al. Distribution of carbon-14 labeled C60 ([14C]C60) in the pregnant and in the lactating dam and the effect of C60 exposure on the biochemical profile of urine. J Appl Toxicol. 2010;30(4):354–60. doi: 10.1002/jat.1503. [DOI] [PubMed] [Google Scholar]
- 14.Sumner SJ, et al. Metabolomics of urine for the assessment of microvesicular lipid accumulation in the liver following isoniazid exposure. Metabolomics. 2010;6(2):238–249. doi: 10.1007/s11306-010-0197-8. [DOI] [PMC free article] [PubMed] [Google Scholar]
- 15.Sumner SCJ, P W, Carlson JE, McRitchie SL, Fennell TR. Metabolomics. In: S RC, Hodgson E, editors. Molecular and Biochemical Toxicology. J Wiley and Sons; NY: 2016. [Google Scholar]
- 16.Bender R, Lange S. Adjusting for multiple testing--when and how? J Clin Epidemiol. 2001;54(4):343–9. doi: 10.1016/s0895-4356(00)00314-0. [DOI] [PubMed] [Google Scholar]
- 17.Babuin L, et al. Elevated cardiac troponin is an independent risk factor for short- and long-term mortality in medical intensive care unit patients. Crit Care Med. 2008;36(3):759–65. doi: 10.1097/CCM.0B013E318164E2E4. [DOI] [PubMed] [Google Scholar]
- 18.Oluleye OW, et al. Troponin T, B-type natriuretic peptide, C-reactive protein, and cause-specific mortality. Ann Epidemiol. 2013;23(2):66–73. doi: 10.1016/j.annepidem.2012.11.004. [DOI] [PMC free article] [PubMed] [Google Scholar]
- 19.Sabatine MS, et al. Detection of acute changes in circulating troponin in the setting of transient stress test-induced myocardial ischaemia using an ultrasensitive assay: results from TIMI 35. Eur Heart J. 2009;30(2):162–9. doi: 10.1093/eurheartj/ehn504. [DOI] [PMC free article] [PubMed] [Google Scholar]
- 20.Jutley GS, Young SP. Metabolomics to identify biomarkers and as a predictive tool in inflammatory diseases. Best Pract Res Clin Rheumatol. 2015;29(6):770–82. doi: 10.1016/j.berh.2016.02.010. [DOI] [PubMed] [Google Scholar]
- 21.Ouyang X, et al. (1)H NMR-based metabolomic study of metabolic profiling for systemic lupus erythematosus. Lupus. 2011;20(13):1411–20. doi: 10.1177/0961203311418707. [DOI] [PubMed] [Google Scholar]
- 22.Watanabe M, et al. Consequences of low plasma histidine in chronic kidney disease patients: associations with inflammation, oxidative stress, and mortality. Am J Clin Nutr. 2008;87(6):1860–6. doi: 10.1093/ajcn/87.6.1860. [DOI] [PubMed] [Google Scholar]
- 23.Liu M, et al. An Evidence-Based Review of Related Metabolites and Metabolic Network Research on Cerebral Ischemia. Oxid Med Cell Longev. 2016;2016:9162074. doi: 10.1155/2016/9162074. [DOI] [PMC free article] [PubMed] [Google Scholar]
- 24.Zhang A, et al. Metabolomics for Biomarker Discovery: Moving to the Clinic. Biomed Res Int. 2015;2015:354671. doi: 10.1155/2015/354671. [DOI] [PMC free article] [PubMed] [Google Scholar]