

Both gene- and transcript-targeted ablations of Actb expression demonstrate that βcyto-actin is more disruptive than γcyto-actin to primary fibroblast function. This is evident via a decrease in cell proliferation and cellular ATP and an increase in myofibroblast differentiation signaling and protein expression in Actb-null primary cells.
Abstract
The highly homologous β (βcyto) and γ (γcyto) cytoplasmic actins are hypothesized to carry out both redundant and unique essential functions, but studies using targeted gene knockout and siRNA-mediated transcript knockdown to examine βcyto- and γcyto-isoform–specific functions in various cell types have yielded conflicting data. Here we quantitatively characterized actin transcript and protein levels, as well as cellular phenotypes, in both gene- and transcript-targeted primary mouse embryonic fibroblasts. We found that the smooth muscle αsm-actin isoform was the dominantly expressed actin isoform in WT primary fibroblasts and was also the most dramatically up-regulated in primary βcyto- or β/γcyto-actin double-knockout fibroblasts. Gene targeting of βcyto-actin, but not γcyto-actin, led to greatly decreased cell proliferation, decreased levels of cellular ATP, and increased serum response factor signaling in primary fibroblasts, whereas immortalization induced by SV40 large T antigen supported fibroblast proliferation in the absence of βcyto-actin. Consistent with in vivo gene-targeting studies in mice, both gene- and transcript-targeting approaches demonstrate that the loss of βcyto-actin protein is more disruptive to primary fibroblast function than is the loss of γcyto-actin.
INTRODUCTION
Vertebrate actin isoforms, which are encoded by six different genes, share a very high degree of sequence homology and are completely conserved from birds to mammals (Rubenstein, 1990). Four of the actin isoforms are predominately expressed in smooth (αsm- and γsm-actin), cardiac (αca-actin), and skeletal (αsk-actin) muscles. The two cytoplasmic actins (βcyto- and γcyto-actin) are ubiquitously expressed in all cell types and differ at only four of 375 amino acids. Despite the remarkable conservation between the βcyto- and γcyto-actin sequences, purified recombinant βcyto- and γcyto-actin proteins display marked differences in dynamics in vitro (Bergeron et al., 2010). Furthermore, numerous studies of transcript/protein localization, protein overexpression, and disease-causing mutations have established a strong argument for unique functions supported by βcyto- or γcyto-actin (Khaitlina, 2001; Condeelis and Singer, 2005; Rubenstein and Wen, 2014). More recently, gene-targeting studies have been used to test for nonoverlapping functions of actin isoforms (Perrin and Ervasti, 2010). With regard to closely related βcyto- and γcyto-actins, the embryonic lethality of mice homozygous for severely hypomorphic (Shawlot et al., 1998; Shmerling et al., 2005) or null alleles of Actb (Bunnell and Ervasti, 2011) demonstrated that βcyto-actin is an essential gene. In contrast, γcyto-actin–null animals survive to term but display significant perinatal lethality, stunted growth, and decreased survival into adulthood (Belyantseva et al., 2009; Bunnell and Ervasti, 2010). The distinct auditory hair cell and deafness phenotypes in mice in which floxed Actb and Actg1 alleles were selectively ablated also support unique roles for βcyto- and γcyto-actin in some tissues (Perrin et al., 2010, 2013). On the other hand, mice with skeletal muscle–specific knockouts of either βcyto- or γcyto-actin each develop a similar myopathy, with progressive myofiber degeneration/regeneration and muscle weakness (Sonnemann et al., 2006; Prins et al., 2011), supporting that some functions of βcyto- and γcyto-actins are redundant in some tissues.
We previously investigated the isoform-specific functions of βcyto- and γcyto-actin in primary mouse embryonic fibroblasts (MEFs) from Actg1−/− animals (Bunnell and Ervasti, 2010; Bunnell et al., 2011) and from mice with floxed Actb alleles conditionally ablated by tamoxifen-inducible Cre recombinase (Bunnell et al., 2011). γcyto-Actin–null MEFs showed mild growth impairment and a small decrease in cell viability but were otherwise comparable to control cells in all other parameters tested (Bunnell and Ervasti, 2010; Bunnell et al., 2011). In contrast, βcyto-actin–knockout MEFs exhibited a wide range of more severe phenotypes (Bunnell et al., 2011). Ablation of βcyto-actin resulted in severe growth impairment and an increase in the percentage of multinucleate cells, suggesting a specific role for βcyto-actin in cell growth and division (Bunnell et al., 2011), as previously supported by localization of βcyto-actin to the cleavage furrow and contractile ring during cell division (Dugina et al., 2009). Furthermore, βcyto-actin–knockout cells exhibited significant migration defects that were not observed in γcyto-actin–null cells. The altered expression of genes that regulate the cell cycle and cell migration observed in βcyto-actin– but not γcyto-actin–knockout MEFs provided a potential explanation for the more severe phenotypes in βcyto-actin–knockout cells and early lethality in βcyto-actin–knockout embryos (Bunnell et al., 2011). It is also interesting that βcyto-actin–knockout MEFs exhibited some characteristics reminiscent of myofibroblasts, such as an increase in stress fibers and greatly elevated expression of αsm-actin (Bunnell et al., 2011).
In contrast to our results, four studies reached different conclusions that warrant further investigation. One study of immortalized βcyto-actin–knockout MEF lines transformed by SV40 large T antigen (Tondeleir et al., 2012) reported altered morphology, impaired migration, and up-regulation of αsm-actin similar to what we observed in primary Actb-null MEFs (Bunnell et al., 2011) but with no impairment of cell growth. Two studies using small interfering RNA (siRNA) methodologies reported that knockdown of γcyto-actin more dramatically impaired motility in human subcutaneous fibroblasts, spontaneously immortalized keratinocytes, and neuroblastoma SH-EP cells than did knockdown of βcyto-actin (Dugina et al., 2009; Shum et al., 2011). Most notably, the fourth study demonstrated specific up-regulation of myofibroblast-associated gene products (including αsm-actin) after siRNA knock down of γcyto-actin, but not βcyto-actin, in several epithelial cell lines (Lechuga et al., 2014). Although differences in methodologies and cell types studied are obvious explanations for the different outcomes, Lechuga et al. (2014) further speculated that the different results could depend on whether the ablated actin isoform was also the most abundant in the cell type under investigation.
To address the bases for differences between our studies (Bunnell and Ervasti, 2010; Bunnell et al., 2011) and those of others (Dugina et al., 2009; Shum et al., 2011; Tondeleir et al., 2012; Lechuga et al., 2014), we quantitatively profiled actin isoforms at both the transcript and the protein level. Because MEFs display extensive developmental and phenotypic heterogeneity (Singhal et al., 2016), we used adenovirus-5–mediated expression of Cre recombinase (Ad5-Cre) to ablate Actb and/or Actg1 in both primary and large T antigen immortalized MEFs controlled against the same MEFs infected with Ad5-GFP. αsm-Actin and βcyto-actin transcripts predominated in primary MEFs, whereas αsm-actin was most abundant at the protein level, with equivalent levels of βcyto- and γcyto-actin protein expressed despite their marked differences in transcript levels. We also found that immortalization by transformation with SV40 large T antigen appears to negate the essentiality of Actb observed in primary MEFs. Finally, siRNA-mediated transcript knockdown of Actb and Actg1 in the same cells used for gene-targeting studies yielded results similar to those observed after gene targeting. We conclude that the genetic reprogramming associated with immortalization by transformation with SV40 large T antigen can markedly influence the cellular response to βcyto- and γcyto-actin protein ablation.
RESULTS
Adenoviral Cre-mediated knockout of Actb and Actg1
Because primary MEFs display extensive developmental and phenotypic heterogeneity (Singhal et al., 2016), each of our biological replicates consisted of E13.5 primary MEFs obtained from a single mouse embryo carrying floxed alleles of Actb (ActbL/L; Bunnell et al., 2011), Actg1 (Actg1L/L; Sonnemann et al., 2006), or both Actb and Actg1 (ActbL/L Actg1L/L). MEFs from each animal were split into two pools, which were treated with Ad5–green fluorescent protein (GFP; Figure 1A) as a negative control or Ad5-Cre (Figure 1B) to conditionally knock out Actb (βcyto-actin KO), Actg1 (γcyto-actin KO), or both Actb and Actg1 (dKO). Quantitative reverse transcription PCR (qRT-PCR) analysis showed that Actb and Actg1 transcripts were reduced 95% by 3 d postinfection (dpi) in βcyto-actin KO, γcyto-actin KO, and dKO MEFs compared with controls (Figure 1, C–F). Western blot analysis revealed that βcyto- and γcyto-actin were each undetectable at 5 dpi in single βcyto-actin KO or γcyto-actin KO cells, respectively (Figure 1, G and H). In contrast, complete loss of βcyto- and γcyto-actin in dKO cells was observed at 9 dpi (Figure 1I). Thus Ad5-Cre was an efficient and robust method to eliminate both βcyto-and γcyto-actin transcripts and proteins in primary MEFs.
FIGURE 1:

Adenoviral Cre efficiently ablated βcyto- and γcyto-actin in primary MEFs. (A, B) Representative images of βcyto-actin CT and βcyto-actin KO cells at 7 dpi. Scale bar, 20 µm. (C–F) Representative qRT-PCR analysis of βcyto- and γcyto-actin transcript amount (picomoles) in ActbL/L, Actg1L/L, and ActbL/L Actg1L/L MEFs. (G–I) Representative relative Western blot analysis of MEF lysates probed with βcyto-actin and γcyto-actin antibodies; GAPDH served as loading control.
β-Actin KO MEFs are growth impaired with reduced ATP levels
We previously showed that tamoxifen-induced, cre-mediated ablation of βcyto-actin caused significant growth impairment in primary MEFs, whereas only a modest decrease in cell growth was observed in Actg1-/- MEFs (Bunnell and Ervasti, 2010; Bunnell et al., 2011). However, our previous experiments involved different methods of gene ablation for Actb and Actg1 and compared knockout MEFs with controls derived from different embryos (Bunnell and Ervasti, 2010; Bunnell et al., 2011). Therefore we more directly compared the effects of βcyto- versus γcyto-actin gene ablation on cell growth, using βcyto-actin KO and γcyto-actin KO MEFs. Under these more controlled conditions, γcyto-actin KO MEFs exhibited a normal growth rate, whereas both βcyto-actin KO and dKO MEFs displayed growth impairment by 3 dpi that became significantly different from controls at 7 dpi (Figure 2, A–C). Because growth deficiency was not previously observed in MEFs ablated for βcyto-actin expression after transformation by SV40 large T antigen (Tondeleir et al., 2012), we immortalized ActbL/L, Actg1L/L, and double ActbL/L Actg1L/L MEFs by transformation with SV40 large T antigen and measured cell growth after infection with either Ad5-Cre or Ad5-GFP. Both SV40 large T antigen immortalized βcyto-actin KO and γcyto-actin KO MEFs exhibited growth rates not different from controls (Supplemental Figure S1, A and B), suggesting that βcyto-actin is important for cell growth in primary MEFs but not in MEFs transformed by SV40 large T antigen. In contrast, SV40 large T antigen immortalized dKO MEFs displayed growth impairment that was significantly different from control at 8–10 dpi (Supplemental Figure S1C) but less severe than in primary MEFs, suggesting that MEFs immortalized by SV40 large T antigen transformation are able to circumvent the essential function supported by βcyto-actin in primary cells and during embryonic development.
FIGURE 2:
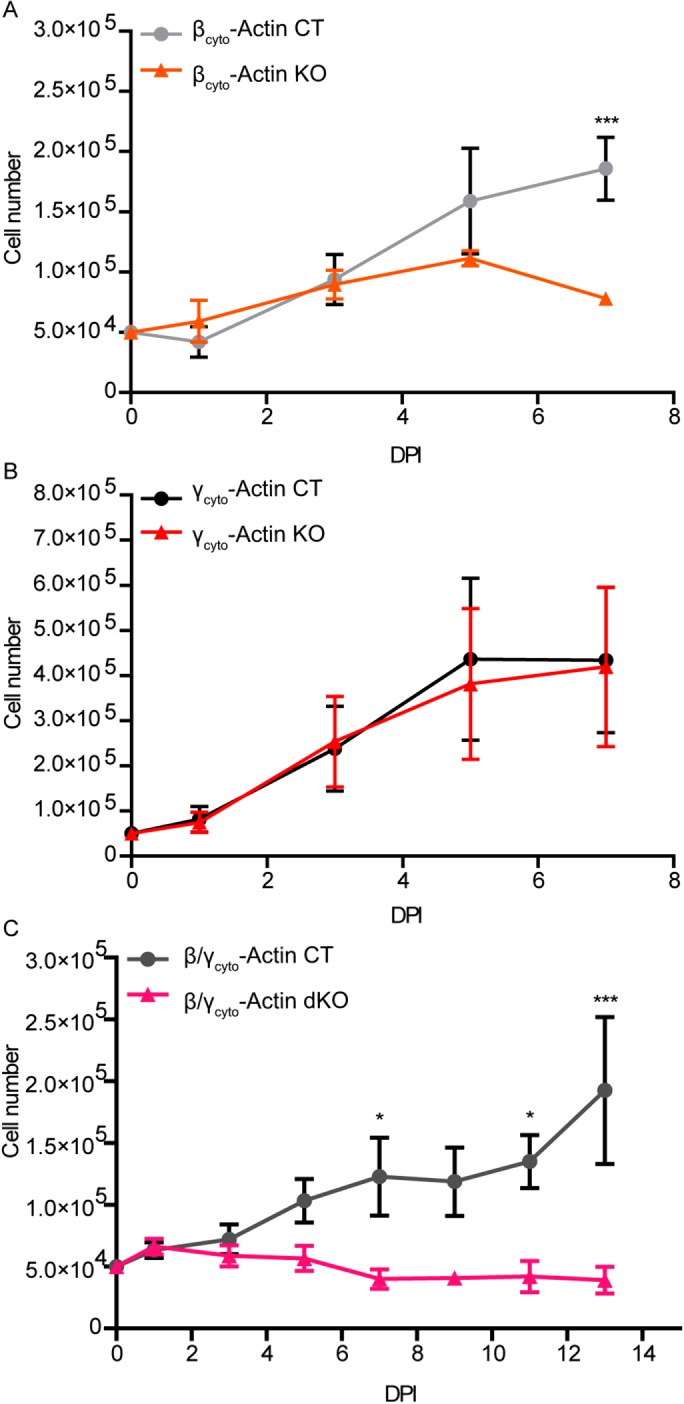
βcyto-actin deficient MEFs were growth impaired. (A–C) Growth curve analysis of ActbL/L, Actg1L/L, and ActbL/LActg1L/L MEFs treated with either Ad5-GFP or Ad5-Cre (n = 3, hand counted in duplicate). *p < 0.05, ***p < 0.001. Two-way ANOVA with Bonferroni posttest; error bars are SEM.
To assess whether growth deficiencies seen in βcyto-actin KO and dKO MEFs could potentially be due to decreases in energy availability, we used a luciferase-based assay to measure the relative levels of cellular ATP in βcyto-actin KO, γcyto-actin KO and dKO MEFs. Correlating with the deficiencies seen in growth, ATP levels were significantly decreased in βcyto-actin KO and dKO MEFs compared with controls but not in γcyto-actin KO MEFs (Figure 3A). However, Western blot analysis demonstrated that a number of proteins in the mitochondrial electron transport chain complexes were equivalent across the MEF lines tested (Figure 3, B and C), as were basal and maximal oxygen consumption rates measured in βcyto-actin KO and γcyto-actin KO MEFs using a Seahorse XF24 extracellular flux analyzer (Figure 3D). Therefore we conclude that the measured decreases in cellular ATP are not due to impaired mitochondrial function in βcyto-actin KO and dKO MEFs.
FIGURE 3:

βcyto-Actin–deficient MEFs displayed lower ATP levels but maintained ETC protein abundance. (A) ATP levels for CT and KO MEFs determined through a luciferase assay at 7 dpi. Results were normalized to cell number and relative to the paired embryo control (6 ≥ n ≥ 3). (B, C) Western blot and relative quantification of protein levels of succinate dehydrogenase complex, subunit A, flavoprotein (SDHA) for complex II; ubiquinol-cytochrome C reductase core protein I (UQCR) for complex III; mitochondrially encoded cytochrome C oxidase I (MTCO1) for complex IV; and ATP5a ATP synthase, H+ transporting, mitochondrial F1 complex, α-subunit (ATP5A) for the F1/F0 ATPase; GAPDH served as loading control. Levels were normalized to GAPDH and relative to the paired embryo control, which was set at 1 (n = 3). (D) Oxygen consumption rate of CT and KO MEFs at 7 dpi. Levels normalized to background. ***p < 0.001. One sample t test; error bars are SEM.
Quantitation of actin isoform transcript and protein levels in primary MEFs
We used qRT-PCR to measure transcript levels for all six actin isoforms in control, βcyto-actin KO, γcyto-actin KO, and dKO MEFs at 5 dpi. The amount of transcript for each actin isoform in MEFs was calculated from standard curves that were amplified in parallel (Supplemental Figure S2, A–F). In all control MEFs, αsm- and βcyto-actins were the dominant transcripts (Figure 4, A–C), in contrast to NIH3T3s fibroblasts cultured under the same conditions, where βcyto- and γcyto-actins were the predominant transcripts (Supplemental Figure S3A). αsm-Actin was the only actin transcript significantly up-regulated in βcyto-actin KO MEFs (Figure 4A), whereas both αsm- and βcyto-actins transcripts were up-regulated in γcyto-actin KO MEFs (Figure 4B). Similar to βcyto-actin KO MEFs (Figure 4A), αsm-actin was the only transcript significantly up-regulated in dKO MEFs (Figure 4C). The high levels of αsm-actin transcript suggest a myofibroblast-like phenotype in the primary MEFs that was enhanced to a greater extent by ablation of Actb over Actg1.
FIGURE 4:
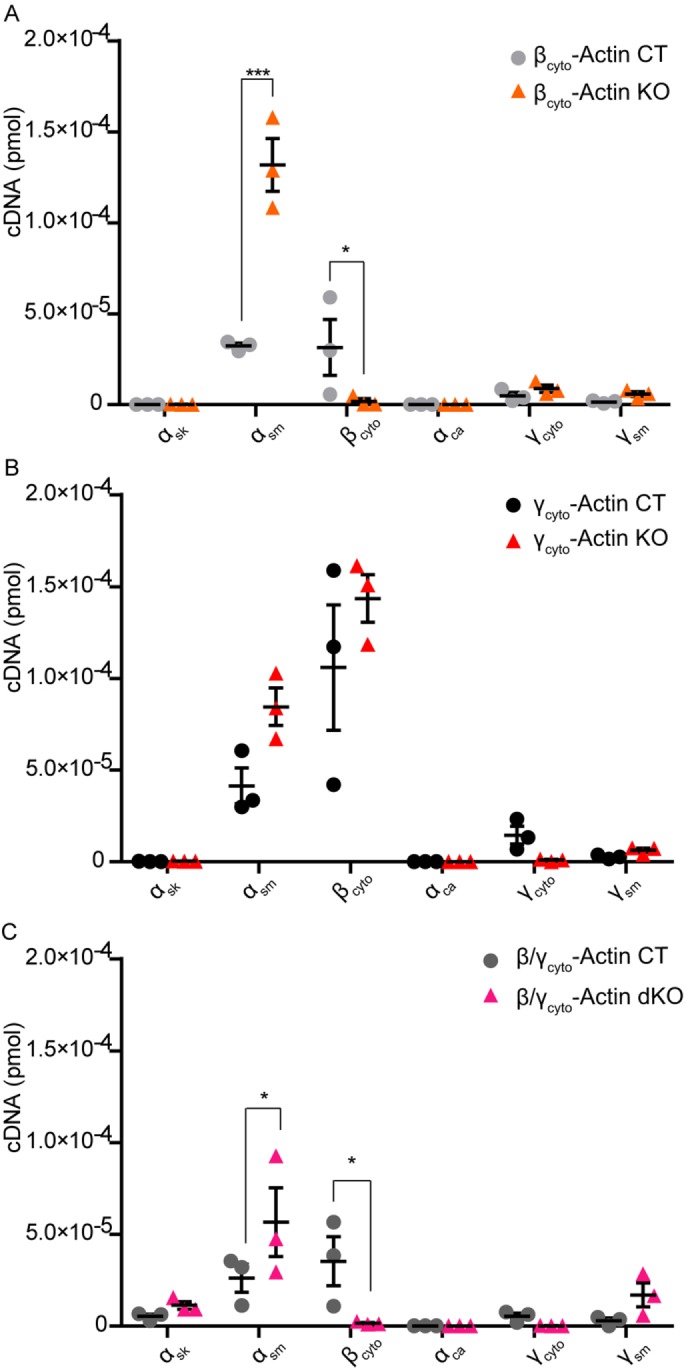
αsm-Actin transcript was up-regulated in βcyto-actin–ablated MEFs. (A–C) qRT-PCR analysis of six mouse actin isoforms in CT and KO MEFs at 5 dpi (n = 3, in triplicate). Calculated transcript amount (picomoles) were calculated based on the standard curve, amplified in parallel. *p < 0.05, ***p < 0.001. Two-way ANOVA with Bonferroni posttest; error bars are SEM.
Because αsm-, βcyto-, and γcyto- were the most abundant actin transcripts in primary MEFs, we measured αsm-, βcyto-, and γcyto-actin protein levels in both control and KO MEFs via quantitative Western blot analysis at 5 dpi in each single KO and at 9 dpi in the dKO using purified αsm-, βcyto-, and γcyto-actin proteins as standards. αsm-Actin was the most abundant actin isoform protein expressed, and βcyto- and γcyto-actin proteins were expressed to similar levels in all control MEFs (Figure 5, B–D). Consistent with transcript analysis (Supplemental Figure S3A), βcyto- and γcyto-actin were the dominant actin proteins expressed in NIH3T3 fibroblasts cultured under the same conditions (Supplemental Figure S3B). In βcyto-actin KO MEFs, αsm-actin protein was dramatically increased by sixfold over controls, but γcyto-actin protein was not significantly increased (Figure 5, A and B). In γcyto-actin KO MEFs, αsm-actin protein was up-regulated by 1.7-fold, whereas βcyto-actin protein was not significantly increased (Figure 5, A and C). αsm-Actin protein was also significantly up-regulated by sevenfold in dKO MEFs (Figure 5, A and D). Thus αsm-actin was prominently expressed in all control primary MEFs and more dramatically up-regulated upon ablation of Actb compared with Actg1, suggesting that primary MEFs may be predisposed to a myofibroblast-like phenotype that can be most enhanced by selective perturbation of Actb. It is also interesting that βcyto-actin transcript was expressed sixfold higher than γcyto-actin transcript in all control MEFs, and yet the ratio of βcyto-actin protein to γcyto-actin protein was 1:1 (Figure 6, A–C). The unequal transcript-to-protein ratio supports other studies concluding that Actb and Actg1 gene expression are differentially regulated posttranscriptionally (Hüttelmaier et al., 2005; Zhang et al., 2010).
FIGURE 5:
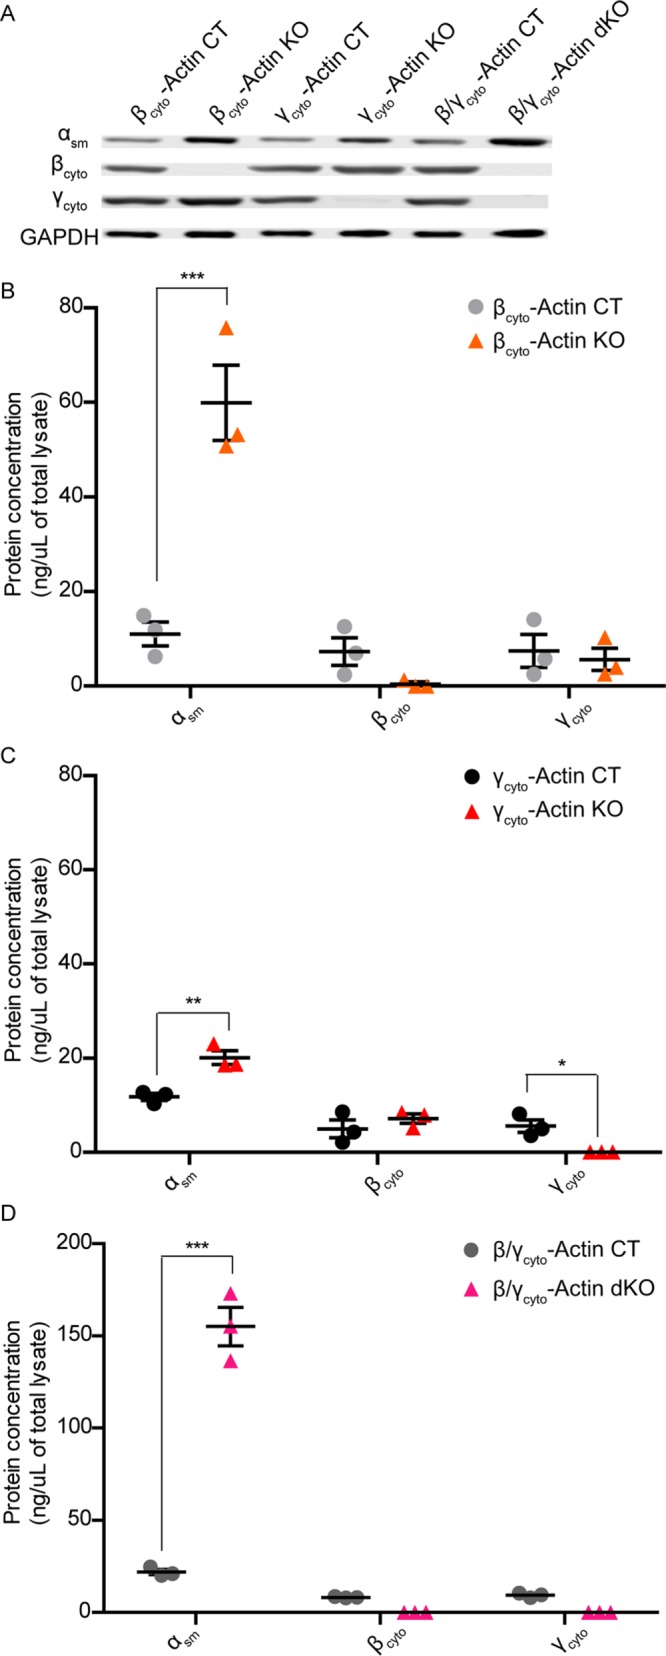
αsm-Actin protein was up-regulated in cytoplasmic ablated MEFs. (A) Representative Western blot of CT and KO MEF lysates blotted with αsm-actin, βcyto-actin, and γcyto-actin antibodies; GAPDH served as loading control. (B–D) Quantitative Western blot analysis of CT and KO MEF lysates (n = 3). Calculated protein concentrations (nanograms/microliter lysate) were determined based on the standard curve blotted in parallel. *p < 0.05, **p < 0.01, and ***p < 0.001. Two-way ANOVA with Bonferroni posttest; error bars are SEM.
FIGURE 6:
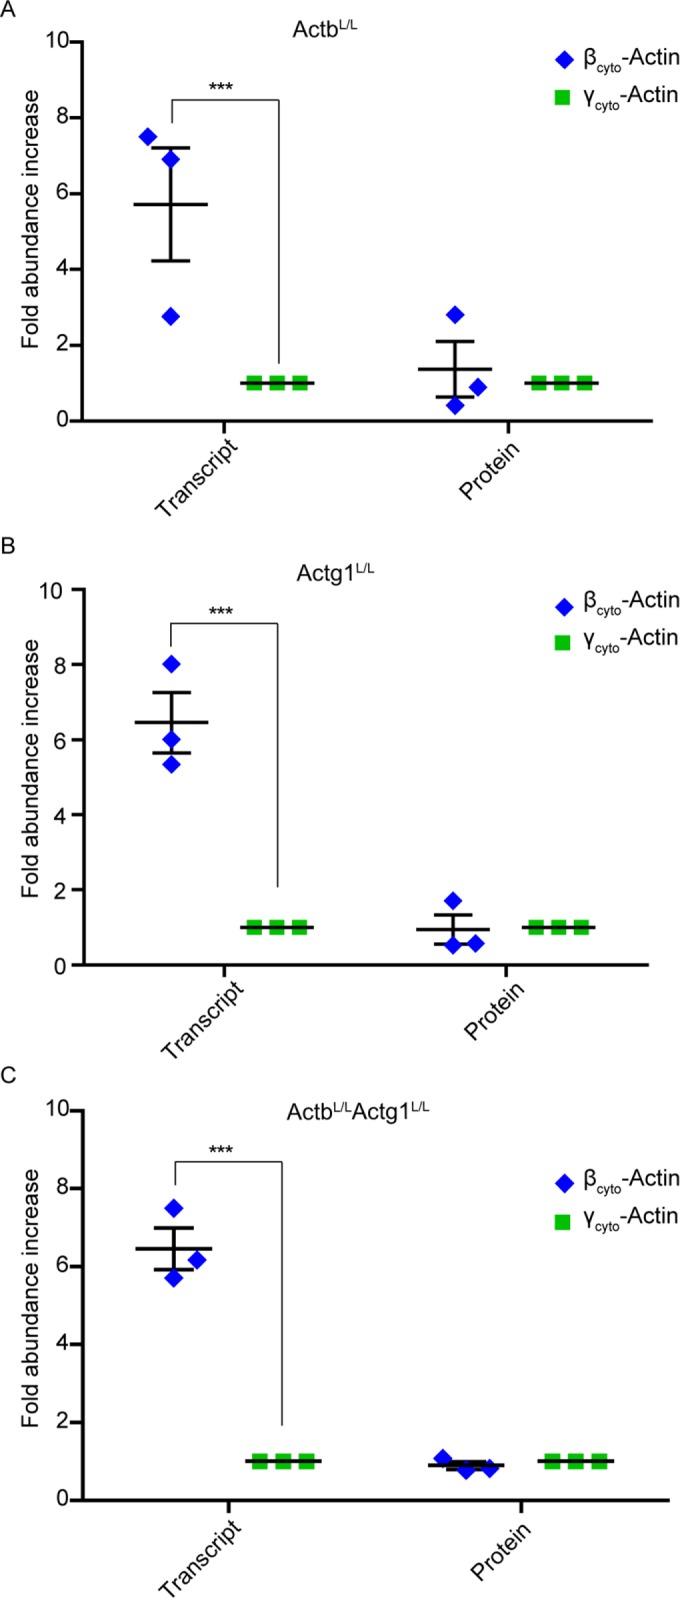
Unequal Actb/Actg1 transcript and protein ratios in primary MEFs. (A–C) Calculated transcript and protein ratios between βcyto- and γcyto-actin in CT MEFs (n = 3). Calculations were based on the qRT-PCR and quantitative Western blot data; γcyto-actin was set at 1. ***p < 0.001. One-sample t test; error bars are SEM.
siRNA-mediated knockdown of Actb andActg1
Because other studies reporting results different from ours used siRNA approaches to knock down Actb and Actg1 transcripts and proteins (Dugina et al., 2009; Shum et al., 2011; Lechuga et al., 2014), we assessed how siRNA-mediated knockdown (KD) of βcyto- and/or γcyto-actin in ActbL/L (βcyto-actin KD), Actg1L/L (γcyto-actin KD), and ActbL/L Actg1L/L (β/γcyto-actin double KD [dKD]) primary MEFs affected cell phenotype. On average, we were able to specifically knock down βcyto-actin protein by 70% and γcyto-actin protein by 55% compared with controls. In dKD MEFs, βcyto-actin protein was reduced by 65% and γcyto-actin protein by 55% (Figure 7A). Quantitative Western blot analysis showed that αsm-actin protein was dramatically increased ninefold in βcyto-actin KD cells over controls, but γcyto-actin protein was not significantly increased (Figure 7, A and B). In γcyto-actin KD cells, neither αsm-actin protein nor βcyto-actin protein was significantly increased (Figure 7, A and C). αsm-Actin protein was also significantly up-regulated fourfold in β/γcyto-actin dKD cells (Figure 7, A and D). Thus siRNA-mediated transcript KD and cre-mediated gene KO gave similar results in primary MEFs.
FIGURE 7:
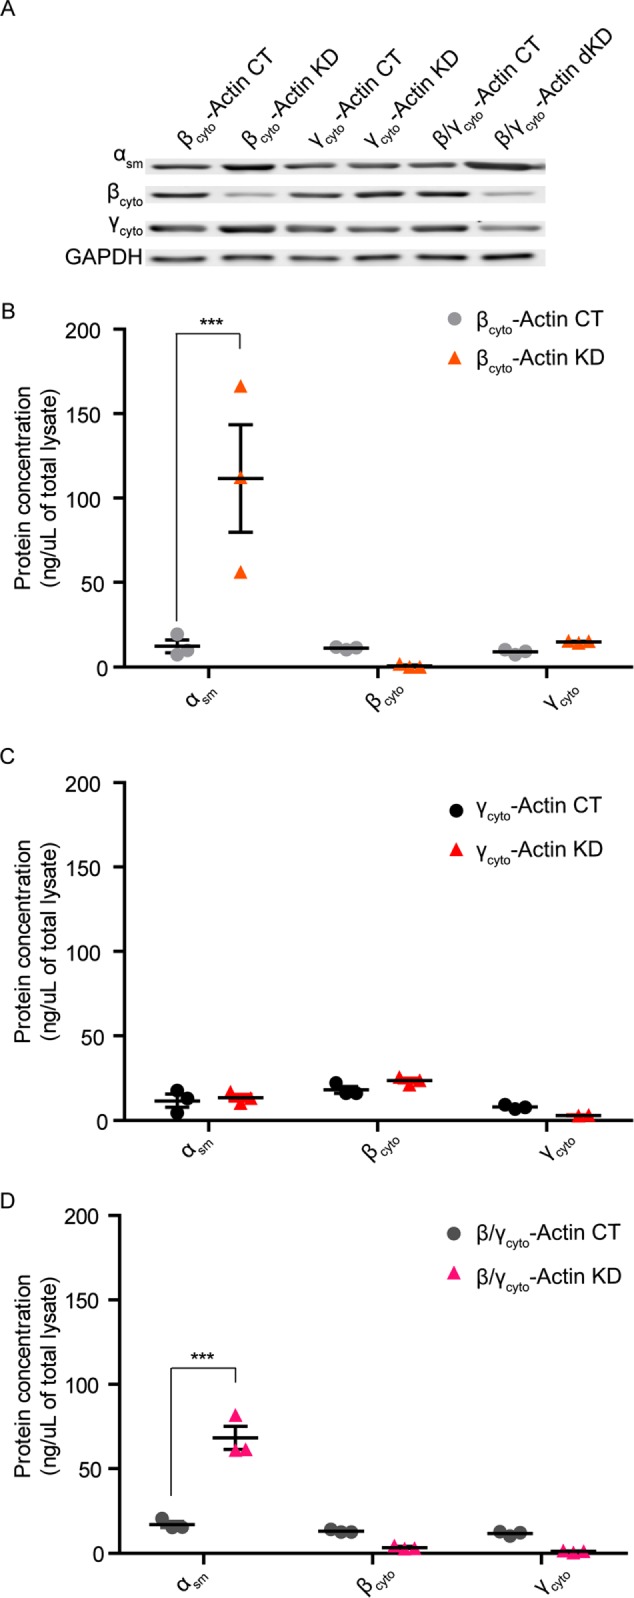
αsm-Actin protein was up-regulated in siRNA-mediated βcyto-actin knockdown MEFs. (A) Representative Western blot of CT and βcyto- and/or γcyto-actin KD MEF lysates at 3 dpi for single KD and 4 dpi for dKD blotted with αsm-actin, βcyto-actin, and γcyto-actin antibodies; GAPDH served as loading control. (B–D) Quantitative Western blot analysis of control and KD MEF lysates (n = 3). Calculated protein concentrations (nanograms/microliter lysate) were determined based on the standard curve, blotted in parallel. ***p < 0.001. Two-way ANOVA with Bonferroni posttest; error bars are SEM.
Actb gene ablation enhances some myofibroblast-like phenotypes of primary MEFs
In response to a variety of perturbations (Small, 2012; Davis and Molkentin, 2013), fibroblasts often differentiate into smooth muscle–like cells called myofibroblasts via a process called the fibroblast-to-myofibroblast transition (FMT). In addition to increased αsm-actin expression, another hallmark of myofibroblasts is increased stress fiber formation (Small, 2012; Davis and Molkentin, 2013), which we observed in βcyto-actin KO, γcyto-actin KO, and dKO MEFs compared with controls (Figure 8, A–F). To quantify the change in the stress fibers of KO MEFs, we made line scans across the cell width (Figure 8G). Peak-to-valley ratios were taken as an average measure of the fluorescence intensity of the stress fibers (Figure 8H). All KO cell types displayed significant elevation in the average peak-to-valley ratios, indicating increased stress fiber formation (Figure 8, A–F). Because caldesmon, calponin, and transgelin proteins have been shown to be up-regulated during epithelial-to-myofibroblast transition (Lechuga et al., 2014), we measured their protein levels in addition to myosin light chain 2 and phosphorylated myosin light chain 2 protein levels in control and knockout MEFs. Caldesmon expresses a higher–molecular weight isoform in smooth muscle cells (Cald1sm) than in non–smooth muscle cells (Ueki et al., 1987; Frid et al., 1992). In agreement with our previously published data (Bunnell et al., 2011), Cald1sm was up-regulated in βcyto-actin KO, γcyto-actin KO, and dKO primary MEFs, although more so in βcyto-actin KO MEFs than γcyto-actin KO MEFs (Figure 9, A–D). In contrast, none of the other myofibroblast marker proteins interrogated were significantly up-regulated (Figure 9, A–D). siRNA-treated primary MEFs showed similar up-regulation of Caldsm in KD MEFs (Supplemental Figure S4, A–D). Thus increased stress fiber formation and expression of Cald1sm suggests that ablation of Actb enhances a partial myofibroblast-like phenotype in primary MEFs.
FIGURE 8:
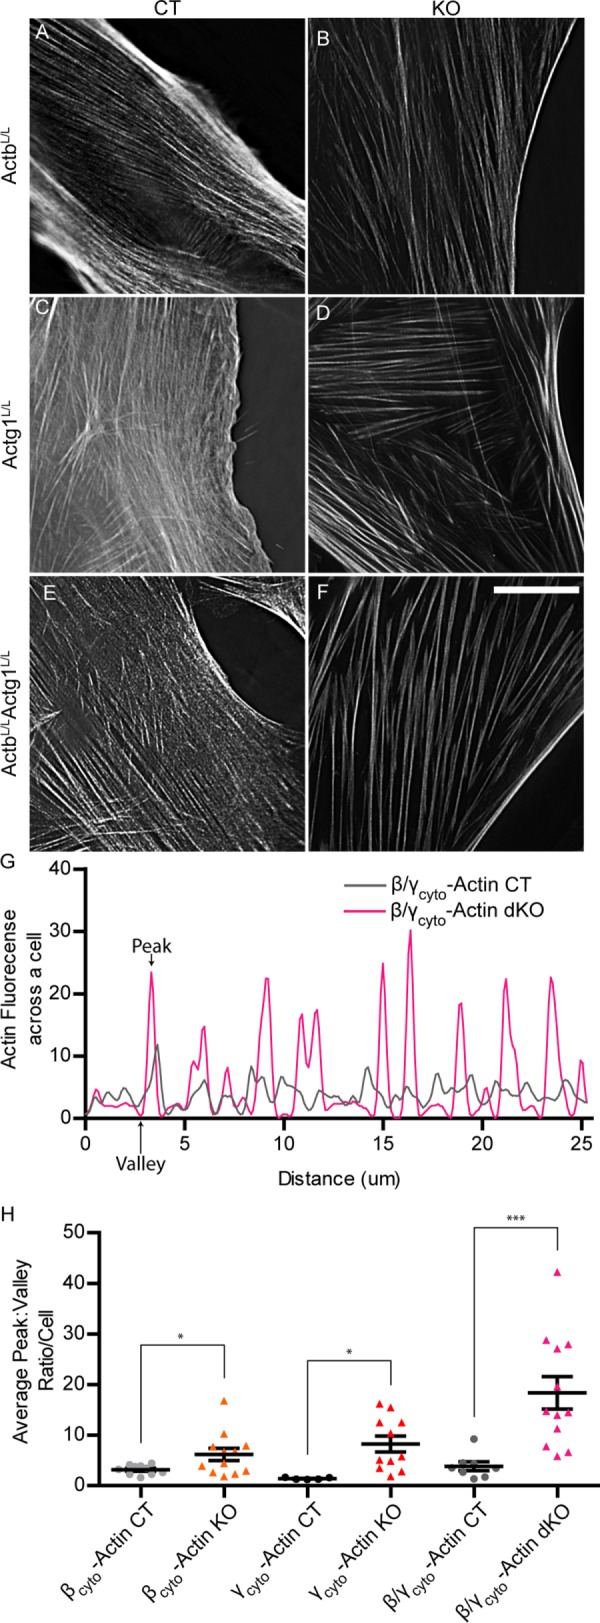
The βcyto- and/or γcyto-actin–ablated MEFs displayed increased stress fiber thickness. (A–F) Representative images of phalloidin-stained actin filaments in Ad5-GFP– or Ad5-Cre–treated primary ActbL/L, Actg1L/L, and ActbL/LActg1L/L MEFs imaged at 7, 7, and 9 dpi, respectively. Scale bar, 20 µm. (G) Representative line scans of actin fluorescence across the dKO cells in E and F. Arrows denote sample valley and peak. (H) Quantification of differences between valley:peak ratios for all genotypes (n ≥ 8). *p < 0.05, ***p < 0.001. Two-way ANOVA; error bars are SEM.
FIGURE 9:

Caldesmon smooth muscle isoform protein expression was up-regulated in βcyto-actin–deficient MEFs. (A) Representative Western blot analysis of CT and KO MEFs blotted with caldesmon (Cald1sm), CNN1, Sm22α, MLC2, and pMLC2; GAPDH served as loading control. (B–D) Relative protein expression normalized to GAPDH and relative to the paired embryo control. *p < 0.05, ***p < 0.001. One-sample t test, error bars are SEM.
Finally, actin dynamics is known to play a role in myofibroblast differentiation via the serum response factor (SRF)/myocardin-related transcription factor (MRTF) gene regulatory pathway (Small, 2012). Therefore we investigated whether SRF or MRTF-A protein expression or SRF activity was perturbed when cytoplasmic actins were ablated. In all knockout MEFs, SRF protein levels were not significantly altered compared with controls (Figure 10, A and C). MRTF-A protein level was down-regulated in all gene-knockout MEFs, which was significant in dKO MEFs (Figure 10, A and B). Similar results were observed in siRNA KD MEFs (Supplemental Figure S5, A and B). Although no drastic changes in protein expression were observed, SRF activity was significantly increased by sixfold in both βcyto-actin KO and dKO MEFs compared with controls. SRF activity increased by twofold in γcyto-actin KO MEFs, although this increase was not significantly different from controls. Our data suggest that Actb knockout more significantly and specifically affects the SRF/MRTF gene regulatory pathway than does the loss of Actg1.
FIGURE 10:
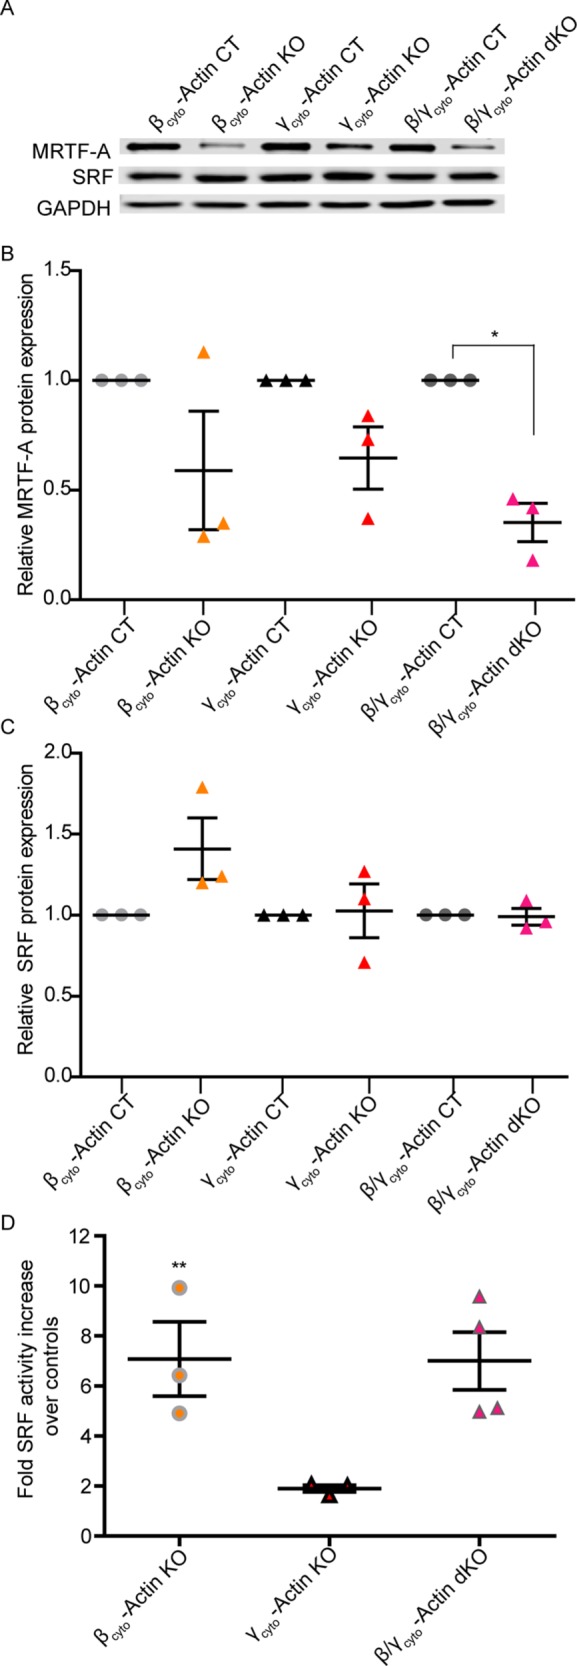
SRF activity but not protein was up-regulated in βcyto-actin–ablated MEFs. (A) Representative Western blot analysis of CT and KO MEFs blotted with MRTF-A and SRF; GAPDH served as loading control. (B, C) Relative protein expression normalized to GAPDH and relative to the paired embryo control (n = 3). (D) Calculated fold increase in SRF activity, via luciferase assay, in KO over CT MEFs (n = 3). *p < 0.05, **p < 0.01. One-sample t test; error bars are SEM.
DISCUSSION
βcyto-Actin is believed to be an essential protein, based on the early embryonic lethality observed in Actb gene-targeted mice (Shawlot et al., 1998; Shmerling et al., 2005; Bunnell et al., 2011). In addition, many cell biological studies provide further compelling support to the essentiality of βcyto-actin in a wide array of cellular processes (Zhao et al., 1998; Hofmann et al., 2004; Hu et al., 2004; Karakozova et al., 2006; Leung et al., 2006; Yao et al., 2006). Although γcyto-actin is clearly important in vivo, it is not essential, given that Actg1-null mice can survive up to 2 years (Belyantseva et al., 2009). Here we sought to resolve the different results reported across a group of cell-based studies all seeking to elucidate the respective roles of βcyto- and γcyto-actin via ablation of protein expression using different targeting approaches in different cell types. Most vexing, βcyto-actin gene knockout in two studies caused essentially the same effects on cell motility and αsm-actin expression (Bunnell et al., 2011; Tondeleir et al., 2012) as those caused by γcyto-actin knockdown in three other studies (Dugina et al., 2009; Shum et al., 2011; Lechuga et al., 2014). Because gene and transcript targeting cause strikingly different in vivo phenotypes for a number of loci (Rossi et al., 2015), we anticipated that actin gene knockout and transcript knockdown experiments carried out in the same cells would explain the discrepant results. Instead, we observed the same experimental outcomes whether we used siRNA-mediated transcript knockdown or Cre-mediated gene knockout. As an alternative explanation for the discrepant results across studies (Dugina et al., 2009; Bunnell et al., 2011; Shum et al., 2011; Tondeleir et al., 2012; Lechuga et al., 2014), Lechuga et al. (2014) hypothesized that loss of the most abundantly expressed actin isoform may dictate a given cell type's response to actin gene ablation. However, our quantitative Western blot analysis demonstrated that βcyto- and γcyto-actin proteins were present in equal abundance in the primary MEFs studied here. We conclude that neither differences in actin isoform–targeting method or endogenous protein levels can explain the dramatically different and often opposite results reported in the six studies from five different groups.
Here (Figure 2) and previously (Bunnell et al., 2011), we measured dramatic cell proliferation defects with ablation of βcyto-actin in primary MEFs, which could account for the embryonic lethality associated with Actb gene deletion (Shawlot et al., 1998; Shmerling et al., 2005; Bunnell et al., 2011). We measured significantly decreased levels of cellular ATP associated with knockout of βcyto-actin in the presence of apparently unaffected mitochondrial function (Figure 3). Although the basis for decreased ATP levels in βcyto-actin knockout MEFs is an interesting question for future studies, it will be challenging to answer, given that ablation of functionally disparate genes in MEFs affects cellular ATP levels independent of corresponding defects in mitochondrial respiration (Gautier et al., 2008; Giaime et al., 2012). We also found that immortalization induced by transformation with SV40 large T antigen rendered Actb nonessential for proliferation (Supplemental Figure S1). Although Tondeleir et al. (2012) noted that cell survival was not impaired in their Actb-null MEFs immortalized by transformation with SV40 large T antigen, a more recent study reported a general delay in cell cycle progression, impaired colony growth, and reduced proliferation rate in the same cell line (Almuzzaini et al., 2016). Although we cannot exclude other effects of transformation with SV40 large T antigen, cell immortalization has been associated with substantial changes in gene expression (Kuo et al., 2012; Gordon et al., 2014). A comparison of primary and spontaneously immortalized MEFs reported almost 2000 transcripts that were up- or down-regulated by threefold (Kuo et al., 2012). Other studies demonstrated that immortalization can significantly affect cell behavior both in the absence (Vasioukhin et al., 2000) and presence of subsequent perturbations (Wade et al., 2002) and even after reversal (Wang et al., 2014). In one highly cited study, primary epithelial cells formed prominent “adhesion zippers” that become challenging to detect after immortalization (Vasioukhin et al., 2000). Moreover, the essential role for p27 in mediating the growth-inhibitory effects of vitamin D in mouse knockout models and primary MEFs was not recapitulated in immortalized MEFs (Wade et al., 2002). Given the unpredictable effects of immortalization and transformation on cell biological function, we suggest that primary MEFs more appropriately model the embryonic lethality associated with Actb gene ablation in mice.
We measured striking differences between the ratios of βcyto- to γcyto-actin transcript versus protein in primary MEFs: βcyto-actin transcript was sixfold greater than γcyto-actin transcript, yet βcyto- and γcyto-actin protein levels were equivalent (Figure 6). βcyto-Actin translation is more rapid than that of γcyto-actin (Zhang et al., 2010) and also tightly regulated via an RNA regulatory sequence in its 3′ untranslated region (UTR) named the “zipcode” (Kislauskis et al., 1993; Ross et al., 1997; Hüttelmaier et al., 2005). Because βcyto-actin protein is the more dynamic of the two cytoplasmic actin isoforms (Bergeron et al., 2010), it is tempting to speculate that the greater abundance of the βcyto-actin transcript is maintained for rapid translation and dynamic cytoskeletal rearrangement. However, the similar levels of βcyto- and γcyto-actin protein (Figure 6) and similar rates of decay after gene ablation in primary MEFs (Figure 1) suggest that βcyto-actin transcript may play some additional function in cells independent of its role as a template for translation. As one possibility, the large pool of Actb transcript may serve to buffer miRNAs important in regulating the expression of other genes important for cell proliferation, motility, and/or differentiation. Of the >20 different microRNA (miRNA) binding sites collectively predicted by TargetScan, microRNA.Org, and PicTar to be present in the 3′ UTR of the Actb transcript but absent from Actg1 (Supplemental Table S1), only mir-205 was identified by all three programs, whereas mir-1 and mir206 were identified by two of three algorithms. Of interest, mir-1, mir-205, and mir-206 were all previously hypothesized to function as tumor suppressors based on experiments demonstrating a correlation between growth inhibition and miRNA overexpression (Hudson et al., 2012; Jalali et al., 2012; Liu et al., 2012; Koshizuka et al., 2017) or increased proliferation after miRNA inhibition (Jalali et al., 2012). Of further relevance to our study, overexpression of mir-1, mir-205, and mir-206 also was associated with significantly decreased cell motility, increased expression of αsm-actin and calponin, and perturbations in actin cytoskeletal dynamics (Hudson et al., 2012; Jalali et al., 2012; Liu et al., 2012). We speculate that ablation of Actb transcript could indirectly drive similar phenotypic changes by freeing up normally sequestered miRNAs. Finally, differential miRNA binding may not be required to explain different phenotypic outcomes for Actb versus Actg1 transcript ablation. The miRNA mir-145 is predicted to bind both Actb and Actg1 and is important in smooth muscle cell proliferation and differentiation (Cordes et al., 2009), and so it is possible that the more abundant Actb transcript could play the dominant role in sequestering mir-145 during development.
Finally, the differentiation status and/or tissue origin of cells used may also account for some of the differences among studies (Dugina et al., 2009; Bunnell et al., 2011; Shum et al., 2011; Tondeleir et al., 2012; Lechuga et al., 2014). Although Actb and/or βcyto-actin are essential during relatively early stages of embryonic development (Shawlot et al., 1998; Shmerling et al., 2005; Bunnell et al., 2011), neither is specifically required for later-stage development of more differentiated auditory hair cells (Perrin et al., 2010), neurons of the peripheral (Cheever et al., 2011) or central (Cheever et al., 2012) nervous systems, or skeletal muscle (Sonnemann et al., 2006; Prins et al., 2011). These data suggest that cells transition from an Actb-essential state to an Actb-important state as development and differentiation progress in vivo. Clearly, the challenge remains to define the in vivo biological process modeled by any particular cell in culture.
MATERIALS AND METHODS
Cell culture
Primary MEFs were cultured from E13.5 ActbL/L, Actg1L/L, and double ActbL/L/Actg1L/L mouse embryos as described previously (Bunnell and Ervasti, 2010). Cells were grown to 80% confluency on 10-cm plates and frozen down at passage 1 at 1 × 10⁶ cells/ml in MEF freezing medium (DMEM supplemented with 10% fetal bovine serum, 1% penicillin/streptomycin, 0.5 μg/ml Fungizone, and 5% dimethyl sulfoxide). Primary MEFs were immortalized by transformation with SV40 large T antigen expression, which was incorporated into the genome via the piggyBac transposase system. MEFs from individual embryos were thawed, cultured in MEF medium (DMEM supplemented with 10% fetal bovine serum, 1% penicillin/streptomycin, 0.5 μg/ml Fungizone), grown to 80% confluency, split into two culture dishes, and treated with Ad5-GFP control virus (Ad5CMV-hrGFP) or Ad5-Cre (Ad5CMV-Cre-eGFP) virus purchased from the University of Iowa Viral Vector Core following their Adenovirus Adfection Protocol (www.medicine.uiowa.edu/vectorcore).
SiRNA transfection
MEFs from individual embryos were thawed, grown to 80% confluency, split into two culture dishes, and treated with control or βcyto- and/or γcyto-actin ONTARGETplus siRNAs purchased from Dharmacon following their protocol (dharmacon.gelifesciences.com/uploadedFiles/Resources/basic-dharmafect-protocol.pdf). See Supplemental Methods for siRNA sequences.
SRF luciferase activity assay
ActbL/L, Actg1L/L, and double ActbL/LActg1L/L MEFs from individual embryos were treated with either Ad5-GFP or Ad5-Cre. Single KO at 3 dpi and dKO at 7 dpi were nucleofected (Amaxa Nucleofector II) with PGL3-Basic-luc (control) or PGL3-FHL2_145-luc (Four and a half LIM domain protein-2) promoter (SRF reporter) constructs (Schmidt et al., 2012), generously provided by Hannelore V. Heemers (Department of Cancer Biology, Lerner Research Institute). At 2 d postnucleofection, at 5 dpi for single KO and 9 dpi for dKO, cells were lifted and hand counted using a hematocytometer. Equal numbers of cells between Ad5-GFP and Ad5-Cre treated MEFs were washed with phosphate-buffered saline (PBS) and processed based on manufacturer's protocols (Dual-Luciferase Reporter Assay; Promega). Aliquots (20 µl) of cleared processed lysates were used to determine SRF luciferase activity (BioTek Synergy 4 spectrometer with Gen5 2.07 software).
qRT-PCR
Mouse actin isoform cDNAs were amplified from WT MEFs by PCR using the primers listed in the Supplemental Methods and cloned into a pENTR/D-TOPO vector (Life Technologies) to generate a control construct for each actin isoform. Each actin isoform qRT-PCR primer set (Supplemental Methods) was tested for amplification of all control constructs to assess primer specificity (Supplemental Figure S2). Total RNA was extracted from ActbL/L, Actg1L/L, and double ActbL/L/Actg1L/L MEF samples using the Bio-Rad-Aurum Total RNA Mini Kit following the manufacturer's instructions. RNA concentration and purity (260/280 ratio) were determined using a NanoDrop spectrophotometer (Wilmington, DE). First-strand cDNA was synthesized with a Bio-Rad iScript Advanced cDNA Synthesis Kit for qRT-PCR using the same initial RNA amount (1 μg) for all samples. Individual control constructs were used in a 10-fold dilution to generate a standard curve, and MEF samples were amplified in parallel with each specific qRT-PCR primer set using Bio-Rad SsoAdvanced Universal SYBR polymerase on the Bio-Rad CFX96 Real Time System C1000 Touch Thermal Cycler to profile each actin isoform transcript amount (picomoles).
Actin isoforms
Platelet non–muscle actin (βcyto- and γcyto-actin) was purchased from Cytoskeleton (Denver, CO). Recombinant γcyto- and αsm-actin were expressed in the Bacto-Bac insect cell-expression system and purified as previously described (Perrin et al., 2013). Protein concentrations were determined using a NanoDrop spectrophotometer. Contamination of recombinant γcyto- and αsm-actins by insect cell actin was measured by electrospray ionization (ESI) mass spectrometry acquired using a QSTAR Pulsar i (Applied Biosystems, Foster City, CA) quadrupole time-of-flight (TOF) mass spectrometer equipped with a turbo-ESI source. Protein samples were loaded directly in 50% acetonitrile and 0.1% formic acid. The ion spray voltage was 1000 V, the TOF region acceleration voltage was 4 kV, and the injection pulse repetition rate was 7.0 kHz. External calibration was performed using renin (monoisotopic mass [MH3+] 586.9830 and [MH2+] 879.9705; Sigma-Aldrich, St. Louis, MO). Mass spectra were summed and averaged over the injection peak. Deconvolution of the charge envelope was performed with the Bioanalyst AnalystQS software package (ABI).
Western blotting
For Western blot quantitation of actin isoforms against a standard curve, total MEF protein was extracted with 1% SDS buffer in 1x PBS and a cocktail of protease inhibitors (100 μM aprotinin, 0.79 mg/ml benzamide, 10 nM E-64, 10 μM leupeptin, 0.1 mg/ml pepstatin, 1 mM phenylmethylsulfonyl fluoride), sonicated (Model 150V/T Ultrasonic homogenizer; BioLogics), boiled, and centrifuged to remove the insoluble fraction. An increasing amount (25–300 ng) of purified actin protein and all MEF samples were run on the same blot to ensure consistency (Supplemental Figure S6). LiCor fluorescence signal versus purified actin protein amount (nanograms) was used to generate a standard curve in order to calculate specific actin isoform concentration (nanograms of protein/microliter of total lysate). All samples were western blotted with β-actin (AC-15; Sigma-Aldrich), γ-actin (mAb 117), and αsm-actin (A14; Sigma-Aldrich). For comparisons of relative immunoreactivities, equal amounts of cleared total MEF lysate protein (25 µg) were blotted with antibodies to caldesmon 1 (2980; Cell signaling), SM22 (ab14106; Abcam), calponin (ab46794; Abcam), SRF (G-20; Santa Cruz Biotechnology), MRTF-A (H-140; Santa Cruz Biotechnology), MTOC1 (ab14705; Abcam), SDHA (ab14715; Abcam), UQCR (ab110252; Abcam), ATP5A (ab14748; Abcam), MLC2 (ab48003; Abcam), and MLC2 (phosphor S20; ab2480; Abcam), with glyceraldehyde 3-phosphate dehydrogenase (GAPDH; G9545 or G8795; Sigma-Aldrich) as loading control.
Cell fixation and staining
MEFs cultured for 6–8 dpi with either Ad5-GFP or Ad5-CRE were plated on 5 μg/ml fibronectin–coated coverslips at a density of 1 × 10⁴ cells/coverslip and incubated in MEF culturing media. The next day, cells were fixed with fresh 4% paraformaldehyde in PBS for 15 min at room temperature. To stain actin filaments, fixed cells were treated with 0.2% Triton X-100 and 16.5 nM phalloidin (A22285; Life Technologies) in PBS for 30 min at room temperature. Coverslips were mounted in Prolong (P36931; Life Technologies) mounting medium.
Cell imaging and quantification
Samples were imaged using a DeltaVision PersonalDV microscope under a 60×/1.42 numerical aperture objective (GE Technologies). All cells were imaged with the same laser intensity and exposure time. The intensity of the stress fibers was quantified from line scans across the widest part of the cell using ImageJ. The peaks and corresponding valleys were then determined (excluding the first peak, which represents the edge of the cell).
The average peak-to-valley ratio per cell was then plotted using GraphPad Prism.
ATP quantification
At 7 or 9 dpi, cells were lifted and counted. Equal numbers of CT and KO MEFs were lysed using boiling water (Yang et al., 2002). The lysate was spun at 12,000 × g for 5 min at 4°C, and the supernatant was collected. Following the luciferase-based ATP Determination Kit (A22066) protocol, the reaction solution (reaction buffer, dithiothreitol (DTT), d-luciferin, and firefly luciferase) was added to the cell lysate supernatant. After a 15-min incubation, ATP levels were determined using a BioTek Synergy 4 spectrometer with Gen5 2.07 software and quantified using an ATP standard ranging from 0 nM to 1 µM.
Analysis of cell growth
A 5 × 10⁵ amount of MEFs/well was treated with Ad5-GFP or Ad5-Cre. Samples were counted every other day beginning at 1 dpi in duplicate, using a hematocytometer to generate growth curves.
Oxygen consumption
Cells were plated in triplicate on 5 μg/μl fibronectin–coated XF24 cell culture microplates (Seahorse Bioscience) at 5 × 10⁴ cells/well 24 h before the experiment. Mitochondrial function was examined using the Seahorse XF24 extracellular flux analyzer and the cell mitochondrial stress assay (Seahorse Bioscience). Oligomycin (2 μg/ml final), FCCP (carbonyl cyanide 4-(trifluoromethoxy)phenylhydrazone; 0.5 µM final), and antimycin A (4 µM final) were injected at time points throughout the experiment according to the company protocol (all compounds from Seahorse Bioscience). Oxygen consumption was measured at multiple points between each injection and normalized to background controls.
Statistics
For quantitative RT-PCR and quantitative Western blots, two-way analysis of variance (ANOVA) with a Bonferroni posttest was used on calculated amounts of transcript (picomoles) and protein (nanograms/microliter of lysate) to determine statistics. For all relative Western blots, immunoreactivity levels for all samples were normalized to GAPDH and relative to the paired embryo control, which was set at 1, and a one-sample t test was performed to evaluate statistics.
Supplementary Material
Acknowledgments
We thank Hannelore Heemers for providing reagents. This work was supported by National Institutes of Health Grants AR049899 to J.M.E. and DC012354 to B.J.P.
Abbreviations used:
- αsm-actin
α smooth-muscle actin
- MEF
mouse embryonic fibroblast
- SRF
serum response factor.
Footnotes
This article was published online ahead of print in MBoC in Press (http://www.molbiolcell.org/cgi/doi/10.1091/mbc.E16-07-0503) on January 11, 2017.
REFERENCES
- Almuzzaini B, Sarshad AA, Rahmanto AS, Hansson ML, Von Euler A, Sangfelt O, Visa N, Farrants AKO, Percipalle P. In β-actin knockouts, epigenetic reprogramming and rDNA transcription inactivation lead to growth and proliferation defects. FASEB J. 2016;30:2860–2873. doi: 10.1096/fj.201600280R. [DOI] [PubMed] [Google Scholar]
- Belyantseva IA, Perrin BJ, Sonnemann KJ, Zhu M, Stepanyan R, McGee J, Frolenkov GI, Walsh EJ, Friderici KH, Frideman TB, et al. Gamma-actin is required for cytoskeletal maintenance but not development. Proc Natl Acad Sci USA. 2009;106:9703–9708. doi: 10.1073/pnas.0900221106. [DOI] [PMC free article] [PubMed] [Google Scholar]
- Bergeron SE, Zhu M, Thiem SM, Friderici KH, Rubenstein P A. Ion-dependent polymerization differences between mammalian beta- and gamma-nonmuscle actin isoforms. J Biol Chem. 2010;285:16087–16095. doi: 10.1074/jbc.M110.110130. [DOI] [PMC free article] [PubMed] [Google Scholar]
- Bunnell TM, Burbach BJ, Shimizu Y, Ervasti JM. β-Actin specifically controls cell growth, migration, and the G-actin pool. Mol Biol Cell. 2011;22:4047–4058. doi: 10.1091/mbc.E11-06-0582. [DOI] [PMC free article] [PubMed] [Google Scholar]
- Bunnell TM, Ervasti JM. Delayed embryonic development and impaired cell growth and survival in Actg1 null mice. Cytoskeleton. 2010;67:564–572. doi: 10.1002/cm.20467. [DOI] [PMC free article] [PubMed] [Google Scholar]
- Bunnell TM, Ervasti JM. Structural and functional properties of the actin gene family. Crit Rev Eukaryot Gene Expr. 2011;21:255–266. doi: 10.1615/critreveukargeneexpr.v21.i3.30. [DOI] [PubMed] [Google Scholar]
- Cheever TR, Li B, Ervasti JM. Restricted morphological and behavioral abnormalities following ablation of beta-actin in the brain. PLoS One. 2012;7:e32970. doi: 10.1371/journal.pone.0032970. [DOI] [PMC free article] [PubMed] [Google Scholar]
- Cheever TR, Olson EA, Ervasti JM. Axonal regeneration and neuronal function are preserved in motor neurons lacking beta-actin in vivo. PLoS One. 2011;6:1–13. doi: 10.1371/journal.pone.0017768. [DOI] [PMC free article] [PubMed] [Google Scholar]
- Condeelis J, Singer RH. How and why does beta-actin mRNA target. Biol Cell. 2005;97:97–110. doi: 10.1042/BC20040063. [DOI] [PubMed] [Google Scholar]
- Cordes KR, Sheehy NT, White MP, Berry EC, Morton SU, Muth AN, Lee TH, Miano JM, Ivey KN, Srivastava D. miR-145 and miR-143 regulate smooth muscle cell fate and plasticity. Nature. 2009;460:1–7. doi: 10.1038/nature08195. [DOI] [PMC free article] [PubMed] [Google Scholar]
- Davis J, Molkentin JD. Myofibroblasts: trust your heart and let fate decide. J Mol Cell Cardiol. 2013;70:9–18. doi: 10.1016/j.yjmcc.2013.10.019. [DOI] [PMC free article] [PubMed] [Google Scholar]
- Dugina V, Zwaenepoel I, Gabbiani G, Clément S, Chaponnier C. Beta and gamma-cytoplasmic actins display distinct distribution and functional diversity. J Cell Sci. 2009;122:2980–2988. doi: 10.1242/jcs.041970. [DOI] [PubMed] [Google Scholar]
- Frid MG, Shekhonin BV, Koteliansky VE, Glukhova MA. Phenotypic changes of human smooth muscle cells during development: late expression of heavy caldesmon and calponin. Dev Biol. 1992;153:185–193. doi: 10.1016/0012-1606(92)90104-o. [DOI] [PubMed] [Google Scholar]
- Gautier CA, Kitada T, Shen J. Loss of PINK1 causes mitochondrial functional defects and increased sensitivity to oxidative stress. Proc Natl Acad Sci USA. 2008;105:11364–11369. doi: 10.1073/pnas.0802076105. [DOI] [PMC free article] [PubMed] [Google Scholar]
- Giaime E, Yamaguchi H, Gautier CA, Kitada T, Shen J. Loss of DJ-1 does not affect mitochondrial respiration but increases ROS production and mitochondrial permeability transition pore opening. PLoS One. 2012;7:e40501. doi: 10.1371/journal.pone.0040501. [DOI] [PMC free article] [PubMed] [Google Scholar]
- Gordon K, Clouaire T, Bao XX, Kemp SE, Xenophontos M, De Las Heras JI, Stancheva I. Immortality, but not oncogenic transformation, of primary human cells leads to epigenetic reprogramming of DNA methylation and gene expression. Nucleic Acids Res. 2014;42:3529–3541. doi: 10.1093/nar/gkt1351. [DOI] [PMC free article] [PubMed] [Google Scholar]
- Hofmann WA, Stojiljkovic L, Fuchsova B, Vargas GM, Mavrommatis E, Philimonenko V, Kysela K, Goodrich JA, Lessard JL, Hope TJ, et al. Actin is part of pre-initiation complexes and is necessary for transcription by RNA polymerase II. Nat Cell Biol. 2004;6:1094–1101. doi: 10.1038/ncb1182. [DOI] [PubMed] [Google Scholar]
- Hu P, Wu S, Hernandez N. A role for beta-actin in RNA polymerase III transcription. Genes Dev. 2004;18:3010–3015. doi: 10.1101/gad.1250804. [DOI] [PMC free article] [PubMed] [Google Scholar]
- Hudson RS, YI M, Esposito D, Watkins SK, Hurwitz AA, Yfantis HG, Lee DH, Borin JF, Naslund MJ, Alexandar RB, et al. MicroRNA-1 is a candidate tumor suppressor and prognostic marker in human prostate cancer. Nucleic Acids Res. 2012;40:3689–3703. doi: 10.1093/nar/gkr1222. [DOI] [PMC free article] [PubMed] [Google Scholar]
- Hüttelmaier S, Zenklusen D, Lederer M, Dictenberg J, Lorenz M, Meng X, Bassell GJ, Condeelis J, Singer RH. Spatial regulation of beta-actin translation by Src-dependent phosphorylation of ZBP1. Nature. 2005;438:512–515. doi: 10.1038/nature04115. [DOI] [PubMed] [Google Scholar]
- Jalali S, Ramanathan GK, Parthasarathy PT, Aljubran S, Galam L, Yunus A, Garcia S, Cox RR, Lockey RF, Kolliputi N. Mir-206 regulates pulmonary artery smooth muscle cell proliferation and differentiation. PLoS One. 2012;7:e46808. doi: 10.1371/journal.pone.0046808. [DOI] [PMC free article] [PubMed] [Google Scholar]
- Karakozova M, Kozak M, Wong CCL, Bailey AO, Yates JR, Mogilner A, Zebroski H, Kashina A. Arginylation of beta-actin regulates actin cytoskeleton and cell motility. Science. 2006;313:192–196. doi: 10.1126/science.1129344. [DOI] [PubMed] [Google Scholar]
- Khaitlina SY. Functional specificity of actin isoforms. Int Rev Cytol. 2001;202:35–98. doi: 10.1016/s0074-7696(01)02003-4. [DOI] [PubMed] [Google Scholar]
- Kislauskis EH, Li Z, Singer RH, Taneja KL. Isoform-specific 3′-untranslated sequences sort alpha-cardiac and beta-cytoplasmic actin messenger RNAs to different cytoplasmic compartments. J Cell Biol. 1993;123:165–172. doi: 10.1083/jcb.123.1.165. [DOI] [PMC free article] [PubMed] [Google Scholar]
- Koshizuka K, Hanazawa T, Fukumoto I, Kikkawa N, Matsushita R, Mataki H, Mizuno K, Okamoto Y, Seki N. Dual-receptor (EGFR and c-MET) inhibition by tumor suppressive miR-1 and miR-206 in head and neck squamous cell carcinoma. J Hum Genet. 2017;62:113–121. doi: 10.1038/jhg.2016.47. [DOI] [PubMed] [Google Scholar]
- Kuo SM, Burl LR, Hu Z. Cellular phenotype-dependent and -independent effects of vitamin C on the renewal and gene expression of mouse embryonic fibroblasts. PLoS One. 2012;7:e32957. doi: 10.1371/journal.pone.0032957. [DOI] [PMC free article] [PubMed] [Google Scholar]
- Lechuga S, Baranwal S, Li C, Naydenov NG, Kuemmerle JF, Dugina V, Chaponnier C, Ivanov AI. Loss of γ-cytoplasmc actin triggers myofibroblast transition of human epithelial cells. Mol Biol Cell. 2014;25:3133–3146. doi: 10.1091/mbc.E14-03-0815. [DOI] [PMC free article] [PubMed] [Google Scholar]
- Leung KM, van Horck FP, Lin AC, Allison R, Standart N, Holt CE. Asymmetrical beta-actin mRNA translation in growth cones mediates attractive turning to netrin-1. Nat Neurosci. 2006;9:1247–1256. doi: 10.1038/nn1775. [DOI] [PMC free article] [PubMed] [Google Scholar]
- Liu S, Tetzlaff MT, Liu A, Liegl-Atzwanger B, Guo J, Xu X. Loss of microRNA-205 expression is associated with melanoma progression. Lab Invest. 2012;92:1084–1096. doi: 10.1038/labinvest.2012.62. [DOI] [PubMed] [Google Scholar]
- Perrin BJ, Ervasti JM. The actin gene family: function follows isoform. Cytoskeleton. 2010;67:630–634. doi: 10.1002/cm.20475. [DOI] [PMC free article] [PubMed] [Google Scholar]
- Perrin BJ, Sonnemann KJ, Ervasti JM. β-actin and γ-actin are each dispensable for auditory hair cell development but required for Stereocilia maintenance. PLoS Genet. 2010;6:e1001158. doi: 10.1371/journal.pgen.1001158. [DOI] [PMC free article] [PubMed] [Google Scholar]
- Perrin BJ, Strandjord DM, Narayanan P, Henderson DM, Johnson KR, Ervasti JM. β-Actin and fascin-2 cooperate to maintain stereocilia length. J Neurosci. 2013;33:8114–8121. doi: 10.1523/JNEUROSCI.0238-13.2013. [DOI] [PMC free article] [PubMed] [Google Scholar]
- Prins KW, Call JA, Lowe DA, Ervasti JM. Quadriceps myopathy caused by skeletal muscle-specific ablation of β(cyto)-actin. J Cell Sci. 2011;124:951–957. doi: 10.1242/jcs.079848. [DOI] [PMC free article] [PubMed] [Google Scholar]
- Ross AF, Oleynikov Y, Kislauskis EH, Taneja KL. Characterization of a beta-actin mRNA zipcode-binding protein. Mol Cell Biol. 1997;17:2158–2165. doi: 10.1128/mcb.17.4.2158. [DOI] [PMC free article] [PubMed] [Google Scholar]
- Rossi A, Kontarakis Z, Gerri C, Nolte H, Hölper S, Krüger M, Stainier DYR. Genetic compensation induced by deleterious mutations but not gene knockdowns. Nature. 2015;524:230–233. doi: 10.1038/nature14580. [DOI] [PubMed] [Google Scholar]
- Rubenstein PA, Wen KK. Insights into the effects of disease-causing mutations in human actins. Cytoskeleton. 2014;71:211–229. doi: 10.1002/cm.21169. [DOI] [PubMed] [Google Scholar]
- Rubenstein PA. The functional importance of multiple actin isoforms. BioEssays. 1990;12:309–315. doi: 10.1002/bies.950120702. [DOI] [PubMed] [Google Scholar]
- Schmidt LJ, Duncan K, Yadav N, Regan KM, Verone AR, Lohse CM, Pop EA, Attwood K, Wilding G, Mohler JL, et al. RhoA as a mediator of clinically relevant androgen action in prostate cancer cells. Mol Endocrinol. 2012;26:716–735. doi: 10.1210/me.2011-1130. [DOI] [PMC free article] [PubMed] [Google Scholar]
- Shawlot W, Deng JM, Fohn LE, Behringer RR. Restricted beta-galactosidase expression of a hygromycin-lacZ gene targeted to the beta-actin locus and embryonic lethality of beta-actin mutant mice. Transgenic Res. 1998;7:95–103. doi: 10.1023/a:1008816308171. [DOI] [PubMed] [Google Scholar]
- Schmerling D, Danzer C, Mao X, Boisclair J, Haffner M, Lemaistre M, Schuler V, Kaeslin E, Korn R, Bürki K, et al. Strong and ubiquitous expression of transgenes targeted into the beta-actin locus by Cre/lox cassette replacement. Genesis. 2005;42:229–235. doi: 10.1002/gene.20135. [DOI] [PubMed] [Google Scholar]
- Shum MSY, Pasquier E, Po'uha ST, O'Neill GM, Chaponnier C, Gunning PW, Kavallaris M. Gamma-Actin regulates cell migration and modulates the ROCK signaling pathway. FASEB J. 2011;25:4423–4433. doi: 10.1096/fj.11-185447. [DOI] [PubMed] [Google Scholar]
- Singhal PK, Sassi S, Lan L, Au P, Halvorsen SC, Fukumura D, Jain RK, Seed B. Mouse embryonic fibroblasts exhibit extensive developmental and phenotypic diversity. Proc Natl Acad Sci USA. 2016;113:122–127. doi: 10.1073/pnas.1522401112. [DOI] [PMC free article] [PubMed] [Google Scholar]
- Small EM. The actin-MRTF-SRF gene regulatory axis and myofibroblast differentiation. J Cardiovasc Transl Res. 2012;5:794–804. doi: 10.1007/s12265-012-9397-0. [DOI] [PubMed] [Google Scholar]
- Sonnemann KJ, Fitzsimons DP, Patel JR, Liu Y, Schneider MF, Moss RL, Ervasti JM. Cytoplasmic gamma-actin is not required for skeletal muscle development but its absence leads to a progressive myopathy. Dev Cell. 2006;11:387–397. doi: 10.1016/j.devcel.2006.07.001. [DOI] [PubMed] [Google Scholar]
- Tondeleir D, Lambrechts A, Müller M, Jonckheere V, Doll T, Vandamme D, Bakkali K, Waterschoot D, Lemaistre M, Debeir O, et al. Cells lacking β-actin are genetically reprogrammed and maintain conditional migratory capacity. Mol Cell Proteomics. 2012;1:255–271. doi: 10.1074/mcp.M111.015099. [DOI] [PMC free article] [PubMed] [Google Scholar]
- Ueki N, Sobue K, Kanda K, Hada T, Higashino K. Expression of high and low molecular weight caldesmons during phenotypic modulation of smooth muscle cells. Proc Natl Acad Sci USA. 1987;84:9049–9053. doi: 10.1073/pnas.84.24.9049. [DOI] [PMC free article] [PubMed] [Google Scholar]
- Vasioukhin V, Bauer C, Yin M, Fuchs E. Directed actin polymerization is the driving force for epithelial cell-cell adhesion. Cell. 2000;100:209–219. doi: 10.1016/s0092-8674(00)81559-7. [DOI] [PubMed] [Google Scholar]
- Wade WN, Willingham MC, Koumenis C, Cramer SD. p27Kip1 is essential for the antiproliferative action of 1,25-dihydroxyvitamin D3 in primary, but not immortalized, mouse embryonic fibroblasts. J Biol Chem. 2002;277:37301–37306. doi: 10.1074/jbc.M204162200. [DOI] [PubMed] [Google Scholar]
- Wang N, Zhang W, Cui J, Zhang H, Chen X, Li R, Wu N, Chen X, Wen S, Zhang J, et al. The piggyBac transposon-mediated expression of SV40 T antigen efficiently immortalizes mouse embryonic fibroblasts (MEFs) PLoS One. 2014;9:e97316. doi: 10.1371/journal.pone.0097316. [DOI] [PMC free article] [PubMed] [Google Scholar]
- Yang NC, Ho WM, Chen YH, Hu ML. A convenient one-step extraction of cellular ATP using boiling water for the luciferin–luciferase assay of ATP. Anal Biochem. 2002;306:323–327. doi: 10.1006/abio.2002.5698. [DOI] [PubMed] [Google Scholar]
- Yao J, Sasaki Y, Wen Z, Bassell GJ, Zheng JQ. An essential role for beta-actin mRNA localization and translation in Ca2+-dependent growth cone guidance. Nat Neurosci. 2006;9:1265–1273. doi: 10.1038/nn1773. [DOI] [PubMed] [Google Scholar]
- Zhang F, Saha S, Shabalina Sa, Kashina A. Differential arginylation of actin isoforms is regulated by coding sequence-dependent degradation. Science. 2010;329:1534–1537. doi: 10.1126/science.1191701. [DOI] [PMC free article] [PubMed] [Google Scholar]
- Zhao K, Wang W, Rando OJ, Xue Y, Swiderek K, Kuo A, Crabtree GR. Rapid and phosphoinositol-dependent binding of the SWI/SNF-like BAF complex to chromatin after T lymphocyte receptor signaling. Cell. 1998;95:625–636. doi: 10.1016/s0092-8674(00)81633-5. [DOI] [PubMed] [Google Scholar]
Associated Data
This section collects any data citations, data availability statements, or supplementary materials included in this article.