Abstract
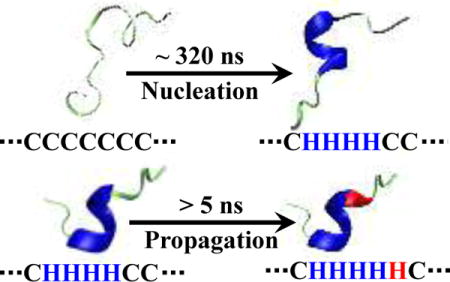
An infrared temperature-jump (T-jump) study by Huang et al. (Proc. Natl. Acad. Sci. 2002 99, 2788–2793) showed that the conformational relaxation kinetics of an alanine-based α-helical peptide depend not only on the final temperature (Tf) but also on the initial temperature (Ti) when Tf is fixed. Their finding indicates that the folding free energy landscape of this peptide is non-two-state like, allowing for the population of conformational ensembles with different helical lengths and relaxation times in the temperature range of the experiment. Because α-helix folding involves two fundamental events, nucleation and propagation, the results of Huang et al. thus present a unique opportunity to determine their rate constants – a long-sought goal in the study of the helix-coil transition dynamics. Herein, we capitalize on this notion and develop a coarse-grained kinetic model to globally fit the thermal unfolding curve and T-jump kinetic traces of this peptide. Using this strategy, we are able to explicitly determine the microscopic rate constants of the kinetic steps encountered in the nucleation and propagation processes. Our results reveal that the time taken to form one α-helical turn (i.e., an α-helical segment with one helical hydrogen bond) is about 315 ns, whereas the time taken to elongate this nucleus by one residue (or backbone unit) is 5.9 ns, depending on the position of the residue.
Graphical abstract
INTRODUCTION
The α-helix is not only ubiquitously found in proteins as a secondary structural element, it is also the folded conformation of many peptides. In this regard, the folding dynamics and mechanism of the α-helix have been extensively studied, either in the context of globular protein folding or as an individual and independent folding unit.1–37 Currently, the most widely accepted theoretical framework to describe the α-helix folding properties is the helix-coil transition theory introduced by Zimm and Bragg38–41 as well as Lifson and Roig.40–42 In essence, this theory is a coarse-grained, one-dimensional (1D) Ising model, which treats the peptide in question as a linear chain of basic units, corresponding to the constituent residues or peptide groups that can adopt either a helical (H) or coil (C) state. Thermodynamically, a C to H (C→H) transition leads to a decrease in the configurational entropy (ΔS) of the system, whereas the formation of a helical hydrogen bond (hH-bond) between two peptide groups that are in the H state (i.e., one at position i and the other at i+3) results in a favorable enthalpic gain (ΔH). Thus, based on the 1D Ising model,39, 40, 43–45 the free energy change (ΔG) upon formation of a particular helical conformation consisting of m hH-bonds and n H sites is: . Furthermore, the kinetics of the α-helix formation are described by a series of sequential events, wherein the consecutive C→H transitions required to form the first hH-bond are regarded as the nucleation event, whereas the subsequent kinetic steps leading to lengthening of this nascent α-helical motif are referred to as the propagation process.
While such Ising-based models provide a sound theoretical framework for understanding the mechanism of the helix-coil transition,39–41, 44, 46–50 it has proven rather difficult to experimentally assess the mechanistic details they infer, especially the microscopic rate constants of the nucleation and propagation events. This is due to the fact, at least in part, that (1) both events occur on a rapid timescale (i.e., on the nanosecond timescale for alanine-based α-helices);1, 9, 10, 14, 16, 19, 30, 50 (2) their rates are not well separated;4, 12, 31, 35, 51, 52 (3) among the sequential kinetic events involved in α-helix folding, the first one (i.e., nucleation) is the slowest; and (4) there is not a simple experimental signal that can be used to distinguish nucleation from propagation. For example, although previous studies2, 9, 10, 14, 20, 28, 30, 50, 53, 54 on various α-helical peptides were able to directly characterize the overall relaxation kinetics of the helix-coil transition in question, induced by either a rapid temperature-jump (T-jump) or a photo-isomerization event, they were unable to unambiguously separate and, hence, determine the respective contributions from the nucleation and propagation processes to the observed kinetic signals. In light of this difficulty, several recent studies have explored the possibility of isolating and therefore exclusively detecting a specific microscopic event in α-helix folding. These include (1) using short peptides that can form only a single turn of an α-helix to assess the nucleation time via T-jump experiments;32 (2) using a photo-responsive cross-linker that induces a kink in an α-helix to probe the speed limit of the propagation process via transient two dimensional infrared (2D IR) measurements;36 and (3) employing a triplet-triplet energy transfer pair to assess local folding-unfolding dynamics of an α-helical peptide and using the resultant information to evaluate the helical propagation rate by analyzing the corresponding experimental results with the kinetic Ising model.15, 31, 35 Herein, we demonstrate a new approach, which shows that the nucleation and propagation rates of an α-helix can be directly extracted by globally fitting its circular dichroism (CD) thermal unfolding curve and two T-jump kinetic traces, measured at the same final temperature but different initial temperatures, to a 1D Ising model.
A study by Huang et al.12 showed that the conformational relaxation kinetics of an alanine-based α-helical peptide (hereafter referred to as AK peptide), in response to a rapid T-jump and as measured by time-resolved infrared (IR) spectroscopy, depend not only on the final temperature (Tf), as expected, but also on the initial temperature (Ti) for a fixed Tf (Figure 1). Since varying the initial temperature of the system in question is equivalent to varying its initial potential (VIP), we therefore refer to this type of T-jump kinetics as VIPT-jump kinetics. Our previous study55 has shown that for a conformational relaxation process involving more than two conformational ensembles, its kinetics show a Ti-dependence for a given Tf. Therefore, the T-jump results of Huang et al. are not only consistent with the notion that the helix-coil transition kinetics involve multiple microscopic steps (e.g., nucleation and propagation) but also provide an additional piece of information that could be used to better determine their respective rate constants. This is because, as shown (Figure 2), the VIPT-jump kinetics of Huang et al. can be qualitatively understood in terms of three population ensembles (ES1, ES2 and ES3) having different helical conformational distributions and, in addition, going from ES1 to ES2 results in mostly shortening of the α-helices (and hence is fast), whereas converting ES2 to ES3 leads to a larger percentage of the α-helices to completely unfold (and hence, on average, is slower). Herein, we aim to capitalize on this picture and to extract the α-helical nucleation and propagation rate constants by computationally fitting the VIPT-jump kinetics of Huang et al. to a 1D Ising-like model.
Figure 1.
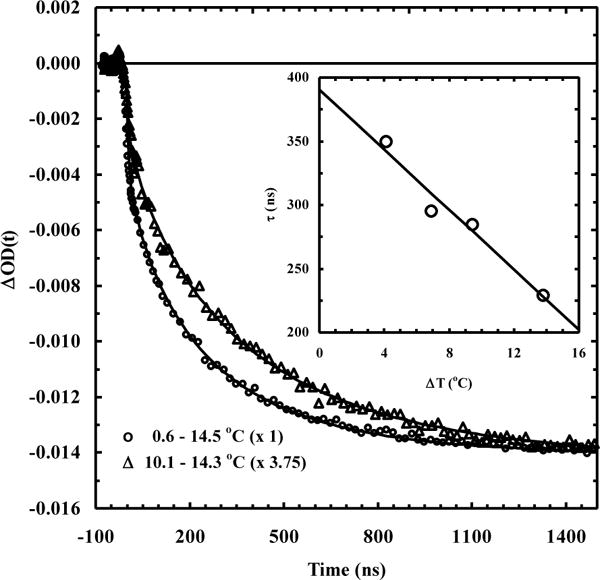
Normalized IR T-jump relaxation kinetics of the AK peptide, showing the dependence on Ti. Reprinted with permission from Reference 7 (Huang, C.-Y.; Getahun, Z.; Zhu, Y.; Klemke, J. W.; DeGrado, W. F.; Gai, F. Proc. Natl. Acad. Sci. U.S.A. 2002, 99, 2788–2793). Copyright 2002, Proceedings of the National Academy Sciences.
Figure 2.
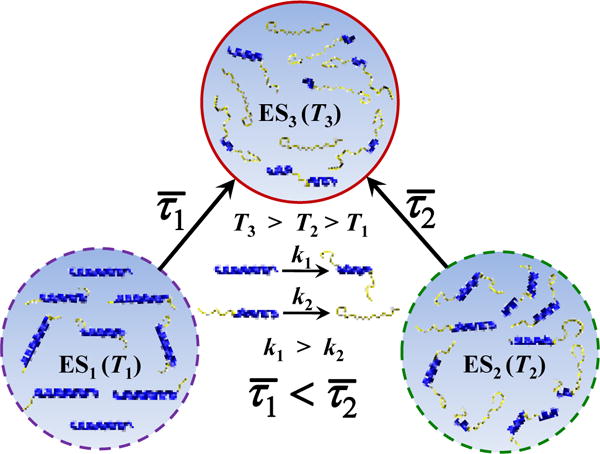
Cartoon illustration of the origin of Ti-dependent conformational relaxation kinetics of an α-helix system.
COMPUTIONAL METHODS
All calculations were carried out using specially written MATLAB programs (Mathworks, Natick, MA) on a Dell PowerEdge T610 computer equipped with two six-core Intel Xeon X5690 processors. Specifically, the differential equations were numerically solved by the fourth-order Runge-Kutta algorithm where the stoichiometric matrix was converted to a sparse matrix to reduce the usage of computer memory. Global fitting of the T-jump kinetics and the CD thermal unfolding curve of the AK peptide was done using the derivative-free pattern search algorithm56, 57 wherein the quality of the fitting was judged by the χ2 value. More details are further discussed in the following section.
RESULTS AND DISCUSSION
To determine the helical nucleation and propagation rate constants of the AK peptide, we use a kinetic 1D-Ising model to simultaneously fit its CD thermal unfolding curve and VIPT-jump kinetics. Our coarse-grained model treats each amide bond of the α-helix in question as a basic unit, which can adopt either a H or C state. As shown (Scheme 1), the AK peptide consists of 14 such units. This is because the D-Arg residue (i.e., r) and the SPE motif in its sequence were introduced to serve as helix caps at the C- and N-terminus, respectively. In addition, since the experimental results of Huang et al. indicated that, as also observed for other α-helical peptides,12, 31, 50, 58–65 the middle region of the AK α-helix is more stable than its N- and C-terminal regions, we further divide those 14 units into three regions (referred to as the N-, C-, M-region, respectively). Furthermore, we need to consider the fact that the VIPT-jump kinetics of Huang et al. were obtained by monitoring the amide I′ band arising from 4 13C-isotopically-labeled Ala residues in the middle of the AK peptide (Scheme 1) when computing the relaxation kinetics for comparison (see below). It is also worth noting that our coarse-grained model does not consider the difference in the helical propensities of Ala and Lys residues as well as the effect of Lys sidechain on the stability of the α-helix.66–68
Scheme 1.
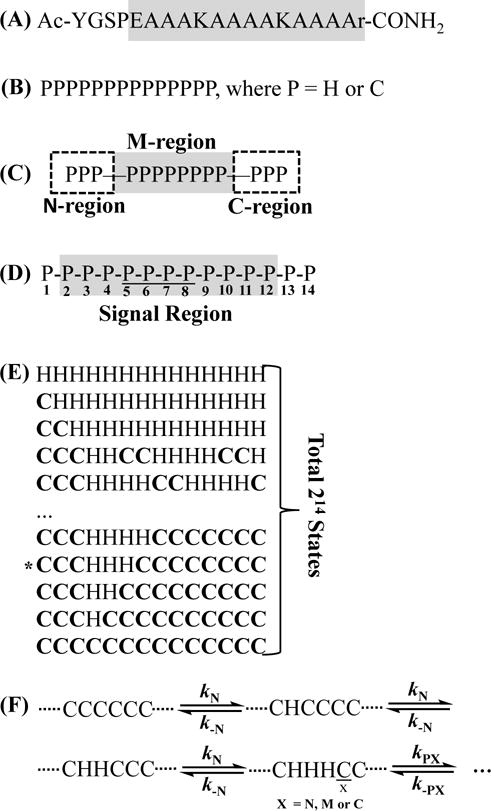
(A) Sequence of the AK peptide, where the grey region indicates the helical residues; (B) coarse-grained model derived based on 14 helical amide units in the gray region of (A); (C) definition of the three different regions; (D) definition of the signal region, where the underline indicates the 13C=O labeled amide units; (E) representative conformational states, where “*” denotes a helical nucleus; and (F) definition of the nucleation and propagation steps and the respective rate constants.
Unlike what has been done in many previous studies,2, 23, 43–45, 48–50, 69 which often treated the folding thermodynamics and kinetics of the helix-coil transition in question separately, herein we seek to develop a sequential and fully reversible kinetic model to simultaneously characterize the thermodynamic and kinetic properties of the AK peptide. The coarse-grained model of the AK peptide (Scheme 1) gives rise to a total of 214 conformational states. Thus, without further approximation, one needs to consider 214 × (214 – 1) elementary reaction steps in the calculation of its conformational relaxation kinetics, which is neither practical nor necessary. To reduce the number of rate equations, we assume that in one microscopic kinetic step only one amide unit is allowed to change its conformational state, either C→H (i.e., forward or folding reaction) or H→C (i.e., backward or unfolding reaction). While this assumption decreases the total number of kinetic equations to a more manageable one (i.e., 14 × 214), the corresponding kinetic analysis would still involve a large number of rate constants. Thus, we further make the following definitions and assumptions to reduce the number of variables or fitting parameters in the computer simulation: (1) the elementary steps leading to formation of a helical nucleus (i.e., —CHHHC—) are considered as the nucleation events and have the same rate constant; (2) an elementary step leading to lengthening of a preexisting helical nucleus or helical segment (i.e., a sequence with more than 3 contiguous H units) is defined as a propagation step; (3) the nucleation rate constant (kN) and the rate constant (k-N) of the corresponding reverse reaction are position independent; (4) within an individual region (i.e., C-, M-, or N-region) the helical propagation rate constant (i.e., kPC, kPM, or kPN) and the rate constant (i.e., k−PC, k−PM, or k−PN) of the corresponding reverse reaction are position independent; and (5) since the temperature dependence of the folding rate constant is usually small in comparison to that of the corresponding unfolding rate constant in an activated folding-unfolding process, herein only the unfolding rate constants are treated as temperature dependent. Taken together, these assumptions reduce the total number of rate constants in the full kinetic model to 12, which are treated as global variables in the global fitting of the experimental T-jump kinetics and CD curve. As discussed below, the total number of global fitting parameters could be further reduced by making additional assumptions.
Thermodynamic Treatment
It is easy to show that once all of the microscopic rate constants of the system in question are known for a given temperature, one can easily compute the free energy of any helical state, relative to that (G0) of the completely unfolded or disordered state (i.e., CCCCCCCCCCCCCC). As illustrated by a specific example (Scheme 2), when G0 is set to be zero, the free energy (Gi) of any one of the possible conformational states can be evaluated (where i represents state i). Based on this information, the population weight (χi) of the ith state (i = 1 to 214) at the temperature (T) of interest can be further determined by
| (1) |
where R is the gas constant.
Scheme 2.
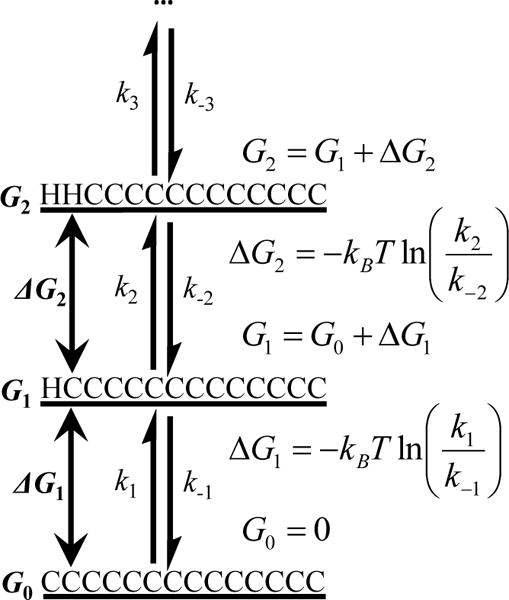
An example showing how the free energy (G) of any conformation state in the system can be calculated if all of the microscopic rate constants are known. For convenience, the free energy of the fully disordered state, G0, is set to zero.
Eq. (1) allows us to further evaluate the fractional helical content of the system at T, ξH(T), which is equal to the experimentally determined percent helicity at the same temperature via CD spectroscopy. It is straightforward to show that
| (2) |
where represents the total number of hH-bonds contained in state i and is the maximum number of hH-bonds that the AK peptide can form.
In order to use Eq. (2) to fit the CD thermal unfolding curve of the AK peptide, we need to further convert the CD signal at T to ξH(T). This is done by using the method of Baldwin and coworkers,70 as shown below:
| (3) |
with
| (4) |
and
| (5) |
where [θ]222 is the mean residue ellipticity measured at 222 nm, [θ]H is the mean residue ellipticity of the peptide with 100% helical content at 222 nm, [θ]C is the mean residue ellipticity of the peptide with 0% helical content at 222 nm, and n is the number of residues of the α-helix.
Kinetic Treatment
As indicated above, the VIPT-jump kinetics of Huang et al. were obtained by monitoring the amide I′ band of 4 13C-isotopically-labeled Ala residues in the middle of the AK peptide. The amide I′ band is an established IR probe of protein secondary structures because of its dependence on interactions involving backbone amide groups, such as hydrogen bonding formation and transition dipole couplings.71, 72 Considering these factors, we assume that (1) only those amide units highlighted in gray in Scheme 1, all of which are able to form a hH-bond with one of the isotopically-labeled amide units, can potentially contribute to the kinetics signal (S); (2) S is linearly proportional to the number of hH-bonds (NhHS) formed within the signal region; and (3) S = 0 if there is only 1 hH-bond formed within the signal region (due to lack of vibrational coupling). For easy counting, we use the following equation in the computer program to determine NhHS,
| (6) |
where P(j) = 1 or 0 when the jth amide unit of AK peptide is in the H or C state.
To fit the experimentally determined T-jump kinetic traces, the following master equation is solved numerically by a fourth-order Runge-Kutta algorithm,55, 73
| (7) |
where C is the concentration vector, r is the rate vector, and αT is the transpose of the stoichiometric matrix. Specifically, the C vector is a 214 × 1 matrix, while the α matrix is 14∙214 × 214, where the rows correspond to the elementary reactions in the model and the columns represent the states of the peptide. The matrix elements in α correspond to the reactant and product coefficients of the corresponding elementary reactions. The rate vector, r, is a 14∙214 × 1 matrix and contains all the rates of the corresponding elementary reactions in the model. To minimize the use of computer memory, the α matrix, each row of which contains only two non-zero values, is further converted into a sparse matrix in the calculation. Since the commonly used single-sequence approximation2, 23, 40, 49, 50, 74, 75 is not adopted in the current model, a single C→H (H→C) transition can lead to formation (breaking) of multiple hH-bonds due to the merging (splitting) of preexisting helical segments. For such conformational transitions, which are different from a simple propagation process, we evaluate their kinetics using a sequential model wherein the number of kinetic steps is determined based on the number of hH-bonds being formed (or broken).
Global Fitting
During the global fitting of the two T-jump kinetic traces and the CD thermal unfolding curve of the AK peptide, only the elementary rate constants are treated as variables. As described in detail below, the total number of rate constants is either 6, 9 or 12, depending on whether the propagation rate constants are assumed to be region dependent or not. Regardless of this dependence, the global fitting always started from the same initial values for all of the propagation rate constants. In addition, we choose the lower initial temperature (i.e., 0.5 °C) and the final temperature (i.e., 14.5 °C) of the T-jump experiment of Huang et al. as the two reference temperatures (T1 and T2). For a rate constant that is assumed to be temperature dependent, its values obtained at these two temperatures (i.e., kT1 and kT2) are used to further calculate the corresponding free energy barrier, , via the following relationships:
| (8) |
| (9) |
where kB is the Boltzmann constant and A is the pre-exponential factor. Because the exact value of A for the folding dynamics of alanine-based helical peptides is not known, we used a value of 1010 s−1 in the current study. Our choice of this value was based on a recent transient two dimensional infrared (2D IR) study,36 which showed that the local reorganization rate within an alanine-based α-helix is on the order of 100 ps, With determined, the value of the rate constant in consideration at any other temperature T (kT) can be further calculated via following equation:
| (10) |
Repeating this process for all other temperature-dependent rate constants would allow us to obtain all kinetic information required to determine the conformational distribution at T, hence allowing the CD signal at T to be evaluated.
Fitting Results
Within the framework of our kinetic model (Scheme 1), we first tested whether a simpler scheme, where all of the propagation rate constants are assumed to be position independent, can fit the experimental data. As indicated (Figure S1, Supporting Information), this treatment, which involves only 6 global fitting parameters, obviously fails the test. Next, we tested a more complex kinetic treatment which assumes that the propagation rate constants in the N-region and C-region are the same but they are different from those in the M-region (Scheme 2). As shown (Figure 3), this kinetic model, which involves a total of 9 global fitting parameters (Table 1), yields a reasonable description of the experimental CD and T-jump kinetics. It is worth noting that when these experimental data were individually fit to three equations, either 15 variables (i.e., 7 for fitting the CD curve to a two-state model when the temperature dependences of the folded and unfolded CD baseline are unknown76 and 4 for fitting each T-jump trace to a stretched exponential function) or 11 variables (if Eqs. (4) and (5) are used to describe the folded and unfolded CD baselines) would be required. Therefore, we believe that the 9 rate constants recovered from this coarse-grained kinetic model are statistically significant.
Figure 3.
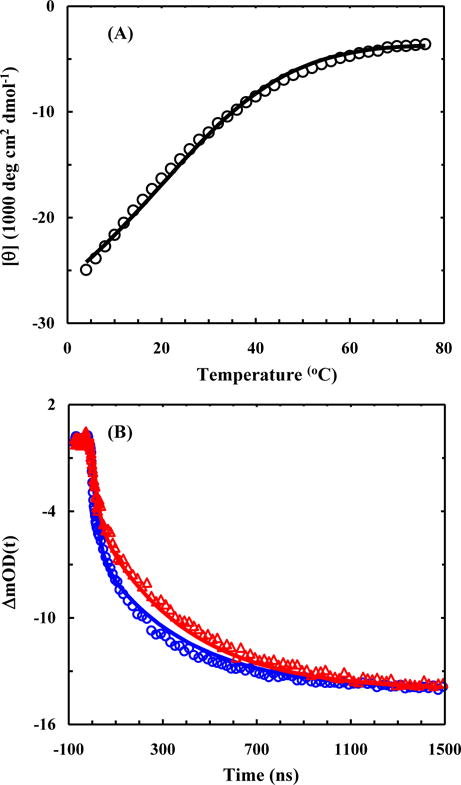
Global fitting results of the CD thermal unfolding curve (A) and the IR T-jump relaxation kinetics (B) of the AK peptide using 9 rate constants. In each case, the symbols represent the original experimental data and the line corresponds to the respective fit.
Table 1.
Rate constants obtained from the global fitting of the experimental CD T-melt curve and T-jump kinetic traces of the AK peptide using models that involves 9 parameters.
| T (°C) | (kN)−1 (ns) |
(k−N) −1 (ns) |
(kPN) −1 (ns) |
(kPM) −1 (ns) |
(kPC) −1 (ns) |
(k−PN) −1 (ns) |
(k−PM) −1 (ns) |
(k−PC) −1 (ns) |
|---|---|---|---|---|---|---|---|---|
| 0.5 | 104.7 | 28.0 | 6.9 | 5.9 | 6.9 | 14.4 | 15.1 | 14.4 |
| 14.0 | 104.7 | 20.7 | 6.9 | 5.9 | 6.9 | 10.2 | 14.5 | 10.2 |
As expected (Figure S2, Supporting Information), a more complex kinetic model, which assumes that the N-region, C-region, and M-region all have different propagation rate constants and hence has a total of 12 fitting variables (Table S1, Supporting Information), yields a more satisfactory fit to the CD thermal unfolding curve and the VIPT-jump kinetic traces of the AK peptide. While we believe that this model better reflects the microscopic mechanism of α-helix folding, the resultant fitting parameters could be problematic due to potential overfitting. In order to truly differentiate the difference between the folding-unfolding dynamics of the N-region and C-region, future studies involving collection of more VIPT-jump kinetics and similar global fitting are required. Nevertheless, the fact that the nucleation time constants obtained from the 9-parameter and 12-parameter models are almost identical (i.e., 104.7 ns versus 103.9 ns) suggests that the current analysis yields a reliable estimate of the time scale of the nucleation process.
In comparison, the fitting results obtained from our 9-paramter kinetic model are consistent with several expectations and previous studies. These include (1) for the nucleation process at 14.5 °C, the forward rate constant, kN = (104.7 ns)−1, is smaller than the backward rate constant, k−N = (20.7 ns)−1, which is consistent with the notion that the formation of an α-helix nucleus is a thermodynamically unfavorable event;38, 40, 45, 77–80 (2) for the propagation process, the trend is reversed (for the temperature range considered), which is consistent with the notion that propagation leads to α-helix stabilization;35, 38–40, 77, 79 (3) for the propagation process, the ratio between the forward rate constant and the backward rate constant is 2.5 for the M-region, 1.5 for the N-region and C-region, which is consistent with the fact that the middle region of an α-helix is more stable than its terminal regions;12, 31, 35, 61, 63, 65, 81 and (4) using the value of kN, which is the rate constant of a single C→H transition involved in the nucleation process according to our model, we determine the time required to form a helical nucleus (i.e., the —CHHHC— state in our model) to be about 315 ns. This value is in close agreement with that (i.e., 400 ns) reported by Kiefhaber and cowokers31 and that (i.e., 300 ns) reported by Werner et al.31, 82 for alanine-based peptides. Similarly, using the propagation rate constant obtained for the M-region (i.e., kPM), we calculate the time required to elongate a helical nucleus by 5 more hH-bonds (or 5 H sites according to our model) to be about 30 ns, which is again similar to that (50 ns) determined by Kiefhaber and coworkers.31 Moreover, our results are also broadly consistent with the molecular dynamics (MD) simulation study of De Sancho and Best,52 which showed that the timescales of the helix nucleation and elongation are 20–70 ns and ~1 ns, respectively, for an alanine-based peptide.
Finally, with the fitting results in hand, we can make a more detailed assessment of the helix-coil transition mechanism of the AK peptide. First, the conformational distribution calculated based on our model (Figure 4) indicates that there is a significant percentage of peptide molecules that contain more than one contiguous helical segment per peptide chain. Here one contiguous helical segment is defined as a series of H backbone units (two or more) that are next to each other. This result argues against the applicability of the commonly used single-sequence approximation. Second, the free energy profiles obtained at 0.5 and 14.5 °C indicate that fully helical and the fully disordered states are separated by a rather broad free energy barrier, located between 0 and 8 folded (or H) peptide units (Figure 5). This is consistent with a number of previous studies.2, 8, 23, 46, 50, 75, 83 Third, the minimum free energy surface is shallow at the folded side (Figure 5), allowing helical conformations with different helical chain length to populate. In addition, upon increasing the temperature from 0.5 to 14.5 °C, the helical conformation corresponding to the global free energy minimum is shortened from 11 H units to 8. A closer examination of the calculated conformational distribution at 14.5 °C reveals that most H units are concentrated in the middle region of the peptide, a picture consistent with the fact that the helical structure in the terminal regions of an α-helix is less stable and tends to be frayed.12, 31, 35, 58–60, 65, 75, 81, 84 As shown (Figure 6), the conformational distributions obtained at 0.5, 10.1 and 14.5 °C corroborate this notion as they indicate that, in this temperature range, increasing temperature does not lead to a simple population exchange, from the fully folded to the fully disordered conformation; instead, it mostly results in a decrease in the average helical chain length. It is this (gradual) conformational shift, a scenario that is in agreement with our qualitative interpretation of the experimental observation of Huang et al. (Figure 2), that causes the Ti-dependence in the T-jump measurements and therefore is the key to allow the propagation kinetics detectable. In support of this notion, comparing the equilibrium conformation distributions determined for 0.5 and 14.5 °C of the peptide with the transient conformational distribution obtained at 200 ns of the conformational relaxation kinetics, induced by a T-jump from 0.5 to 14.5 °C (Figure 7), indicates that a conformational shift involving mostly propagation steps occurs early, whereas a global unfolding process involving the nucleation step takes place at a later time.
Figure 4.
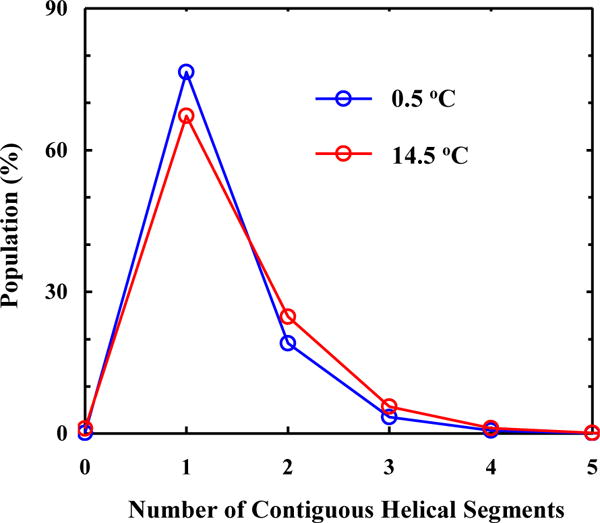
Percent population distribution of the AK peptide as a function of the number of contiguous helical segments separated by at least one C unit per peptide chain at 0.5 and 14.5 °C, as shown. As expected, these results indicate that increasing temperature leads to an increase in peptide populations having more but short helical segments.
Figure 5.
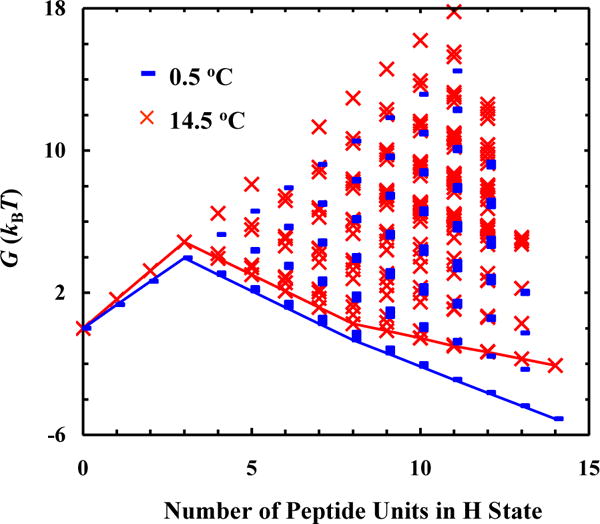
Free energy (G) of the AK peptide as a function of its conformation (i.e., the number of peptide units in H state) at 0.5 and 14.5 °C, as indicated. In each case, the line represents the minimum free energy surface. Each data point represents the free energy of a possible conformational state, calculated based on the definition in Scheme 2.
Figure 6.
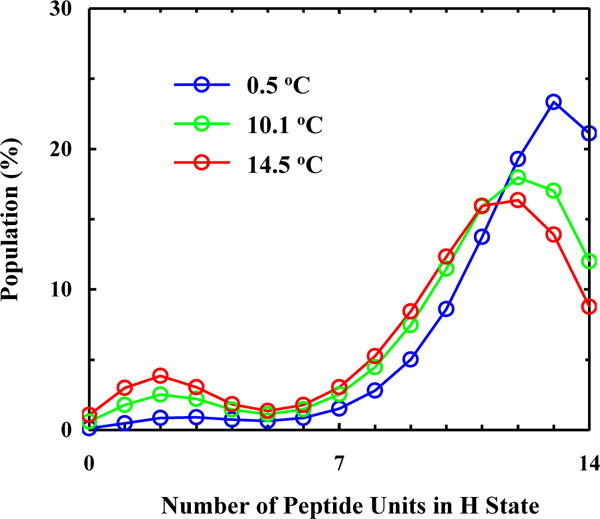
Conformational distribution of the AK peptide as a function of the number of peptide units in H state at 0.5, 10.1, and 14.5 °C, as indicated.
Figure 7.
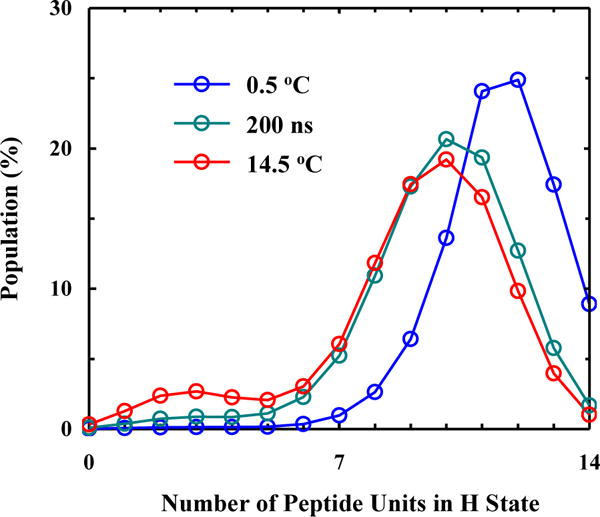
Comparison of equilibrium conformational distributions of the AK peptide at 0.5 and 14.5 °C with the transient conformational distribution obtained at 200 ns along the course of conformational relaxation induced by a T-jump from 0.5 to 14.5 °C.
CONCLUSIONS
For a protein or peptide that can only sample a folded and an unfolded state, the single-exponential rate constant of its T-jump induced conformational relaxation kinetics only depends on the final temperature (Tf).55 Thus, the study of Huang et al.,12 which showed that the conformational relaxation kinetics of an alanine-based α-helical peptide exhibit a measurable dependence on the initial temperature (Ti) when Tf is fixed, not only suggests that the α-helix folding does not follow a two-state mechanism but also provides additional experimental information that can be used to determine the underlying nucleation and propagation rate constants. Taking advantage of this point, herein we develop a one-dimensional (1D) kinetic Ising model that involves 214 conformational states and 9 fundamental rate constants to describe the folding kinetics and thermodynamics of this peptide. Using this model, we are able to globally fit the thermal unfolding curve and T-jump kinetics obtained by Huang et al., and hence extracting the rate constants for the elementary kinetic steps involved in the helical nucleation and propagation processes. Our results show that for this alanine-based peptide the nucleation process (i.e., forming the first α-helical turn) takes places on a timescale of about 315 ns, whereas the process of lengthening a preexisting helical segment by one more unit (i.e., propagation) occurs as quickly as 5.9 ns. Furthermore, it is worth noting that the current coarse-grained kinetic model is not only applicable for extract the microscopic folding-unfolding rate constants of alanine-based peptides, but can also be used to analyzing the folding dynamics of other helical peptides, as long as the underlying helix-coil transition in question exhibits measurable non-two-state behaviors.
Supplementary Material
Highlight.
The helical nucleation and propagation rate constants of an alanine-based peptide were explicitly determined, providing new insight into the helix-coil transition dynamics.
Acknowledgments
We gratefully acknowledge financial support from the National Institutes of Health (GM065978 and P41-GM104605).
Footnotes
SUPPORTING INFORMATION
Electronic Supplementary Information (ESI) available: Fitting results obtained from models involving 6 and 12 parameters.
References
- 1.Williams S, Causgrove TP, Gilmanshin R, Fang KS, Callender RH, Woodruff WH, Dyer RB. Biochemistry. 1996;35:691–697. doi: 10.1021/bi952217p. [DOI] [PubMed] [Google Scholar]
- 2.Thompson PA, Eaton WA, Hofrichter J. Biochemistry. 1997;36:9200–9210. doi: 10.1021/bi9704764. [DOI] [PubMed] [Google Scholar]
- 3.Dyer RB, Gai F, Woodruff WH, Gilmanshin R, Callender RH. Acc Chem Res. 1998;31:709–716. [Google Scholar]
- 4.Eaton WA, Munoz V, Thompson PA, Henry ER, Hofrichter J. Acc Chem Res. 1998;31:745–753. [Google Scholar]
- 5.Clarke DT, Doig AJ, Stapley BJ, Jones GR. Proc Natl Acad Sci USA. 1999;96:7232–7237. doi: 10.1073/pnas.96.13.7232. [DOI] [PMC free article] [PubMed] [Google Scholar]
- 6.Lednev IK, Karnoup AS, Sparrow MC, Asher SA. J Am Chem Soc. 1999;121:8074–8086. doi: 10.1021/ja003381p. [DOI] [PubMed] [Google Scholar]
- 7.Eaton WA, Muñoz V, Hagen SJ, Jas GS, Lapidus LJ, H ER, Hofrichter J. Annu Rev Biophys Biomol Struct. 2000;29:327–359. doi: 10.1146/annurev.biophys.29.1.327. [DOI] [PMC free article] [PubMed] [Google Scholar]
- 8.Thompson PA, Munoz V, Jas GS, Henry ER, Eaton WA, Hofrichter J. J Phys Chem B. 2000;104:378–389. [Google Scholar]
- 9.Huang C, Klemke J, Getahun Z, DeGrado W, Gai F. J Am Chem Soc. 2001;123:9235–9238. doi: 10.1021/ja0158814. [DOI] [PubMed] [Google Scholar]
- 10.Huang CY, Getahun Z, Wang T, DeGrado WF, Gai F. J Am Chem Soc. 2001;123:12111–12112. doi: 10.1021/ja016631q. [DOI] [PubMed] [Google Scholar]
- 11.Woutersen S, Hamm P. J Chem Phys. 2001;115:7737–7743. [Google Scholar]
- 12.Huang CY, Getahun Z, Zhu Y, Klemke JW, DeGrado WF, Gai F. Proc Natl Acad Sci USA. 2002;99:2788–2793. doi: 10.1073/pnas.052700099. [DOI] [PMC free article] [PubMed] [Google Scholar]
- 13.Kimura T, Takahashi S, Akiyama S, Uzawa T, Ishimori K, Morishima I. J Am Chem Soc. 2002;124:11596–11597. doi: 10.1021/ja026639f. [DOI] [PubMed] [Google Scholar]
- 14.Chen E, Kumita JR, Woolley GA, Kliger DS. J Am Chem Soc. 2003;125:12443–12449. doi: 10.1021/ja030277+. [DOI] [PubMed] [Google Scholar]
- 15.Krieger F, Fierz B, Bieri O, Drewello M, Kiefhaber T. J Mol Biol. 2003;332:265–274. doi: 10.1016/s0022-2836(03)00892-1. [DOI] [PubMed] [Google Scholar]
- 16.Wang T, Du D, Gai F. Chem Phys Lett. 2003;370:842–848. [Google Scholar]
- 17.Meisner WK, Sosnick TR. Proc Natl Acad Sci USA. 2004;101:13478–13482. doi: 10.1073/pnas.0404057101. [DOI] [PMC free article] [PubMed] [Google Scholar]
- 18.Roder H. Proc Natl Acad Sci USA. 2004;101:1793–1794. doi: 10.1073/pnas.0308172101. [DOI] [PMC free article] [PubMed] [Google Scholar]
- 19.Wang T, Zhu Y, Getahun Z, Du D, Huang CY, DeGrado WF, Gai F. J Phys Chem B. 2004;108:15301–15310. doi: 10.1021/jp037272j. [DOI] [PMC free article] [PubMed] [Google Scholar]
- 20.Bredenbeck J, Helbing J, Kumita JR, Woolley GA, Hamm P. Proc Natl Acad Sci USA. 2005;102:2379–2384. doi: 10.1073/pnas.0406948102. [DOI] [PMC free article] [PubMed] [Google Scholar]
- 21.Huang CY, Balakrishnan G, Spiro TG. Biochemistry. 2005;44:15734–15742. doi: 10.1021/bi051578u. [DOI] [PubMed] [Google Scholar]
- 22.Pozo Ramajo A, Petty SA, Starzyk A, Volk M. J Am Chem Soc. 2005;127:13784–13785. doi: 10.1021/ja054500+. [DOI] [PubMed] [Google Scholar]
- 23.Hamm P, Helbing J, Bredenbeck J. Chem Phys. 2006;323:54–65. [Google Scholar]
- 24.Du DG, Gai F. Biochemistry. 2006;45:13131–13139. doi: 10.1021/bi0615745. [DOI] [PubMed] [Google Scholar]
- 25.Balakrishnan G, Hu Y, Bender GM, Getahun Z, DeGrado WF, Spiro TG. J Am Chem Soc. 2007;129:12801–12808. doi: 10.1021/ja073366l. [DOI] [PMC free article] [PubMed] [Google Scholar]
- 26.Du DG, Bunagan MR, Gai F. Biophys J. 2007;93:4076–4082. doi: 10.1529/biophysj.107.108548. [DOI] [PMC free article] [PubMed] [Google Scholar]
- 27.Ye M, Zhang QL, Li H, Weng YX, Wang WC, Qiu XG. Biophys J. 2007;93:2756–2766. doi: 10.1529/biophysj.107.106799. [DOI] [PMC free article] [PubMed] [Google Scholar]
- 28.Ihalainen JA, Paoli B, Muff S, Backus EHG, Bredenbeck J, Woolley GA, Caflisch A, Hamm P. Proc Natl Acad Sci USA. 2008;105:9588–9593. doi: 10.1073/pnas.0712099105. [DOI] [PMC free article] [PubMed] [Google Scholar]
- 29.Backus EHG, Bloem R, Pfister R, Moretto A, Crisma M, Toniolo C, Hamm P. J Phys Chem B. 2009;113:13405–13409. doi: 10.1021/jp904905d. [DOI] [PubMed] [Google Scholar]
- 30.Mohammed OF, Jas GS, Lin MM, Zewail AH. Angew Chem Int Ed. 2009;48:5628–5632. doi: 10.1002/anie.200900513. [DOI] [PMC free article] [PubMed] [Google Scholar]
- 31.Fierz B, Reiner A, Kiefhaber T. Proc Natl Acad Sci USA. 2009;106:1057–1062. doi: 10.1073/pnas.0808581106. [DOI] [PMC free article] [PubMed] [Google Scholar]
- 32.Serrano AL, Tucker MJ, Gai F. J Phys Chem B. 2011;115:7472–7478. doi: 10.1021/jp200628b. [DOI] [PMC free article] [PubMed] [Google Scholar]
- 33.Donten ML, Hamm P. Chem Phys. 2013;422:124–130. [Google Scholar]
- 34.Gooding EA, Sharma S, Petty SA, Fouts EA, Palmer CJ, Nolan BE, Volk M. Chem Phys. 2013;422:115–123. [Google Scholar]
- 35.Neumaier S, Reiner A, Buttner M, Fierz B, Kiefhaber T. Proc Natl Acad Sci USA. 2013;110:12905–12910. doi: 10.1073/pnas.1303515110. [DOI] [PMC free article] [PubMed] [Google Scholar]
- 36.Tucker MJ, Abdo M, Courter JR, Chen J, Brown SP, Smith AB, Hochstrasser RM. Proc Natl Acad Sci USA. 2013;110:17314–17319. doi: 10.1073/pnas.1311876110. [DOI] [PMC free article] [PubMed] [Google Scholar]
- 37.Abaskharon RM, Gai F. Biophys J. 2016;110:1924–1932. doi: 10.1016/j.bpj.2016.03.030. [DOI] [PMC free article] [PubMed] [Google Scholar]
- 38.Zimm BH, Bragg JK. J Chem Phys. 1959;31:526–535. [Google Scholar]
- 39.Schwarz G. J Mol Biol. 1965;11:64–77. doi: 10.1016/s0022-2836(65)80171-1. [DOI] [PubMed] [Google Scholar]
- 40.Qian H, Schellman JA. J Phys Chem. 1992;96:3987–3994. [Google Scholar]
- 41.Chen Y, Zhou Y, Ding J. Proteins. 2007;69:58–68. doi: 10.1002/prot.21492. [DOI] [PubMed] [Google Scholar]
- 42.Lifson S, Roig A. J Chem Phys. 1961;34:1963–1974. [Google Scholar]
- 43.Munoz V, Henry ER, Hofrichter J, Eaton WA. Proc Natl Acad Sci USA. 1998;95:5872–5879. doi: 10.1073/pnas.95.11.5872. [DOI] [PMC free article] [PubMed] [Google Scholar]
- 44.Zwanzig R. Proc Natl Acad Sci USA. 1995;92:9801–9804. doi: 10.1073/pnas.92.21.9801. [DOI] [PMC free article] [PubMed] [Google Scholar]
- 45.Naganathan AN, Doshi U, Fung A, Sadqi M, Muñoz V. Biochemistry. 2006;45:8466–8475. doi: 10.1021/bi060643c. [DOI] [PMC free article] [PubMed] [Google Scholar]
- 46.Schellman JA. J Phys Chem. 1958;62:1485–1494. [Google Scholar]
- 47.Engel J, Schwarz G. Angew Chem Int Ed. 1970;9:389–400. doi: 10.1002/anie.197003891. [DOI] [PubMed] [Google Scholar]
- 48.Brooks CL. J Phys Chem. 1996;100:2546–2549. [Google Scholar]
- 49.Munoz V, Eaton WA. Proc Natl Acad Sci USA. 1999;96:11311–11316. doi: 10.1073/pnas.96.20.11311. [DOI] [PMC free article] [PubMed] [Google Scholar]
- 50.Thompson PA, Muñoz V, Jas GS, Henry ER, Eaton WA, Hofrichter J. J Phys Chem B. 2000;104:378–389. [Google Scholar]
- 51.Bertsch RA, Vaidehi N, Chan SI, Goddard WA. Proteins. 1998;33:343–357. doi: 10.1002/(sici)1097-0134(19981115)33:3<343::aid-prot4>3.0.co;2-b. [DOI] [PubMed] [Google Scholar]
- 52.De Sancho D, Best RB. J Am Chem Soc. 2011;133:6809–6816. doi: 10.1021/ja200834s. [DOI] [PubMed] [Google Scholar]
- 53.Bredenbeck J, Helbing J, Sieg A, Schrader T, Zinth W, Renner C, Behrendt R, Moroder L, Wachtveitl J, Hamm P. Proc Natl Acad Sci USA. 2003;100:6452–6457. doi: 10.1073/pnas.1036583100. [DOI] [PMC free article] [PubMed] [Google Scholar]
- 54.Hamm P, Helbing J, Bredenbeck J. Annu Rev Phys Chem. 2008;59:291–317. doi: 10.1146/annurev.physchem.59.032607.093757. [DOI] [PubMed] [Google Scholar]
- 55.Lin CW, Culik RM, Gai F. J Am Chem Soc. 2013;135:7668–7673. doi: 10.1021/ja401473m. [DOI] [PMC free article] [PubMed] [Google Scholar]
- 56.Davidon WC. SIAM Journal on Optimization. 1991;1:1–17. [Google Scholar]
- 57.Dolan ED, Lewis RM, Torczon V. SIAM Journal on Optimization. 2003;14:567–583. [Google Scholar]
- 58.Strehlow KG, Robertson AD, Baldwin RL. Biochemistry. 1991;30:5810–5814. doi: 10.1021/bi00237a026. [DOI] [PubMed] [Google Scholar]
- 59.Chakrabartty A, Schellman JA, Baldwin RL. Nature. 1991;351:586–588. doi: 10.1038/351586a0. [DOI] [PubMed] [Google Scholar]
- 60.Chakrabartty A, Kortemme T, Baldwin RL. Prot Sci. 1994;3:843–852. doi: 10.1002/pro.5560030514. [DOI] [PMC free article] [PubMed] [Google Scholar]
- 61.Yang S, Cho M. J Phys Chem B. 2007;111:605–617. doi: 10.1021/jp0649091. [DOI] [PubMed] [Google Scholar]
- 62.Murza A, Kubelka J. Biopolymers. 2009;91:120–131. doi: 10.1002/bip.21093. [DOI] [PubMed] [Google Scholar]
- 63.Best RB, Hummer G. J Phys Chem B. 2009;113:9004–9015. doi: 10.1021/jp901540t. [DOI] [PMC free article] [PubMed] [Google Scholar]
- 64.Neumaier S, Büttner M, Bachmann A, Kiefhaber T. Proc Natl Acad Sci USA. 2013;110:20988–20993. doi: 10.1073/pnas.1317973110. [DOI] [PMC free article] [PubMed] [Google Scholar]
- 65.Lin MM, Shorokhov D, Zewail AH. Proc Natl Acad Sci USA. 2014;111:14424–14429. doi: 10.1073/pnas.1416300111. [DOI] [PMC free article] [PubMed] [Google Scholar]
- 66.García AE, Sanbonmatsu KY. Proc Natl Acad Sci USA. 2002;99:2782–2787. doi: 10.1073/pnas.042496899. [DOI] [PMC free article] [PubMed] [Google Scholar]
- 67.Ghosh T, Garde S, García AE. Biophys J. 2003;85:3187–3193. doi: 10.1016/S0006-3495(03)74736-5. [DOI] [PMC free article] [PubMed] [Google Scholar]
- 68.Marqusee S, Baldwin RL. Proc Natl Acad Sci USA. 1987;84:8898–8902. doi: 10.1073/pnas.84.24.8898. [DOI] [PMC free article] [PubMed] [Google Scholar]
- 69.Doshi UR, Muñoz V. J Phys Chem B. 2004;108:8497–8506. [Google Scholar]
- 70.Luo P, Baldwin RL. Biochemistry. 1997;36:8413–8421. doi: 10.1021/bi9707133. [DOI] [PubMed] [Google Scholar]
- 71.Barth A, Zscherp C. Q Rev Biophys. 2002;35:369–430. doi: 10.1017/s0033583502003815. [DOI] [PubMed] [Google Scholar]
- 72.Serrano AL, Waegele MM, Gai F. Prot Sci. 2012;21:157–170. doi: 10.1002/pro.2006. [DOI] [PMC free article] [PubMed] [Google Scholar]
- 73.Korobov VI, Ochkov VF. Chemical Kinetics with Mathcad and Maple. Springer; New York: 2011. [Google Scholar]
- 74.Scholtz JM, Qian H, York EJ, Stewart JM, Baldwin RL. Biopolymers. 1991;31:1463–1470. doi: 10.1002/bip.360311304. [DOI] [PubMed] [Google Scholar]
- 75.Lednev IK, Karnoup AS, Sparrow MC, Asher SA. J Am Chem Soc. 2001;123:2388–2392. doi: 10.1021/ja003381p. [DOI] [PubMed] [Google Scholar]
- 76.Bunagan MR, Gao J, Kelly JW, Gai F. J Am Chem Soc. 2009;131:7470–7476. doi: 10.1021/ja901860f. [DOI] [PMC free article] [PubMed] [Google Scholar]
- 77.Muñoz V, Serrano L. Biopolymers. 1997;41:495–509. doi: 10.1002/(SICI)1097-0282(19970415)41:5<495::AID-BIP2>3.0.CO;2-H. [DOI] [PubMed] [Google Scholar]
- 78.Luo P, Baldwin RL. Proc Natl Acad Sci USA. 1999;96:4930–4935. doi: 10.1073/pnas.96.9.4930. [DOI] [PMC free article] [PubMed] [Google Scholar]
- 79.Sorin EJ, Pande VS. Biophys J. 2005;88:2472–2493. doi: 10.1529/biophysj.104.051938. [DOI] [PMC free article] [PubMed] [Google Scholar]
- 80.Miller SE, Watkins AM, Kallenbach NR, Arora PS. Proc Natl Acad Sci USA. 2014;111:6636–6641. doi: 10.1073/pnas.1322833111. [DOI] [PMC free article] [PubMed] [Google Scholar]
- 81.Ferrara P, Apostolakis J, Caflisch A. J Phys Chem B. 2000;104:5000–5010. [Google Scholar]
- 82.Werner JH, Dyer RB, Fesinmeyer RM, Andersen NH. J Phys Chem B. 2002;106:487–494. [Google Scholar]
- 83.Buchete NV, Straub JE. J Phys Chem B. 2001;105:6684–6697. [Google Scholar]
- 84.Jas GS, Middaugh CR, Kuczera K. J Phys Chem B. 2014;118:639–647. doi: 10.1021/jp410934g. [DOI] [PubMed] [Google Scholar]
Associated Data
This section collects any data citations, data availability statements, or supplementary materials included in this article.


