

Using lab-on-chip technology, bulky lab equipment is shrunk into a simple, portable, and quantitative microfluidic chip for DNA diagnostics.
Keywords: Microfluidics, point-of-care molecular diagnostics, isothermal amplification, recombinase polymerase amplification, digital PCR, sample preparation, plasma separation, microfluidic patterning, digital medicine, precision medicine
Abstract
Portable, low-cost, and quantitative nucleic acid detection is desirable for point-of-care diagnostics; however, current polymerase chain reaction testing often requires time-consuming multiple steps and costly equipment. We report an integrated microfluidic diagnostic device capable of on-site quantitative nucleic acid detection directly from the blood without separate sample preparation steps. First, we prepatterned the amplification initiator [magnesium acetate (MgOAc)] on the chip to enable digital nucleic acid amplification. Second, a simplified sample preparation step is demonstrated, where the plasma is separated autonomously into 224 microwells (100 nl per well) without any hemolysis. Furthermore, self-powered microfluidic pumping without any external pumps, controllers, or power sources is accomplished by an integrated vacuum battery on the chip. This simple chip allows rapid quantitative digital nucleic acid detection directly from human blood samples (10 to 105 copies of methicillin-resistant Staphylococcus aureus DNA per microliter, ~30 min, via isothermal recombinase polymerase amplification). These autonomous, portable, lab-on-chip technologies provide promising foundations for future low-cost molecular diagnostic assays.
INTRODUCTION
Point-of-care medical diagnostic assays (1) are ideally low cost, portable, simple, rapid, and capable of quantitative nucleic acid detection (2). Commercially available lateral flow test strips have many of these traits, but most current assays are qualitative, providing only positive/negative readouts (3), or require additional separate steps for DNA detection (4). Alternatively, real-time polymerase chain reaction (PCR), the current standard for highly sensitive quantitative molecular testing, is not well suited for low-cost field operation. It generally involves laboratory equipment (for example, thermal cyclers and centrifuges) that require external power sources, several hours of assay time, multiple manual sample preparation steps, or trained technicians (5). A device that is considerably simpler will allow a transition of centralized laboratory testing to ubiquitous nucleic acid testing at small clinics, field, or home settings.
One option to simplify the system design is to prepattern the reagents so that biochemical reactions can run directly on-chip. Techniques such as inkjet printing (6) or robotic contact pin printers (7) are widely used for patterning, but they may create varying footprint sizes due to contact angle. In addition, it is difficult to increase concentration while keeping small footprints because multiple print runs are necessary. Other printing methods, such as capillary printing (8), microfluidic networks (9), evaporation (10), and degas-based printing (11), usually create continuous line-shaped patterns rather than dot-shaped patterns. There is a need for a method that can concentrate the reagents into highly defined dot-shaped footprints that fit in the microwells so that multiplexed reactions can commence directly in the microwells without cross-contamination.
A second option to simplify the system design is to lower the required machinery complexity. Automation has been done using robotic commercial real-time PCR machines [for example, GeneXpert, Cepheid (12)]; however, these machines are very costly. We used new nucleic acid amplification technologies, such as isothermal amplification (2) and digital PCR (13, 14), to lower device complexity. Isothermal amplification is performed at constant temperature, so thermal cycling equipment is not required. Digital amplification is a method of quantifying nucleic acid concentrations; only end-point readout is necessary, so imaging shuttles in conventional PCR machines are not required. Digital amplification is also more robust than real-time PCR against variations in temperature, kinetics, time, and imaging (15). Previously, digital amplification has been conducted via droplet microfluidics (16, 17) or microfluidic wells (18–21); however, these techniques do not integrate on-chip sample preparation.
A third option to simplify the system design is by automating sample preparation. New polymerases can amplify directly in complex solutions, such as blood plasma (22), bypassing traditional phase separation or spin column purification; however, hemoglobin can still inhibit polymerase activity (23), necessitating the need to remove blood cells from blood plasma. The opaqueness of blood cells also interferes with optical readout. However, blood cell removal techniques, such as centrifugation, are difficult to miniaturize. Membrane or mechanical filter (24) methods can clog or cause hemolysis. Other microfluidic blood cell removal methods (25) that use the Zweifach-Fung effect (26, 27), acoustics (28), or inertia forces (29) require external equipment. Sedimentation methods (30–33) have yet to demonstrate on-chip nucleic acid detection. To address these issues, we developed digital plasma separation technology, which can automatically separate plasma into hundreds of microwells for digital amplification in one step.
A fourth option to further simplify the system design is to remove the necessity of peripheral pumps, power sources, connectors, and control equipment. Automated assays (34, 35) require fluid actuation equipment, increasing cost. Alternatively, capillary pumping in lateral flow assays (for example, pregnancy tests) (3, 36) is low cost, but the opaque wicking fibers render sensitive and quantitative optical detection difficult. Degas pumping (19, 20, 33, 37–39) is also equipment-free, but it provides insufficient flow control, speed, and robustness. Finger pumps, such as microfluidic solution isolated pumping (40), increase construction complexity by extra valves and layers. We addressed these issues by the vacuum battery system, which enables robust microfluidic pumping without any external equipment, using only a very simple construction.
Here, we present the self-powered integrated microfluidic point-of-care low-cost enabling (SIMPLE) chip (Fig. 1), which is designed to simplify the entire procedure from sample input to quantitative nucleic acid output. We integrated three technologies into one chip: reagent microfluidic patterning, digital plasma separation for digital nucleic acid amplification, and an integrated vacuum battery on the chip. With minimal manual operation, the portable chip performs digital quantitative nucleic acid detection directly from human whole blood samples in ~30 min via isothermal recombinase polymerase amplification (RPA) (41). These contributions address several bottlenecks of current methods (qualitative lateral flow tests and benchtop PCR machines) while retaining the advantages of simplicity, cost, portability, and quantitative molecular readout. This makes it one step closer to the realization of ubiquitous availability of decentralized molecular tests, which can ultimately aid rapid medical decisions.
Fig. 1. The SIMPLE chip for low-cost, quantitative, and portable nucleic acid testing.
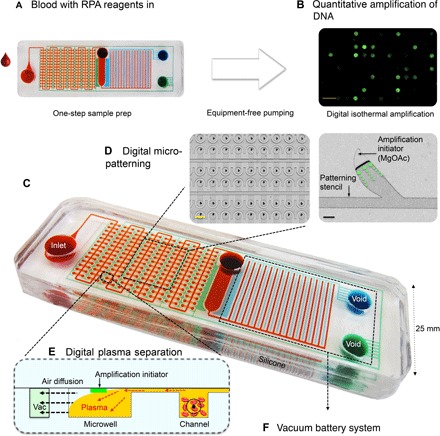
(A) The simple operation protocol requires minimal handling and no external pumps or power sources. Users may simply drop blood/amplification reagent mix into the inlet and then the chip performs automatic sample preparation. (B) The chip is then incubated on a reusable heat pack, and end-point isothermal digital amplification of nucleic acid is done (RPA). Scale bar, 2 mm. (C) Dye-loaded chip for visualization of microchannels. Red shows fluidic channels. Blue shows the main vacuum battery system. Green shows the auxiliary vacuum battery system. (D) Digital microfluidic patterning enables reagent patterning with common laboratory equipment. Left: After chip bonding. Right: Amplification initiator concentrated asymmetrically using a microapex stencil (see fig. S3 for details). Scale bars, 100 μm (black) and 1 mm (yellow). (E) Side view of the digital plasma separation design, which removes blood cells via sedimentation and skims plasma into dead-end wells for digital amplification. (F) The vacuum battery system frees the chip from external pumps or power sources for pumping. Vacuum is prestored in the large “battery” voids. Fluid is pumped by slowly releasing the prestored vacuum potential via air diffusion through lung-like structures.
RESULTS
Figure 1 (A and B) and movie S1 show the straightforward user protocol. The chip has a simple construction with two layers of polydimethylsiloxane (PDMS) (fig. S1 and movie S2). The device has a small footprint similar to glass slides (25 mm × 75 mm × 6 mm), making it possible to be stored indefinitely and transported easily in airtight aluminum vacuum-sealed pouches (fig. S2).
Prepatterning of the amplification initiator
We prepatterned the RPA amplification initiator [magnesium acetate (MgOAc)] on the chip so that the RPA reaction only starts when the rest of the reaction mix (primer/probe/enzymes/blood sample) enters the well. If the reagents were not in the well, undesired amplification would occur in the channels and create false-positive signal for digital amplification. Figure 2 shows the four main steps for digital microfluidic patterning. Figure S3 shows a detailed cross-sectional process flow. In the first step (digitization), the patterning stencil automatically separates the reagents into discrete islands (2 nl) via degas pumping. Excess MgOAc can be pipetted away from the two bottom holes. Because pipetting the liquid in the stencil causes unwanted air gaps at the petal tips, we used degas loading to remove any trapped bubbles. We thermally aged the blank surface to prevent rapid hydrophobic surface contact angle recovery, then treated the blank surface with oxygen plasma making the surface hydrophilic (42). We then immediately assembled the blank surface and stencil, applied vacuum treatment, and loaded reagents into the assembly by degas pumping. Because the surface of the prepatterning stencil (PDMS) is inherently hydrophobic, the amplification initiator (MgOAc) adheres to the hydrophilic blank surface. The stencil is then washed and reused. In the second step (drying), the reagents concentrate asymmetrically toward the apex structure because of capillary tension while air-drying, which creates isolated dot arrays of thin film reagent patterns. Otherwise, continuous lines of thin film reagents can cause an interference of bioassay and bonding problems when integrating microfluidic layers. The petal-shaped geometry was chosen because it yielded the most consistent patterning. The narrower base allows for clean compartmentalization; the sharp tip directs fluid drying toward the tips. The dried patterns have a footprint of less than 200 μm in length. We added fluorescein only to aid visualization, but it was not present in RPA reactions. After peeling off the patterning stencil layer, which is the third step, we observed a uniform pattern with minimal residue (average area, 2.3 × 104 μm2; SD, 103 μm2). The final step involved assembling the patterned MgOAc blank layer and the microfluidic layer by ultraviolet ozone (UVO) bonding and manual alignment. The separated and reduced footprint of the MgOAc prevents the patterns from overlapping with the bonding areas, thus avoiding leaks. It also helps reduce cross-contamination risks. After bonding, we tested the reconstituted uniformity by loading water into the patterned microwells. The reconstituted fluorescence distribution was slightly spread out, most likely due to photobleaching of fluorescein. We did not observe decreased activity of subsequent RPA reactions due to MgOAc degradation.
Fig. 2. Prepatterning of the amplification initiator on the chip.
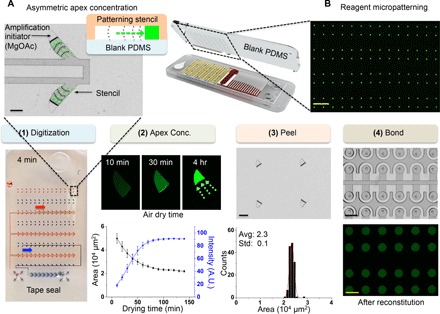
(A) The formation of concentrated asymmetric apex reagent thin film of MgOAc creates isolated spots and smaller footprints. Reagents concentrate asymmetrically toward the tip via capillary tension. Small reagent footprints prevent bonding problems and false positives. Scale bar, 200 μm. (B) Prepatterned MgOAc with fluorescein for visualization. Scale bar, 2 mm. There are four steps for patterning: (1) Reagents can be digitized into discrete samples by degas pumping using a patterning stencil. Food dye was used for visualization. Degas pumping works by slowly sucking the liquid when trapped air diffuses into prevacuumed air-permeable silicone (PDMS) material. A trailing air-gap digitizes the reagents into discrete patterns. (2) Asymmetric apex concentration (mean ± SD, n = 16). A.U., arbitrary units. (3) MgOAc adhered to the blank PDMS after top-patterning stencil is peeled off. Scale bar, 100 μm (black). (4) The patterned PDMS is flipped, aligned, and bonded on top of the layer containing microfluidic patterns for the SIMPLE chip. The microwells were reconstituted with water to verify uniformity. Scale bars, 250 μm (black) and 1 mm (yellow).
Digital plasma separation
The digital plasma separation design (Fig. 3A) prepares the sample for digital amplification by simultaneously enabling (i) autonomous plasma separation and (ii) autonomous sample compartmentalization. A microcliff structure (Fig. 3B) with a vertical sidewall and abrupt reduction in channel height facilitates plasma separation into the microwells. The microcliff skims the plasma near the top of the microchannel into wells, whereas blood cells sediment in the main channel. Plasma is drawn into the microwells when the remaining air diffuses across the air-permeable PDMS wall into the auxiliary battery. Note S1 explains the governing equations. The Navier-Stokes equation (43) describes the flow field; the blood cells experience gravity force and Stokes drag (44). By separating the blood cells, we ensure that there is minimal optical obstruction of the fluorescence signal and minimal polymerase inhibition from hemoglobin in red blood cells. Figure 3C shows simultaneous plasma separation and sample compartmentalization (224 microwells; 100 nl per well) for digital amplification. Varying the amount of liquid sample loaded can control the entrance time of the trailing air gap. We tuned the sample volume (100 μl) so that compartmentalization commences immediately when the microwell is filled. No clogging is observed. Figure S4 shows a detailed mechanism overview.
Fig. 3. One-step autonomous sample preparation with the digital plasma separation design.
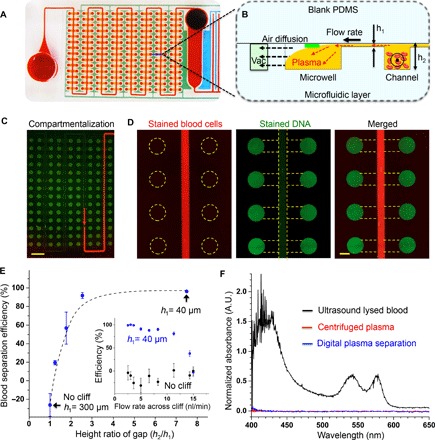
(A) This design enables simultaneous plasma separation and sample compartmentalization for digital isothermal amplification. (B) Blood cells drop below the microcliff gap because of sedimentation, and plasma near the top skims into the wells. Black dashed arrows depict air diffusion across the permeable silicone into the vacuum battery, sucking plasma into the microwells. (C) Automatic compartmentalization occurs when the trailing air gap separates the 224 microwells for digital amplification. Scale bar, 2 mm. (D) Fluorescence images of plasma separation of human blood mixed with DNA. DNA fluorescence in the main channels is obstructed by the opacity of blood cells. Scale bar, 500 μm. (E) Smaller microcliff gaps and lower flow speed can remove >95% of blood cells in the microwells. Dashed lines indicate simulation results. Solid dots indicate experimental results (mean ± SD, Pearson correlation = 0.99, n = 6). (F) No hemolysis was observed using our design. Ultrasound lysed blood, centrifuged plasma, and blood were loaded into separate chips, and absorbance in the microwells was recorded.
Efficient hemolysis-free blood cell removal
The microcliff design significantly reduces blood cell entry into the microwells (Fig. 3D and movie S3). The clear contrast of green-stained DNA inside the wells compared to the relatively colorless main channels shows that blood cells significantly obstruct fluorescence signal. Blood separation fails if there is no microcliff structure (fig. S5). When blood cells enter the wells, substantial obstruction of fluorescence signal from dyed DNA can occur (figs. S5 and S6). Separation efficiency (defined in Materials and Methods) surpasses 95% when the microcliff gap (h1) or flow rate across cliff is reduced (Fig. 3E). In the without-cliff negative control, the concentration of blood cells in the microwells was slightly higher than the original sample, contributing to a negative efficiency. This is likely due to inertial effects. In contrast, the microcliff gaps with h1 = 40 μm had the best and spatially consistent separation efficiency across the chip (fig. S7) and allowed 100% compartmentalization success (fig. S8 and movie S4). We observed no hemolysis (Fig. 3F). We compared chips loaded with blood, ultrasound lysed blood, and centrifuged plasma; on-chip separated plasma showed indistinguishable quality from centrifuged plasma when absorbance was measured in the microwells. Selective particle separation is possible according to diameter (fig. S9). Particles larger than 1 μm were separated, whereas particles less than 100 nm were retained in the wells. Plasma separation was achieved within 12 min, with a total volume of ~22 μl of plasma (fig. S10).
Vacuum battery on the chip
The system includes a vacuum battery and lung-like vacuum component with an optional waste reservoir (Fig. 4A). The battery is simply a punched void that stores vacuum. The vacuum lungs mimic lung alveoli gas exchange by allowing air to diffuse through thin, gas-permeable silicone (PDMS) walls into the vacuum battery (Fig. 4B). The vacuum battery system is not physically connected to the fluid lines; only air diffuses across the PDMS. There are two vacuum batteries on the chip. The main battery assists with pumping the main fluid that flows from the inlet to the waste reservoir. The auxiliary well loading vacuum battery system assists microwell loading. The waste reservoir retains the excess pumped liquid and prevents the liquid from immediately flowing to the vacuum lung area, which would prematurely stop air diffusion. It was possible to load and compartmentalize 224 dead-end microwells (Fig. 4C and movie S4). Dead-end loading is useful because it removes excess bubbles, which can cause clogging or catastrophic ejection of liquid when heated. Figure S11 shows a calibration of well loading speed versus applied negative pressure in the auxiliary battery. Figure S12 shows a comparison of mechanisms with conventional degas pumping. Conventional degas pumping lacks the additional battery voids and lung exchange structures and only uses bulk, vacuumed PDMS to absorb air. The vacuum battery system provides more robust and controlled flow because (i) more vacuum storage is possible with the battery void and (ii) air only needs to diffuse through thin PDMS walls in the vacuum lungs, resulting in more consistent pressure gradients than in conventional degas pumping, where air has to diffuse across large distances in the bulk PDMS.
Fig. 4. Vacuum battery on the chip.
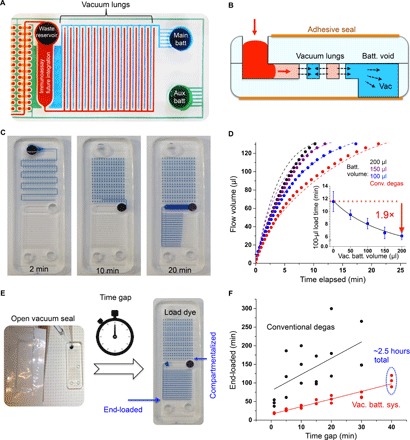
(A) Image of the two on-chip batteries. Channels are filled with dye for visualization only. (B) The basic unit of the vacuum battery system pumps fluid by slowly releasing stored vacuum potential via air diffusion over the vacuum lung structures. Black arrows depict trapped air diffusing across the vacuum lungs, which, in turn, suck fluid in. (C) Equipment-free loading and automatic sample compartmentalization in 10 min (dye). Digital amplification can be performed as soon as compartmentalization is finished. (D) Flow tuning by varying the main battery volume (auxiliary battery constant). Dashed lines indicate simulation results, solid lines indicate fitted result, and solid dots indicate experimental averages [mean ± SD; adjusted R2 = 0.99; P < 0.01, analysis of variance (ANOVA); n = 3]. (E) After opening the seal, the effect of the time gap before loading samples on the time it takes for the liquid to reach the end of the device was tested. Right photo shows end-loaded chip. (F) This chip has a long window of operation. It pumps for at least 2.5 hours after opening the vacuum pack (40-min gap time + 110-min loading time) and has higher reliability compared to conventional degas methods [Pearson’s R = 0.60 (black line) and 0.95 (red line); n = 3].
Autonomous pumping without external equipment
It was possible to pump fluid without using any external equipment (Fig. 4C and movie S4). Flow rate can be easily tuned by changing the battery size (Fig. 4D). We used the convection-diffusion equation to build a simplified diffusion model (note S2). We could also increase flow rates more markedly by adding additional “lung pairs” (fig. S13) because of increased gas exchange surface area. The batteries and lungs both contributed to increased linear flow rates (Fig. 4D and fig. S13B). The flow rate decay was much slower compared with conventional degassing; it was possible to increase the exponential decay time constant by a factor of ~5 (fig. S13D).
Robust flow and long operation window
The vacuum battery system gives plenty of user operation window time because it can pump reliably for approximately 2.5 hours in total (40-min idle time gap outside of vacuum + 110-min operation; Fig. 4F). The RPA incubation can be initiated as soon as all the microwells are completely compartmentalized, which can take less than ~15 min (fig. S14). The SD of the end loading time of the vacuum battery system was approximately eight times less than that of the conventional degassing (fig. S15).
One-step nucleic acid detection on the chip
We demonstrated quantitative digital nucleic acid detection directly from human blood. Figure 5A shows the concept of digital amplification (13). We chose RPA because it is much more robust in plasma samples than PCR or loop-mediated isothermal amplification (LAMP) (fig. S16). RPA is also a fast amplification method and operates at a wide range of temperatures (25° to 42°C). We used a fluorophore-quencher molecular probe (TwistAmp exo Probe) that only fluoresces when amplicons that match the sequence of interest are present; therefore, this method minimizes the possibility of false-positive signals. More detailed studies on the selectivity of RPA can be found in previous studies (45, 46). A reusable commercial sodium acetate instant heat pack can provide ~40°C heating for up to an hour for isothermal amplification (fig. S17). Unlike common problems that are often experienced when running PCR in microfluidic chips, evaporation was not an issue because of the lower temperature and shorter time frame. On the basis of previous theoretical analysis on digital PCR (47), we designed the chip with a smaller number of microwells (224 wells; 100 nl per well) that enable digital amplification. It is possible to further tune the dynamic range by several orders of magnitude for each specific desired application by designing a multivolume array of microwells. Limiting dilution can be avoided if each chip was designed with a dynamic range that tailors to each specific disease. It was possible to rapidly detect signals of HIV-1 RNA spiked in human blood (2 × 10⁵ copies μl−1) within 18 min (Fig. 5B). Quantitative detection of MRSA DNA from 10 to 105 copies μl−1 was possible in water (fig. S18) and also directly from spiked human whole blood (Fig. 5C).
Fig. 5. Quantitative digital amplification of nucleic acid.
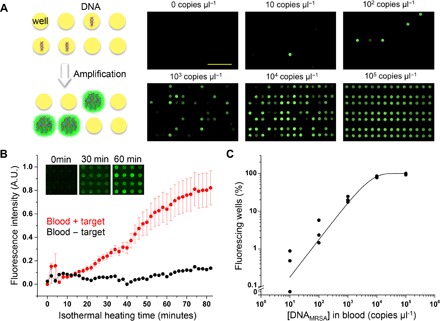
(A) Left panel shows the concept of digital amplification. Wells that have at least one or more target templates are amplified, whereas others remain unamplified. One can determine the original template concentration by counting the number of amplified wells. Isothermal nucleic acid amplification was done with RPA. Isothermal heating was done via reusable sodium acetate heat packs. Right panel shows end-point fluorescence images of reactions with different starting concentrations of methicillin-resistant Staphylococcus aureus (MRSA) DNA spiked in human whole blood. Scale bar, 5 mm. (B) The average intensity of positive spots increases to a detectable level within 18 min (signal difference >3× SD; mean ± SD; power = 0.99; P < 0.05, two-tailed t test; n = 5). In this test, HIV-1 RNA was spiked in human whole blood. (C) Quantification range of the SIMPLE chip. MRSA DNA was spiked into human whole blood for these tests (mean ± SD, solid line from fitting, adjusted R2 = 0.99, n = 3).
DISCUSSION
We set out to design a microfluidic chip that functions in low-resource settings, such as rural villages in third world countries, where there may be a lack of infrastructure, centralized laboratories, electricity, medical personnel, and funds for costly equipment. We designed a chip that provides an alternative to real-time PCR for on-site rapid quantitative nucleic acid testing while maintaining the advantages of lateral flow assays in terms of affordability, simplicity, and portability.
Our solution is the SIMPLE chip, where three technical obstacles were solved in one integrated design: (i) reagent microfluidic patterning, (ii) on-chip sample preparation, and (iii) equipment-free microfluidic pumping. This resulted in the following merits: simplicity, affordability, integrated sample preparation, portability, and fast quantitative nucleic acid readout. For simplicity and affordability, the SIMPLE chip is designed for minimal manual operation. The disposable chip has a simple two-layer construction; materials and reagents cost is less than $10 and can be further reduced when mass-produced. The chip is ideal for optical quantification, because it is made with highly transparent material (silicone) and there is no fibrous material interfering with optical readout in contrast to lateral flow assays. Equipment cost is significantly reduced because reusable heat packs or simple ovens can be used to run isothermal reactions, instead of using costly thermal cyclers. Robustness is inherent with a digital amplification system because end-point quantification can still be performed with slight temperature or incubation time variations, as long as a positive population of microwells can be distinguished from the negative microwells (15). Micropatterning of the amplification initiator allows for independent amplification directly in the microwells. This method is an alternative simple patterning method and is unique in its ability to concentrate the reagents into small footprints. For integrated sample preparation, using digital plasma separation, we have shown for the first time that it is possible to simultaneously perform automatic plasma separation (>95% blood cell removal, without hemolysis or clogging) and dead-end microwell compartmentalization to enable one-step digital amplification. For portability, the vacuum battery system enables portable, robust, and tunable pumping for up to 2.5 hours. Pumping is fully integrated into the small chip (6 mm × 25 mm × 75 mm), and the chip can be stored in vacuum seals, making the chip easily transportable. We foresee the rise of new chips using this pumping technology. For fast quantitative nucleic acid readout, the chip is able to quantitatively detect nucleic acids (10 to 105 copies μl−1). This is the most critical range in determining antibiotic treatment effectiveness and in predicting an MRSA patient’s mortality rate during acute infection, where pathogen concentration can spike by several orders of magnitude (48). For different pathogens, detection range can be further tuned by designing different microwell sizes. Total assay time can be as short as ~30 min (10-min plasma separation + 20-min isothermal incubation), and direct amplification from human blood samples is possible. This is significantly lower cost and faster readout than conventional benchtop PCR machines.
For the next step, our goal is to conduct field trials with larger clinical sizes. Although we already showed three new technologies working in concert, because of the scope of this paper, we have not yet incorporated all desired technologies within the same prototype. We plan to store premixed lyophilized reagents on the chip so that manual pipetting can be avoided. We aim to integrate microfluidic sample concentration (49) and lysing technologies (50), which are previously developed in our laboratory, into the SIMPLE chip to further increase the assay sensitivity. Our on-chip cell lysis is based on local hydroxide generation by integrated electrodes, which can dissociate water molecules and create hydroxide ions in microfluidic devices. Without using external chemical/surfactants/enzymes, the locally generated hydroxide ions can lyse the cell membrane. Alternatively, other lysing methods, such as ultrasound or heating, may be feasible to lyse cells, bacteria, and viruses. Before full integration with these components, the SIMPLE chip can be used as a downstream quantification assay in conjunction with current commercially available extraction kits. Currently, we are using a benchtop stereoscope for imaging; we aim to integrate a simple, low-cost, handheld imaging system developed in our laboratory (51), which can be used for telemedicine applications. Furthermore, we aim to adopt scalable manufacturing methods for this chip.
Potential applications of this chip include monitoring HIV viral load and rapid detection of MRSA infection. Furthermore, it is possible to pattern different primers into the wells and to perform multiplexed detection for pathogens, such as Ebola, dengue, and malaria, on the same chip. Alternatively, this device can be adopted in hospital intensive care units for rapid multiplexed nucleic acid screening.
In summary, the SIMPLE chip provides a rapid and low-cost solution for on-site quantitative nucleic acid detection in a portable format. Three technologies are integrated into one fully portable design, namely, (i) microfluidic patterning of reagents, (ii) digital plasma separation for one-step sample preparation, and (iii) portable pumping by the vacuum battery system. We demonstrated quantitative detection of spiked nucleic acid targets directly from blood samples in 30 min. These technologies will pave the way for a new genre of testing that has the simplicity and portability of dipstick style tests (for example, pregnancy) while providing on-site quantitative (or multiplexed) nucleic acid detection at orders of magnitude lower cost than conventional real-time PCR.
MATERIALS AND METHODS
Fabrication of microfluidic chips
A cross section of the bilayer chip construction is shown in fig. S1. We fabricated the chips using the standard soft lithography process (52). Briefly, we made the bottom 3-mm PDMS fluidic layer by casting PDMS on a silicon wafer that had protruding microfluidic channels created from photopatterned (OAI Series 200 Mask Aligner) SU-8 photoresist (MicroChem). The main fluid and vacuum channels were 300 μm in height. For the microcliff gap, we made heights of 40, 120, 170, 240, and 300 μm. We created the waste reservoir using a 5-mm puncher (Harris Uni-Core, Ted Pella).
We fabricated the vacuum battery void by simply punching the bottom 3-mm PDMS fluidic layer with through holes. Different diameters of punchers (Harris Uni-Core, Ted Pella) were used to fabricate the desired vacuum battery volumes. A separate top blank piece of 3-mm PDMS was bonded on the top side to seal the fluidic layer by oxygen plasma bonding using a reactive ion etching machine (PETS Reactive Ion Etching System, at 100 W, 120 mtorr O2, and 15 s). All chips were made the same size (25 mm × 75 mm), which is the same footprint as a standard microscope glass slide. For the RPA experiments, we patterned the blank PDMS layer with MgOAc (fig. S3) and passivated the microfluidic surfaces with an anti-biofouling surface treatment so that nonspecific adsorption of protein/DNA would be minimized. Finally, a transparent PCR tape (optical sealing tape, Bio-Rad) was taped on both the bottom and top surfaces of the chip to prevent excess gas diffusion and to seal off the vacuum battery voids. New chips were used for each experiment.
Master mold replication
To increase the device assembly throughput, we replicated the master silicon mold by casting a urethane plastic (Smooth-Cast 327, Smooth-on Inc.) over the molded PDMS devices placed in square petri dishes. A thin layer of release agent (Ease Release, Smooth-on Inc.) was applied to the surface of the petri dishes to prevent urethane from sticking. The PDMS devices and urethane resin were degassed before casting so that no air bubbles would be trapped. The first hour of curing was done at 4°C to lower viscosity and slow curing of the urethane resin, thus avoiding air bubbles. Afterward, the resin was left to cure at room temperature overnight and removed from the petri dishes. PDMS was poured into the hardened urethane molds to make devices.
Reagent microfluidic patterning
We thermally aged the blank PDMS layer (MgOAc adhering) at 100°C for at least 3 days. The heat treatment prevents hydrophobic recovery of the plasma-treated PDMS surface. We sealed the outlets on the patterning stencil with scotch tape and then incubated both the blank and stencil layer in vacuum (−90 kPa) for at least 10 min. We then exposed the blank layer surface with oxygen plasma (PETS Reactive Ion Etching System, at 100 W, 120 mtorr O2, and 50 s) to make the surface hydrophilic. After plasma treatment, the blank was immediately assembled with the patterning stencil (also made by soft lithography, with 30-μm-thick microfluidic features) and vacuumed (−90 kPa) for 10 min. Then, we immediately pipetted 2 μl of 1 M MgOAc solution (63052, Sigma-Aldrich) to each of the inlets (for the fluorescence pictures, fluorescein dye was added). After finishing autonomous loading by degas pumping (~10 min), we removed the tape at the outlet and aspirated excess MgOAc. The chip was left to air-dry in atmosphere for 1 day before peeling (heating to 60°C increases drying speed). After drying, we peeled off the patterning layer in the direction from the base to the tips of the leaf patterns. The patterned MgOAc remained on the blank chip because it was less hydrophobic than the patterning stencil PDMS. We preserved the patterned MgOAc blank chip in vacuum (−70 kPa).
After the blank PDMS layer was patterned with MgOAc, it was bonded to the chips that contained the microfluidic wells and channels for the digital plasma separation design using UV (UVO-Cleaner, model 42, Jelight) for 3 min. The chips were aligned manually under a stereoscope. We incubated the chips immediately at 60°C for at least 20 min after UV bonding. A weight of ~0.5 kg was placed on the chips to increase bonding strength. For the reconstitution test, the final assembled chips were incubated at −95 kPa overnight, and water was loaded into the chip to dissolve the MgOAc. We took images as soon as the microwells were filled with water.
Vacuum charging and storage
We incubated the devices at −95 kPa for 24 hours in a vacuum chamber before liquid loading experiments. The devices could be sealed in aluminum vacuum packs with a vacuum sealer (V-402, Van der Stähl Scientific) if long-term storage or transportation was necessary (fig. S2 and movie S2). We chose aluminum-based packaging because it has the highest barrier characteristics against gas and water vapor. Above 20 μm in thickness, aluminum is essentially impermeable to gas and water vapor, so vacuum storage should be viable for many years. In our laboratory, we have had chips packed in vacuum seals for at least 3 years and pumped liquid normally. The actual limiting factor for shelf life is the enzymes. We used commercially available kits that have expiration dates of 1 year.
Quantification
We took all fluorescence and bright-field images of zoomed-in regions with a stereoscope (Axio Zoom EMS 3/SYCOP 3, AxioCam MR3 camera, Zeiss) at a 720× zoom (PlanNeoFluar Z 1.0× objective, Zeiss). We used the 38 HE green fluorescence filters and 63 HE red fluorescence filters (Zeiss) to visualize fluorescein, fluorescein amidite (FAM), TOTO-1, and CellMask Orange dyes. The bit depth was 12 bits, and images were 692 × 520 pixels (2 × 2 binning mode). The raw images were in gray scale, and green or red pseudocoloring was applied to the fluorescence images. Acquisition of images and zoomed videos was done with Zen (version 2012, Zeiss) software. For visualization aid, contrast and brightness of images were adjusted and applied equally to controls and across the entire image for the same experimental set. Imaging was done at room temperature. We used the National Institutes of Health’s ImageJ and Zen software to quantify the fluorescence intensities, normalize contrast and brightness, crop images, and merge channels. We acquired time-lapse videos of the entire chip loading using the TimeLapse application (xyster.net LLC) using iPhone 5 (Apple).
Digital plasma separation
For the experiments in Fig. 3, we kept the main channel flow rate at 5 μl min−1 using a syringe pump (NE-1600, New Era Pump Systems Inc.). We controlled the flow rate into the wells by tuning the vacuum strength to the auxiliary battery. Figure S11 shows a schematic of the setup and correlation of flow rate versus auxiliary battery pressure. We dyed the DNA with green fluorescence (TOTO-1 iodide, Invitrogen) by mixing MRSA DNA (1013 copies μl−1) with 400× TOTO-1 [diluted in 3.5× tris-borate EDTA (TBE)] at a ratio of 1:50 and then incubating for 1 hour at 55°C. We dyed human whole blood [Normal Human Whole Blood-Acid Citrate Dextrose (HMWBACD), BioreclamationIVT]. All samples were collected from consented donors under International Review Board–approved protocols (at BioreclamationIVT’s U.S. Food and Drug Administration–licensed donor center) with fluorescence (CellMask Orange C10045, Invitrogen) by mixing 2× CellMask dye (diluted in 3.5× TBE) into human whole blood (4:9 ratio) and incubated at 37°C for 20 min. The dyed blood was centrifuged five times [1300 relative centrifugal force (rcf), 5 min]; the supernatant was removed each time and replaced with fresh 3.5× TBE buffer. Finally, the stained DNA was added to the stained blood to make a final mixture that had 20% (v/v) blood. This mixture was loaded into the SIMPLE chip, and the separation efficiency was quantified. Separation efficiency was calculated as follows: 1 − (blood intensity in well-background intensity)/(blood intensity in main channel–background intensity). For the data in Fig. 3E, we used chips that had different microcliff gaps (40, 120, 170, 240, and 300 μm).
Hemolysis test
For the ultrasound-treated control, we lysed blood [20% (v/v) human whole blood in phosphate-buffered saline (PBS)] with 40-Hz ultrasound (120 W) (GB-2500B, Green Ultrasonic) for 90 min. This was then loaded into the SIMPLE chip. For the centrifuge control, we took the same blood sample and centrifuged it for 10 min at 1300 rcf, extracted the plasma supernatant, and then loaded the supernatant plasma into another SIMPLE chip. For the digital plasma separation control, we dropped the same blood sample directly into the SIMPLE chip. All chips were of the 40-μm microcliff gap, 16–lung pair, and 100-μl vacuum battery design and incubated in vacuum (−95 kPa) for 24 hours before testing. We measured the absorbance inside the microwells with a spectrometer (USB2000, Ocean Optics) mounted to a microscope (BX51, Olympus) at a 50× zoom. We normalized the background to a chip loaded with PBS only.
Vacuum battery and lung surface area experiments
We preloaded 200 μl of diluted blue food dye into polytetrafluorethylene (PTFE) tubes (Microbore PTFE Tubing, 0.03″ ID, Cole-Parmer) that had a steel tubing connector (SC20/15, Instech Laboratories) that connects to the chip. The tubing was connected to the inlet of the devices after taking the devices out of the vacuum. The conventional degas (no-battery) devices had PDMS cured into all the vacuum lines to fill the vacuum battery structure. The conventional degas and with-battery devices had exactly identical fluidic channels, except that the conventional degas device had all of the vacuum lines and battery voids filled with cured PDMS (via degas pumping). We monitored the volume of food dye pumped by taking a time-lapse video and then by quantifying using ImageJ. Triplicates were performed for each data point. We changed the battery volume by punching holes that had different diameters. We modified the vacuum lung surface area by creating new molds with different numbers of lung pairs.
Time gap out of vacuum experiments
We took the devices out of the vacuum chamber and left it idle in atmospheric pressure for a defined amount of time (time gap). One hundred microliters of diluted blue food dye (Assorted Food Coloring, Safeway; 1:25 dilution in water) was pipetted into the inlet at different time gap intervals. A time-lapse video was taken, and the flow rate was analyzed with ImageJ and Aegisub software. Compartmentalization completion is defined as when the air gap separates all of the 224 microwells. End loading is defined as when the dye reaches the end of the vacuum lung structures.
Isothermal digital amplification
We performed all DNA (MRSA) detection experiments with the RPA exo kit (TwistDx). RNA (HIV-1) experiments were done with the RPA exo RT kit. Sequences for primers, FAM probes, and the template can be found in table S1. These sequences were designed, according to the original RPA publication (41), and ordered through Biosearch Technologies and Integrated DNA Technologies. We prepatterned MgOAc into the wells and treated the fluidic surface with an anti-biofouling treatment.
For the reaction time experiment (Fig. 5B) with HIV-RNA, we mixed 10 μl of human whole blood (HMWBACD, BioreclamationIVT) with an RPA mix [two RPA exo RT enzyme pellets, 40 μl of primer/probe mix at 6 μM, 59 μl of rehydration buffer, 2 μl of 10% (w/v) bovine serum albumin (BSA), 8 μl of RNasin, and 2 μl of spiked HIV-1 RNA at 2 × 10⁵ copies μl−1]. One hundred microliters of blood/RPA mix was added into each chip and incubated at 40°C, and fluorescence time-lapse images were taken with a stereoscope (Axio Zoom, Zeiss; n = 5).
For the DNA quantification experiments (Fig. 5C), 2.5 μl of human whole blood was mixed with an RPA mix [two RPA exo enzyme pellets, 1.6 μl of primer/probe mix (primer/probe, 0.875) at 100 μM, 59 μl of rehydration buffer, 2 μl of 10% (w/v) BSA, 35 μl of water, and 2.5 μl of spiked MRSA DNA at a desired concentration]. One hundred microliters of blood/RPA mix was added into each chip and incubated at 40°C on instant heat packs (HotSnapZ) for 1 hour, and then endpoint fluorescence images were taken with a stereoscope. All concentrations of target DNA/RNA in the RPA experiments denote the original concentration from the spiked sample, not the concentration in the final reaction setup. This is done to make the correlation with applications such as viral load counting more straightforward. Contrast of images was enhanced using the auto-contrast algorithm in the Zeiss Zen software, and wells that had fluorescence above the baseline threshold were counted.
Statistical analysis
We noted the sample sizes in the corresponding figure legends. All experimental data are shown as means (except for scatterplots), and error bars denote ±1 SD. Replicates represent technical replicates. Experiments were replicated at least three times in our laboratory. The sample size was chosen to achieve power > 0.8 and α = 0.05. All data points were included except for devices that were defective (that is, bonding leaks). Devices to be tested were not labeled and randomly drawn out of a box. Further experimental blinding was not performed. We used the Shapiro-Wilk test and verified that the data were normally distributed. For Fig. 2, a Gaussian distribution fits the histogram. For Fig. 3E, the dashed line is from the simulation results (Pearson correlation = 0.99; P < 0.01, two-tailed test; n = 6). For Fig. 4D (inset), we fitted the data with the inverse function y = a + b × (x + c)−1 (adjusted R2 = 0.99; P < 0.01, ANOVA). For Fig. 4F, we fitted the data with the linear function y = ax + b. Pearson’s R was 0.60 and 0.95 for the black and red lines, respectively. For Fig. 5B, power = 0.999, P < 0.05 (two-tailed t test). We used OriginPro (version 9.0, OriginLab) for statistical analysis. For Fig. 5C, the solid line is fitted with the exponential function A (1 − e−Bx) (adjusted R2 = 0.99, n = 3). The supplementary figure legends describe the statistical analysis methods and sample sizes used in each corresponding figure.
Supplementary Material
Acknowledgments
We thank M. Y. Huang for providing technical assistance and K. Feng for the computer animations. We thank P. Lum at the Biomolecular Nanotechnology Center for technical assistance. We also thank the BIOPOETS lab members for providing valuable feedback. The HIV primers for RPA were supplied by O. Piepenburg and N. Armes (TwistDx, U.K.). Funding: This work was funded by the Defence Advanced Research Projects Agency HR0011-12-2-0003 and the Bill & Melinda Gates Foundation through the Grand Challenges in Global Health Initiative OPP1028785. Author contributions: L.P.L. conceived and initiated the microfluidic integrated molecular diagnostic system (iMDx). E.-C.Y. designed and fabricated the initial prototype. E.-C.Y., L.H., R.T., and J.F. participated in device characterization. E.-C.Y., L.H., R.T., and L.P.L. analyzed the data. E.-C.Y. and C.-C.F. participated on experimental designs. J.F. and E.-C.Y. made the videos with help from K. Feng. L.P.L. provided mentorship and feedback. E.-C.Y. and L.H. performed the simulations. E.-C.Y. and L.P.L. wrote the manuscript. Competing interests: Patents have been filed relating to this work. E.-C.Y. is a cofounder of mFluiDx; his work on the manuscript was done while he was a graduate student at the University of California, Berkeley, before his position at mFluiDx. L.P.L. and E.-C.Y. filed three patents related to the work with University of California, Berkeley, Office of Technology Licensing: BK-2015-185 [“Self-powered integrated microfluidic point-of-care low-cost enabling (SIMPLE) chip and digital micro-patterning of reagents,” PCT/US16/56127, PCT filed; priority date: 7 October 2015], BK-2013-143 (“Digital fluid sample separation apparatus and methods for one step quantitative sample analysis,” WO2015021425 A1, PCT published; priority date: 9 August 2013), and BK-2015-034 (“Vacuum battery system for portable microfluidic pumping,” WO2016044532 A1, PCT published; priority date: 17 September 2014). Data and materials availability: All data needed to evaluate the conclusions in the paper are present in the paper and/or the Supplementary Materials. Additional data related to this paper may be requested from the authors.
SUPPLEMENTARY MATERIALS
Supplementary material for this article is available at http://advances.sciencemag.org/cgi/content/full/3/3/e1501645/DC1
fig. S1. Exploded view of the simple construction.
fig. S2. Vacuum charging and long-term storage.
fig. S3. Detailed steps of micropatterning.
fig. S4. Digital plasma separation mechanism overview.
fig. S5. Failure of blood separation without the microcliff.
fig. S6. Optical signal obstructed when blood cells are not removed.
fig. S7. Microcliff gap effect on spatial robustness.
fig. S8. Reliable compartmentalization with smaller microcliff gap designs.
fig. S9. Selective particle separation according to size.
fig. S10. Total plasma volume separated versus time.
fig. S11. Microwell filling speed versus vacuum strength.
fig. S12. Vacuum battery system versus conventional degas pumping.
fig. S13. Vacuum lungs enable flow tuning.
fig. S14. Compartmentalization of all 224 microwells can be done in 12 min.
fig. S15. Consistent loading with the vacuum battery system.
fig. S16. RPA is more robust against plasma samples than LAMP and PCR.
fig. S17. Isothermal heating using reusable instant heat packs.
fig. S18. On-chip digital quantitative detection of MRSA DNA spiked in water.
note S1. Simulation of particle trajectories.
note S2. Diffusion through vacuum battery.
table S1. Primer, probe, and target sequences.
movie S1. User protocol.
movie S2. Cross section.
movie S3. Digital plasma separation.
movie S4. Vacuum battery system.
REFERENCES AND NOTES
- 1.Yager P., Domingo G. J., Gerdes J., Point-of-care diagnostics for global health. Annu. Rev. Biomed. Eng. 10, 107–144 (2008). [DOI] [PubMed] [Google Scholar]
- 2.Niemz A., Ferguson T. M., Boyle D. S., Point-of-care nucleic acid testing for infectious diseases. Trends Biotechnol. 29, 240–250 (2011). [DOI] [PMC free article] [PubMed] [Google Scholar]
- 3.Posthuma-Trumpie G. A., Korf J., van Amerongen A., Lateral flow (immuno)assay: Its strengths, weaknesses, opportunities and threats. A literature survey. Anal. Bioanal. Chem. 393, 569–582 (2009). [DOI] [PubMed] [Google Scholar]
- 4.Parolo C., Merkoçi A., Paper-based nanobiosensors for diagnostics. Chem. Soc. Rev. 42, 450–457 (2013). [DOI] [PubMed] [Google Scholar]
- 5.Craw P., Balachandran W., Isothermal nucleic acid amplification technologies for point-of-care diagnostics: A critical review. Lab Chip 12, 2469–2486 (2012). [DOI] [PubMed] [Google Scholar]
- 6.Singh M., Haverinen H. M., Dhagat P., Jabbour G. E., Inkjet printing—Process and its applications. Adv. Mater. 22, 673–685 (2010). [DOI] [PubMed] [Google Scholar]
- 7.Hitzbleck M., Delamarche E., Reagents in microfluidics: An ‘in’ and ‘out’ challenge. Chem. Soc. Rev. 42, 8494–8516 (2013). [DOI] [PubMed] [Google Scholar]
- 8.Kim E., Xia Y., Whitesides G. M., Polymer microstructures formed by moulding in capillaries. Nature 376, 581–584 (1995). [Google Scholar]
- 9.Delamarche E., Bernard A., Schmid H., Michel B., Biebuyck H., Patterned delivery of immunoglobulins to surfaces using microfluidic networks. Science 276, 779–781 (1997). [DOI] [PubMed] [Google Scholar]
- 10.Demko M. T., Cheng J. C., Pisano A. P., High-resolution direct patterning of gold nanoparticles by the microfluidic molding process. Langmuir 26, 16710–16714 (2010). [DOI] [PubMed] [Google Scholar]
- 11.Nevill J. T., Mo A., Cord B. J., Palmer T. D., Poo M.-m., Lee L. P., Heilshorn S. C., Vacuum soft lithography to direct neuronal polarization. Soft Matter 7, 343–347 (2011). [Google Scholar]
- 12.Helb D., Jones M., Story E., Boehme C., Wallace E., Ho K., Kop J., Owens M. R., Rodgers R., Banada P., Safi H., Blakemore R., Lan N. T. N., Jones-López E. C., Levi M., Burday M., Ayakaka I., Mugerwa R. D., McMillan B., Winn-Deen E., Christel L., Dailey P., Perkins M. D., Persing D. H., Alland D., Rapid detection of Mycobacterium tuberculosis and rifampin resistance by use of on-demand, near-patient technology. J. Clin. Microbiol. 48, 229–237 (2010). [DOI] [PMC free article] [PubMed] [Google Scholar]
- 13.Vogelstein B., Digital PCR. Proc. Natl. Acad. Sci. U.S.A. 96, 9236–9241 (1999). [DOI] [PMC free article] [PubMed] [Google Scholar]
- 14.Heyries K. A., Tropini C., VanInsberghe M., Doolin C., Petriv O. I, Singhal A., Leung K., Hughesman C. B., Hansen C. L., Megapixel digital PCR. Nat. Methods 8, 649–651 (2011). [DOI] [PubMed] [Google Scholar]
- 15.Selck D. A., Karymov M. A., Sun B., Ismagilov R. F., Increased robustness of single-molecule counting with microfluidics, digital isothermal amplification, and a mobile phone versus real-time kinetic measurements. Anal. Chem. 85, 11129–11136 (2013). [DOI] [PMC free article] [PubMed] [Google Scholar]
- 16.Day E., Dear P. H., McCaughan F., Digital PCR strategies in the development and analysis of molecular biomarkers for personalized medicine. Methods 59, 101–107 (2013). [DOI] [PubMed] [Google Scholar]
- 17.Hindson B. J., Ness K. D., Masquelier D. A., Belgrader P., Heredia N. J., Makarewicz A. J., Bright I. J., Lucero M. Y., Hiddessen A. L., Legler T. C., Kitano T. K., Hodel M. R., Petersen J. F., Wyatt P. W., Steenblock E. R., Shah P. H., Bousse L. J., Troup C. B., Mellen J. C., Wittmann D. K., Erndt N. G., Cauley T. H., Koehler R. T., So A. P., Dube S., Rose K. A., Montesclaros L., Wang S., Stumbo D. P., Hodges S. P., Romine S., Milanovich F. P., White H. E., Regan J. F., Karlin-Neumann G. A., Hindson C. M., Saxonov S., Colston B. W., High-throughput droplet digital PCR system for absolute quantitation of DNA copy number. Anal. Chem. 83, 8604–8610 (2011). [DOI] [PMC free article] [PubMed] [Google Scholar]
- 18.Shen F., Davydova E. K., Du W., Kreutz J. E., Piepenburg O., Ismagilov R. F., Digital isothermal quantification of nucleic acids via simultaneous chemical initiation of recombinase polymerase amplification reactions on SlipChip. Anal. Chem. 83, 3533–3540 (2011). [DOI] [PMC free article] [PubMed] [Google Scholar]
- 19.Gansen A., Herrick A. M., Dimov I. K., Lee L. P., Chiu D. T., Digital LAMP in a sample self-digitization (SD) chip. Lab Chip 12, 2247–2254 (2012). [DOI] [PMC free article] [PubMed] [Google Scholar]
- 20.Zhu Q., Gao Y., Yu B., Ren H., Qiu L., Han S., Jin W., Jin Q., Mu Y., Self-priming compartmentalization digital LAMP for point-of-care. Lab Chip 12, 4755–4763 (2012). [DOI] [PubMed] [Google Scholar]
- 21.Warren L., Bryder D., Weissman I. L., Quake S. R., Transcription factor profiling in individual hematopoietic progenitors by digital RT-PCR. Proc. Natl. Acad. Sci. U.S.A. 103, 17807–17812 (2006). [DOI] [PMC free article] [PubMed] [Google Scholar]
- 22.Kersting S., Rausch V., Bier F. F., von Nickisch-Rosenegk M., Rapid detection of Plasmodium falciparum with isothermal recombinase polymerase amplification and lateral flow analysis. Malar. J. 13, 99 (2014). [DOI] [PMC free article] [PubMed] [Google Scholar]
- 23.Al-Soud W. A., Rädstrom P., Purification and characterization of PCR-inhibitory components in blood cells. J. Clin. Microbiol. 39, 485–493 (2001). [DOI] [PMC free article] [PubMed] [Google Scholar]
- 24.Li C., Liu C., Xu Z., Li J., A power-free deposited microbead plug-based microfluidic chip for whole-blood immunoassay. Microfluid. Nanofluid. 12, 829–834 (2011). [Google Scholar]
- 25.Kersaudy-Kerhoas M., Sollier E., Micro-scale blood plasma separation: From acoustophoresis to egg-beaters. Lab Chip 13, 3323–3346 (2013). [DOI] [PubMed] [Google Scholar]
- 26.Fan R., Vermesh O., Srivastava A., Yen B. K. H., Qin L., Ahmad H., Kwong G. A., Liu C.-C., Gould J., Hood L., Heath J. R., Integrated barcode chips for rapid, multiplexed analysis of proteins in microliter quantities of blood. Nat. Biotechnol. 26, 1373–1378 (2008). [DOI] [PMC free article] [PubMed] [Google Scholar]
- 27.Yang S., Ündar A., Zahn J. D., A microfluidic device for continuous, real time blood plasma separation. Lab Chip 6, 871–880 (2006). [DOI] [PubMed] [Google Scholar]
- 28.Lenshof A., Ahmad-Tajudin A., Järås K., Swärd-Nilsson A.-M., Åberg L., Marko-Varga G., Malm J., Lilja H., Laurell T., Acoustic whole blood plasmapheresis chip for prostate specific antigen microarray diagnostics. Anal. Chem. 81, 6030–6037 (2009). [DOI] [PubMed] [Google Scholar]
- 29.Mach A. J., Di Carlo D., Continuous scalable blood filtration device using inertial microfluidics. Biotechnol. Bioeng. 107, 302–311 (2010). [DOI] [PubMed] [Google Scholar]
- 30.Tachi T., Kaji N., Tokeshi M., Baba Y., Simultaneous separation, metering, and dilution of plasma from human whole blood in a microfluidic system. Anal. Chem. 81, 3194–3198 (2009). [DOI] [PubMed] [Google Scholar]
- 31.Sun M., Khan Z. S., Vanapalli S. A., Blood plasma separation in a long two-phase plug flowing through disposable tubing. Lab Chip 12, 5225–5230 (2012). [DOI] [PubMed] [Google Scholar]
- 32.Zhang X.-B., Ahmad-Tajudin A., Järås K., Swärd-Nilsson A.-M., Åberg L., Marko-Varga G., Malm J., Lilja H., Laurell T., Gravitational sedimentation induced blood delamination for continuous plasma separation on a microfluidics chip. Anal. Chem. 84, 3780–3786 (2012). [DOI] [PubMed] [Google Scholar]
- 33.Dimov I. K., Basabe-Desmonts L., Garcia-Cordero J. L., Ross B. M., Riccoa A. J., Lee L. P., Stand-alone self-powered integrated microfluidic blood analysis system (SIMBAS). Lab Chip 11, 845–850 (2011). [DOI] [PubMed] [Google Scholar]
- 34.G. Jenkins, C. D. Mansfield, Eds. Microfluidic Diagnostics: Methods and Protocols (Humana Press, 2013). [Google Scholar]
- 35.Lutz S., Weber P., Focke M., Faltin B., Hoffmann J., Müller C., Mark D., Roth G., Munday P., Armes N., Piepenburg O., Zengerle R., von Stetten F., Microfluidic lab-on-a-foil for nucleic acid analysis based on isothermal recombinase polymerase amplification (RPA). Lab Chip 10, 887–893 (2010). [DOI] [PubMed] [Google Scholar]
- 36.Rohrman B. A., Richards-Kortum R. R., A paper and plastic device for performing recombinase polymerase amplification of HIV DNA. Lab Chip 12, 3082–3088 (2012). [DOI] [PMC free article] [PubMed] [Google Scholar]
- 37.Liang D. Y., Tentori A. M., Dimov I. K., Lee L. P., Systematic characterization of degas-driven flow for poly (dimethylsiloxane) microfluidic devices. Biomicrofluidics 5, 24108 (2011). [DOI] [PMC free article] [PubMed] [Google Scholar]
- 38.Hosokawa K., Sato K., Ichikawa N., Maeda M., Power-free poly(dimethylsiloxane) microfluidic devices for gold nanoparticle-based DNA analysis. Lab Chip 4, 181–185 (2004). [DOI] [PubMed] [Google Scholar]
- 39.Cira N. J., Ho J. Y., Dueck M. E., Weibel D. B., A self-loading microfluidic device for determining the minimum inhibitory concentration of antibiotics. Lab Chip 12, 1052–1059 (2012). [DOI] [PubMed] [Google Scholar]
- 40.J. Liu, D. Mitra, J. R. Waldeisen, R. H. Henrikson, Y. Park, S. Li, L. P. Lee, Microfluidic Solution Isolated Pumping (μSIP), 17th International Conference on Miniaturized Systems for Chemistry and Life Sciences, Freiburg, Germany, 27 to 31 October 2013. [Google Scholar]
- 41.Piepenburg O., Williams C. H., Stemple D. L., Armes N. A., DNA detection using recombination proteins. PLOS Biol. 4, e204 (2006). [DOI] [PMC free article] [PubMed] [Google Scholar]
- 42.Eddington D. T., Puccinelli J. P., Beebe D. J., Thermal aging and reduced hydrophobic recovery of polydimethylsiloxane. Sens. Actuators B 114, 170–172 (2006). [Google Scholar]
- 43.R. Fox, A. T. McDonald, P. Pritchard, Introduction to Fluid Mechanics (John Wiley & Sons Inc., 2003). [Google Scholar]
- 44.B. Kirby, Micro- and Nanoscale Fluid Mechanics: Transport in Microfluidic Devices (Cambridge Univ. Press, 2013). [Google Scholar]
- 45.Boyle D. S., Lehman D. A., Lillis L., Peterson D., Singhal M., Armes N., Parker M., Piepenburg O., Overbaugh J., Rapid detection of HIV-1 proviral DNA for early infant diagnosis using recombinase polymerase amplification. mBio 4, e00135-13 (2013). [DOI] [PMC free article] [PubMed] [Google Scholar]
- 46.Daher R. K., Stewart G., Boissinot M., Boudreau D. K., Bergeron M. G., Influence of sequence mismatches on the specificity of recombinase polymerase amplification technology. Mol. Cell. Probes 29, 116–121 (2014). [DOI] [PubMed] [Google Scholar]
- 47.Kreutz J. E., Munson T., Huynh T., Shen F., Du W., Ismagilov R. F., Theoretical design and analysis of multivolume digital assays with wide dynamic range validated experimentally with microfluidic digital PCR. Anal. Chem. 83, 8158–8168 (2011). [DOI] [PMC free article] [PubMed] [Google Scholar]
- 48.Ho Y.-C., Chang S.-C., Lin S.-R., Wang W.-K., High levels of mecA DNA detected by a quantitative real-time PCR assay are associated with mortality in patients with methicillin-resistant Staphylococcus aureus bacteremia. J. Clin. Microbiol. 47, 1443–1451 (2009). [DOI] [PMC free article] [PubMed] [Google Scholar]
- 49.Cho H., Lee B., Liu G. L., Agarwal A., Lee L. P., Label-free and highly sensitive biomolecular detection using SERS and electrokinetic preconcentration. Lab Chip 9, 3360–3363 (2009). [DOI] [PubMed] [Google Scholar]
- 50.Nevill J. T., Cooper R., Dueck M., Breslauer D. N., Lee L. P., Integrated microfluidic cell culture and lysis on a chip. Lab Chip 7, 1689–1695 (2007). [DOI] [PubMed] [Google Scholar]
- 51.Myers F. B., Henrikson R. H., Bone J., Lee L. P., A handheld point-of-care genomic diagnostic system. PLOS ONE 8, e70266 (2013). [DOI] [PMC free article] [PubMed] [Google Scholar]
- 52.Xia Y., Whitesides G. M., Soft lithography. Annu. Rev. Mater. Sci. 28, 153–184 (1998). [Google Scholar]
- 53.l. D. Landau, E. M. Lifshitz, Fluid Mechanics (Butterworth-Heinemann, 1987). [Google Scholar]
- 54.R. Bird, W. Stewart, E. Lightfoot, Transport Phenomena (John Wiley & Sons Inc., 2002). [Google Scholar]
- 55.J. Crank, The Mathematics of Diffusion (Clarendon Press, 1975). [Google Scholar]
- 56.Lillis L., Lehman D., Singhal M. C., Cantera J., Singleton J., Labarre P., Toyama A., Piepenburg O., Parker M., Wood R., Overbaugh J., Boyle D. S., Non-instrumented incubation of a recombinase polymerase amplification assay for the rapid and sensitive detection of proviral HIV-1 DNA. PLOS ONE 9, e108189 (2014). [DOI] [PMC free article] [PubMed] [Google Scholar]
Associated Data
This section collects any data citations, data availability statements, or supplementary materials included in this article.
Supplementary Materials
Supplementary material for this article is available at http://advances.sciencemag.org/cgi/content/full/3/3/e1501645/DC1
fig. S1. Exploded view of the simple construction.
fig. S2. Vacuum charging and long-term storage.
fig. S3. Detailed steps of micropatterning.
fig. S4. Digital plasma separation mechanism overview.
fig. S5. Failure of blood separation without the microcliff.
fig. S6. Optical signal obstructed when blood cells are not removed.
fig. S7. Microcliff gap effect on spatial robustness.
fig. S8. Reliable compartmentalization with smaller microcliff gap designs.
fig. S9. Selective particle separation according to size.
fig. S10. Total plasma volume separated versus time.
fig. S11. Microwell filling speed versus vacuum strength.
fig. S12. Vacuum battery system versus conventional degas pumping.
fig. S13. Vacuum lungs enable flow tuning.
fig. S14. Compartmentalization of all 224 microwells can be done in 12 min.
fig. S15. Consistent loading with the vacuum battery system.
fig. S16. RPA is more robust against plasma samples than LAMP and PCR.
fig. S17. Isothermal heating using reusable instant heat packs.
fig. S18. On-chip digital quantitative detection of MRSA DNA spiked in water.
note S1. Simulation of particle trajectories.
note S2. Diffusion through vacuum battery.
table S1. Primer, probe, and target sequences.
movie S1. User protocol.
movie S2. Cross section.
movie S3. Digital plasma separation.
movie S4. Vacuum battery system.