

Abstract
For many years, defects in the ribosome have been associated to cancer. Recently, somatic mutations and deletions affecting ribosomal protein genes were identified in a few leukemias and solid tumor types. However, systematic analysis of all 81 known ribosomal protein genes across cancer types is lacking. We screened mutation and copy number data of respectively 4926 and 7322 samples from 16 cancer types and identified six altered genes (RPL5, RPL11, RPL23A, RPS5, RPS20 and RPSA). RPL5 was located at a significant peak of heterozygous deletion or mutated in 11% of glioblastoma, 28% of melanoma and 34% of breast cancer samples. Moreover, patients with low RPL5 expression displayed worse overall survival in glioblastoma and in one breast cancer cohort. RPL5 knockdown in breast cancer cell lines enhanced G2/M cell cycle progression and accelerated tumor progression in a xenograft mouse model. Interestingly, our data suggest that the tumor suppressor role of RPL5 is not only mediated by its known function as TP53 or c-MYC regulator. In conclusion, RPL5 heterozygous inactivation occurs at high incidence (11-34%) in multiple tumor types, currently representing the most common somatic ribosomal protein defect in cancer, and we demonstrate a tumor suppressor role for RPL5 in breast cancer.
Keywords: ribosomal protein, haploinsufficient tumor suppressor, TCGA, breast cancer
INTRODUCTION
Cancers contain a variety of genomic lesions including mutations, translocations, copy number alterations and epigenetic changes that can result in altered protein functions. Several functional protein categories show somatic alterations in cancer, such as transcription factors, signaling molecules and epigenetic regulators. However, only recently somatic defects in ribosomal proteins have been described in tumors. The human ribosome corresponds to the cellular machinery translating mRNA into proteins and is composed of a small 40S subunit consisting of the 18S rRNA chain and 33 RPS proteins and a large 60S subunit encompassing the 28S, 5S and 5.8S rRNA chains and 47 RPL proteins. Somatic mutations and deletions affecting ribosomal protein genes occur in up to 20% of acute T-cell leukemia (T-ALL) cases, with the most frequent defects affecting RPL10 (also known as uL16; 7.9% of pediatric T-ALL cases) and RPL22 (eL22; 10%) and with rare defects in RPL5 (uL18) and RPL11 (uL5) [1–3]. Moreover, somatic mutations affecting RPS15 (uS19) were reported in 10-20% of aggressive chronic lymphocytic leukemia (CLL) [4, 5]. The Cancer Genome Atlas (TCGA) pan-cancer analyses identified RPL5 and RPL22 as significantly mutated in glioblastoma multiforme (GBM, 2.8%) and uterine corpus endometrial carcinoma (UCEC, 10.9%) respectively [6–9], and inactivating RPL22 mutations have also been described in colorectal and gastric cancer [10, 11]. RPS27 contains a mutational hotspot in its 5’UTR in melanoma (SKCM) [12], and we showed that RPL5 is part of a minimal deleted region that is heterozygously deleted in 20-40% of advanced multiple myeloma cases [13].
Mutations reported for RPL10 in T-ALL are all missense mutations, with a strong mutational hotspot at residue arginine 98 (R98S) [1], indicating an oncogenic role for these mutations. In contrast, all other somatic defects that have been identified so far in ribosomal protein genes are heterozygous and many of them are clearly inactivating mutations or deletions, suggesting roles as haploinsufficient tumor suppressors for these proteins in cancer [1–8].
Congenital heterozygous inactivating mutations and deletions affecting RPL5, RPL11 and RPS15 have also been described in Diamond Blackfan Anemia (DBA), a congenital syndrome belonging to a family of human disorders, ribosomopathies, caused by impaired ribosome biogenesis and function [14, 15]. Similarly, RPS14 (uS11) haploinsufficiency has been reported in the 5q- myelodysplastic syndrome (MDS) [16]. Like other ribosomopathies, DBA and 5q- MDS patients are characterized by hypoproliferative phenotypes such as bone marrow failure and anemia early in life, followed by elevated cancer risks later on [14, 15, 17].
Besides the identification of somatic ribosome defects in cancer and the elevated cancer risks of ribosomopathy patients, the link between ribosome defects and cancer is supported by the observation that heterozygous inactivation of certain ribosomal protein genes induces tumor development in zebrafish [18]. Moreover, Rpl11 and Rpl22 haploinsufficiency accelerates mouse lymphoma development and loss of one copy of Rpl5 or Rps24 (eS24) has been linked to development of rare soft tissue sarcomas in mice [2, 19, 20]. Some of the ribosomal proteins affected in cancer have also been linked to known prominent oncogenes and tumor suppressors. In this context, several ribosomal proteins have been reported to bind and sequester MDM2 and activate the p53 pathway upon ribosomal stress, although only RPL5, RPL11 and RPL23 are essential for this process [21–27]. Additionally, certain ribosomal proteins regulate c-MYC, which itself is responsible for ribosome biogenesis by stimulating transcription of ribosomal RNA and proteins [28–30]. In this context, RPL5, RPL11 and RPS14 suppress c-MYC expression by guiding the c-MYC mRNA to the RISC complex for degradation [31–33]. Moreover, RPL11 interacts with c-MYC at promoter regions of c-MYC target genes, inhibiting its transcriptional activity [34, 35]. RPL22 inactivation was reported to indirectly activate c-MYC expression, via an NF-kB - Lin28B - Let7 miRNA axis [2].
So far, a small set of ribosomal protein genes has been found mutated in cancer. However, systematic analysis of all 81 ribosomal protein genes across cancer types is lacking, and certain defects may have been overlooked. In this study, the mutation and copy number data within the TCGA database were explored to provide the first systematic screening of potential cancer driving ribosomal protein genes, which may reveal interesting novel targets to investigate in follow-up studies. We analyzed mutations from 4 926 tumors and copy number changes from 7 322 tumors across 16 different tumor types for the 81 genes encoding ribosomal proteins. Six ribosomal protein genes were identified as potential cancer drivers in five different cancer types. Among them, RPL5 was the strongest candidate affected in 11-34% of glioblastoma, melanoma and breast cancer patients. Whereas somatic mutations in RPL5 had been described in 3% of GBM samples, we found that RPL5 heterozygous inactivation currently represents the most common somatic ribosome defect in human cancer. Importantly, 50% reduction of RPL5 levels in breast cancer cell lines increased cell proliferation and tumor progression in mouse xenograft models, further supporting a haploinsufficient tumor suppressor role for RPL5 in human cancer.
RESULTS
TCGA screening identifies 6 ribosomal protein genes with a candidate driver role in cancer
The TCGA database was explored to identify ribosomal protein genes that are significantly altered in cancer. The first type of alteration that was analyzed were non-silent somatic mutations. Overall, the frequency of such defects in individual ribosomal protein genes was below 3% in all cancer types (Supplementary Table 2). However, mutational frequency represents only one criterium to discriminate functional cancer drivers. Clustering of mutations in a particular protein region also indicates positive selection, as well as accumulation of mutations with high impact on protein function. While some cancer genes are mutated at high frequency (e.g. TP53 or KRAS), most cancer genes are mutated at much lower frequencies (2-20%) [8]. Therefore, we retained all genes with significant mutational frequency (as determined by MutSig 2.0) and/or positional clustering of mutations (OncodriveCLUST) and/or accumulation of high functional impact mutations (OncodriveFM). According to these criteria, five genes (RPL5, RPL11, RPS5 (uS7), RPS20 (uS10), RPSA (uS2)) were significantly mutated in four different cancer types (Figure 1A-1B).
Figure 1. Identification of 5 ribosomal protein genes that are significantly mutated in cancer.
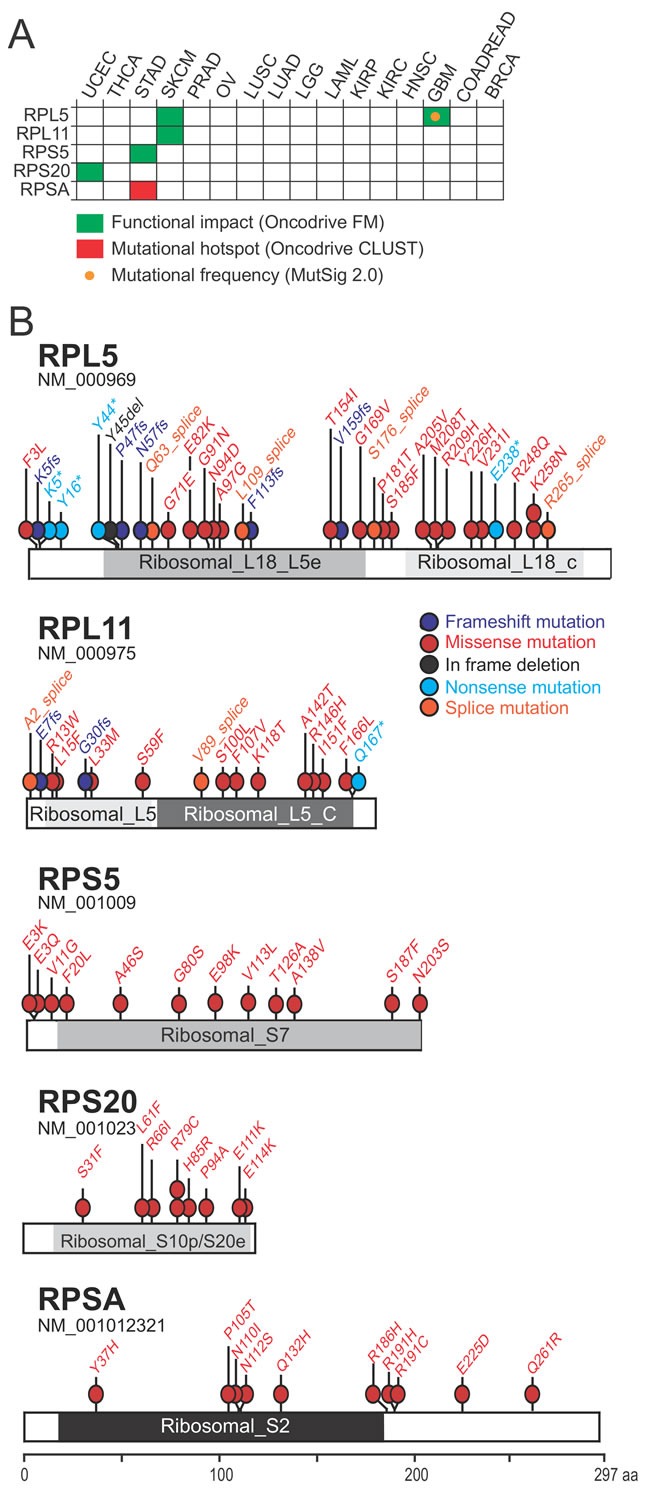
(A) Significantly mutated genes identified due to mutational frequency (MutSig 2.0), mutational clustering (OncodriveCLUST) or accumulation of high functional impact mutations (OncodriveFM). (B) Mapping of mutations affecting the 5 candidate cancer drivers on linear protein diagrams. Non-silent somatic mutations from all 16 cancer types are shown. Protein domains are indicated for each protein. Ribosomal_L18_L5e (pfam00861), Ribosomal_L18_c (pfam14204): RPL5 protein domains. Ribosomal_L5 (pfam00281), Ribosomal_L5_C (pfam00673): RPL11 protein domains. Ribosomal_S7 (pfam00177): RPS5 protein domain. Ribosomal_S10p/S20e (pfam00338): RPS20 protein domain. Ribosomal_S2 (pfam00318): RPSA protein domain.
RPSA was identified in Stomach Adenocarcinoma (STAD) because of a significant cluster of mutations (q-value: 0.004; OncodriveCLUST ) (Figure 1A-1B; Supplementary Figure 1). RPS5 and RPS20 show an accumulation of high functional impact mutations, in STAD and UCEC respectively (q-values: 0.026 and 0.042; Oncodrive FM). Interestingly, a few of these mutations are predicted to affect the interaction between the ribosomal protein and RNA (Supplementary Table 3). Accumulation of high functional impact mutations was also found for RPL5 in GBM (q-value: 0.0002) and SKCM (q-value: 0.004) and for RPL11 in SKCM (q-value: 0.0007). Some of these mutations were clearly inactivating frameshift, nonsense or splice site mutations (Figure 1B), indicative of a tumor suppressor function. Finally, RPL5 was the only gene with a significantly high mutational frequency according to MutSig 2.0 and the only gene significantly mutated in 2 different cancer types.
We also screened the TCGA database for ribosomal protein genes affected by significant copy number changes (Supplementary Figure 2). Because these defects often encompass many genes, we increased the specificity of our screening for driver events by applying additional filtering criteria: i) that the ribosomal protein gene was included in the region of the deletion (or amplification) that is predicted to contain the cancer driving target gene; ii) that the same region does not include other known cancer genes; iii) that the ribosomal protein gene was also affected by mutations, in addition to the significant copy number change. Only 2 genes, RPL23A (uL23) and RPL5, were retained after this filtering (Figure 2A).
Figure 2. RPL5 and RPL23A show significant copy number changes in the TCGA database.
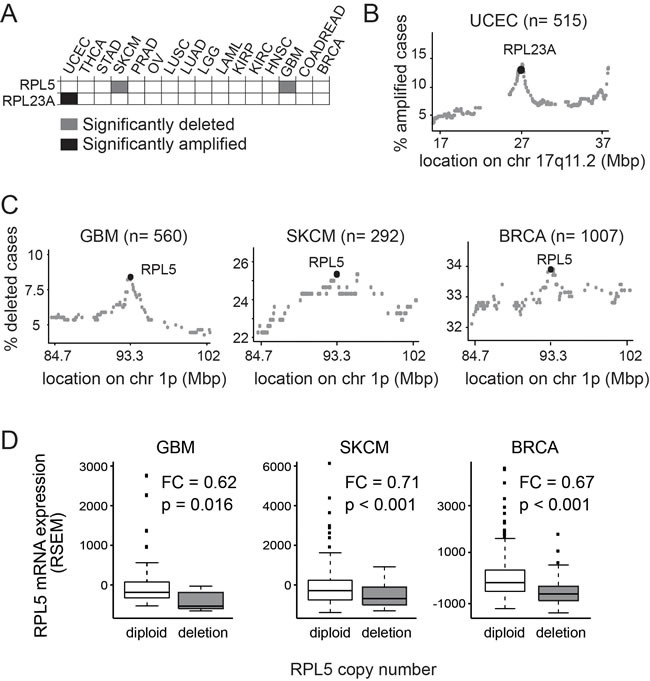
(A) Heatmap showing the significant copy number changes retained (B) RPL23A amplification peak in UCEC. Each dot on the figure represents a different gene on chr 17q11.2, the genomic locus where the RPL23A gene is located. X-axis: genomic coordinates on chromosome 17; Y-axis: percent of cases with amplification of each particular gene. (C) RPL5 deletion peak in GBM, SKCM and BRCA. Each dot on the figure represents a different gene on chr 1p, the genomic locus where the RPL5 gene is located. X-axis: genomic coordinates on chromosome 1; Y-axis: percent of cases with deletion of each particular gene. (D) Boxplots showing RPL5 mRNA expression levels (RSEM) in GBM, SKCM and BRCA cases with diploid or heterozygously deleted copy number status for RPL5. P: p-value according to the Wilcoxon's test. FC: fold change (RPL5 heterozygously deleted over RPL5 diploid).
RPL23A was significantly amplified in UCEC (Figure 2A). Interestingly, RPL23A was located in a distinct peak of amplification encompassing only 24 genes and was amplified in 12.62% (n = 65) of UCEC samples (Figure 2B). Patient samples harboring RPL23A amplification displayed 1.5 fold higher average RPL23A mRNA expression levels compared to RPL23A diploid tumor samples (Wilcoxon test, W = 3316, p = 0.003) (Supplementary Figure 3A). No evidence was found for effects on patients’ survival but RPL23A amplified cases were more frequent among the serous endometroid tumors, a more rare and aggressive UCEC subtype (q-value: 2.08E-018) (Supplementary Figure 3B).
RPL5 was heterozygously deleted in 8.4% of GBM and 25.3% of SKCM patients and in both cancers the RPL5 gene locus was positioned in a distinct focal peak of deletion (Figure 2C). Furthermore, in breast invasive carcinoma (BRCA), RPL5 was significantly heterozygously deleted in 33.9% of cases. These defects were initially not retained in our filtering, because known cancer genes (NRAS, BCL10, TRIM33, RBM15) are also included in the same deletion and the minimal mutational frequency requirement was not satisfied. However, a closer analysis showed that the known cancer genes are more than 7 Mbp away from RPL5 and also in this tumor type RPL5 was located in a pronounced deletion peak (Figure 2C). RPL5 deletions were associated with 29-38% lower average RPL5 mRNA expression levels in GBM (p = 0.016), SKCM (p = 2.36e-04) and BRCA (p = 2.2e-16) (Figure 2D).
In conclusion, we defined 6 ribosomal protein genes as candidate cancer driving genes (Table 1). RPL5, the most commonly altered ribosomal protein we detected, was significantly mutated and deleted in GBM (11%) and SKCM (28%) and significantly deleted in BRCA (34%).
Table 1. Aberrations in six candidate driver genes.
| Gene | Cancer | Aberration | # Analyzed Tumors | % Tumors with Aberration |
|---|---|---|---|---|
| RPL5 | SKCM | mutations | 279 | 2.5 |
| deletions | 293 | 25.3 | ||
| GBM | mutations | 283 | 2.5 | |
| deletions | 560 | 8.4 | ||
| BRCA | mutations | 976 | 0.2 | |
| deletions | 1016 | 33.9 | ||
| RPL11 | SKCM | mutations | 279 | 1.4 |
| RPL23A | UCEC | mutations | 248 | 2.0 |
| amplifications | 515 | 12.6 | ||
| RPS5 | STAD | mutations | 221 | 1.4 |
| RPS20 | UCEC | mutations | 248 | 1.2 |
| RPSA | STAD | mutations | 221 | 2.7 |
RPL5 is a clinically relevant candidate tumor suppressor in GBM
For each of the 6 identified candidate cancer drivers, we evaluated the impact of expression levels on overall survival. Only for RPL5, a significant association was found. In GBM, low RPL5 expression was associated with a reduced five-year overall survival (p = 0.01) (Figure 3A). The median survival for patients with low RPL5 expression (n = 414) was 13.8 months, whereas this was 14.7 months for high RPL5 expressing patients (n = 442). For BRCA or SKCM no significant difference in survival was found in the TCGA datasets (Figure 3B-3C). However, an additional non-TCGA BRCA dataset from the Pawitan et al. study (GEO accession: GSE1456) available in the R2 platform was analyzed. In that dataset, a significant correlation of RPL5 low expression with worse five year survival was found (p = 0.01) (Figure 3D). Unfortunately, R2 did not contain additional datasets suitable for our survival analyses for GBM or SKCM.
Figure 3. RPL5 is a clinically relevant candidate tumor suppressor in GBM.
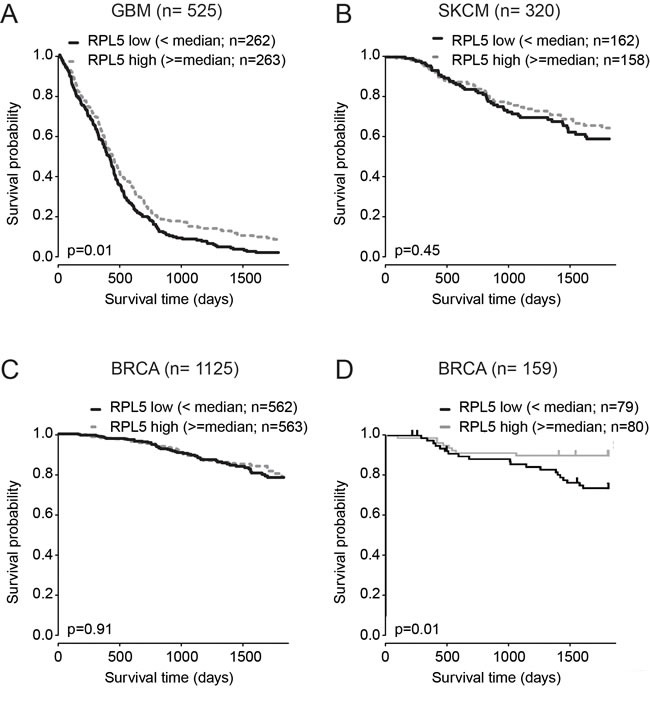
Kaplan–Meier analysis of the effect of RPL5 expression on overall survival. Cases were divided in RPL5 low or high expressers according to whether expression was below or above median and survival was compared using the log-rank test. (A) GBM TCGA dataset; (B) SKCM TCGA dataset; (C) BRCA TCGA dataset; (D) Non-TCGA BRCA dataset available on the R2 platform (GEO accession: GSE1456).
RPL5 defects co-occur with TP53 pathway inactivation and c-MYC amplification in SKCM and BRCA
Because RPL5 has been functionally linked to TP53 and c-MYC, we tested for an association between RPL5 defects and defects in c-MYC, TP53, or the negative TP53 regulators MDM4 and MDM2 (Figure 4 and Supplementary Figure 4). In BRCA, significant co-occurrence of RPL5 defects and TP53 pathway inactivation by TP53 inactivation or by mutation/amplification of MDM2 or MDM4 was detected. In this cancer type, also c-MYC amplification co-occurred with RPL5 inactivation. Also in SKCM, a significant co-occurrence of RPL5 defects with MDM4, MDM2 and c-MYC amplification was detected. No significant associations were obtained in GBM, which might be due to lower sample numbers from which data were available.
Figure 4. Genetic interaction between RPL5 alterations and TP53 or c-MYC alterations.
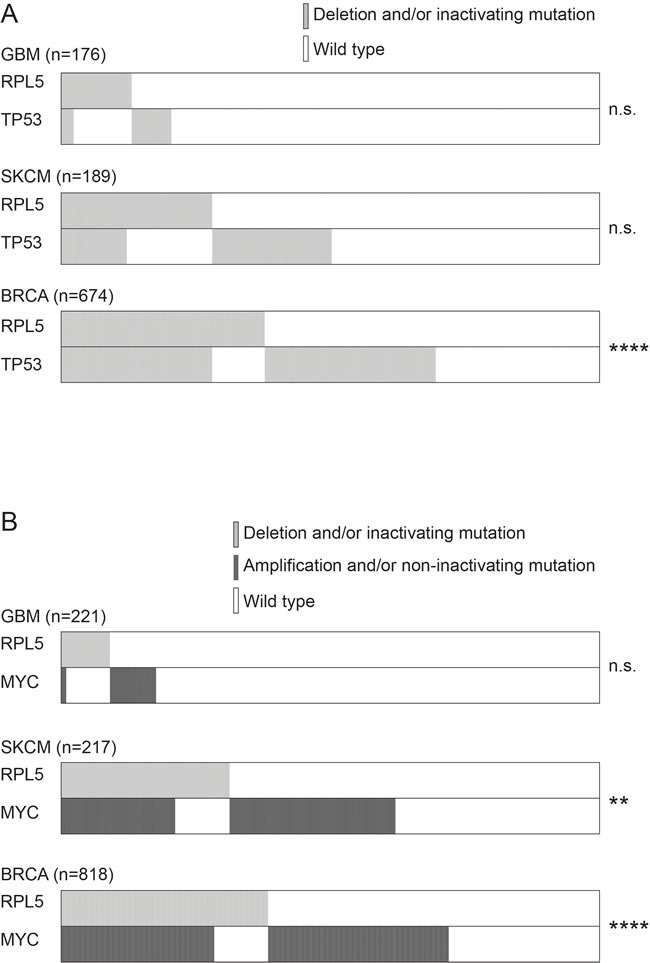
(A) Co-occurrence of RPL5 and TP53 alterations in GBM, SKCM and BRCA. (B) Co-occurrence of RPL5 and c-MYC alterations in GBM, SKCM and BRCA.
Furthermore, we assessed the mRNA levels of the TP53 target genes CDKN1A, BAX and MDM2, as well as the mRNA levels of c-MYC. No significant changes were found between RPL5 diploid and RPL5 heterozygously deleted tumors (Supplementary Figure 5).
RPL5 knockdown enhances breast cancer cell proliferation and accelerates tumor formation in mice
RPL5 emerged as the strongest candidate cancer driver gene from our analysis. It represents a candidate tumor suppressor, based on its heterozygous inactivating mutations and focal deletions and based on the correlation of lower RPL5 expression with worse survival. Therefore, we aimed to experimentally test the effect of ~50% RPL5 loss-of-function on cell behavior in vitro and on tumor forming capacity in an in vivo mouse model. We chose for breast cancer models, because of the high incidence of RPL5 inactivation in BRCA. Triple negative breast cancer cell lines MCF7 (TP53 WT, RPL5 WT) and MDA-MB-231 (TP53 homozygous R280K missense mutation, RPL5 WT) were transduced with lentiviral vectors allowing inducible RPL5 protein knockdown of 30-50% (Figure 5A, Supplementary Figure 6, MCF7 p < 0.001 and MDA-MB-231 p = 0.001). Interestingly, this RPL5 knockdown induced proliferation of MCF7 cells, but not of MDA-MB-231 cells (Figure 5B, MCF7 p < 0.001 and MDA-MB-231 p = 0.597). Next, we injected the breast cancer cell lines subcutaneously into the left (ctrl vector) and right (shRPL5 vector) flanks of NSG mice to identify the role of RPL5 in breast cancer progression. MDA-MB-231 tumors grew faster (one month) as compared to MCF7 tumors (two months). In both subcutaneous breast cancer models, RPL5 knockdown significantly increased the tumor weight when sacrificing the animals (Figure 6A, MCF7 p = 0.009 and MDA-MB-231 p = 0.044). It was noticed that in 2/8 (25%) of the mice with MDA-MB-231 induced tumors, the right hind leg was fixated and the animal was not using it anymore. After dissection, it was clear that in these mice, the shRPL5 tumors had encapsulated the bone (Supplementary Figure 7). This was not observed in the more slowly growing MCF7 tumors. All tumors were analyzed by immunoblot and showed clear knockdown of RPL5 (Figure 6B, MCF7 p < 0.001 and MDA-MB-231 p = 0.001). In addition, the shRPL5 induced mouse tumors showed reduced phosphorylation of CDK1/CDC2 at tyrosine 15, a dephosphoryation that is required for cell cycle progression from G2 to mitosis (Figure 6C, MCF7 p < 0.001 and MDA-MB-231 p = 0.001). These results are consistent with the enhanced proliferation associated with RPL5 knockdown in the cell culture experiments and the increased tumor weights in vivo.
Figure 5. RPL5 knockdown enhances proliferation of MCF7 breast cancer cells.
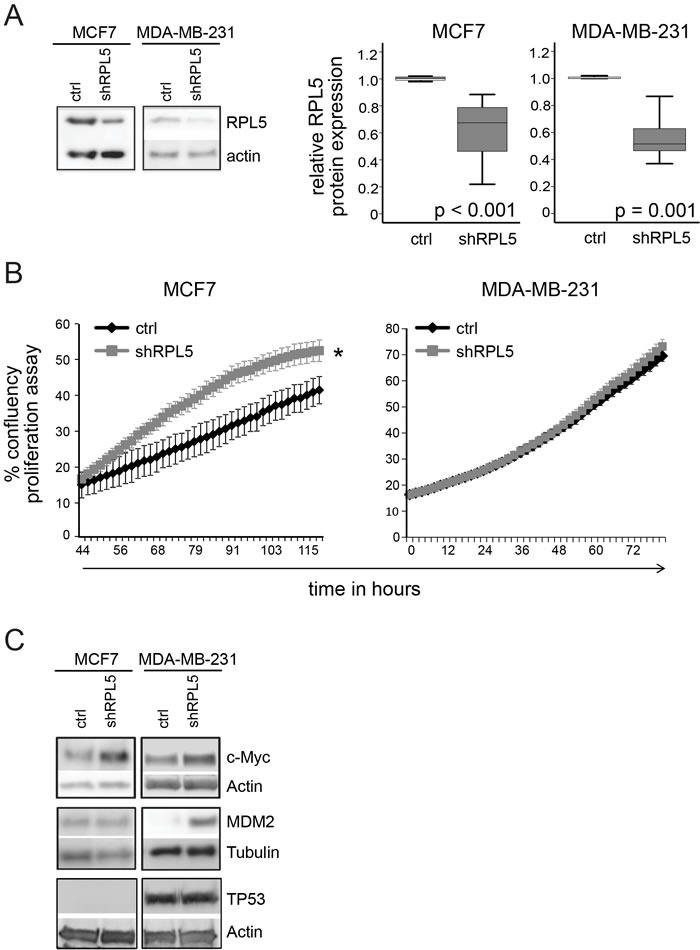
(A) Immunoblot analysis of RPL5 expression levels on cell lysates of doxycycline treated MCF7 and MDA-MB-231 cell lines containing an empty lentiviral vector (control) or a vector containing an shRNA targeting RPL5 (shRPL5). Quantification of the blots is shown on the right. (B) In vitro proliferation of MCF7 and MDA-MB-231 cell lines as determined by real-time monitoring of cell confluency. (C) Immunoblot analysis of c-MYC, TP53 and MDM2 expression levels on cell lysates of doxycycline treated MCF7 and MDA-MB-231 cell lines containing an empty lentiviral vector (control) or a vector containing an shRNA targeting RPL5 (shRPL5). All immunoblots were performed 72 hrs after start of the doxycycline treatment.
Figure 6. Knockdown of RPL5 accelerates breast cancer formation in mice.
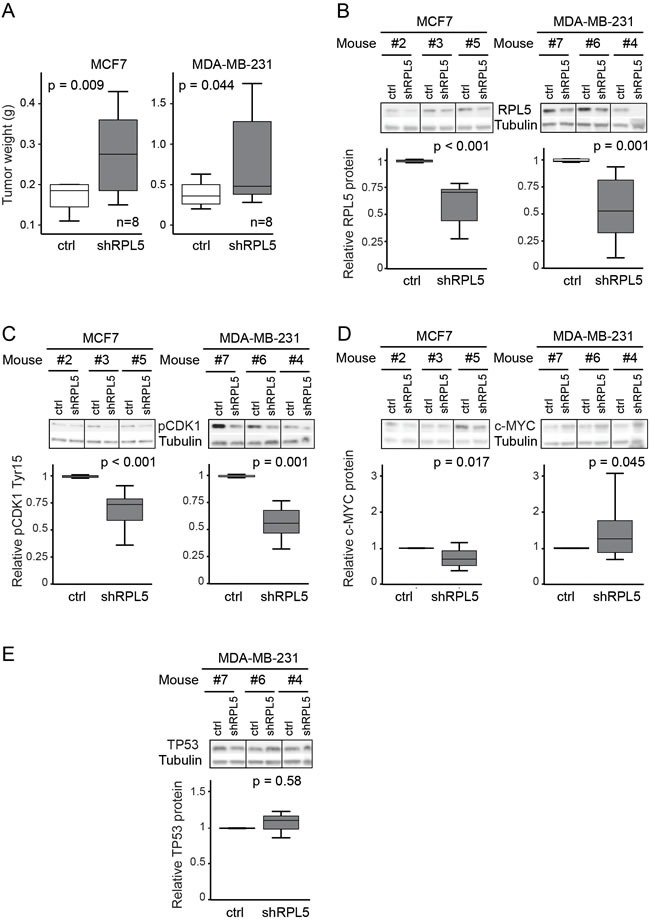
(A) Tumor weights of doxycycline treated mice that are injected with MCF7 and MDA-MB-231 cell lines containing the empty lentiviral vector (control) in the left flanks and the vector containing an shRNA targeting RPL5 (shRPL5) in the rights flanks. (B-E) Immunoblot analysis and the corresponding quantification of MCF7 (left) and MDA-MB-231 (right) tumors, comparing expression of the control and shRPL5 condition for RPL5 (B), phospho-CDK1 (tyr15) (C), c-MYC (D), and TP53 protein (E).
Changes in TP53, MDM2 and c-MYC protein levels upon RPL5 knockdown were assessed by immunoblotting, in vitro and in vivo (Figure 5C, Figure 6D-6E and Supplementary Figure 8). TP53 protein could not be detected for the MCF7 cell line or tumors and no differences were observed for MDA-MB-231. MDM2 expression did not differ in vivo and it was upregulated in vitro only for MDA-MB-231. Expression of c-MYC was significantly upregulated in both cell lines in vitro and in MDA-MB-231 tumors (p = 0.045) but downregulated in MCF7 tumors (p = 0.017).
DISCUSSION
Using the TCGA database, we performed the first screening exploring the incidence and pattern of somatic defects affecting the 81 ribosomal protein genes in cancer. We aimed to identify novel ribosomal protein genes which are significantly targeted by genetic alterations and represent potential causative cancer genes. Our screening for mutations and copy number changes identified six ribosomal protein genes as candidate cancer driver genes, including RPL5 and RPL11, which were previously reported in cancer. Our analyses did not pick up RPL22, RPS27 (eS27), RPS15 and RPL10, although already described in cancer as well. RPL22 was found to be significantly mutated in UCEC, according to a TCGA pan-cancer analysis [6, 7]. However, most RPL22 mutations detected in TCGA UCEC are potentially caused by misalignment of reads to homologous regions in the genome. Therefore, these mutations were absent in the more recent Firehose release of TCGA data used in our study. RPS27 has been reported to contain a mutational hotspot in its 5’UTR in SKCM [12]. This was not detected here because our analyses were restricted to the protein coding regions and splice sites of ribosomal protein genes. RPS15 and RPL10 mutations have been reported in CLL and T-ALL [1, 4, 5], which are not represented in the TCGA dataset analyzed here. However, our data suggest that these ribosomal protein genes are not affected in cancer in general and that these mutations may be specific to the disease entities where they have been described. This specificity may relate to the emerging idea of “specialized ribosomes”, according to which ribosomes present a heterogeneous composition and/or binding capacity to translation factors in different cell types [36, 37]. This may alter their functionality and contribute to tissue specific gene regulation. Alternatively, cell type specific extra-ribosomal roles for these ribosomal proteins may exist.
The reasons mentioned above explain the absence of previously reported cancer associated ribosomal protein defects in our results. In addition, we only considered mutations and copy number changes in ribosomal protein genes. Other mechanisms such as methylation, regulation by microRNAs or long non-coding RNAs might further cause ribosomal protein dysregulation in cancer. Because of all these reasons, we do not claim to have fully delineated the spectrum of ribosomal protein defects in cancer here, but we identified 6 attractive genes for further investigation.
Among the candidate genes detected in this screening, RPSA harbors a mutational hotspot likely to influence its extra-ribosomal function as laminin binding protein. Besides being a constituent of the ribosome, RPSA also functions on the extracellular membrane as a laminin receptor and transduces extracellular signals regulating cancer-related pathways such as apoptosis and cell migration [38, 39]. The mutational hotspot we detected was located in a flexible loop whose conformation regulates the accessibility of a laminin binding domain. Additionally, two mutations were close to the cleavage sites which regulate laminin-binding (Supplementary Figure 1). Both the laminin-binding protein RPSA and the metalloproteinase ST3 responsible for its cleavage are known to be overexpressed in different cancers [40–42]. Our data may indicate a role for RPSA in oncogenesis through its extra-ribosomal function as laminin receptor.
RPL23A amplification in UCEC patients may represent a prognostic factor for a more aggressive and rare UCEC histological type. RPS5 and RPS20 show accumulation of high functional impact mutations, some of which may disrupt RNA interactions. Most interestingly, both RPL11 and RPL5 present inactivating mutations and emerge as candidate cancer drivers in the same cancer type (SKCM). These two ribosomal proteins are part of the same complex regulating TP53 via MDM2 and are both mutated and deleted in patients affected by DBA, a cancer predisposing ribosomopathy [14, 21, 23, 27, 43–45]. No other ribosomal protein genes associated to DBA or other ribosomopathies are detected among the six candidate cancer driver genes identified in this study.
RPL5 was the strongest candidate cancer gene emerging from our screening. The observation of heterozygous inactivating RPL5 mutations and deletions across multiple tumor types suggested a role as haploinsufficient tumor suppressor gene. It is interesting to note that the Rabadan group integrated TCGA data with known causative genes in cancer predisposing Mendelian diseases, such as DBA, and that they also pick up RPL5 as candidate tumor suppressor in GBM in their analyses [46]. RPL5 has previously been identified as significantly mutated in GBM (2.8%) [6–8]. However, the incidence of RPL5 alterations was severely underestimated in these studies, since no copy number changes were considered. In the current study, we show that the incidence of RPL5 alterations in GBM is much higher than previously assumed and that heterozygous RPL5 inactivation occurs at high incidence in GBM, SKCM and BRCA. As such, RPL5 inactivation currently represents the most common somatic ribosome defect in cancer. It is worth pointing out that RPL5 defects in other tumor types did not pass the threshold for retention in our pipeline. In this context, LUAD, KIRC, STAD and PRAD also show inactivating mutations or deletions in RPL5 (Supplementary Figure 9), suggesting that RPL5 may also act as a tumor suppressor in these tumor types. In addition, RPL5 shows inactivating mutations in 2% of T-ALL samples and we showed that RPL5 is part of a minimal deleted region that is heterozygously deleted in 20-40% of advanced multiple myeloma cases (Supplementary Figure 10) [1, 13].
We experimentally validated the role of RPL5 as haploinsufficient tumor suppressor in breast cancer cell and mouse models. Knockdown of RPL5 by ~50% in both TP53 WT MCF7 and TP53 mutant MDA-MB-231 breast cancer lines accelerated the tumor growth in vivo. In agreement with this, RPL5 knockdown tumors showed reduced phosphorylation of CDK1/CDC2 at tyrosine 15, which requires dephosphorylation to enable cell cycle progression through the G2/M checkpoint. The MDA-MB-231 cell line did not show significant proliferation changes in vitro upon RPL5 knockdown, although a significant increase in tumor growth was observed in vivo. It is well known that the in vivo setting is an important factor in tumor progression. Growth factor release by a supportive tumor microenvironment or other mechanisms such as tumor hypoxia, which cannot be mimicked in vitro, may explain why the RPL5 knockdown in MDA-MB-231 cells showed only a significant effect in the in vivo context.
We describe the first models for heterozygous RPL5 inactivation in cancer cell context. RPL5 haploinsufficiency systems have however previously been generated to study the effect of RPL5 defects in the context of DBA. Loss of RPL5 in human primary lung fibroblasts does not induce cell cycle arrest by checkpoint activation but suppresses cell cycle progression by reducing translation rates, including translation of some cyclins [22]. Haploinsufficiency of RPL5 in mouse embryonic stem cell cultures causes growth defects with a delay in the G2/M cell cycle checkpoint [47]. It is speculated that differences in cell cycle checkpoint activation may be due to the distinct differentiation status of the cells used in these studies. However, both studies showed impeded proliferation upon RPL5 loss, whereas we observed increased proliferation and tumor growth in our RPL5 haploinsuffiency cancer model. The cancer context we adopted in our study likely explains this discrepancy by the required support of additional mutations. Interestingly, these opposite proliferation effects of RPL5 haploinsufficiency recall the paradox of phenotypes associated to ribosomopathies. Patients affected by these diseases initially present a hypoproliferative phenotype (such as anemia) frequently followed, in later stages of the disease, by the development of cancer, a hyperproliferative disease [17]. The mechanisms underlying the initial hypoproliferation or the subsequent cancer development still have to be elucidated.
Our analysis of TCGA expression data did not reveal activation of TP53 target genes in BRCA, GBM or SKCM tumors with RPL5 haploinsufficency, consistent with previous data in a non-cancer context [22, 47]. Moreover, we observed increased in vivo tumor volumes upon RPL5 knockdown, both in the TP53 wild type MCF7 and in the TP53 mutant MDA-MB-231 line and no consistent changes were observed in TP53 and MDM2 protein expression upon knock-down of RPL5 in these breast cancer cell lines. These results suggest that the RPL5 knockdown phenotype is likely TP53-independent. Alternatively, since RPL5 and RPL11 are known to cooperate in suppressing expression of c-MYC, RPL5 loss may induce upregulation of this potent oncogene [31, 32]. No differences in c-MYC mRNA levels was found for BRCA, GBM or SKCM tumors with RPL5 haploinsufficency from TCGA. c-MYC protein was upregulated in both breast cancer cell lines with RPL5 knockdown in vitro and in MDA-MB-231 tumors in vivo but downregulated in MCF7 tumors. c-MYC overexpression in MDA-MB-231 cells has previously been shown to increase tumor volumes in vivo [48] and may have contributed to faster tumor growth as compared to MCF7 tumors. However, c-MYC upregulation does not fully explain the proliferation and tumor growth advantage conferred by RPL5 knockdown since it also occurs in MCF7 tumors despite c-MYC downregulation. In summary, our data indicate that previously described extra-ribosomal functions of RPL5 regulating cancer genes TP53 and c-MYC cannot explain the observed phenotype, although c-MYC regulation may partially contribute to it. Interestingly, our analysis of TCGA patient data from BRCA showed significant co-occurrence between RPL5 and TP53 or its negative regulator MDM4 alterations. Similarly, a significant co-occurrence between RPL5 and c-MYC alterations was identified. These results may suggest that alterations targeting the TP53 pathway or c-MYC may co-operate with RPL5 in tumorigenesis, and/or that RPL5 inactivation may facilitate acquisition of these lesions.
In summary, we provide the first comprehensive analysis of defects in coding regions of ribosomal proteins across several cancer types using the TCGA platform. We identify RPSA, RPS5, RPS20, RPL5, RPL11 and RPL23A as six interesting cancer driver candidates and show a tumor suppressor role for RPL5 in the context of breast cancer. Additional research is required to experimentally evaluate the contribution of the other identified ribosomal protein defects in cancer pathogenesis. Similarly, more studies are needed to unravel the molecular mechanisms by which RPL5 exerts its tumor suppressor role in cancer.
MATERIALS AND METHODS
Data description
Data from TCGA (http://cancergenome.nih.gov/) and pre-processed by the Broad GDAC Firehose pipeline were used in this study (Firehose release of 15/01/2014). Only cancer types for which mutation and copy number data from at least 100 patients were available were included (Supplementary Table 1).
Mutation analysis
Somatic mutation frequencies were obtained from the MAF files available on Firehose. Only somatic, non-silent mutations were considered. A gene was considered as significantly mutated in a cancer type if presenting a significantly high frequency of mutations (MutSig2.0) [49], or a significant mutational clustering in a particular region (OncodriveCLUST) [50], or a significant accumulation of mutations with predicted high impact on protein function (OncodriveFM) [51]. MutSig2.0 analyses were retrieved from Firehose. OncodriveCLUST and OncodriveFM analyses were generated on the IntOGen Mutations 2.4.1 platform [52].
Visualization of mutated residues on the protein 3D structure was generated in MuPIT interactive [53]. Mechismo was used to predict the functional impact of residue changes on protein and RNA interactions and TransFIC was used to estimate the functional impact of mutations [54, 55].
Copy number analyses
Copy number values were retrieved from Firehose. These copy number values were estimated from Affymetrix SNP6.0 arrays as part of the Gistic 2.0 pipeline [56]. For a gene to be considered significantly deleted (or amplified) in a tumor entity, the following criteria had to be met: i) presence in a significant peak of deletion (or amplification) according to Gistic2.0; ii) presence in the ‘wide peak’ region predicted by Gistic2.0 that most likely harbors the target genes of the deletion (or amplification); iii) absence of other known cancer genes from Cancer Gene Census in the same ‘wide peak’; iv) presence of mutations in at least 2% of samples; v) at least 5 samples in the tumor entity in which the gene is deleted (or amplified).
Survival analysis
Kaplan-Meier curves were generated using the survfit function of the survival R package and genes associated with survival were identified using the log-rank test. To analyze the association between gene expression (stratified by median) and survival, RNAseq expression values were used in all cancer types, except in GBM, for which more microarray based expression data were available. Expression data were RMA (Robust Multi-Array Average) normalized counts from Affymetrix HG-U133A microarray platform for GBM and Illumina HiSeq RSEM normalized counts for SKCM and BRCA.
The R2: Genomics Analysis and Visualization platform (http://r2.amc.nl) was used to generate Kaplan-Meier curves for RPL5 expression in another BRCA dataset not included in TCGA (“Tumor Breast - Bergh - 159 - MAS5.0 - u133a”, GEO accession ID: GSE1456 [57]. Probe 213080_x_at was chosen and the median was used as cut-off for gene expression.
Co-occurring and mutually exclusive mutations
The Fisher's exact test was used to identify significant co-occurrence or mutual exclusivity of genetic alterations in ribosomal protein genes and other genes. The interaction between RPL5 inactivating mutations and deletions and TP53 inactivating mutations and deletions and with MDM2, MDM4 and c-MYC non inactivating mutations and amplifications was tested in BRCA, GBM and SKCM.
Cell culture
MDA-MB-231 cells were obtained directly from ATCC. MCF7 cells originated from ATCC and were re-authenticated for this project by Microsynth AG. MCF7 and MDA-MB-231 were cultured in respectively RPMI-1640 and DMEM medium (Life Technologies) supplemented with 10% fetal bovine serum. Hek293T cells originate from DSMZ and were maintained in RPMI-1640. For proliferation assays, 12.500 cells/well were plated in a TPP 96-well plate. Cell proliferation was assessed by taking 4 pictures per well at 2 hour intervals and performing analysis of confluency on an IncuCyte Zoom system (Essen Bioscience). Each experiment was performed in three biological replicates and with a minimum of 6 technical replicates each time.
Generation of RPL5 knockdown cell lines
The doxycycline inducible LT3REVIR (pRRL) vector was a gift from Prof. Johannes Zuber (IMP, Vienna). shRNA sequence AGGAAATAGTGTGAAATTACAA targeting human RPL5 was cloned into this vector and the resulting plasmid was transfected (Genejuice, EMD Millipore) into Hek293T cells to produce lentiviral supernatant using a VSV-G envelope and psPAX2 packaging plasmid. Cell medium was replaced 24 hrs after transfection, followed by viral supernatant collection after another 24h and transduction of the breast cancer cells (empty vector and RPL5 shRNA) in the presence of 8 µg/mL polybrene (Sigma Aldrich). Cells were checked for transduction efficiency on a MACS VYB flow cytometer (Miltenyi), sorted (S3e, Biorad) and analyzed to check if the vector was switched on by 2 µg/mL doxycycline (Sigma Aldrich). Data were processed using FlowJo software.
Immunoblotting
3*106 cells or tumor tissue was lysed in cell lysis buffer (Cell Signaling Technologies). Protein concentrations were determined using Bradford protein assay (Bio-rad) and normalized to 1 µg/µL, followed by sample reduction and denaturation in 1x Laemmli sample buffer (Bio-rad) containing 2-mercaptoethanol. Protein lysates (10-15uL) were separated on Criterion TGX Tris-Glycine eXtended (TGX) precast gels (Bio-rad), transferred to PVDF membranes using the Trans-Blot Turbo system (Bio-rad), and incubated overnight with primary RPL5 (Abcam), α-Tubulin (Sigma Aldrich), Actin (Sigma Aldrich), phospho-CDC2/CDK1 (Tyr15), c-MYC, MDM2 or p53 (all from Cell Signaling) antibody, washed, and incubated for 1 hour with secondary Goat Anti-Mouse IgG-HRP or Goat Anti-Rabbit IgG-HRP antibodies (Thermo Fisher). Protein bands were visualized using chemiluminescent chemistry on an Azure C600 (Azure Biosystems). Quantification was performed using LI-COR Image Studio Lite software version 5.2.
Xenografts in NOD-SCID/IL2γ−/− (NSG) mice
Animal experiments were approved by the local ethics committee (P262-2015). NSG mice were recently purchased from Charles River laboratories and bred in our institute to obtain sufficient animals. 3*106 breast cancer cells were injected subcutaneously in the left and right flank in a 1:1 mixture with Matrigel (Corning). Mice received fresh water containing 2 mg/mL doxycycline (Sigma Aldrich) and 2% sucrose (Sigma Aldrich) twice a week. The animals were monitored on a daily basis and sacrificed before tumors reached 2 cm3. MDA-MB-231 injected mice were sacrificed after 32 days and MCF7 injected mice were sacrificed after 58 days.
Statistical analyses
All statistical analyses were performed using R and IBM SPSS 23 (IBM Analytics) softwares. For experimental work, a one-tailed T-test was used to determine whether RPL5 knockdown increased breast cancer tumor weights and two-tailed paired Student's t-tests when comparing breast cancer cells in various assays.
SUPPLEMENTARY MATERIALS FIGURES AND TABLES
Acknowledgments
We would like to thank Mark Fiers for useful comments and discussion on the bioinformatic analyses.
The results published here are in part based upon data generated by the TCGA Research Network (http://cancergenome.nih.gov/).
Abbreviations
- T-ALL
T-cell leukemia
- CLL
chronic lymphocytic leukemia
- TCGA
The Cancer Genome Atlas
- DBA
Diamond Blackfan Anemia
- MDS
5q- myelodysplastic syndrome
- RMA
Robust Multi-Array Average
- P
p-value
- Q
p-value
- FC
fold change
- TP
primary tumor
- TM
Metastatic Tumor
- TB
Blood Tumor
- BRCA
Breast invasive carcinoma
- COADREAD
Colon-rectum adenocarcinoma
- GBM
Glioblastoma multiforme
- HNSC
Head and Neck squamous cell carcinoma
- KIRC
Kidney renal clear cell carcinoma
- KIRP
Kidney renal papillary cell carcinoma
- LAML
Acute Myeloid Leukemia
- LGG
Brain Lower Grade Glioma
- LUAD
Lung adenocarcinoma
- LUSC
Lung squamous cell carcinoma
- OV
Ovarian serous cystadenocarcinoma
- PRAD
Prostate adenocarcinoma
- SKCM
Skin Cutaneous Melanoma
- STAD
Stomach adenocarcinoma
- THCA
Thyroid carcinoma
- UCEC
Uterine Corpus Endometrial Carcinoma
- rtTA3
reverse tetracycline-controlled trans-activator
- NSG
NOD-SCID/IL2γ−/−
- dox
doxycycline
- ctrl
control
- MSI
microsatellite instable
- n.s.
non significant
- Mbp
Megabase pair
- UCEC
uterine corpus endometrial carcinoma
- THCA
thyroid carcinoma
- STAD
stomach adenocarcinoma
- SKCM
skin cutaneous melanoma
- PRAD
prostate adenocarcinoma
- OV
ovarian serous cystadenocarcinoma
- LUSC
lung squamous cell carcinoma
- LUAD
lung adenocarcinoma
- LGG
brain lower grade glioma
- LAML
acute myeloid leukemia
- KIRP
kidney renal papillary cell carcinoma
- KIRC
kidney renal clear cell carcinoma
- HNSC
head and neck squamous cell carcinoma
- GBM
glioblastoma multiforme
- COADREAD
colon-rectum adenocarcinoma
- BRCA
breast invasive carcinoma
Footnotes
CONFLICTs OF INTEREST
There are no conflicts of interest.
FUNDING
This research was funded by an ERC starting grant (334946), FWO funding (G067015N, G084013N) and a Stichting Tegen Kanker grant (2012-176) to KDK. IH is recipient of an IWT strategisch basisonderzoek PhD fellowship.
Author contributions
L.F., K.R.K and K.D.K. conceived and designed the experiments and wrote the manuscript; K.R.K. and J.V. performed the experiments; L.F., K.R.K and K.D.K. analyzed the data; I.J.F.H. commented on the study and revised the manuscript; K.D.K. obtained funding and supervised the research.
Editorial note
This paper has been accepted based in part on peer-review conducted by another journal and the authors’ response and revisions as well as expedited peer-review in Oncotarget.
REFERENCES
- 1.De Keersmaecker K, Atak ZK, Li N, Vicente C, Patchett S, Girardi T, Gianfelici V, Geerdens E, Clappier E, Porcu M, Lahortiga I, Lucà R, Yan J, et al. Exome sequencing identifies mutation in CNOT3 and ribosomal genes RPL5 and RPL10 in T-cell acute lymphoblastic leukemia. Nat Genet. 2013;45:186–90. doi: 10.1038/ng.2508. [DOI] [PMC free article] [PubMed] [Google Scholar]
- 2.Rao S, Lee SY, Gutierrez A, Perrigoue J, Thapa RJ, Tu Z, Jeffers JR, Rhodes M, Anderson S, Oravecz T, Hunger SP, Timakhov RA, Zhang R, et al. Inactivation of ribosomal protein L22 promotes transformation by induction of the stemness factor, Lin28B. Blood. 2012;120:3764–73. doi: 10.1182/blood-2012-03-415349. [DOI] [PMC free article] [PubMed] [Google Scholar]
- 3.Tzoneva G, Perez-Garcia A, Carpenter Z, Khiabanian H, Tosello V, Allegretta M, Paietta E, Racevskis J, Rowe JM, Tallman MS, Paganin M, Basso G, Hof J, et al. Activating mutations in the NT5C2 nucleotidase gene drive chemotherapy resistance in relapsed ALL. Nat Med. 2013;19:368–71. doi: 10.1038/nm.3078. [DOI] [PMC free article] [PubMed] [Google Scholar]
- 4.Landau D a, Tausch E, Taylor-Weiner AN, Stewart C, Reiter JG, Bahlo J, Kluth S, Bozic I, Lawrence M, Böttcher S, Carter SL, Cibulskis K, Mertens D, et al. Mutations driving CLL and their evolution in progression and relapse. Nature. 2015. [DOI] [PMC free article] [PubMed]
- 5.Ljungström V, Cortese D, Young E, Pandzic T, Mansouri L, Plevova K, Ntoufa S, Baliakas P, Clifford R, Sutton LA, Blakemore SJ, Stavroyianni N, Agathangelidis A, et al. Whole-exome sequencing in relapsing chronic lymphocytic leukemia: Clinical impact of recurrent RPS15 mutations. Blood. 2016;127:1007–16. doi: 10.1182/blood-2015-10-674572. [DOI] [PMC free article] [PubMed] [Google Scholar]
- 6.Kandoth C, McLellan MD, Vandin F, Ye K, Niu B, Lu C, Xie M, Zhang Q, McMichael JF, Wyczalkowski M a, Leiserson MDM, Miller C a, Welch JS, et al. Mutational landscape and significance across 12 major cancer types. Nature. 2013;502:333–9. doi: 10.1038/nature12634. [DOI] [PMC free article] [PubMed] [Google Scholar]
- 7.Tamborero D, Gonzalez-Perez A, Perez-llamas C, Deu-Pons J, Kandoth C, Reimand J, Lawrence MS, Getz G, Bader GD, Ding L, Lopez-Bigas N. Comprehensive identification of mutational cancer driver genes across 12 tumor types. Sci Rep. 2013;3:2650. doi: 10.1038/srep02650. [DOI] [PMC free article] [PubMed] [Google Scholar]
- 8.Lawrence MS, Stojanov P, Mermel CH, Robinson JT, Garraway L a, Golub TR, Meyerson M, Gabriel SB, Lander ES, Getz G. Discovery and saturation analysis of cancer genes across 21 tumour types. Nature. 2014;505:495–501. doi: 10.1038/nature12912. [DOI] [PMC free article] [PubMed] [Google Scholar]
- 9.Novetsky AP, Zighelboim I, Thompson DM, Powell MA, Mutch DG, Goodfellow PJ. Frequent mutations in the RPL22 gene and its clinical and functional implications. Gynecol Oncol. 2013;128:470–4. doi: 10.1016/j.ygyno.2012.10.026. [DOI] [PMC free article] [PubMed] [Google Scholar]
- 10.Ferreira AM, Tuominen I, van Dijk-Bos K, Sanjabi B, van der Sluis T, van der Zee AG, Hollema H, Zazula M, Sijmons RH, Aaltonen LA, Westers H, Hofstra RMW. High frequency of RPL22 mutations in microsatellite-unstable colorectal and endometrial tumors. Hum Mutat. 2014;35:1442–5. doi: 10.1002/humu.22686. [DOI] [PubMed] [Google Scholar]
- 11.Nagarajan N, Bertrand D, Hillmer AM, Zang ZJ, Yao F, P-É Jacques, Teo ASM, Cutcutache I, Zhang Z, Lee WH, Sia YY, Gao S, Ariyaratne PN, et al. Whole-genome reconstruction and mutational signatures in gastric cancer. Genome Biol. 2012;13:R115. doi: 10.1186/gb-2012-13-12-r115. [DOI] [PMC free article] [PubMed] [Google Scholar]
- 12.Dutton-Regester K, Gartner JJ, Emmanuel R, Qutob N, Davies MA, Gershenwald JE, Robinson W, Robinson S, Rosenberg SA, Scolyer RA, Mann GJ, Thompson JF, Hayward NK, et al. A highly recurrent RPS27 5’UTR mutation in melanoma. Oncotarget. 2014;5:2912–7. doi: 10.18632/oncotarget.2048. [DOI] [PMC free article] [PubMed] [Google Scholar]
- 13.Hofman IJF, Van Duin M, De Bruyne E, Fancello L, Mulligan G, Geerdens E, Garelli E, Mancini C, Lemmens H, Delforge M, Vandenberghe P, Wlodarska I, Aspesi A, Michaux L, et al. RPL5 on 1p22.1 is recurrently deleted in multiple myeloma and its expression is linked to bortezomib response. Leukemia. 2017. [DOI] [PMC free article] [PubMed]
- 14.Vlachos A, Rosenberg PS, Atsidaftos E, Alter BP, Lipton JM. Incidence of neoplasia in Diamond Blackfan anemia: A report from the Diamond Blackfan anemia registry. Blood. 2012;119:3815–9. doi: 10.1182/blood-2011-08-375972. [DOI] [PMC free article] [PubMed] [Google Scholar]
- 15.Ruggero D, Shimamura A. Marrow failure: A window into ribosome biology. Blood. 2014;124:2784–92. doi: 10.1182/blood-2014-04-526301. [DOI] [PMC free article] [PubMed] [Google Scholar]
- 16.Ebert BL, Pretz J, Bosco J, Chang CY, Tamayo P, Galili N, Raza A, Root DE, Attar E, Ellis SR, Golub TR. Identification of RPS14 as a 5q- syndrome gene by RNA interference screen. Nature. 2008;451:335–9. doi: 10.1038/nature06494. [DOI] [PMC free article] [PubMed] [Google Scholar]
- 17.De Keersmaecker K, Sulima SO, Dinman JD. Perspectives Ribosomopathies and the paradox of cellular hypo-to hyperproliferation. Blood. 2016;125:1377–83. doi: 10.1182/blood-2014-10. [DOI] [PMC free article] [PubMed] [Google Scholar]
- 18.Amsterdam A, Sadler KC, Lai K, Farrington S, Bronson RT, Lees JA, Hopkins N. Many ribosomal protein genes are cancer genes in zebrafish. PLoS Biol. 2004;2 doi: 10.1371/journal.pbio.0020139. [DOI] [PMC free article] [PubMed] [Google Scholar]
- 19.Morgado-Palacin L, Varetti G, Llanos S, G??mez-L??pez G, Martinez D, Serrano M. Partial Loss of Rpl11 in Adult Mice Recapitulates Diamond-Blackfan Anemia and Promotes Lymphomagenesis. Cell Rep. 2015;13:712–22. doi: 10.1016/j.celrep.2015.09.038. [DOI] [PubMed] [Google Scholar]
- 20.Kazerounian S, Ciarlini PDSC, Yuan D, Ghazvinian R, Alberich-Jorda M, Joshi M, Zhang H, Beggs AH, Gazda HT. Development of soft tissue sarcomas in ribosomal proteins L5 and S24 heterozygous mice. J Cancer. 2016;7:32–6. doi: 10.7150/jca.13292. [DOI] [PMC free article] [PubMed] [Google Scholar]
- 21.Fumagalli S, Di Cara A, Neb-Gulati A, Natt F, Schwemberger S, Hall J, Babcock GF, Bernardi R, Pandolfi PP, Thomas G. Absence of nucleolar disruption after impairment of 40S ribosome biogenesis reveals an rpL11-translation-dependent mechanism of p53 induction. Nat Cell Biol. 2009;11:501–8. doi: 10.1038/ncb1858. [DOI] [PMC free article] [PubMed] [Google Scholar]
- 22.Teng T, Mercer CA, Hexley P, Thomas G, Fumagalli S. Loss of Tumor Suppressor RPL5/RPL11 Does Not Induce Cell Cycle Arrest but Impedes Proliferation Due to Reduced Ribosome Content and Translation Capacity. Mol Cell Biol. 2013;33:4660–71. doi: 10.1128/MCB.01174-13. [DOI] [PMC free article] [PubMed] [Google Scholar]
- 23.Lohrum MAE, Ludwig RL, Kubbutat MHG, Hanlon M, Vousden KH. Regulation of HDM2 activity by the ribosomal protein L11. Cancer Cell. 2003;3:577–87. doi: 10.1016/S1535-6108(03)00134-X. [DOI] [PubMed] [Google Scholar]
- 24.Dai MS, Lu H. Inhibition of MDM2-mediated p53 ubiquitination and degradation by ribosomal protein L5. J Biol Chem. 2004;279:44475–82. doi: 10.1074/jbc.M403722200. [DOI] [PubMed] [Google Scholar]
- 25.Dai M-S, Zeng SX, Jin Y, Sun X-X, David L, Lu H. Ribosomal protein L23 activates p53 by inhibiting MDM2 function in response to ribosomal perturbation but not to translation inhibition. Mol Cell Biol. 2004;24:7654–68. doi: 10.1128/MCB.24.17.7654-7668.2004. [DOI] [PMC free article] [PubMed] [Google Scholar]
- 26.Jin A, Itahana K, O’Keefe K, Zhang Y. Inhibition of HDM2 and activation of p53 by ribosomal protein L23. Mol Cell Biol. 2004;24:7669–80. doi: 10.1128/MCB.24.17.7669-7680.2004. [DOI] [PMC free article] [PubMed] [Google Scholar]
- 27.Zhang Y, Wolf GW, Bhat K, Jin A, Allio T, Burkhart W a, Xiong Y. Ribosomal protein L11 negatively regulates oncoprotein MDM2 and mediates a p53-dependent ribosomal-stress checkpoint pathway. Mol Cell Biol. 2003;23:8902–12. doi: 10.1128/MCB.23.23.8902-8912.2003. [DOI] [PMC free article] [PubMed] [Google Scholar]
- 28.Boon K, Caron HN, Van Asperen R, Valentijn L, Hermus MC, Van Sluis P, Roobeek I, Weis I, Voûte PA, Schwab M, Versteeg R. N-myc enhances the expression of a large set of genes functioning in ribosome biogenesis and protein synthesis. EMBO J. 2001;20:1383–93. doi: 10.1093/emboj/20.6.1383. [DOI] [PMC free article] [PubMed] [Google Scholar]
- 29.Menssen A, Hermeking H. Characterization of the c-MYC-regulated transcriptome by SAGE: identification and analysis of c-MYC target genes. Proc Natl Acad Sci U S A. 2002;99:6274–9. doi: 10.1073/pnas.082005599. [DOI] [PMC free article] [PubMed] [Google Scholar]
- 30.Coller HA, Grandori C, Tamayo P, Colbert T, Lander ES, Eisenman RN, Golub TR. Expression analysis with oligonucleotide microarrays reveals that MYC regulates genes involved in growth, cell cycle, signaling, and adhesion. Proc Natl Acad Sci U S A. 2000;97:3260–5. doi: 10.1073/pnas.97.7.3260. [DOI] [PMC free article] [PubMed] [Google Scholar]
- 31.Liao J-M, Zhou X, Gatignol a, Lu H. Ribosomal proteins L5 and L11 co-operatively inactivate c-Myc via RNA-induced silencing complex. Oncogene. 2013. pp. 1–8. [DOI] [PMC free article] [PubMed]
- 32.Challagundla KB, Sun X-X, Zhang X, DeVine T, Zhang Q, Sears RC, Dai M-S. Ribosomal protein L11 recruits miR-24/miRISC to repress c-Myc expression in response to ribosomal stress. Mol Cell Biol. 2011;31:4007–21. doi: 10.1128/MCB.05810-11. [DOI] [PMC free article] [PubMed] [Google Scholar]
- 33.Zhou X, Hao Q, Liao JM, Liao P, Lu H. Ribosomal protein s14 negatively regulates c-Myc activity. J Biol Chem. 2013;288:21793–801. doi: 10.1074/jbc.M112.445122. [DOI] [PMC free article] [PubMed] [Google Scholar]
- 34.Dai MS, Sun XX, Lu H. Ribosomal protein L11 associates with c-Myc at 5 S rRNA and tRNA genes and regulates their expression. J Biol Chem. 2010;285:12587–94. doi: 10.1074/jbc.M109.056259. [DOI] [PMC free article] [PubMed] [Google Scholar]
- 35.Dai M-SS, Arnold H, Sun X-XX, Sears R, Lu H. Inhibition of c-Myc activity by ribosomal protein L11. EMBO J. 2007;26:3332–45. doi: 10.1038/sj.emboj.7601776. [DOI] [PMC free article] [PubMed] [Google Scholar]
- 36.Xue S, Barna M. Specialized ribosomes: a new frontier in gene regulation and organismal biology. Nat Rev Mol Cell Biol. 2012;13:355–69. doi: 10.1038/nrm3359. [DOI] [PMC free article] [PubMed] [Google Scholar]
- 37.Dinman JD. Pathways to Specialized Ribosomes: The Brussels Lecture. J Mol Biol. 2015;428:2186–94. doi: 10.1016/j.jmb.2015.12.021. [DOI] [PMC free article] [PubMed] [Google Scholar]
- 38.Venticinque L, Jamieson K V, Meruelo D. Interactions between laminin receptor and the cytoskeleton during translation and cell motility. PLoS One. 2011;6:1–11. doi: 10.1371/journal.pone.0015895. [DOI] [PMC free article] [PubMed] [Google Scholar]
- 39.Scheiman J, Jamieson K V, Ziello J, Tseng J-C, Meruelo D. Extraribosomal functions associated with the C terminus of the 37/67 kDa laminin receptor are required for maintaining cell viability. Cell Death Dis. 2010;1:e42. doi: 10.1038/cddis.2010.19. [DOI] [PMC free article] [PubMed] [Google Scholar]
- 40.Berno V, Porrini D, Castiglioni F, Campiglio M, Casalini P, Pupa SM, Balsari A, Ménard S, Tagliabue E. The 67 kDa laminin receptor increases tumor aggressiveness by remodeling laminin-1. Endocr Relat Cancer. 2005;12:393–406. doi: 10.1677/erc.1.00870. [DOI] [PubMed] [Google Scholar]
- 41.Montuori N, Selleri C, Risitano AM, Raiola AM, Ragno P, L Del Vecchio, Rotoli B, Rossi G. Expression of the 67-kDa laminin receptor in acute myeloid leukemia cells mediates adhesion to laminin and is frequently associated with monocytic differentiation. Clin Cancer Res. 1999;5:1465–72. [PubMed] [Google Scholar]
- 42.Basset P, Bellocq JP, Lefebvre O, Noël A, Chenard MP, Wolf C, Anglard P, Rio MC. Stromelysin-3: A paradigm for stroma-derived factors implicated in carcinoma progression. Crit Rev Oncol Hematol. 1997;26:43–53. doi: 10.1016/S1040-8428(97)00010-3. [DOI] [PubMed] [Google Scholar]
- 43.Cmejla R, Cmejlova J, Handrkova H, Petrak J, Petrtylova K, Mihal V, Stary J, Cerna Z, Jabali Y, Pospisilova D. Identification of mutations in the ribosomal protein L5 (RPL5) and ribosomal protein L11 (RPL11) genes in Czech patients with diamond-blackfan anemia. Hum Mutat. 2009;30:321–7. doi: 10.1002/humu.20874. [DOI] [PubMed] [Google Scholar]
- 44.Quarello P, Garelli E, Carando A, Brusco A, Calabrese R, Dufour C, Longoni D, Misuraca A, Vinti L, Aspesi A, Biondini L, Loreni F, Dianzani I, et al. Diamond-blackfan anemia: Genotype-phenotype correlations in Italian patients with RPL5 and RPL11 mutations. Haematologica. 2010;95:206–13. doi: 10.3324/haematol.2009.011783. [DOI] [PMC free article] [PubMed] [Google Scholar]
- 45.Gazda HT, Sheen MR, Vlachos A, Choesmel V, O’Donohue MF, Schneider H, Darras N, Hasman C, Sieff CA, Newburger PE, Ball SE, Niewiadomska E, Matysiak M, et al. Ribosomal Protein L5 and L11 Mutations Are Associated with Cleft Palate and Abnormal Thumbs in Diamond-Blackfan Anemia Patients. Am J Hum Genet. 2008;83:769–80. doi: 10.1016/j.ajhg.2008.11.004. [DOI] [PMC free article] [PubMed] [Google Scholar]
- 46.Melamed RD, Emmett KJ, Madubata C, Rzhetsky A, Rabadan R. Genetic similarity between cancers and comorbid Mendelian diseases identifies candidate driver genes. Nat Commun. 2015;6:7033. doi: 10.1038/ncomms8033. [DOI] [PMC free article] [PubMed] [Google Scholar]
- 47.Singh S a, Goldberg T a, Henson AL, Husain-Krautter S, Nihrane A, Blanc L, Ellis SR, Lipton JM, Liu JM. p53-independent cell cycle and erythroid differentiation defects in murine embryonic stem cells haploinsufficient for Diamond Blackfan anemia-proteins: RPS19 versus RPL5. PLoS One. 2014;9:1–10. doi: 10.1371/journal.pone.0089098. [DOI] [PMC free article] [PubMed] [Google Scholar]
- 48.Liu H, Radisky DC, Yang D, Xu R, Radisky ES, Bissell MJ, Bishop JM. MYC suppresses cancer metastasis by direct transcriptional silencing of αv and β3 integrin subunits. Nat Cell Biol. 2012;14:567–74. doi: 10.1038/ncb2491. [DOI] [PMC free article] [PubMed] [Google Scholar]
- 49.Lawrence MS, Stojanov P, Polak P, Kryukov G V, Cibulskis K, Sivachenko A, Carter SL, Stewart C, Mermel CH, Roberts S a, Kiezun A, Hammerman PS, McKenna A, et al. Mutational heterogeneity in cancer and the search for new cancer-associated genes. Nature. 2013;499:214–8. doi: 10.1038/nature12213. [DOI] [PMC free article] [PubMed] [Google Scholar]
- 50.Tamborero D, Gonzalez-Perez A, Lopez-Bigas N. OncodriveCLUST: Exploiting the positional clustering of somatic mutations to identify cancer genes. Bioinformatics. 2013;29:2238–44. doi: 10.1093/bioinformatics/btt395. [DOI] [PubMed] [Google Scholar]
- 51.Gonzalez-Perez A, Lopez-Bigas N. Functional impact bias reveals cancer drivers. Nucleic Acids Res. 2012;40:1–10. doi: 10.1093/nar/gks743. [DOI] [PMC free article] [PubMed] [Google Scholar]
- 52.Gonzalez-Perez A, Perez-Llamas C, Deu-Pons J, Tamborero D, Schroeder MP, Jene-Sanz A, Santos A, Lopez-Bigas N. IntOGen-mutations identifies cancer drivers across tumor types. Nat Methods. 2013;10:1081–2. doi: 10.1038/nmeth.2642. [DOI] [PMC free article] [PubMed] [Google Scholar]
- 53.Niknafs N, Kim D, Kim R, Diekhans M, Ryan M, Stenson PD, Cooper DN, Karchin R. MuPIT interactive: Webserver for mapping variant positions to annotated, interactive 3D structures. Hum Genet. 2013;132:1235–43. doi: 10.1007/s00439-013-1325-0. [DOI] [PMC free article] [PubMed] [Google Scholar]
- 54.Betts MJ, Lu Q, Jiang Y, Drusko A, Wichmann O, Utz M, Valtierra-Guti??rrez IA, Schlesner M, Jaeger N, Jones DT, Pfister S, Lichter P, Eils R, et al. Mechismo: Predicting the mechanistic impact of mutations and modifications on molecular interactions. Nucleic Acids Res. 2015;43:e10. doi: 10.1093/nar/gku1094. [DOI] [PMC free article] [PubMed] [Google Scholar]
- 55.González-Pérez A, López-Bigas N. Improving the assessment of the outcome of nonsynonymous SNVs with a consensus deleteriousness score, Condel. Am J Hum Genet. 2011;88 doi: 10.1016/j.ajhg.2011.03.004. [DOI] [PMC free article] [PubMed] [Google Scholar]
- 56.Mermel CH, Schumacher SE, Hill B, Meyerson ML, Beroukhim R, Getz G. GISTIC2.0 facilitates sensitive and confident localization of the targets of focal somatic copy-number alteration in human cancers. Genome Biol. 2011;12:R41. doi: 10.1186/gb-2011-12-4-r41. [DOI] [PMC free article] [PubMed] [Google Scholar]
- 57.Pawitan Y, Bjöhle J, Amler L, Borg A-L, Egyhazi S, Hall P, Han X, Holmberg L, Huang F, Klaar S, Liu ET, Miller L, Nordgren H, et al. Gene expression profiling spares early breast cancer patients from adjuvant therapy: derived and validated in two population-based cohorts. Breast Cancer Res. 2005;7:R953–64. doi: 10.1186/bcr1325. [DOI] [PMC free article] [PubMed] [Google Scholar]
Associated Data
This section collects any data citations, data availability statements, or supplementary materials included in this article.