

Abstract
Staphylococcus epidermidis is one of the primary bacterial species responsible for healthcare-associated infections. The most significant virulence factor for S. epidermidis is its ability to form a biofilm, which renders the bacteria highly resistant to host immune responses and antibiotic action. Intercellular adhesion within the biofilm is mediated by the accumulation-associated protein (Aap), a cell wall-anchored protein that self-assembles in a zinc-dependent manner. The C-terminal portion of Aap contains a proline/glycine-rich, 135 amino acid-long region that has not yet been characterized. The region contains a set of 18 nearly identical AEPGKP repeats. Analysis of the proline/glycine-rich region (PGR) using biophysical techniques demonstrated the region is a highly extended, intrinsically disordered polypeptide (IDP) with unusually high polyproline type II helix (PPII) propensity. In contrast to many IDPs, there was a minimal temperature dependence of the global conformational state of PGR in solution as measured by analytical ultracentrifugation and dynamic light scattering. Furthermore, PGR was resistant to conformational collapse or α-helix formation upon addition of the osmolyte TMAO or the cosolvent TFE. Collectively, these results suggest PGR functions as a resilient, extended stalk that projects the rest of Aap outward from the bacterial cell wall, promoting intercellular adhesion between cells in the biofilm. This work sheds light on regions of low complexity often found near the attachment point of bacterial cell wall-anchored proteins.
Keywords: intrinsically disordered protein, analytical ultracentrifugation, circular dichroism, cell wall-anchored protein, Staphylococcus epidermidis
Graphical abstract
Introduction
Staphylococcus epidermidis is a human commensal that is also responsible for a significant number of hospital-acquired infections, particularly device-related infections resulting from the propensity of S. epidermidis to adhere to abiotic surfaces such as plastic and glass. Examples of nosocomial infections resulting from S. epidermidis include bacteremia or endocarditis after introduction of catheters, pacemakers, or prosthetics [1-4]. Although S. epidermidis lacks many of the virulence factors expressed by its more pathogenic relative S. aureus, S. epidermidis is highly capable of forming robust biofilms and causing infection [5]. Biofilms provide a substantial degree of protection from antibiotics, the host immune system, and environmental stresses [6]. Therefore, treatment of biofilm-associated infections often requires removal of the contaminated device and prolonged antibiotic usage [7]. S. epidermidis biofilms are typically encapsulated in an extracellular matrix composed of poly-N-acetylglucosamine (PNAG) [8] along with protein components, teichoic acids, and extracellular DNA [1]. One protein of particular importance for S. epidermidis biofilm formation and infection is the accumulation-associated protein (Aap). The first demonstration of the critical role of Aap came in the form of an Aap-negative mitomycin mutant of S. epidermidis strain RP62A with minimal ability to accumulate on polystyrene and glass. Antibodies raised against Aap inhibited wild-type RP62A accumulation on polystyrene [9]. Another piece of evidence indicating Aap’s importance was a 2007 study investigating PNAG and protein factors in S. epidermidis clinical isolates from prosthetic infections. The study [10] found that 89% of these strains were aap+, while only 62% were positive for icaA, the gene encoding an N-acetylglucosaminyl transferase critical for the synthesis of PNAG [8]. Among the biofilm-positive strains, 27% did not contain the icaADBC biosynthetic operon, and biofilm formation could be attributed to Aap in the majority of isolates [10]. Furthermore, in a rat model, Aap, but not icaADBC, was required for colonization of an intravenous catheter. Bacteria levels in blood were also significantly lower in the Δaap strain and the ΔicaADBC Δaap double mutant strain compared to the wild-type and ΔicaADBC strains [11], again highlighting the importance of Aap in biofilm formation and infection.
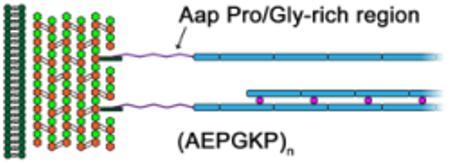
The accumulation-associated protein is a large, multi-functional, cell wall-anchored protein found in dense tufts on the bacterial cell surface [12] that has been implicated in both the initial attachment phase [13] and the accumulation phase [14-16] of biofilm formation. At the N-terminus, the A-domain of Aap (Fig. 1a) contains 11 short 16-aa A-repeats and a predicted globular lectin domain. This domain can initiate biofilm formation in some strains [13] and mediate adhesion to human corneocytes [17] and abiotic surfaces [11]. Downstream from the lectin domain, the B-repeat superdomain of Aap contains 5-17 nearly identical 128-aa B-repeats. Processing of Aap by an extracellular protease results in cleavage of the A-domain and unmasking of the B-repeat region, which mediates accumulation of S. epidermidis cells at early stages of biofilm growth [14]. The B-repeats of Aap are responsible for intercellular adhesion via Zn2+-mediated self assembly in an anti-parallel manner [15, 18]. The C-terminal portion of Aap is comprised of a proline/glycine-rich region (PGR) (Fig. 1b) followed by the LPXTG motif that is covalently linked to the peptidoglycan layer of the bacterial cell wall by the Sortase A enzyme [19, 20].
Figure 1. PGR shows aberrant mobility and exists as an elongated monomer in solution.

(a) Schematic of Aap anchored to the peptidoglycan layer of the S. epidermidis cell wall by the LPXTG Sortase A motif, with approximate domain boundaries shown for relative scale. (b) Amino acid sequence of PGR flanked by the end of the B-repeat superdomain (EYGPT) and the LPXTG motif (underlined) – note the repeating AEPGKP hextads. The amino acids are numbered as they appear in Aap from S. epidermidis RP62A. Positively charged residues in the PGR are colored blue, while negatively charged residues are colored red. Panel (c) shows the aberrant mobility of PGR by silver-stained SDS-PAGE. Fusion refers to the His-MBP-PGR fusion protein. +TEV is 6hr after the addition of TEV protease to cleave the His-MBP tag from PGR. PGR is post-ANX purification. While the His-MBP-PGR fusion protein migrates as expected, cleaved PGR (13.2 kDa) migrates more than 10 times more slowly than expected. (d) Sedimentation velocity AUC absorbance data (markers) and best-fit model (lines) in the upper panel. Residual error in the bottom panel, showing good fits to the data. Panel (e) shows the c(s) distribution analysis of PGR at multiple concentrations (75 μM = 1 mg/ml) indicating PGR does not self-assemble. The frictional ratio ranged from 2.1 to 2.3, indicating a highly elongated species. The calculated molecular weight was near that of monomeric PGR, suggesting PGR exists as a highly elongated monomer under native conditions across the concentration range tested. Standardized sedimentation coefficients (s20,w) are displayed representing s at 20° C and in water. A linear regression was performed to determine the standardized sedimentation coefficient at infinite dilution (s020,w) by extrapolation of s20,w to zero concentration ((e), inset), yielding a value of 1.06 S. The values used in the extrapolation are shown in white circles, while the 300 μM (4 mg/ml) value shown as a filled circle was omitted. Detailed results can be found in Table S1.
The PGR of Aap is classified as one of many low-complexity regions in cell wall-anchored proteins, although little has been published regarding their structure or function [21-26]. The focus of this work was to utilize biophysical techniques to elucidate the structural characteristics and functional implications for the proline/glycine-rich region of Aap. The PGR comprises 135 residues in a series of AEPGKP repeats (Fig. 1b). Although the repeat sequence has some similarity to typical collagen triplet repeats, the presence of a non-glycine in the third position of every other triplet would sterically preclude triple helix formation by the PGR [27, 28]. Consistent with this expectation, our data reveal that the Aap PGR is monomeric and intrinsically disordered. Intrinsically disordered regions of proteins (IDPs) have been of growing interest to the scientific community over the past decade [29-32]. IDPs are increasingly revealed to be quite common [33] and to play critical biological roles [34], including in human diseases [35].
Not surprisingly, with the increased interest in understanding the functional roles of IDPs, there is also interest in surveying the structural conformations available to these proteins. This information is essential in order to understand the mechanism of how these disordered polypeptides function. In some cases, IDPs undergo a conformational transition from disordered to ordered, such as induced folding upon binding to a target protein [36]. However, disordered proteins do not necessarily require a transition from disorder to order (or order to disorder) to effect their biological function. One category of intrinsically disordered regions, known as “entropic chains,” includes IDPs that remain unstructured for their normal function [37, 38]. In other words, the activity of these proteins relies on the dynamic nature of the protein backbone in order to carry out the biological function. Examples of these entropic chains include flexible linkers between two domains, entropic springs such as the disordered PEVK domain of titin which exhibits variable conformations contributing to the maintenance of muscle cell length [39, 40], and entropic bristles such as neurofilament H and M which contain disordered C-terminal domains known as sidearms. These sidearms occupy significant 3-dimensional space due to their ability to sample a large number of conformations, maintaining appropriate spacing between neighboring filaments [41].
Using a combination of circular dichroism and analytical ultracentrifugation, we demonstrate that the Aap PGR is a highly extended polypeptide rich in polyproline type II (PPII) helix. These data are consistent with size-exclusion chromatography and dynamic light scattering measurements that reveal an averaged hydrodynamic radius of 37.7 Å, compared to an expected value of ~20 Å for a typical globular protein of equivalent length. These data are accurately predicted by a power-law scaling relationship [42] described for IDPs and based upon intrinsic PPII propensities, which provides additional evidence that the Aap PGR has an unusually high PPII content compared to other characterized IDPs. Interestingly, we find that PGR resists the compaction typically induced in IDPs by elevated temperature or cosolvents such as TFE and TMAO. Taken together, our data indicate that the PGR forms a highly elongated stalk region that extends the functional B-repeat region of Aap away from the peptidoglycan layer of the staphylococcal cell wall, enabling the important intercellular adhesion events necessary for biofilm formation.
Results
The proline/glycine-rich region shows aberrant mobility
To understand the role of the proline/glycine-rich region in Aap and how it might contribute to S. epidermidis biofilm formation, we sought to express this region as a recombinant protein and analyze it using biophysical techniques. The proline/glycine-rich region of Aap (termed PGR) was expressed in Escherichia coli as a fusion protein with a hexahistidine-maltose binding protein (His-MBP) tag. By SDS-PAGE (Fig. 1c), the fusion protein (His-MBP-PGR) runs near the expected MW of 60 kDa. After cleavage of the His-MBP tag with Tobacco Etch Virus (TEV) protease, a prominent band appears near 150 kDa in addition to the 42.5 kDa MBP and 27 kDa TEV. After further purification by affinity and anion exchange chromatography, a single band of high purity is observed by SDS-PAGE running near 150 kDa. This putative PGR band exhibited highly aberrant migration by SDS-PAGE, with an apparent molecular weight more than 10-fold higher than predicted (13.2 kDa). Purified PGR was examined by electrospray ionization mass spectrometry to confirm the presence of a single species with a molecular mass of 13,194 Da. Aberrant mobility during SDS-PAGE has been observed as early as 1969 by Dunker and Rueckert [43], and more recently several IDPs have shown aberrant mobility, although to a lesser extent than PGR [44-46]. Under the denaturing conditions used for SDS-PAGE gels, the mobility of the migrating protein species under the applied electric field is dependent on the number of SDS molecules bound to the protein through interactions of the acyl tail of SDS and hydrophobic regions of the protein. PGR includes very few hydrophobic residues—its GRAVY (GRand Average of HydrophathY) hydropathy index score is −1.41 [47]—which should result in very low SDS binding capacity and very low mobility under the electric field relative to proteins of similar size with more typical amino acid distributions. This aberrant mobility has been observed for other proteins with low GRAVY scores [48] and specifically for collagen peptides, which exhibit high imino acid and glycine content but infrequent hydrophobic residues [49], similar to the PGR. This aberrant migration due to diminished SDS binding may be generally applicable to other IDPs, as low hydrophobicity is a common attribute of IDPs [50].
PGR sediments as an elongated monomer
To determine whether PGR exists in solution as an extended monomer or a higher-order assembly, we performed sedimentation velocity analytical ultracentrifugation (AUC) (Fig. 1d). This technique tracks the rate of protein sedimentation under an applied centrifugal field, allowing for the characterization of the size and shape of the species in solution under native conditions. AUC experiments can provide additional hydrodynamic information about macromolecules in solution compared to SDS-PAGE and size exclusion chromatography, because the experimental analysis provides insight into both the size of the sedimenting species (via the sedimentation coefficient) and its shape (via the frictional coefficient, which depends on broadening of the sedimentation boundary due to diffusion). At 20° C and in biologically relevant buffer, PGR was monomeric at concentrations ranging from 25 μM to 300 μM (0.33 mg/ml to 4 mg/ml). However, under all conditions, PGR sedimented slowly, with a sedimentation coefficient of 1.0 S and an unusually high frictional ratio (greater than 2), indicating a highly elongated or non-globular conformation that results in increased drag (Fig. 1e, Tables 1 and S1). These results support the hypothesis that PGR has aberrant mobility due primarily to a preference for a set of extended conformations.
Table 1.
Summary of hydrodynamic parameters determined in this study
| Technique |
s020,w
(Svedberg) |
D020,w
(cm2/s) |
f/f0 a |
Rh
(Å) |
|---|---|---|---|---|
| AUC | 1.06 | 6.87 × 10⁻⁷ | 2.14 | |
| SEC | 37.06 ± 1.1 (22° C) | |||
| DLS | 7.09 ± 0.4 × 10⁻⁷ | 38.39 ± 0.9 (25° C) |
Frictional ratio from 25 μM PGR at 20° C in 20 mM KPO4 pH 7.4, 150 mM NaCl
Determination of the hydrodynamic radius of PGR in solution
In parallel to the sedimentation velocity analysis, we determined the radius of hydration (Rh) of PGR by size exclusion chromatography (SEC) [51]. A series of well-characterized globular proteins were run over a G-100 Sephadex column to determine the linear relationship between the thermodynamic retention factor (KD) and Rh for control proteins with known crystal structures [51, 52] (Fig. 2a). Based on the linear Rh vs KD plot, the Rh for PGR was determined to be 37.06 ± 1.1 Å. This value is surprisingly high for a protein of 13.2 kDa, as can be seen in a plot of logMW vs KD (Fig. 2b); PGR deviates significantly from the linear relationship seen for the folded, globular control proteins bovine serum albumin, chicken albumin, bovine carbonic anhydrase, and horse myoglobin (BSA, Alb, CA, and Myo respectively). If PGR were a globular protein, its Rh would correspond to an apparent MW of 53.6 kDa, nearly four times larger than its actual MW. Furthermore, a plot of logRh vs logN where N is the number of residues, shows distinct linear trends for IDPs [42] (Table S4) and globular proteins [51, 53] (Table S5); PGR clearly falls in the IDP region in this plot (Fig. 2c). The abnormal migration by SDS-PAGE, highly extended conformation in solution by AUC, and aberrant Rh compared to its MW all indicate that PGR is likely to be an IDP.
Figure 2. Size exclusion chromatography (SEC) confirms an extended conformation in solution.

Panel (a) is a representative dataset from SEC experiments using G-100 resin. Folded protein standards are displayed in empty circles with their linear regression plotted as a dotted line. The Rh of the folded proteins were estimated as the half-maximal Cα-Cα distance obtained from X-ray crystallography structures of bovine serum albumin (BSA – PDB ID: 4F5S) [128], chicken albumin (Alb – PDB ID: 1OVA) [129], carbonic anhydrase (CA – PDB ID: 1V9I) [130], and horse myoglobin (Myo – PDB ID: 2O58) [131]. The SEC-measured KD of PGR (blue circle) was plotted along the linear regression of the protein standards to yield a Rh of 37.21 Å (indicated by the dashed drop lines), or an average of 37.06 Å across 4 independent experiments (2 using G-75 resin, 2 using G-100 resin), each with 3-9 replicates of the training proteins and 2-3 replicates of PGR or PGR-Tyr. The addition of a Tyr to the C-terminus of PGR did not appear to significantly affect the Rh, but it allowed measurements to be performed at 1 mg/ml rather than at the 3-4 mg/ml required for PGR. Panel (b) examines the linear relationship between KD and logMW for the folded protein standards. Clearly, PGR deviates from this trend. PGR has a KD which would be expected for a folded protein of 50.9 kDa (logMW = 4.71), as indicated by the dashed drop lines starting from PGR’s KD and ending at the logMW. Panel (c) shows the relationship between logRh in Å and logN where N is the number of residues. Folded proteins [51, 53] (empty circles, dashed linear regression) trend differently than IDPs [42] (filled circles, solid linear regression). PGR trends with IDPs and not folded proteins. Also shown for reference is the IDP p53(1-93).
Predicted disorder based on PGR primary sequence
To investigate the inherent propensity of PGR to form an intrinsically disordered polypeptide, we submitted its amino acid sequence to several prediction servers. Figure S1a shows the location of PGR on the Uversky plot, which segregates disordered proteins from ordered proteins based on absolute mean net charge and mean scaled hydropathy [50]. Although PGR has a relatively low absolute mean net charge per residue of 0.052 due to the alternating Glu and Lys residues, PGR still lies on the “disordered” side of the Uversky plot due to the general lack of hydrophobic residues. IDPs are typically composed primarily of “disorder-promoting” amino acids, which include Ala, Glu, Pro, Gly, and Lys (which comprise the primary AEPGKP repeat in PGR), as well as Arg, Gln, and Ser. Similarly, IDPs tend to lack bulky hydrophobic and aromatic residues that would promote the formation of a hydrophobic core in a globular fold [54, 55]. Analysis of the PGR sequence using the Database of Disordered Protein Predictions (D2P2) [56] showed unanimous agreement among all predictions that this region is disordered (data not shown); the results from several disorder-predicting servers [57-61] are shown in Figure S1b. Interestingly, such predictions indicated high probability of disorder in the A-repeats and B-repeats as well as the PGR of Aap. While no data have been published regarding the structure of the A-repeats, B-repeat constructs from Aap and its ortholog SasG have been crystallized and form an elongated, non-globular fold with long 3-stranded β-sheets interspersed with regions of coil or PPII helices [15, 18, 62][63].
Additional analysis of the PGR sequence was carried out using the CIDER (Classification of Intrinsically Disordered Ensemble Regions) server developed by the Pappu Lab [64]. CIDER calculates a variety of parameters, such as fraction of charged residues (FCR), net charge per residue (NCPR), and kappa [65] – a parameter describing charge segregation in the linear sequence. PGR can be classified as a weak polyampholyte (FCR < 0.3) with a low NCPR (−0.052). Based on the kappa value of 0.058, PGR lies in the transition region of structures taking on a “self-avoiding random walk” set of conformations and a molten globule-like set of conformations [65]. The relationship between the fraction of positively or negatively charged residues defines PGR as a “Janus sequence,” which may be collapsed or expanded depending on the context (Fig. S1c). In the case of PGR, the frequency and distribution of proline residues may bias its conformation toward an extended state, rather than a molten globule-like state.
PGR contains polyproline type II helix content
We used circular dichroism (CD) spectroscopy to assess the presence of secondary structure in PGR. The far-UV spectrum at 25° C showed a strong negative minimum near 200 nm and a weak local maximum near 220 nm (Fig. 3a; see royal blue line). A minimum in the range of 195-205 nm is typical for collagen [66], denatured proteins [67, 68], and IDPs [44-46], and the positive peak near 220-228 nm is considered to be diagnostic for the polyproline type II (PPII) conformation [66], a highly extended left-handed helix with three-fold rotational symmetry [69]. Both PPII and random coil secondary structures show a minimum near 200 nm in their far-UV CD spectra, but this peak is notably less pronounced for random coil than for PPII. The far-UV spectrum of PGR changed as a function of temperature (ranging from 5° C in magenta to 95° C in red in Figure 3a). As temperature was increased, the minimum near 200 nm became less negative and the band at 222 nm became more negative. This suggests an increase in random coil as temperature increases, while lower temperatures resulted in a more negative minimum corresponding to the stabilization of PPII, as previously described [70]. A difference plot of the spectra between 210-240 nm as a function of temperature more clearly illustrates the decrease in PPII as temperature increases, based on the positive difference peak centered at 222 nm (Fig. 3b). These far-UV CD data are consistent with a non-cooperative transition between conformational states containing PPII at low temperatures and random coil (‘denatured PPII’) at high temperatures [44]. This is supported by the linearity of the temperature dependence of the CD signal at 200 nm (Fig. 3a-inset) or 222 nm (Fig. 3b-inset), demonstrating non-cooperative thermal denaturation.
Figure 3. PGR contains polyproline type II helix.

Panel (a) shows the CD spectra of PGR from 5° C in magenta to 95° C in red, collected in 10° C increments. These spectra resemble those from PPII-containing peptides, showing PPII transitioning to random coil at increasing temperatures. The mean residue ellipticity, [θ] (degrees cm2 dmol−1 residue−1), in thousands is plotted against wavelength. The inset shows the temperature dependence of the minimum at 200 nm. In panel (b), a difference plot of the spectrum at each temperature subtracted from the 95° C spectrum is displayed. The inset shows the temperature dependence of the local maximum at 222 nm, associated with PPII content.
Hydrodynamic behavior as a function of temperature
While CD provided information regarding temperature effects on the local backbone structure of PGR, AUC was performed at multiple temperatures to examine thermal effects on the global conformation of PGR. IDPs often show a decrease in hydrodynamic radius with increasing temperature, which has been described with temperature-dependent solvation effects on structure [71], a collapse of the extended PPII conformation to more compact random coil configurations [51, 52, 72], and a stronger hydrophobic effect at elevated temperatures [55]. We conducted AUC sedimentation velocity experiments at 4°, 20°, and 37° C (the temperature extremes allowed for by the instrumentation). After converting the data to the standardized sedimentation coefficient (s20,w) to account for differences in viscosity and density at these temperatures, there was little difference between the sedimentation coefficients or the frictional ratios (Fig. 4a, Table S2). To verify the monodispersity of PGR in these sedimentation velocity experiments, we used the c(s,f/f0) analysis method to determine 2-dimensional size-and-shape distributions of PGR in terms of sedimentation coefficient and frictional ratio (Fig. 4b) [73]. This is useful in distinguishing two separate species with similar sedimentation coefficients [74]. These 2D distributions confirmed that PGR sedimented as a single monomeric species with no evidence of higher-order oligomers. Taken together, these AUC data show that the overall hydrodynamic behavior of PGR does not appreciably change with temperature, indicating that PGR does not undergo a significant collapse with increased formation of random coil.
Figure 4. PGR shows weak temperature dependence of Rh.

Panel (a) shows the calculated c(s) distributions of PGR, with little change in the sedimentation coefficient at 25 μM between 4° C (purple line), 20° C (green), and 37° C (red). Panel (b) shows the c(s,f/f0) 2D size-and-shape distribution of PGR at 4° C (left), 20° C (middle), and 37° C (right) at 25 μM, indicative of a single species in each case. Note that the sedimentation coefficients in this panel are apparent (s*) values, which converge to 1.0-1.1 upon correcting for temperature effects on buffer viscosity and density. Panel (c) displays the DLS-measured Rh for PGR in blue circles. Measurements were taken at 10° C increments between 5° C and 45° C. Error bars show ± standard deviation for DLS measurements. The open square marks the SEC-measured Rh (37.06 Å at 22° C). The red triangle along the y-axis (Rh) shows the predicted Rh of 38.50 Å from the power-law scaling relationship. The black triangles show molar residue ellipticity at 222 nm at each temperature, corresponding to PPII content. The CD data suggests a small temperature-dependent decrease of PPII content, but this does not translate to the Rh as much as would be expected based on previous observations in the literature [51, 52]. As an example, the temperature dependence of the Rh of p53(1-93) is shown in gray circles, which also mirrored its own molar residue ellipticity at 221 nm, the local PPII maximum observed for p53 (re-plotted from [51]). The linear fits of the DLS data for PGR and p53(1-93) are shown as solid lines. The slope (m) of the line for the PGR fit (m = −0.015) is less steep than that of the fit for p53(1-93) (m = −0.076), indicating a weaker temperature dependence of Rh compared to p53(1-93).
Dynamic light scattering (DLS) provides information on particle size and diffusion coefficients by measuring time-dependent scattering fluctuations due to the particles’ Brownian motion [75]. An advantage of using DLS techniques, when compared to SEC-based methods for measuring particle size, is that data can be measured over a broad temperature range. We measured the Rh of PGR using DLS from 5° C to 45° C and observed very little change in the Rh, similar to the AUC results (Fig. 4c, Table S2). The values range from 38.9 Å to 37.8 Å and are in good agreement with the SEC-measured Rh of 37.06 Å (Fig. 4c; see green square). Although we saw a temperature-dependent decrease in PPII content (based on mean residue ellipticity at 222 nm) for PGR, the slope is shallow and the CD data points are within the error bars of the DLS data. In the case of p53(1-93), a well-known IDP, Langridge and colleagues co-plotted Rh values by DLS with PPII signal at 221 nm via CD (at the same scale as shown for PGR), revealing a strongly correlated linear decrease in both Rh and PPII content as a function of temperature between 5° and 75° C [51]. Interestingly, the change in Rh observed for p53(1-93) between 5-45° C was 3.66 Å, compared to only 0.84 Å change in PGR (Fig. 4c, gray circles). The difference in CD signal at 221 nm over the same temperature range for p53(1-93) was ~2,000 MRE, compared to ~1,000 MRE for PGR. These data suggest the Rh of PGR decreases with elevated temperatures but to a lesser degree than observed for p53(1-93). These results suggest the temperature-dependent local transitions from PPII to random coil observed by CD do not correspond to large changes in the global conformations of PGR as observed by AUC or DLS.
Effects of cosolvents on PGR conformation
A number of osmolytes and other cosolvents can provide insight into the configurational space of polypeptides. By a combination of excluded volume effects and preferential interactions of cosolvent with backbone or sidechain groups, these molecules can chemically denature folded proteins or stabilize particular types of secondary structure. Likewise, cosolvents can favor formation of PPII conformations or even induce folding of thermodynamically denatured proteins and IDPs. Thus, response of PGR to urea, guanidine hydrochloride (GdnHCl), trimethylamine N-oxide (TMAO), and 2,2,2-trifluoroethanol (TFE) was measured by far-UV CD spectroscopy at 4°, 25°, and 37° C (Fig. 5).
Figure 5. The local conformation of PGR shows resilience against chemical perturbants.

(a) CD spectra showing PGR PPII induction at 0 M, 2 M, 4 M, 6 M urea (dark fill to light fill; 0 M and 2 M spectra overlay at 37° C). (b) CD spectra of PGR in 0 M, 2 M, 4 M, 6 M GdnHCl (dark fill to light fill; 0 M and 2 M spectra overlay, while 4 M and 6 M overlay at 4° C) showing a weaker induction of PPII than with urea. (c) CD spectra of PGR in 0 M (dark fill) or 3 M (light fill) TMAO, with no changes, indicating high resilience toward this osmolyte. D, CD spectra of PGR in 0%, 15%, 45%, or 75% TFE (dark fill to light fill; 0% and 15% TFE spectra overlay) at 4° C (purple circles), 20° C (green squares), or 37° C (red triangles). Unexpectedly, no significant changes in the spectra from 0-15% TFE were observed. Urea, GdnHCl, and TMAO data are shown only from 210-240 nm due to high noise levels below 208 nm.
Urea is a denaturing osmolyte; it favors unfolded and extended protein conformations through a combination of preferential interactions with the protein backbone and side chains [76-81]. Urea may also exert an indirect effect on protein stability via alterations in the water network surrounding the protein [82]. Guanidine hydrochloride (GdnHCl) is another chemical denaturant that favors extended, unfolded protein conformations, by preferentially interacting with the protein side chains and backbone [79, 83-86]. In general, GdnHCl is 2- to 4-fold more efficient at denaturation than urea, although this is dependent on the target protein’s sequence. Comparison of their ability to block hydrogen exchange revealed that unlike urea, GdnHCl does not form H-bonds with the polypeptide but instead stacks against planar groups in the backbone and side chains such as Asn or aromatic residues [86]. Both urea and GdnHCl favor formation of the highly extended PPII conformation in IDPs and denatured globular proteins, monitored by the far-UV CD signal near 220 nm [44, 68, 87, 88]. PGR shows an increase in PPII content at high concentrations of urea (Fig. 5a) and GdnHCl (Fig. 5b), particularly at low temperatures where PPII is more stable. At higher temperatures, urea and GdnHCl are less effective at inducing PPII structure, similar to previous observations with p53(1-93) [44]. Interestingly, we observe that urea is more efficient than GdnHCl at increasing PPII content of PGR, which is opposite to the typical trends for denaturation of globular proteins. This may be due to the lack of any Asn or aromatic sidechains in the PGR sequence, limiting the number of planar groups onto which GdnHCl can stack [86].
TMAO is an osmolyte naturally found in many marine organisms that helps protect proteins from denaturing environmental stressors often experienced by the cells of these organisms [89, 90]. It has been shown that TMAO has an opposing effect to that of urea on IDPs [44], and induces a native-like, compact conformation [90] in globular proteins. Similar to urea, the effect of TMAO is an additive effect of contributions from backbone-solute interactions and the sidechain-solute interactions. While the unfavorable backbone contributions drive this osmolyte’s ability to fold proteins, sidechain contributions are in opposition, having favorable free energy transfers into TMAO from water [78]. In general, high concentrations of TMAO destabilize the unfolded state relative to the native state [91]. In IDPs, TMAO tends to reduce PPII content and can even induce tertiary structure from thermodynamically denatured globular proteins [90, 92, 93]. Surprisingly, addition of TMAO up to 3 M final concentration had no effect on the far-UV spectrum of PGR near 220 nm (Fig. 5c). Although this is not a typical response, other IDPs have been reported that show essentially no change in their far-UV spectra with increasing TMAO, including myelin basic protein (MyBP) [94] and starmaker-like protein (Stm-1) involved in biomineralization of otoliths [95]. Like PGR, each of these proteins is highly charged (28-47% of the residues are charged), although MyBP and Stm-1 have only 3-6% proline content compared to 29% for PGR. Interestingly, favorable sidechain-TMAO interactions that counterbalance the backbone-solute effects are most significant among charged residues, compared to polar or apolar side chains [78], offering an explanation for why PGR, MyBP, and Stm-1 may be relatively unaffected by TMAO.
TFE is an organic cosolvent that is preferentially excluded from the polypeptide backbone but interacts weakly with nonpolar sidechains, which strongly favors formation of α-helix, a form of secondary structure with maximal intramolecular backbone H-bonding and exposed sidechains. In fact, TFE can induce formation of α-helix even in proteins that are unlikely to form such structures in vivo [96-99]. For many IDPs, addition of 15% TFE is sufficient to induce significant spectral changes, with some IDPs already showing complete transition to α-helix from a PPII or random coil native state [87, 100-104]. In contrast, 15% TFE had no effect on PGR (Fig. 5d), while higher concentrations of 45 or 75% TFE led to significant weakening of the minimum near 200 nm and slight loss of PPII signal near 220 nm. However, none of the TFE conditions induced detectable formation of α-helix with the characteristic double minima at 208 and 222 nm. Rather, addition of high concentrations of TFE shifts PGR toward random coil, as seen for increased temperature. The conformation of PGR at 75% TFE appears comparable to the protein incubated at 75° C (Fig. 3a). Thus, PGR is quite resilient to the addition of either TMAO or TFE, and it has no propensity to form α-helix, even at very high TFE concentrations. Given that the consensus PGR sequence repeat (AEPGKP) contains a proline in every third position, it is not surprising that α-helical conformations are inaccessible, given the well-known role of proline as a ‘helix-breaker’.
Electrostatic interactions do not affect local or global PGR conformations
PGR contains a high percentage of charged residues, with alternating charge at every third position in the consensus AEPGKP repeats. It is plausible that these residues could form salt bridges to stabilize the PPII helix. Indeed, Whittington and Creamer [105] showed using Monte Carlo computer simulations that the orientation and spacing of the i → i + 3 lysine and glutamate sidechains are such that a salt bridge could form. However, based on their CD measurements of a PPPKPAEPPPGY peptide, there was no significant difference between the spectra at pH 7 and those collected at either pH 2 or 12, where glutamate or lysine respectively are uncharged. This led to the conclusion that salt bridges do not stabilize PPII helices [105]. Tomasso et al. [42] have modeled the impact of coulombic interactions on the radius of hydration (Rh). They reported modest effects on Rh due to charge-charge interactions, with the PPII propensity being the major factor on Rh. When coulombic interactions did produce notable deviations in Rh, it was in cases of similarly-charged residues or charged clusters with little separation.
We observed no difference between the CD spectra of PGR in the presence of 30 mM or 1 M NaF, where electrostatic interactions should be completely screened [106], at any temperature tested (Fig. 6a). Similarly, the PGR spectra were superimposable at pH values of 7.4 and 12 at all temperatures tested, and were nearly identical at pH 2 (Fig. 6b). These data confirm that salt bridges between the i → i + 3 charged residues in PGR do not appear to stabilize the PPII conformation. The effect of electrostatics on the global conformation of PGR in solution was also analyzed using AUC. Sedimentation velocity experiments were performed on PGR with varying NaCl concentrations. Between 30 mM and 300 mM NaCl, the s20,w remained near 1.0, with a frictional ratio of 2.0-2.1 (Fig. 6c, Table S3). At 1 M NaCl, there was only a slight decrease in the s20,w value and a very slight increase in the frictional ratio at 20° C and 37° C, indicating that fully screening electrostatic interactions caused very little change in the global conformation of PGR in solution.
Figure 6. Coulombic effects do not play a role in local or global conformations.

The CD spectra in (a) show no differences in 30 mM, 100 mM, 300 mM, or 1 M NaF (dark fill to light fill) at 4° C (purple circles), 20° C (green squares), or 37° C (red triangles). In (b), the CD spectra of PGR at pH 2 (light fill) has a slightly less negative minimum near 200nm at all temperatures, but spectra at pH 7.4 (medium fill), or pH 12 (dark fill) show no differences. Together, (a) and (b) indicate that charge interactions do not affect the local PPII content. Panel (c) shows c(s) distributions from sedimentation velocity AUC experiments at 30 mM, 100 mM, 300 mM, or 1 M (solid, short dashed, long dashed, and dotted lines) NaCl at 4° C (purple lines), 20° C (green), or 37° C (red), revealing only a slight change in the s20,w at 20° C and 37° C at 1 M NaCl. These data demonstrate that coulombic effects have little influence on the global conformations available to PGR. (d), c(s) distributions from sedimentation velocity AUC experiments on apo-PGR (black line), or PGR in the presence of 2 mM CaCl2 (purple), 2 mM MgCl2 (green), or 2 mM ZnCl2 (red) at 20° C, showing no change in global conformation due to interactions with divalent cations.
We also considered whether PGR could interact with divalent metal ions. There have been numerous reports of disordered proteins undergoing a conformational transition upon binding of a metal ligand [37, 55, 107, 108]. Due to the numerous charged residues in the sequence of PGR, as well as the well-defined role of Zn2+ in the function of the Aap B-repeat superdomain [15, 18], we were interested in testing biologically relevant, divalent metal ions as potential ligands. Furthermore, Zn2+ has been shown to increase the rigidity of the S. aureus cell wall and plays a role in the extension of the Aap ortholog SasG away from the cell wall [109]. We performed sedimentation velocity AUC experiments in the presence of CaCl2, MgCl2, and ZnCl2. When 2 mM of each divalent cation was added to PGR in 20 mM HEPES pH 7.4, 150 mM NaCl, there was no significant change in the sedimentation coefficient or frictional ratio of PGR (Fig. 6d).
Predicting PPII propensity and Rh from PGR primary sequence
Our data make it clear that PGR is a highly extended IDP in solution that is rather resistant to conformational transitions. The primary sequence of PGR is comprised of a high percentage of proline residues (29.6%), glycine residues (14.8%), and charged residues (26.5%), with a net charge of −7. The inclusion of a proline at every 3rd position throughout the first 19 hextad repeats clearly contributes a strong propensity toward PPII conformations and places significant constraints on the conformational states available to PGR. In addition to the high proline content, PGR is rich in disorder-promoting residues such Glu and Lys; these residues are highly represented in experimentally proven intrinsically disordered proteins [110]. Previously, it was shown that a simple power-law scaling relationship relates the Rh of IDPs to N, the number of residues, and fPPII, the fractional number of residues in the PPII conformation as estimated from intrinsic PPII propensities [42, 51] (Eq. 7). Tomasso et al. compared experimental PPII propensity scales and found that the Hilser scale [111] or a composite scale combining Hilser, Kallenbach [112], and Creamer [113] PPII propensity scales could accurately predict experimental Rh values for a large dataset of IDPs ranging from 73 to 260 residues in length and varying in sequence composition and net charge (from 1 to 43) [42]. Another variation on the power-law scaling relationship was proposed by Marsh and Forman-Kay, which takes into account the fraction of proline residues and the absolute net charge [53]. The Marsh and Forman-Kay relationship (Eq. 9) predicts an Rh value of 38.78 Å, while applying the Tomasso et al. relationship (Eq. 7) to the PGR sequence predicts an Rh value of 38.50 Å, which are both remarkably close to the experimentally determined values from SEC: 37.06 ± 1.1 Å (at 22° C), and DLS: 38.39 ± 0.9 Å (at 25° C). The hydrodynamic size of PGR measured experimentally thus provides additional support for the simulation-derived relationship between Rh, N and fPPII. An interesting aspect of the Tomasso et al. approach to Rh prediction for PGR is that fPPII, the fractional number of residues in the PPII conformation based on the Hilser propensity scale, was 0.5350. This was a higher value of fPPII than observed for any of the IDPs in the test set from the previous study [42]. Indeed, PGR was the only IDP among all proteins in the test set with a PPII fraction greater than 0.5 (Table S4).
Discussion
Many bacterial cell wall-anchored (CWA) proteins feature regions defined as ‘low complexity’, although they vary greatly in size and amino acid content [21-26]. In addition to Aap and its ortholog SasG, examples include the proline-rich region of the streptococcal β protein [21], M6 protein of Group A Streptococcus [22], β antigen of the Ibc protein complex [23], as well as the serine-aspartate repeat proteins found in many staphylococci [24] and fibronectin-binding protein of S. aureus [25]. In many cases, these regions are found just upstream of the LPXTG Sortase A anchoring motif. The proline/glycine-rich region (PGR) of Aap is 135 residues in length and composed primarily of AEPGKP repeats. The S. aureus ortholog SasG has a proline-rich region quite different from the Aap PGR, spanning roughly half the number of residues and lacking the hextad repeats of Aap-PGR. Nonetheless, the proline-rich region of SasG is predicted to have a high fraction of PPII content (0.4711), surpassed only by Aap-PGR (0.5350) and p53(1-93) (0.4890) in the Tomasso et al. database [42] based on the Hilser propensity scale [111]. Thus, the proline-rich region of SasG is anticipated to function as a stalk similar to the Aap PGR. However, the SasG proline-rich region has a relatively higher fraction of charged residues (0.362 compared to 0.259 for Aap-PGR), categorizing it as a strong polyampholyte that could potentially sample coil-like or hairpin-like conformations according to the Das-Pappu phase plot [65]. The serine-aspartate repeat (Sdr) proteins found in S. epidermidis and S. aureus can contain as many as 558 SD repeats leading up to their LPXTG motif [24]. Proline-rich regions less than 30 residues in length are commonly found among other gram positive bacteria adjacent to the sortase A motif [26], though their role is not yet clear. In many cases, these proline-rich regions appear to function as stalks that act to project adhesive protein domains away from the cell wall. These can include rigid, highly structured stalks as observed for the streptococcal adhesion antigen I/II, which features an elongated α-helix intertwined with a long PPII helix [114]. In many other CWA proteins, proline-rich regions appear to form semi-flexible stalks [115] that may act as entropic chains. For example, Linke et al. solved a crystal structure of FctB, a minor pilin from Group A streptococci and observed a short PPII helix formed by the C-terminal PXPPXXPXXPXXPXXP tail that extends outward from the Ig-like pilin domain [26]. Aap PGR, with its series of AEPGKP repeats, appears to fall in the latter category. The PGR provides an interesting system both in terms of its role in mediating biofilm-related infections and as a protein sequence with an unusually high propensity for PPII structure.
We have demonstrated using a variety of biophysical techniques that the PGR of Aap is an extended, intrinsically disordered polypeptide. Sedimentation velocity AUC revealed a highly elongated monomeric species that was shown to have substantial PPII helix content by far-UV CD. In close agreement with the power-law scaling equation which relates the amino acid sequence of an IDP to its Rh based on PPII propensity [42, 111], the Rh of PGR was measured to be 37.06 Å by SEC. The power-law relationship shows that the large Rh is primarily the result of an fPPII value greater than 0.5, which was a higher fractional PPII content than for any IDP in the test dataset. Another unusual feature of PGR was that both AUC and DLS data indicated only small changes in the s20,w or Rh values, respectively, of PGR with increasing temperature. Typically, the Rh of an IDP decreases as temperature increases, due to destabilization of PPII and conformational collapse [51, 70]. Likewise, neither the osmolyte TMAO (up to 3 M) nor the cosolvent TFE (up to 15%) had any effect on the PPII content as judged by far-UV CD. Very high concentrations of TFE (45 to 75%) reduced PPII content and increased random coil in a manner similar to high temperature, but did not induce α-helix formation. Thus, our data show that PGR is unusually resilient to conformational fluctuations or compaction and maintains a generally elongated configuration even at elevated temperatures.
We propose that the basis for these phenomena is implicit in the repeat sequence of PGR and depends on the local propensity of individual PGR residues to sample the PPII conformation and the cis/trans isomerization state of the prolines in this region. The far-UV CD spectra of PGR as a function of temperature (Fig. 3a) recapitulate the well-known behavior seen for the transition of polymers of proline, hydroxyproline, and other proline derivatives from PPII to PPI conformations (e.g., shifting from trans → cis proline isomers) [116]. Furthermore, Cammers-Goodwin et al. demonstrated that TFE increased the rate of cis/trans proline interconversion [117], which could explain why CD spectra for PGR at high (45-75%) TFE concentrations (Fig. 5d) mimic the spectra for PGR at elevated temperature (Fig. 3a). Finally, highly acidic conditions are also known to shift proline residues from trans to cis isomers [118], and our pH 2.0 data for PGR showed a similar loss of PPII content, albeit to a much smaller degree (Fig. 6b).
Within the consensus hextad repeat (AEPGKP), all residues except glycine have high PPII propensity on the Hilser scale [111] used for the power-law scaling relationship [42]. Two residues per hextad are prolines, with the highest PPII propensity (1.00), followed by lysine (0.56) and glutamate (0.42), which have the 2nd and 4th-highest PPII propensity values. Even alanine has a greater value (0.37) than average (0.35 over all 20 amino acids). In contrast, glycine has the lowest PPII propensity of all (0.13). Thus, a repeating pattern occurs with five PPII-prone residues separated by glycine (e.g., KPAEPG-KPAEPG). Taken together, our data suggest a model for PGR in which the majority of residues can transition independently between local random coil and PPII conformations, but with a bias toward PPII. We propose that the primary determinant of compaction is the extent of trans to cis isomerization of the proline residues. Overall, PGR contains 40 prolines, and on average 5-10% of prolines in IDPs are found in the cis isomer [110]. Thus, in the resting state (e.g., standard buffer at 25° C), we can anticipate that two to four of the prolines in PGR would be found in the cis isomer at any given time. Increasing temperature, high TFE concentrations, or very low pH will increase the net number of cis-Pro isomers, resulting in compaction of PGR, although minimal, under these conditions. An interesting aspect of PGR is the demonstration that even under conditions of reduced PPII content (e.g., at high temperature), the chain remains relatively elongated in solution. Similar sequences may prove to be useful tools for engineering biomaterials.
These data support the hypothesis of PGR functioning as an extended stalk, pushing Aap out and away from the bacterial cell wall. It is likely that the PGR accomplishes several important functions by acting as an entropic chain. First, by extending away from the cell wall, PGR prevents steric hindrance during self-assembly of the B-repeat region. We have previously shown that the C-terminal G5 domain ‘half-repeat’ in the B-repeat region takes part in formation of an anti-parallel B-repeat dimer in the presence of Zn2+ [15, 18]. The engagement of an Aap B-repeat region from an opposing cell with this C-terminal G5 domain (which terminates immediately before the beginning of the PGR: see the EYGPT sequence in Figure 1) would be occluded by other CWA proteins if not for the PGR elevating the C-terminal G5 above the cell surface. In future work it will be of interest to genetically engineer S. epidermidis to express an Aap variant lacking the PGR to validate its biological function, and to further investigate similar low-complexity regions in other bacterial CWA proteins. Given the significant health burden caused by recurrent, hard-to-treat biofilm-related infections, a clearer understanding of the structural and functional characteristics of such intrinsically disordered regions in Aap, SasG, and other key CWA proteins will be important.
Materials and methods
Cloning
The PGR gene was synthesized by LifeTechnologies GeneArt® composed of amino acids 2225-2359 from S. epidermidis RP62A (UniProt accession no. Q9L470) and subcloned into the pENTR221 vector for use in the Gateway cloning system (Invitrogen). The gene was then transferred into a destination vector by LR clonase (Invitrogen) reaction. The destination vector pHisMBP-DEST was kindly provided by Dr. Artem Evdokimov and contained an N-terminal maltose binding protein (MBP) and hexahistidine tag which are cleavable by Tobacco Etch Virus (TEV) protease.
Protein Expression
BLR(DE3) Escherichia coli were transformed with pDEST-His-MBP-PGR plasmid. Cultures were grown to an OD600 near 1.0 before cooling to 10° C in an ice bath. Ethanol was added to 2% (v/v) and isopropyl β-D-1-thiogalactopyranoside (IPTG) to 200 μM, then cultures were incubated at 20° C for 14-16 hours at 200 rpm [119]. The cultures were centrifuged to pellet the bacteria, which were then resuspended in 20 mM Tris pH 7.4, 300 mM NaCl and frozen at −20° C.
Protein Purification and Storage
Frozen cells were thawed and lysed by sonication. His-tagged protein was isolated using a 5 mL Ni2+-charged HiTrap HP cartridge column (GE Healthcare) attached to an ÄktaPure M chromatography system. The column was washed with 20 mM Tris pH 7.4, 500 mM NaCl, 5 mM imidazole and eluted with a linear gradient from 0 to 1 M imidazole. The eluted protein was pooled and dialyzed into 20 mM Tris pH 7.4 and 150 mM NaCl before being cleaved for 6-16 hours by His-tagged TEV protease. The mixture was run over a Ni2+-charged HiTrap column to trap the cleaved His-tagged MBP and His-tagged TEV protease. The flow-through contained nearly pure PGR, which was dialyzed into 20 mM potassium phosphate pH 7.4 and 50 mM NaCl and purified by anion exchange (GE Healthcare) to remove any remaining contaminants. Purity was evaluated by size exclusion chromatography (Superdex 75 prep grade – GE Healthcare) and silver-stained SDS-PAGE gels. Purified PGR was filtered using a 0.22 μm syringe filter unit with PES membrane (EMD Millipore), which helped prevent degradation. After purification, PGR was stored at −80° C to prevent degradation. CD and AUC experiments before and after freeze/thaw cycles showed there were no adverse effects on protein structure or stability (data not shown).
SDS-PAGE and Silver Staining
SDS-PAGE was conducted using 4-20% Mini-PROTEAN® TGX™ Precast Protein Gels (BIO-RAD) at 175 V for 40 min at 25° C with running buffer containing 25 mM Tris, 250 mM Glycine, and 0.1% SDS (pH 10) running buffer. The samples were run under non-reduced conditions in Laemmli sample buffer containing 65.8 mM Tris-HCl, pH 6.8, 26.3% (w/v) glycerol, 2.1% SDS, and 0.01% bromophenol blue (BIO-RAD). Samples containing sample buffer were heated at 95° C for 5 min before loading. Staining was performed using the Pierce™ Silver Stain Kit (Thermo Scientific™).
Mass Spectrometry
Electrospray ionization mass spectrometry (ESI-MS) was performed on a sample of purified PGR in a 50:50 solution of H2O:acetonitrile with 0.1% formic acid. Prior to mass analysis, PGR was dialyzed against water and then diluted into the H2O:acetonitrile solution to a final concentration of 10 μM. For molecular weight measurement, mass spectra were collected using a Waters Synapt G2 ESI-Q-TOF Mass Spectrometer and analyzed with MassLynx. The ESI-MS experiments were performed with the following conditions: ESI capillary voltage, 3.5 kV; sample cone voltage, 35 V; extraction cone voltage, 3.5 V; source temperature 150° C; desolvation temperature, 180° C; cone gas flow, 10 L/h; desolvation gas flow, 700 L/h (N2).
Analytical Ultracentrifugation
Sedimentation velocity experiments were performed using an XL-I analytical ultracentrifuge (Beckman Coulter) with absorbance optics at speeds of 45,000 or 48,000 rpm at 4, 20, or 37° C in An-60 Ti or An-50 Ti rotors. Two-sector epon-charcoal centerpieces were used with sapphire or quartz windows. Cells were scanned at a wavelength between 230-250 nm, depending on the sample concentration. PGR concentration was 25 μM (0.33 mg/ml) for experiments where concentration is not explicitly stated. Experiments were run for about 20 hours or until sedimentation progress slowed due to back-diffusion. Data were analyzed using the c(s) model in Sedfit [120] (sedfitsedphat.nibib.nih.gov), with 100-150 total scans loaded. Buffer densities and viscosities at 20° C were calculated using Sednterp [121] (sednterp.unh.edu). The density and viscosity of buffers at temperatures other than 20° C were calculated using Eq. 1, where η is the viscosity of the buffer b, or water w, at 20° C or temperature T. Eq. 2 shows the equivalent formula for density, ρ. The viscosity and density of water at 4, 20, and 37° C were obtained from the NIST Chemistry WebBook [122].
| (1) |
| (2) |
The partial specific volume of PGR was calculated to be 0.71703 based on amino acid sequence using Sednterp. GUSSI [123] was used to produce a sedimentation velocity data-fit-residual plot (Fig. 1d), as well as the c(s) distribution in Figure 1e. All other AUC data displayed were plotted in Sigmaplot (systatsoftware.com). Apparent sedimentation coefficients (s*) were converted to s20,w (the sedimentation coefficient at standard conditions of 20° C in water) in Sedfit based on Eq. 3, [124]
| (3) |
where is the partial specific volume of water (w) or buffer (b) at 20° C or the experimental temperature, T, while ρ and η are the solution density and viscosity respectively. The s020, w value was calculated from linear extrapolation of s20,w values from a concentration series to infinite dilution.
The c(s,f/f0) size-and-shape distributions were also determined using Sedfit [73]. A total of 100-150 scans were loaded. The sedimentation coefficient values spanned a range of 1.25 S along the uncorrected sedimentation coefficient (s*) axis with a resolution of 20 or 25, while the f/f0 axis ranged from 1-4 with a resolution of 10. The radial resolution was set to 0.003 to decrease processing time. The distributions were plotted in MATLAB (MathWorks.com).
Predictions of Disorder
The PONDR (Predictor of Natural Disordered Regions) (www.pondr.com) server was utilized for determining the absolute mean net charge and mean scaled hydropathy values for PGR in the Uversky Plot, as well as performing the VLXT prediction. The RONN v3.2 predictor was accessed at (www.strubi.ox.ac.uk/RONN). IUPred (iupred.enzim.hu) was used with the long disorder prediction type selected. FoldIndex was accessed at (http://bip.weizmann.ac.il/fldbin/findex) and the sequence was submitted with a window size of 10 and step size of 1. Additional disorder prediction programs were assessed through the Database of Disordered Protein Predictions (www.d2p2.pro) [56]. CIDER was accessed at pappulab.wustl.edu/CIDER/ which calculates parameters such as kappa (a description of charged residue mixing [65]), fraction of charged residues (FCR), net charge per residue (NCPR), hydropathy, and the fraction of disorder promoting residues. It should be noted that CIDER does not predict if a sequence will be disordered; the service was utilized in this work to provide parameters for classification of PGR and for investigating conformations expected to be sampled by PGR.
Circular Dichroism Spectroscopy
All CD experiments utilized an Aviv 215 circular dichroism spectrophotometer with an Aviv peltier junction temperature control system to measure far-UV spectra at temperatures between 5° C and 95° C. Samples were loaded into a 0.5 mm quartz cuvette (Hellma Analytics). Wavelength scans were taken in 0.5 nm steps with a 10 s averaging time and 0.333 s settling time. For the 5° C − 95° C temperature experiments, nine wavelength scans at each temperature were averaged together from three separate protein samples, each with three scans. All other CD spectra were the average of three wavelength scans from one protein sample. PGR in 20 mM potassium phosphate pH 7.4 and 50 mM NaF was measured at 50 μM (0.66 mg/ml). The urea used was 8 M ultra-pure grade solution (Amresco), and guanidine HCl was 8.0 M high purity solution (Pierce). Machine units in millidegrees, θ, were converted to the mean residue ellipticity, [θ], using Eq. 4:
| (4) |
where MRW is the molecular weight of PGR divided by the number of residues. l is the path length in cm, and c is the concentration in mg/ml. The MRW value for PGR is 97.03 g mol−1 residue−1. The mean residue ellipticity, [θ], has the units of degrees cm2 dmol−1 residue−1.
Dynamic Light Scattering
A Malvern Zen 3600 Zetasizer Nano was used to measure the size of 1-1.5 mg/ml PGR in 20 mM potassium phosphate pH 7.4, 150 mM NaCl at different temperatures. Samples were filtered using a 0.2 μm-pore size PVDF syringe-driven filter (EMD Millipore) immediately prior to use. The diffusion coefficient was measured using 600 μL samples in teflon-capped quartz micro-cuvettes that were allowed to equilibrate at the set temperature for 15 minutes. The number of runs per measurement was set to automatic. Measurements were made at 5° C first, the sample temperature was then increased in 10° C steps to 45° C, followed by cooling back to 5° C and repeating the cycle of measurements at different temperatures. The reported values represent the average and standard deviation from 5 measurements at each temperature.
The Stokes-Einstein equation (Eq. 5) was used to determine the apparent hydrodynamic radius (Rh) based on the measured diffusion coefficient, D,
| (5) |
where k is the Boltzmann constant, T is the temperature in Kelvin, and η is the viscosity of the solvent. Solvent viscosity was estimated using the solvent builder software from Malvern based on Sednterp [121].
Size Exclusion Chromatography
Sephadex G-100 (GE Healthcare) was equilibrated in 10mM sodium phosphate pH 7.0, 100 mM NaCl. A Bio-Rad BioLogic LP System was used to monitor UV absorbance at 280 nm to determine elution volumes (Ve). 250 μL samples of PGR at concentrations of 3-4 mg/ml were required to see an elution peak at 280 nm, due to the lack of aromatic residues in PGR. To verify that this peak corresponded to PGR, a single tyrosine residue was added (PGR-Tyr) to the C-terminus and measured by SEC at 1 mg/ml. To determine the void (V0) and total column volume (Vt), 10 μL of 3 mg/ml blue dextran and 0.03 mg/ml 2,4-dinitrophenyl-L-aspartate were run through the column separately from the protein. The thermodynamic retention factor (KD) was calculated using Eq. 6:
| (6) |
To determine the hydrodynamic radius of PGR, Rh values based on crystal structures of globular protein standards were plotted against the experimentally determined KD values. The Rh of the crystal structures were estimated as one-half the maximal Cα-Cα distance. A linear regression was performed on these protein standards. The KD of the protein sample was inserted into the linear equation of best fit to determine the Rh. The same protocol was used to measure KD for repeat experiments using Sephadex G-75.
Rh Prediction
The previously described algorithm utilizes information regarding the PPII propensity to predict Rh of an IDP based on the amino acid sequence [42]. The input sequence was amino acid 2225-2359 of S. epidermidis Aap (UniProt accession no. Q9L470). To predict the hydrodynamic radius (Rh) of PGR based on intrinsic PPII propensities, a power-law scaling relationship (Eq. 7) was used which is based on the number of residues (N) and the fraction of polyproline type II helix in the peptide chain (fPPII,chain):
| (7) |
The chain propensity for PPII structure, fPPII,chain, is based on the experimental scale from Hilser [111] that utilized a peptide host-guest system in which the C. elegans Sem-5 SH3 domain binds a peptide in the PPII conformation. A non-interacting residue of the peptide was substituted for each amino acid before binding was measured by isothermal titration calorimetry. The value for fPPII,chain in Eq. 7 was determined by Eq. 8, where N is the number of residues and PPIIprop is the PPII propensity from the Hilser scale for each amino acid in the sequence from 1 to N:
| (8) |
Predicting Rh from Eq. 7 for PGR yields 38.50 Å, based on fPPII,chain found to be 0.5350 for the PGR sequence.
Marsh and Forman-Kay have also published an equation for predicting hydrodynamic radius [53], based upon the same power-law scaling relationship originally employed by Wilkens et al. to describe folded and chemically denatured proteins [125]. The Marsh and Forman-Kay equation is shown below:
| (9) |
This variation of the power-law scaling relationship includes the fraction of proline residues (Ppro) and absolute net charge (|Q|), as well as constants A-D. The Shis* term is 1 in the case of PGR, because no histidine tag is present. The constants R0 and v are 2.49 and 0.509, respectively.
Multiple Sequence Alignment
The Clustal Omega [126] web server (v1.2.1) was accessed at The European Bioinformatics Institute (www.ebi.ac.uk). Each sequence was obtained from the UniProt database [127] as a complete sequence for the accumulation-associated protein in Staphylococcus epidermidis. The UniProt accession number precedes each strain name in the alignment.
Supplementary Material
Figure 7. Model of Aap on the surface of S. epidermidis.

The gram-positive cell wall of S. epidermidis contains a peptidoglycan layer. Sortase A covalently links the LPXTG motif of Aap to Lipid II toward the outer side of the peptidoglycan layer. The P/G-rich region forms an extended stalk with high polyproline type II helix propensity and high resistance to compaction. This region pushes the B-repeat superdomain out and away from the cell surface where it can better interact with the B-repeat superdomain of adjacent S. epidermidis cells in the presence of Zn2+ ions and contribute to biofilm formation.
Highlights.
Intercellular adhesion in Staphylococcus epidermidis biofilms is mediated by Aap
Aap’s C-terminal proline/glycine-rich region (PGR) is intrinsically disordered
PGR forms an elongated monomer with high polyproline type II helix content
PGR is resistant to compaction by temperature or cosolvents such as TFE & TMAO
PGR functions as an elongated stalk, projecting Aap functional domains outward
Acknowledgements
This work was supported by funding from the National Institute of General Medical Sciences of the National Institutes of Health under R01-GM094363 (to A.B.H.) and R15-GM115603 (to S.T.W.) and by the Division of Materials Research of the National Science Foundation under award DMR-1205670 (to S.T.W.). The content is solely the responsibility of the authors and does not necessarily represent the official views of the National Institutes of Health and the National Science Foundation.
Abbreviations
- Aap
accumulation-associated protein
- PGR
proline/glycine-rich (region)
- IDP
intrinsically disordered protein
- PPII
polyproline type II (helix)
- TMAO
trimethylamine N-oxide
- TFE
2,2,2-trifluoroethanol
- PNAG
poly-N-acetylglucosamine
- MBP
maltose binding protein
- TEV
tobacco etch virus protease
- AUC
analytical ultracentrifugation
- Rh
radius of hydration
- SEC
size exclusion chromatography
- KD
thermodynamic retention factor
- BSA
bovine serum albumin
- Alb
chicken albumin
- CA
carbonic anhydrase
- Myo
horse myoglobin
- CD
circular dichroism
- DLS
dynamic light scattering
- GdnHCl
guanidine hydrochloride
- MyBP
myelin basic protein
- CWA
cell wall-anchored
- Sdr
serine-aspartate repeat
- SasG
Staphylococcus aureus surface protein G
- ESI-MS
electrospray ionization mass spectrometry
Footnotes
Publisher's Disclaimer: This is a PDF file of an unedited manuscript that has been accepted for publication. As a service to our customers we are providing this early version of the manuscript. The manuscript will undergo copyediting, typesetting, and review of the resulting proof before it is published in its final citable form. Please note that during the production process errors may be discovered which could affect the content, and all legal disclaimers that apply to the journal pertain.
References
- [1].Otto M. Staphylococcal biofilms. Curr. Top. Microbiol. Immunol. 2008;322:207–228. doi: 10.1007/978-3-540-75418-3_10. [DOI] [PMC free article] [PubMed] [Google Scholar]
- [2].Arber N, Pras E, Copperman Y, Schapiro JM, Meiner V, Lossos IS, et al. Pacemaker endocarditis Report of 44 cases and review of the literature. Medicine (Baltim.) 1994;73:299–305. doi: 10.1097/00005792-199411000-00003. [DOI] [PubMed] [Google Scholar]
- [3].McCann MT, Gilmore BF, Gorman SP. Staphylococcus epidermidis device-related infections: pathogenesis and clinical management. J. Pharm. Pharmacol. 2008;60:1551–1571. doi: 10.1211/jpp/60.12.0001. [DOI] [PubMed] [Google Scholar]
- [4].Otto M. Staphylococcus epidermidis--the 'accidental' pathogen. Nat. Rev. Microbiol. 2009;7:555–567. doi: 10.1038/nrmicro2182. [DOI] [PMC free article] [PubMed] [Google Scholar]
- [5].Fey PD, Olson ME. Current concepts in biofilm formation of Staphylococcus epidermidis. Future Microbiol. 2010;5:917–933. doi: 10.2217/fmb.10.56. [DOI] [PMC free article] [PubMed] [Google Scholar]
- [6].Costerton JW, Stewart PS, Greenberg EP. Bacterial biofilms: a common cause of persistent infections. Science. 1999;284:1318–1322. doi: 10.1126/science.284.5418.1318. [DOI] [PubMed] [Google Scholar]
- [7].Darouiche RO. Treatment of infections associated with surgical implants. N. Engl. J. Med. 2004;350:1422–1429. doi: 10.1056/NEJMra035415. [DOI] [PubMed] [Google Scholar]
- [8].Gerke C, Kraft A, Sussmuth R, Schweitzer O, Gotz F. Characterization of the N-acetylglucosaminyltransferase activity involved in the biosynthesis of the Staphylococcus epidermidis polysaccharide intercellular adhesin. J. Biol. Chem. 1998;273:18586–18593. doi: 10.1074/jbc.273.29.18586. [DOI] [PubMed] [Google Scholar]
- [9].Hussain M, Herrmann M, von Eiff C, Perdreau-Remington F, Peters G. A 140-kilodalton extracellular protein is essential for the accumulation of Staphylococcus epidermidis strains on surfaces. Infect. Immun. 1997;65:519–524. doi: 10.1128/iai.65.2.519-524.1997. [DOI] [PMC free article] [PubMed] [Google Scholar]
- [10].Rohde H, Burandt EC, Siemssen N, Frommelt L, Burdelski C, Wurster S, et al. Polysaccharide intercellular adhesin or protein factors in biofilm accumulation of Staphylococcus epidermidis and Staphylococcus aureus isolated from prosthetic hip and knee joint infections. Biomaterials. 2007;28:1711–1720. doi: 10.1016/j.biomaterials.2006.11.046. [DOI] [PubMed] [Google Scholar]
- [11].Schaeffer CR, Woods KM, Longo GM, Kiedrowski MR, Paharik AE, Buttner H, et al. Accumulation-associated protein enhances Staphylococcus epidermidis biofilm formation under dynamic conditions and is required for infection in a rat catheter model. Infect. Immun. 2015;83:214–226. doi: 10.1128/IAI.02177-14. [DOI] [PMC free article] [PubMed] [Google Scholar]
- [12].Banner MA, Cunniffe JG, Macintosh RL, Foster TJ, Rohde H, Mack D, et al. Localized tufts of fibrils on Staphylococcus epidermidis NCTC 11047 are comprised of the accumulation-associated protein. J. Bacteriol. 2007;189:2793–2804. doi: 10.1128/JB.00952-06. [DOI] [PMC free article] [PubMed] [Google Scholar]
- [13].Conlon BP, Geoghegan JA, Waters EM, McCarthy H, Rowe SE, Davies JR, et al. Role for the A domain of unprocessed accumulation-associated protein (Aap) in the attachment phase of the Staphylococcus epidermidis biofilm phenotype. J. Bacteriol. 2014;196:4268–4275. doi: 10.1128/JB.01946-14. [DOI] [PMC free article] [PubMed] [Google Scholar]
- [14].Rohde H, Burdelski C, Bartscht K, Hussain M, Buck F, Horstkotte MA, et al. Induction of Staphylococcus epidermidis biofilm formation via proteolytic processing of the accumulation-associated protein by staphylococcal and host proteases. Mol. Microbiol. 2005;55:1883–1895. doi: 10.1111/j.1365-2958.2005.04515.x. [DOI] [PubMed] [Google Scholar]
- [15].Conrady DG, Brescia CC, Horii K, Weiss AA, Hassett DJ, Herr AB. A zinc-dependent adhesion module is responsible for intercellular adhesion in staphylococcal biofilms. Proc. Natl. Acad. Sci. U. S. A. 2008;105:19456–19461. doi: 10.1073/pnas.0807717105. [DOI] [PMC free article] [PubMed] [Google Scholar]
- [16].Corrigan RM, Rigby D, Handley P, Foster TJ. The role of Staphylococcus aureus surface protein SasG in adherence and biofilm formation. Microbiology. 2007;153:2435–2446. doi: 10.1099/mic.0.2007/006676-0. [DOI] [PubMed] [Google Scholar]
- [17].Macintosh RL, Brittan JL, Bhattacharya R, Jenkinson HF, Derrick J, Upton M, et al. The terminal A domain of the fibrillar accumulation-associated protein (Aap) of Staphylococcus epidermidis mediates adhesion to human corneocytes. J. Bacteriol. 2009;191:7007–7016. doi: 10.1128/JB.00764-09. [DOI] [PMC free article] [PubMed] [Google Scholar]
- [18].Conrady DG, Wilson JJ, Herr AB. Structural basis for Zn2+-dependent intercellular adhesion in staphylococcal biofilms. Proc. Natl. Acad. Sci. U. S. A. 2013;110:E202–211. doi: 10.1073/pnas.1208134110. [DOI] [PMC free article] [PubMed] [Google Scholar]
- [19].Marraffini LA, Dedent AC, Schneewind O. Sortases and the art of anchoring proteins to the envelopes of gram-positive bacteria. Microbiol. Mol. Biol. Rev. 2006;70:192–221. doi: 10.1128/MMBR.70.1.192-221.2006. [DOI] [PMC free article] [PubMed] [Google Scholar]
- [20].Mazmanian SK, Skaar EP, Gaspar AH, Humayun M, Gornicki P, Jelenska J, et al. Passage of heme-iron across the envelope of Staphylococcus aureus. Science. 2003;299:906–909. doi: 10.1126/science.1081147. [DOI] [PubMed] [Google Scholar]
- [21].Areschoug T, Linse S, Stalhammar-Carlemalm M, Heden LO, Lindahl G. A proline-rich region with a highly periodic sequence in Streptococcal beta protein adopts the polyproline II structure and is exposed on the bacterial surface. J. Bacteriol. 2002;184:6376–6383. doi: 10.1128/JB.184.22.6376-6383.2002. [DOI] [PMC free article] [PubMed] [Google Scholar]
- [22].Hollingshead SK, Fischetti VA, Scott JR. Complete nucleotide sequence of type 6 M protein of the group A Streptococcus. Repetitive structure and membrane anchor. J. Biol. Chem. 1986;261:1677–1686. [PubMed] [Google Scholar]
- [23].Jerlstrom PG, Chhatwal GS, Timmis KN. The IgA-binding beta antigen of the c protein complex of Group B streptococci: sequence determination of its gene and detection of two binding regions. Mol. Microbiol. 1991;5:843–849. doi: 10.1111/j.1365-2958.1991.tb00757.x. [DOI] [PubMed] [Google Scholar]
- [24].McCrea KW, Hartford O, Davis S, Eidhin DN, Lina G, Speziale P, et al. The serine-aspartate repeat (Sdr) protein family in Staphylococcus epidermidis. Microbiology. 2000;146:1535–1546. doi: 10.1099/00221287-146-7-1535. [DOI] [PubMed] [Google Scholar]
- [25].Penkett CJ, Redfield C, Dodd I, Hubbard J, McBay DL, Mossakowska DE, et al. NMR analysis of main-chain conformational preferences in an unfolded fibronectin-binding protein. J. Mol. Biol. 1997;274:152–159. doi: 10.1006/jmbi.1997.1369. [DOI] [PubMed] [Google Scholar]
- [26].Linke C, Young PG, Kang HJ, Bunker RD, Middleditch MJ, Caradoc-Davies TT, et al. Crystal structure of the minor pilin FctB reveals determinants of Group A streptococcal pilus anchoring. J. Biol. Chem. 2010;285:20381–20389. doi: 10.1074/jbc.M109.089680. [DOI] [PMC free article] [PubMed] [Google Scholar]
- [27].Bhate M, Wang X, Baum J, Brodsky B. Folding and conformational consequences of glycine to alanine replacements at different positions in a collagen model peptide. Biochemistry. 2002;41:6539–6547. doi: 10.1021/bi020070d. [DOI] [PubMed] [Google Scholar]
- [28].Bryan MA, Cheng H, Brodsky B. Sequence environment of mutation affects stability and folding in collagen model peptides of osteogenesis imperfecta. Biopolymers. 2011;96:4–13. doi: 10.1002/bip.21432. [DOI] [PMC free article] [PubMed] [Google Scholar]
- [29].Wright PE, Dyson HJ. Intrinsically unstructured proteins: re-assessing the protein structure-function paradigm. J. Mol. Biol. 1999;293:321–331. doi: 10.1006/jmbi.1999.3110. [DOI] [PubMed] [Google Scholar]
- [30].Forman-Kay JD, Mittag T. From sequence and forces to structure, function, and evolution of intrinsically disordered proteins. Structure. 2013;21:1492–1499. doi: 10.1016/j.str.2013.08.001. [DOI] [PMC free article] [PubMed] [Google Scholar]
- [31].Habchi J, Tompa P, Longhi S, Uversky VN. Introducing protein intrinsic disorder. Chem Rev. 2014;114:6561–6588. doi: 10.1021/cr400514h. [DOI] [PubMed] [Google Scholar]
- [32].Das RK, Ruff KM, Pappu RV. Relating sequence encoded information to form and function of intrinsically disordered proteins. Curr. Opin. Struct. Biol. 2015;32:102–112. doi: 10.1016/j.sbi.2015.03.008. [DOI] [PMC free article] [PubMed] [Google Scholar]
- [33].Romero P, Obradovic Z, Kissinger CR, Villafranca JE, Garner E, Guilliot S, et al. Thousands of proteins likely to have long disordered regions. Pac Symp Biocomput. 1998:437–448. [PubMed] [Google Scholar]
- [34].Uversky VN. Intrinsically disordered proteins from A to Z. Int. J. Biochem. Cell Biol. 2011;43:1090–1103. doi: 10.1016/j.biocel.2011.04.001. [DOI] [PubMed] [Google Scholar]
- [35].Uversky VN, Oldfield CJ, Dunker AK. Intrinsically disordered proteins in human diseases: introducing the D2 concept. Annu Rev Biophys. 2008;37:215–246. doi: 10.1146/annurev.biophys.37.032807.125924. [DOI] [PubMed] [Google Scholar]
- [36].Uversky VN, Dunker AK. Understanding protein non-folding. Biochim. Biophys. Acta. 2010;1804:1231–1264. doi: 10.1016/j.bbapap.2010.01.017. [DOI] [PMC free article] [PubMed] [Google Scholar]
- [37].Dunker AK, Brown CJ, Obradovic Z. Identification and functions of usefully disordered proteins. Adv. Protein Chem. 2002;62:25–49. doi: 10.1016/s0065-3233(02)62004-2. [DOI] [PubMed] [Google Scholar]
- [38].van der Lee R, Buljan M, Lang B, Weatheritt RJ, Daughdrill GW, Dunker AK, et al. Classification of intrinsically disordered regions and proteins. Chem Rev. 2014;114:6589–6631. doi: 10.1021/cr400525m. [DOI] [PMC free article] [PubMed] [Google Scholar]
- [39].Trombitas K, Greaser M, Labeit S, Jin JP, Kellermayer M, Helmes M, et al. Titin extensibility in situ: entropic elasticity of permanently folded and permanently unfolded molecular segments. J. Cell Biol. 1998;140:853–859. doi: 10.1083/jcb.140.4.853. [DOI] [PMC free article] [PubMed] [Google Scholar]
- [40].Linke WA, Kulke M, Li H, Fujita-Becker S, Neagoe C, Manstein DJ, et al. PEVK domain of titin: an entropic spring with actin-binding properties. J. Struct. Biol. 2002;137:194–205. doi: 10.1006/jsbi.2002.4468. [DOI] [PubMed] [Google Scholar]
- [41].Brown HG, Hoh JH. Entropic exclusion by neurofilament sidearms: a mechanism for maintaining interfilament spacing. Biochemistry. 1997;36:15035–15040. doi: 10.1021/bi9721748. [DOI] [PubMed] [Google Scholar]
- [42].Tomasso ME, Tarver MJ, Devarajan D, Whitten ST. Hydrodynamic Radii of Intrinsically Disordered Proteins Determined from Experimental Polyproline II Propensities. PLoS Comput Biol. 2016;12:e1004686. doi: 10.1371/journal.pcbi.1004686. [DOI] [PMC free article] [PubMed] [Google Scholar]
- [43].Dunker AK, Rueckert RR. Observations on molecular weight determinations on polyacrylamide gel. J. Biol. Chem. 1969;244:5074–5080. [PubMed] [Google Scholar]
- [44].Schaub LJ, Campbell JC, Whitten ST. Thermal unfolding of the N-terminal region of p53 monitored by circular dichroism spectroscopy. Protein Sci. 2012;21:1682–1688. doi: 10.1002/pro.2146. [DOI] [PMC free article] [PubMed] [Google Scholar]
- [45].Hotta K, Ranganathan S, Liu R, Wu F, Machiyama H, Gao R, et al. Biophysical properties of intrinsically disordered p130Cas substrate domain--implication in mechanosensing. PLoS Comput Biol. 2014;10:e1003532. doi: 10.1371/journal.pcbi.1003532. [DOI] [PMC free article] [PubMed] [Google Scholar]
- [46].Ishijima J, Nagasaki N, Maeshima M, Miyano M. RVCaB, a calcium-binding protein in radish vacuoles, is predominantly an unstructured protein with a polyproline type II helix. J Biochem. 2007;142:201–211. doi: 10.1093/jb/mvm130. [DOI] [PubMed] [Google Scholar]
- [47].Kyte J, Doolittle RF. A simple method for displaying the hydropathic character of a protein. J. Mol. Biol. 1982;157:105–132. doi: 10.1016/0022-2836(82)90515-0. [DOI] [PubMed] [Google Scholar]
- [48].Shirai A, Matsuyama A, Yashiroda Y, Hashimoto A, Kawamura Y, Arai R, et al. Global analysis of gel mobility of proteins and its use in target identification. J. Biol. Chem. 2008;283:10745–10752. doi: 10.1074/jbc.M709211200. [DOI] [PubMed] [Google Scholar]
- [49].Hayashi T, Nagai Y. The anomalous behavior of collagen peptides on sodium dodecyl sulfate-polyacrylamide gel electrophoresis is due to the low content of hydrophobic amino acid residues. J Biochem. 1980;87:803–808. doi: 10.1093/oxfordjournals.jbchem.a132809. [DOI] [PubMed] [Google Scholar]
- [50].Uversky VN, Gillespie JR, Fink AL. Why are "natively unfolded" proteins unstructured under physiologic conditions? Proteins. 2000;41:415–427. doi: 10.1002/1097-0134(20001115)41:3<415::aid-prot130>3.0.co;2-7. [DOI] [PubMed] [Google Scholar]
- [51].Langridge TD, Tarver MJ, Whitten ST. Temperature effects on the hydrodynamic radius of the intrinsically disordered N-terminal region of the p53 protein. Proteins. 2014;82:668–678. doi: 10.1002/prot.24449. [DOI] [PubMed] [Google Scholar]
- [52].Perez RB, Tischer A, Auton M, Whitten ST. Alanine and proline content modulate global sensitivity to discrete perturbations in disordered proteins. Proteins. 2014;82:3373–3384. doi: 10.1002/prot.24692. [DOI] [PMC free article] [PubMed] [Google Scholar]
- [53].Marsh JA, Forman-Kay JD. Sequence determinants of compaction in intrinsically disordered proteins. Biophys. J. 2010;98:2383–2390. doi: 10.1016/j.bpj.2010.02.006. [DOI] [PMC free article] [PubMed] [Google Scholar]
- [54].Dunker AK, Lawson JD, Brown CJ, Williams RM, Romero P, Oh JS, et al. Intrinsically disordered protein. J. Mol. Graph. Model. 2001;19:26–59. doi: 10.1016/s1093-3263(00)00138-8. [DOI] [PubMed] [Google Scholar]
- [55].Uversky VN. Intrinsically disordered proteins and their environment: effects of strong denaturants, temperature, pH, counter ions, membranes, binding partners, osmolytes, and macromolecular crowding. Protein J. 2009;28:305–325. doi: 10.1007/s10930-009-9201-4. [DOI] [PubMed] [Google Scholar]
- [56].Oates ME, Romero P, Ishida T, Ghalwash M, Mizianty MJ, Xue B, et al. D(2)P(2): database of disordered protein predictions. Nucleic Acids Res. 2013;41:D508–516. doi: 10.1093/nar/gks1226. [DOI] [PMC free article] [PubMed] [Google Scholar]
- [57].Romero P, Obradovic Z, Li X, Garner EC, Brown CJ, Dunker AK. Sequence complexity of disordered protein. Proteins. 2001;42:38–48. doi: 10.1002/1097-0134(20010101)42:1<38::aid-prot50>3.0.co;2-3. [DOI] [PubMed] [Google Scholar]
- [58].Yang ZR, Thomson R, McNeil P, Esnouf RM. RONN: the bio-basis function neural network technique applied to the detection of natively disordered regions in proteins. Bioinformatics. 2005;21:3369–3376. doi: 10.1093/bioinformatics/bti534. [DOI] [PubMed] [Google Scholar]
- [59].Dosztanyi Z, Csizmok V, Tompa P, Simon I. The pairwise energy content estimated from amino acid composition discriminates between folded and intrinsically unstructured proteins. J. Mol. Biol. 2005;347:827–839. doi: 10.1016/j.jmb.2005.01.071. [DOI] [PubMed] [Google Scholar]
- [60].Dosztanyi Z, Csizmok V, Tompa P, Simon I. IUPred: web server for the prediction of intrinsically unstructured regions of proteins based on estimated energy content. Bioinformatics. 2005;21:3433–3434. doi: 10.1093/bioinformatics/bti541. [DOI] [PubMed] [Google Scholar]
- [61].Prilusky J, Felder CE, Zeev-Ben-Mordehai T, Rydberg EH, Man O, Beckmann JS, et al. FoldIndex: a simple tool to predict whether a given protein sequence is intrinsically unfolded. Bioinformatics. 2005;21:3435–3438. doi: 10.1093/bioinformatics/bti537. [DOI] [PubMed] [Google Scholar]
- [62].Gruszka DT, Wojdyla JA, Bingham RJ, Turkenburg JP, Manfield IW, Steward A, et al. Staphylococcal biofilm-forming protein has a contiguous rod-like structure. Proc. Natl. Acad. Sci. U. S. A. 2012;109:E1011–1018. doi: 10.1073/pnas.1119456109. [DOI] [PMC free article] [PubMed] [Google Scholar]
- [63].Gruszka DT, Whelan F, Farrance OE, Fung HK, Paci E, Jeffries CM, et al. Cooperative folding of intrinsically disordered domains drives assembly of a strong elongated protein. Nat Commun. 2015;6:7271. doi: 10.1038/ncomms8271. [DOI] [PMC free article] [PubMed] [Google Scholar]
- [64].Holehouse AS, Ahad J, Das RK, Pappu RV. CIDER: Classification of Intrinsically Disordered Ensemble Regions. Biophys. J. 2015;108:228a. doi: 10.1016/j.bpj.2016.11.3200. [DOI] [PMC free article] [PubMed] [Google Scholar]
- [65].Das RK, Pappu RV. Conformations of intrinsically disordered proteins are influenced by linear sequence distributions of oppositely charged residues. Proc. Natl. Acad. Sci. U. S. A. 2013;110:13392–13397. doi: 10.1073/pnas.1304749110. [DOI] [PMC free article] [PubMed] [Google Scholar]
- [66].Lopes JL, Miles AJ, Whitmore L, Wallace BA. Distinct circular dichroism spectroscopic signatures of polyproline II and unordered secondary structures: applications in secondary structure analyses. Protein Sci. 2014;23:1765–1772. doi: 10.1002/pro.2558. [DOI] [PMC free article] [PubMed] [Google Scholar]
- [67].Tiffany ML, Krimm S. New chain conformations of poly(glutamic acid) and polylysine. Biopolymers. 1968;6:1379–1382. doi: 10.1002/bip.1968.360060911. [DOI] [PubMed] [Google Scholar]
- [68].Whittington SJ, Chellgren BW, Hermann VM, Creamer TP. Urea promotes polyproline II helix formation: implications for protein denatured states. Biochemistry. 2005;44:6269–6275. doi: 10.1021/bi050124u. [DOI] [PubMed] [Google Scholar]
- [69].Adzhubei AA, Sternberg MJ, Makarov AA. Polyproline-II helix in proteins: structure and function. J. Mol. Biol. 2013;425:2100–2132. doi: 10.1016/j.jmb.2013.03.018. [DOI] [PubMed] [Google Scholar]
- [70].Drake AF, Siligardi G, Gibbons WA. Reassessment of the electronic circular dichroism criteria for random coil conformations of poly(L-lysine) and the implications for protein folding and denaturation studies. Biophys. Chem. 1988;31:143–146. doi: 10.1016/0301-4622(88)80019-x. [DOI] [PubMed] [Google Scholar]
- [71].Wuttke R, Hofmann H, Nettels D, Borgia MB, Mittal J, Best RB, et al. Temperature-dependent solvation modulates the dimensions of disordered proteins. Proc. Natl. Acad. Sci. U. S. A. 2014;111:5213–5218. doi: 10.1073/pnas.1313006111. [DOI] [PMC free article] [PubMed] [Google Scholar]
- [72].Kjaergaard M, Norholm AB, Hendus-Altenburger R, Pedersen SF, Poulsen FM, Kragelund BB. Temperature-dependent structural changes in intrinsically disordered proteins: formation of alpha-helices or loss of polyproline II? Protein Sci. 2010;19:1555–1564. doi: 10.1002/pro.435. [DOI] [PMC free article] [PubMed] [Google Scholar]
- [73].Brown PH, Schuck P. Macromolecular size-and-shape distributions by sedimentation velocity analytical ultracentrifugation. Biophys. J. 2006;90:4651–4661. doi: 10.1529/biophysj.106.081372. [DOI] [PMC free article] [PubMed] [Google Scholar]
- [74].Chaton CT, Herr AB. Elucidating Complicated Assembling Systems in Biology Using Size-and-Shape Analysis of Sedimentation Velocity Data. Methods Enzymol. 2015;562:187–204. doi: 10.1016/bs.mie.2015.04.004. [DOI] [PMC free article] [PubMed] [Google Scholar]
- [75].Gast K, Fiedler C. Dynamic and static light scattering of intrinsically disordered proteins. Methods Mol. Biol. 2012;896:137–161. doi: 10.1007/978-1-4614-3704-8_9. [DOI] [PubMed] [Google Scholar]
- [76].Tanford C. Isothermal Unfolding of Globular Proteins in Aqueous Urea Solutions. J. Am. Chem. Soc. 1964;86:2050–2059. [Google Scholar]
- [77].Scholtz JM, Grimsley GR, Pace CN. Solvent denaturation of proteins and interpretations of the m value. Methods Enzymol. 2009;466:549–565. doi: 10.1016/S0076-6879(09)66023-7. [DOI] [PubMed] [Google Scholar]
- [78].Auton M, Rosgen J, Sinev M, Holthauzen LM, Bolen DW. Osmolyte effects on protein stability and solubility: a balancing act between backbone and side-chains. Biophys. Chem. 2011;159:90–99. doi: 10.1016/j.bpc.2011.05.012. [DOI] [PMC free article] [PubMed] [Google Scholar]
- [79].Holehouse AS, Garai K, Lyle N, Vitalis A, Pappu RV. Quantitative assessments of the distinct contributions of polypeptide backbone amides versus side chain groups to chain expansion via chemical denaturation. J. Am. Chem. Soc. 2015;137:2984–2995. doi: 10.1021/ja512062h. [DOI] [PMC free article] [PubMed] [Google Scholar]
- [80].Moeser B, Horinek D. Unified description of urea denaturation: backbone and side chains contribute equally in the transfer model. J Phys Chem B. 2014;118:107–114. doi: 10.1021/jp409934q. [DOI] [PubMed] [Google Scholar]
- [81].Canchi DR, Garcia AE. Backbone and side-chain contributions in protein denaturation by urea. Biophys. J. 2011;100:1526–1533. doi: 10.1016/j.bpj.2011.01.028. [DOI] [PMC free article] [PubMed] [Google Scholar]
- [82].Das A, Mukhopadhyay C. Urea-mediated protein denaturation: a consensus view. J Phys Chem B. 2009;113:12816–12824. doi: 10.1021/jp906350s. [DOI] [PubMed] [Google Scholar]
- [83].Mason PE, Brady JW, Neilson GW, Dempsey CE. The interaction of guanidinium ions with a model peptide. Biophys. J. 2007;93:L04–06. doi: 10.1529/biophysj.107.108290. [DOI] [PMC free article] [PubMed] [Google Scholar]
- [84].Mason PE, Dempsey CE, Neilson GW, Kline SR, Brady JW. Preferential interactions of guanidinum ions with aromatic groups over aliphatic groups. J. Am. Chem. Soc. 2009;131:16689–16696. doi: 10.1021/ja903478s. [DOI] [PMC free article] [PubMed] [Google Scholar]
- [85].O'Brien EP, Dima RI, Brooks B, Thirumalai D. Interactions between hydrophobic and ionic solutes in aqueous guanidinium chloride and urea solutions: lessons for protein denaturation mechanism. J. Am. Chem. Soc. 2007;129:7346–7353. doi: 10.1021/ja069232+. [DOI] [PubMed] [Google Scholar]
- [86].Lim WK, Rosgen J, Englander SW. Urea, but not guanidinium, destabilizes proteins by forming hydrogen bonds to the peptide group. Proc. Natl. Acad. Sci. U. S. A. 2009;106:2595–2600. doi: 10.1073/pnas.0812588106. [DOI] [PMC free article] [PubMed] [Google Scholar]
- [87].Wetzler DE, Gallo M, Melis R, Eliseo T, Nadra AD, Ferreiro DU, et al. A strained DNA binding helix is conserved for site recognition, folding nucleation, and conformational modulation. Biopolymers. 2009;91:432–443. doi: 10.1002/bip.21146. [DOI] [PubMed] [Google Scholar]
- [88].Chemes LB, Alonso LG, Noval MG, de Prat-Gay G. Circular dichroism techniques for the analysis of intrinsically disordered proteins and domains. Methods Mol. Biol. 2012;895:387–404. doi: 10.1007/978-1-61779-927-3_22. [DOI] [PubMed] [Google Scholar]
- [89].Yancey PH, Clark ME, Hand SC, Bowlus RD, Somero GN. Living with water stress: evolution of osmolyte systems. Science. 1982;217:1214–1222. doi: 10.1126/science.7112124. [DOI] [PubMed] [Google Scholar]
- [90].Baskakov I, Bolen DW. Forcing thermodynamically unfolded proteins to fold. J. Biol. Chem. 1998;273:4831–4834. doi: 10.1074/jbc.273.9.4831. [DOI] [PubMed] [Google Scholar]
- [91].Bolen DW, Baskakov IV. The osmophobic effect: natural selection of a thermodynamic force in protein folding. J. Mol. Biol. 2001;310:955–963. doi: 10.1006/jmbi.2001.4819. [DOI] [PubMed] [Google Scholar]
- [92].Qu Y, Bolen DW. Efficacy of macromolecular crowding in forcing proteins to fold. Biophys. Chem. 2002;101-102:155–165. doi: 10.1016/s0301-4622(02)00148-5. [DOI] [PubMed] [Google Scholar]
- [93].McPhie P, Ni YS, Minton AP. Macromolecular crowding stabilizes the molten globule form of apomyoglobin with respect to both cold and heat unfolding. J. Mol. Biol. 2006;361:7–10. doi: 10.1016/j.jmb.2006.05.075. [DOI] [PubMed] [Google Scholar]
- [94].Hill CM, Bates IR, White GF, Hallett FR, Harauz G. Effects of the osmolyte trimethylamine-N-oxide on conformation, self-association, and two-dimensional crystallization of myelin basic protein. J. Struct. Biol. 2002;139:13–26. doi: 10.1016/s1047-8477(02)00513-0. [DOI] [PubMed] [Google Scholar]
- [95].Rozycka M, Wojtas M, Jakob M, Stigloher C, Grzeszkowiak M, Mazur M, et al. Intrinsically disordered and pliable Starmaker-like protein from medaka (Oryzias latipes) controls the formation of calcium carbonate crystals. PLoS One. 2014;9:e114308. doi: 10.1371/journal.pone.0114308. [DOI] [PMC free article] [PubMed] [Google Scholar]
- [96].Baskakov IV, Kumar R, Srinivasan G, Ji YS, Bolen DW, Thompson EB. Trimethylamine N-oxide-induced cooperative folding of an intrinsically unfolded transcription-activating fragment of human glucocorticoid receptor. J. Biol. Chem. 1999;274:10693–10696. doi: 10.1074/jbc.274.16.10693. [DOI] [PubMed] [Google Scholar]
- [97].Buck M, Schwalbe H, Dobson CM. Characterization of conformational preferences in a partly folded protein by heteronuclear NMR spectroscopy: assignment and secondary structure analysis of hen egg-white lysozyme in trifluoroethanol. Biochemistry. 1995;34:13219–13232. doi: 10.1021/bi00040a038. [DOI] [PubMed] [Google Scholar]
- [98].Fan P, Bracken C, Baum J. Structural characterization of monellin in the alcohol-denatured state by NMR: evidence for beta-sheet to alpha-helix conversion. Biochemistry. 1993;32:1573–1582. doi: 10.1021/bi00057a023. [DOI] [PubMed] [Google Scholar]
- [99].Sonnichsen FD, Van Eyk JE, Hodges RS, Sykes BD. Effect of trifluoroethanol on protein secondary structure: an NMR and CD study using a synthetic actin peptide. Biochemistry. 1992;31:8790–8798. doi: 10.1021/bi00152a015. [DOI] [PubMed] [Google Scholar]
- [100].Brocca S, Šamalíková M, Uversky VN, Lotti M, Vanoni M, Alberghina L, et al. Order propensity of an intrinsically disordered protein, the cyclin-dependent-kinase inhibitor Sic1. Proteins: Structure, Function, and Bioinformatics. 2009;76:731–746. doi: 10.1002/prot.22385. [DOI] [PMC free article] [PubMed] [Google Scholar]
- [101].Chemes LB, Sánchez IE, Smal C, de Prat-Gay G. Targeting mechanism of the retinoblastoma tumor suppressor by a prototypical viral oncoprotein. FEBS J. 2010;277:973–988. doi: 10.1111/j.1742-4658.2009.07540.x. [DOI] [PubMed] [Google Scholar]
- [102].Garcia-Alai MM, Alonso LG, de Prat-Gay G. The N-terminal module of HPV16 E7 is an intrinsically disordered domain that confers conformational and recognition plasticity to the oncoprotein. Biochemistry. 2007;46:10405–10412. doi: 10.1021/bi7007917. [DOI] [PubMed] [Google Scholar]
- [103].Morin B, Bourhis JM, Belle V, Woudstra M, Carriere F, Guigliarelli B, et al. Assessing induced folding of an intrinsically disordered protein by site-directed spin-labeling electron paramagnetic resonance spectroscopy. J Phys Chem B. 2006;110:20596–20608. doi: 10.1021/jp063708u. [DOI] [PubMed] [Google Scholar]
- [104].Garcia-Alai MM, Gallo M, Salame M, Wetzler DE, McBride AA, Paci M, et al. Molecular basis for phosphorylation-dependent, PEST-mediated protein turnover. Structure. 2006;14:309–319. doi: 10.1016/j.str.2005.11.012. [DOI] [PubMed] [Google Scholar]
- [105].Whittington SJ, Creamer TP. Salt bridges do not stabilize polyproline II helices. Biochemistry. 2003;42:14690–14695. doi: 10.1021/bi035565x. [DOI] [PubMed] [Google Scholar]
- [106].Record MT, Jr., Lohman ML, De Haseth P. Ion effects on ligand-nucleic acid interactions. J. Mol. Biol. 1976;107:145–158. doi: 10.1016/s0022-2836(76)80023-x. [DOI] [PubMed] [Google Scholar]
- [107].Uversky VN, Gillespie JR, Millett IS, Khodyakova AV, Vasilenko RN, Vasiliev AM, et al. Zn(2+)-mediated structure formation and compaction of the "natively unfolded" human prothymosin alpha. Biochem. Biophys. Res. Commun. 2000;267:663–668. doi: 10.1006/bbrc.1999.2013. [DOI] [PubMed] [Google Scholar]
- [108].Kaplon TM, Michnik A, Drzazga Z, Richter K, Kochman M, Ozyhar A. The rod-shaped conformation of Starmaker. Biochim. Biophys. Acta. 2009;1794:1616–1624. doi: 10.1016/j.bbapap.2009.07.010. [DOI] [PubMed] [Google Scholar]
- [109].Formosa-Dague C, Speziale P, Foster TJ, Geoghegan JA, Dufrene YF. Zinc-dependent mechanical properties of Staphylococcus aureus biofilm-forming surface protein SasG. Proc. Natl. Acad. Sci. U. S. A. 2016;113:410–415. doi: 10.1073/pnas.1519265113. [DOI] [PMC free article] [PubMed] [Google Scholar]
- [110].Theillet F-X, Kalmar L, Tompa P, Han K-H, Selenko P, Dunker AK, et al. The alphabet of intrinsic disorder. Intrinsically Disordered Proteins. 2013;1:e24360. doi: 10.4161/idp.24360. [DOI] [PMC free article] [PubMed] [Google Scholar]
- [111].Elam WA, Schrank TP, Campagnolo AJ, Hilser VJ. Evolutionary conservation of the polyproline II conformation surrounding intrinsically disordered phosphorylation sites. Protein Sci. 2013;22:405–417. doi: 10.1002/pro.2217. [DOI] [PMC free article] [PubMed] [Google Scholar]
- [112].Shi Z, Chen K, Liu Z, Ng A, Bracken WC, Kallenbach NR. Polyproline II propensities from GGXGG peptides reveal an anticorrelation with beta-sheet scales. Proc. Natl. Acad. Sci. U. S. A. 2005;102:17964–17968. doi: 10.1073/pnas.0507124102. [DOI] [PMC free article] [PubMed] [Google Scholar]
- [113].Rucker AL, Pager CT, Campbell MN, Qualls JE, Creamer TP. Host-guest scale of left-handed polyproline II helix formation. Proteins. 2003;53:68–75. doi: 10.1002/prot.10477. [DOI] [PubMed] [Google Scholar]
- [114].Larson MR, Rajashankar KR, Patel MH, Robinette RA, Crowley PJ, Michalek S, et al. Elongated fibrillar structure of a streptococcal adhesin assembled by the high-affinity association of alpha- and PPII-helices. Proc. Natl. Acad. Sci. U. S. A. 2010;107:5983–5988. doi: 10.1073/pnas.0912293107. [DOI] [PMC free article] [PubMed] [Google Scholar]
- [115].Berisio R, Vitagliano L. Polyproline and triple helix motifs in host-pathogen recognition. Curr. Protein Pept. Sci. 2012;13:855–865. doi: 10.2174/138920312804871157. [DOI] [PMC free article] [PubMed] [Google Scholar]
- [116].Horng JC, Raines RT. Stereoelectronic effects on polyproline conformation. Protein Sci. 2006;15:74–83. doi: 10.1110/ps.051779806. [DOI] [PMC free article] [PubMed] [Google Scholar]
- [117].Cammers-Goodwin A, Allen TJ, Oslick SL, McClure KF, Lee JH, Kemp DS. Mechanism of Stabilization of Helical Conformations of Polypeptides by Water Containing Trifluoroethanol. J. Am. Chem. Soc. 1996;118:3082–3090. [Google Scholar]
- [118].Steinberg IZ, Harrington WF, Berger A, Sela M, Katchalski E. The Configurational Changes of Poly-L-proline in Solution. J. Am. Chem. Soc. 1960;82:5263–5279. [Google Scholar]
- [119].Lima CD, Wang LK, Shuman S. Structure and mechanism of yeast RNA triphosphatase: an essential component of the mRNA capping apparatus. Cell. 1999;99:533–543. doi: 10.1016/s0092-8674(00)81541-x. [DOI] [PubMed] [Google Scholar]
- [120].Schuck P. Size-distribution analysis of macromolecules by sedimentation velocity ultracentrifugation and lamm equation modeling. Biophys. J. 2000;78:1606–1619. doi: 10.1016/S0006-3495(00)76713-0. [DOI] [PMC free article] [PubMed] [Google Scholar]
- [121].Laue TM, Shah BD, Ridgeway TM, Pelletier SL. Computer-aided interpretation of sedimentation data for proteins. In: Harding SE, Rowe AJ, Horton JC, editors. In Analytical Ultracentrifugation in Biochemistry and Polymer Science. Royal Society of Chemistry; London: 1992. pp. 90–125. [Google Scholar]
- [122].Lemmon EW, McLinden MO, Friend DG. Linstrom PJ, Mallard WG, editors. Thermophysical Properties of Fluid Systems. In NIST Chemistry WebBook, NIST Standard Reference Database Number 69. http://webboook.nist.gov. [Google Scholar]
- [123].Brautigam CA. Calculations and Publication-Quality Illustrations for Analytical Ultracentrifugation Data. Methods Enzymol. 2015;562:109–133. doi: 10.1016/bs.mie.2015.05.001. [DOI] [PubMed] [Google Scholar]
- [124].Cantor CR, Schimmel PR. Biophysical Chemistry Part III: The Behaviour of Biological Macromolecules. W. H. Freeman and Co; New York: 1980. [Google Scholar]
- [125].Wilkins DK, Grimshaw SB, Receveur V, Dobson CM, Jones JA, Smith LJ. Hydrodynamic Radii of Native and Denatured Proteins Measured by Pulse Field Gradient NMR Techniques. Biochemistry. 1999;38:16424–16431. doi: 10.1021/bi991765q. [DOI] [PubMed] [Google Scholar]
- [126].Sievers F, Wilm A, Dineen D, Gibson TJ, Karplus K, Li W, et al. Fast, scalable generation of high-quality protein multiple sequence alignments using Clustal Omega. Mol Syst Biol. 2011;7:539. doi: 10.1038/msb.2011.75. [DOI] [PMC free article] [PubMed] [Google Scholar]
- [127].Consortium TU. UniProt: a hub for protein information. Nucleic Acids Res. 2015;43:D204–212. doi: 10.1093/nar/gku989. [DOI] [PMC free article] [PubMed] [Google Scholar]
- [128].Bujacz A. Structures of bovine, equine and leporine serum albumin. Acta Crystallogr D Biol Crystallogr. 2012;68:1278–1289. doi: 10.1107/S0907444912027047. [DOI] [PubMed] [Google Scholar]
- [129].Stein PE, Leslie AG, Finch JT, Turnell WG, McLaughlin PJ, Carrell RW. Crystal structure of ovalbumin as a model for the reactive centre of serpins. Nature. 1990;347:99–102. doi: 10.1038/347099a0. [DOI] [PubMed] [Google Scholar]
- [130].Saito R, Sato T, Ikai A, Tanaka N. Structure of bovine carbonic anhydrase II at 1.95 A resolution. Acta Crystallogr D Biol Crystallogr. 2004;60:792–795. doi: 10.1107/S0907444904003166. [DOI] [PubMed] [Google Scholar]
- [131].Zahran ZN, Chooback L, Copeland DM, West AH, Richter-Addo GB. Crystal structures of manganese- and cobalt-substituted myoglobin in complex with NO and nitrite reveal unusual ligand conformations. J. Inorg. Biochem. 2008;102:216–233. doi: 10.1016/j.jinorgbio.2007.08.002. [DOI] [PMC free article] [PubMed] [Google Scholar]
Associated Data
This section collects any data citations, data availability statements, or supplementary materials included in this article.