Abstract
Background
Enteroviruses (EVs) have been linked to the pathogenesis of several diseases and there is a collective need to develop improved methods for the detection of these viruses in tissue samples.
Objectives
This study evaluates the relative sensitivity of immunohistochemistry (IHC), proteomics, in situ hybridization (ISH) and RT-PCR to detect one common EV, Coxsackievirus B1 (CVB1), in acutely infected human A549 cells in vitro.
Study design
A549 cells were infected with CVB1 and diluted with uninfected A549 cells to produce a limited dilution series in which the proportion of infected cells ranged from 10−1 to 10−8. Analyses were carried out by several laboratories using IHC with different anti-EV antibodies, ISH with both ViewRNA and RNAScope systems, liquid chromatography multiple reaction monitoring mass spectrometry (LC/MRM/MS/MS), and two modifications of RT-PCR.
Results
RT-PCR was the most sensitive method for EV detection yielding positive signals in the most diluted sample (10−8). LC/MRM/MS/MS detected viral peptides at dilutions as high as 10−7. The sensitivity of IHC depended on the antibody used, and the most sensitive antibody (Dako clone 5D8/1) detected virus proteins at a dilution of 10−6, while ISH detected the virus at dilutions of 10−4.
Conclusions
All methods were able to detect CVB1 in infected A549 cells. RT-PCR was most sensitive followed by LC/MRM/MS/MS and then IHC. The results from this in vitro survey suggest that all methods are suitable tools for EV detection but that their differential sensitivities need to be considered when interpreting the results from such studies.
Keywords: Sensitivity, Proteomics, In situ hybridization, Immunohistochemisrty, RT-PCR
1. Background
Enterovirus1 (EV) infections are common in all age groups. They are usually asymptomatic or cause only mild respiratory symptoms, but can also lead to more severe illness including hand, foot and mouth disease, myocarditis, meningitis, encephalitis, pancreatitis, systemic infection in newborns and paralysis. EV infections may also play a role in the pathogenesis of chronic diseases such as dilated cardiomyopathy [1], chronic fatigue syndrome [2] and type 1 diabetes2 (T1D) [3–5].
Laboratory diagnosis of EV infection is based on virus detection in stools, nasal/throat swabs or cerebrospinal fluid, as well as on EV-specific antibody responses in serum. However, studies evaluating the pathogenesis of EV infections and their possible role in chronic diseases (where levels of viral infection may be low but persistent) require additional technologies and there is an increasing need for direct virus detection in tissue samples. Traditionally, EVs are detected in tissue samples either by RT-PCR or immunohistochemistry3 (IHC). In addition to these, the new single molecule hybridization [6,7] as well as mass spectrometry/proteomics technologies offer new opportunities for viral detection. However, there are no previous reports in which the performance of these various technologies has been evaluated in relation to one another.
2. Objectives
The aim of the study was to evaluate the relative sensitivities of proteomics, ISH, IHC and RT-PCR methods to detect one common EV, Coxsackievirus B14 (CVB1), using human A549 cells diluted to contain differing ratios of uninfected to in vitro EV-infected cells.
3. Study design
3.1. Preparation of EV-infected cell arrays
Human A549 alveolar basal epithelial cells were grown in monolayers in Nutrient Mixture F-12Ham, N 6658 (Sigma–Aldrich®) medium in T175 bottles and infected with CVB1, ATCC strain (10–15 MOI). The infection was stopped at four different time points (1 h, 2 h, 4 h, and 6 h post infection) to obtain a series of infected cells representing different stages of viral replication cycle. The cells from different time points were mechanically detached, pooled and washed with the growth medium. The cells were then immediately diluted with uninfected A549 cells to produce a dilution series ranging from 10−1 to 10−8, as well as an undiluted sample (positive control) and a sample of uninfected A549 cells (negative control). Each dilution aliquot was further divided into ten sub-aliquots, each containing about 1 million cells. These sub-aliquots were fixed or stored in an optimal way for each of the different methodologies employed. Some of the aliquots were fixed in 10% neutral-buffered formalin for 24 h and paraffin-embedded using standard procedures for IHC and ISH analyses. The rest were quickly frozen in liquid nitrogen and stored at −70 °C for RT-PCR and proteomics analyses. From the individual formalin-fixed paraffin-embedded5 (FFPE) samples, a cell microarray was created using TMA Master (3D Histech Kft, Hungary) and 5 μm-thick sections were cut for histological stainings.
3.2. RT-PCR
RT-PCR was performed in two different laboratories (Tampere and Uppsala), each analyzing similar aliquots of the dilution series. In Tampere, RNA was extracted from 140 μl cell sample using the Viral RNA Kit (Qiagen, Hilden, Germany), and real-time RT-PCR was performed as previously described [8]. In Uppsala, viral RNA was extracted from 100 μl using RNeasy Mini kit (Qiagen). 50 ng total RNA/sample were primed with virus specific primers and reverse transcribed to cDNA with SuperScriptII™ RT (Invitrogen) according to the manufacturer’s instructions. A semi-nested EV PCR was performed as described previously [3].
3.3. Proteomics
The dilution series samples were solubilized using 50% Tri-fluoroethanol in 50 mM ammonium bicarbonate as previously described [9]. Protein concentration was determined by bicinchoninic acid6 (BCA) assay (Pierce, Rockford, Ill.). Concentration normalized samples from each of the dilution steps were reduced and alkylated as previously described [10]. Proteins were digested with trypsin at a ratio of 1:50 at 37 °C for 18 h to generate peptides. The peptides were purified using C18 columns, eluted using 80% acetonitrile in 0.1% formic acid and dried in a SpeedVac. Peptides were reconstituted in 0.1% formic acid prior to liquid chromatography multiple reaction monitoring mass spectrometry7 (LC/MRM/MS/MS). LC/MRM/MS/MS on a triple quadrupole (QqQ) mass spectrometer8 provides superior rapid, sensitive, and specific identification and quantitation of targeted compounds in highly complex samples [11,12].
LC/MRM/MS analysis of the tryptic peptides from the ten A549 dilution series cell samples was performed on a 4000 QTRAP® mass spectrometer coupled to a Tempo NanoLC system (ABSciex, Foster City, CA) [10]. Skyline was used to generate and optimize tryptic peptides and tandem MS/MS fragmentation data for developing MRM transitions pairs for CVB1 peptides [13]. A CVB1 2C protein peptide SVATNLIGR was selected for subsequent analysis and quantitation based on its abundance and high signal intensities for both the precursor ion (Q1 m/z) and fragment ions (Q3 m/z) and absence of signals in non-infected A549 cells. MRM Pilot ™ software (ABSciex) was used to optimize the assay conditions for the SVATNLIGR peptide with the following transition pairs of 465.7720/572.3515 and 465.7720/744.4363. The Q1 m/z (465.7720) for the MH2+ peptide parent mass and the Q3 m/zs correspond to y5 (572.3515) and y7 (744.4363) fragment ions. The final MRM assay conditions are detailed in Supplementary data.
The tryptic peptides corresponding to 1.6 μg of sample were injected and analyzed for each sample. The samples were sequentially analyzed starting with the non-infected samples and the low dilutions, to the non-diluted samples with multiple washing steps using blanks (buffer A) between each sample to avoid carry-over. Each sample was analyzed in duplicate experiments. Relative quantitation was achieved by comparing the area under the curve for the peptide transition pairs in the extracted ion chromatograms9 (XIC) for each dilution step. The acquired data were processed and analyzed using Analyst 1.2 (ABSciex).
3.4. Immunohistochemistry
IHC was performed in three laboratories (Tampere, Exeter and Uppsala). Primary analyses were done using a commercially available antibody raised against EV VP110 protein (clone 5D8/1; DAKO, Glostrup, Denmark). In Tampere and Exeter, IHC was performed as previously described [5,14,15]. In Uppsala, the sections were counterstained with haematoxylin (DAKO) before the addition of the primary antibody (diluted 1:2000) in Autostainer Link 48 (DAKO). Visualization was achieved with the DAKO Envision K8000. In addition, polyclonal antibodies produced in rabbits (see Supplementary) against each of the viral capsid proteins VP1, VP2, VP3 and VP4 of CVB4 Tuscany strain, were analyzed in the Tampere and Exeter laboratories. Antibodies from the first bleed (VP1A and VP3A) and from the last bleed (VP1B, VP2B, VP3B and VP4B) were used. In Tampere, staining was performed using the automated system and similar conditions to those for clone 5D8/1. In Exeter, following heat-induced epitope retrieval in 10 mM citrate, pH 6.0, the VP1–VP4 antibodies were incubated for 1 h at room temperature. The DAKO Envision Detection System was used for antigen detection as per the manufacturer’s instructions and sections were counterstained with haematoxylin. The concentrations of CVB4 VP1–VP4 antibodies used in both laboratories are detailed in Supplementary Table 1.
3.5. In situ hybridization
ISH assays were performed in two laboratories (Tampere and Gainesville). In Tampere, the QuantiGene® ViewRNA (Affymetrix, Santa Clara, California, USA) was used with two different EV-specific probe sets (EV AB and CVB1), according to the manufacturer’s instructions and as previously described [6]. In Gainesville, ISH was performed using the RNAscope 2.0 High Definition Assay (Advanced Cell Diagnostics, Hayward, California, USA) according to the manufacturer’s instructions. Two EV-specific probes were tested to detect serotypes CVB1-6 and CVB3. Deparaffinized sections were hybridized to probes followed by amplification by serial application of amplifiers followed by peroxidase labels and detection with DAB.
4. Results
4.1. RT-PCR
Viral RNA was detected by RT-PCR in all samples although the semi-nested method was most sensitive. This yielded a positive signal from even the most dilute sample (10−8) whereas the real-time RT-PCR method gave a positive signal in the second most dilute sample (10−7). Ct values from real-time RT-PCR experiments with different dilutions of infected cells are shown in Supplementary Table 2.
4.2. Proteomics
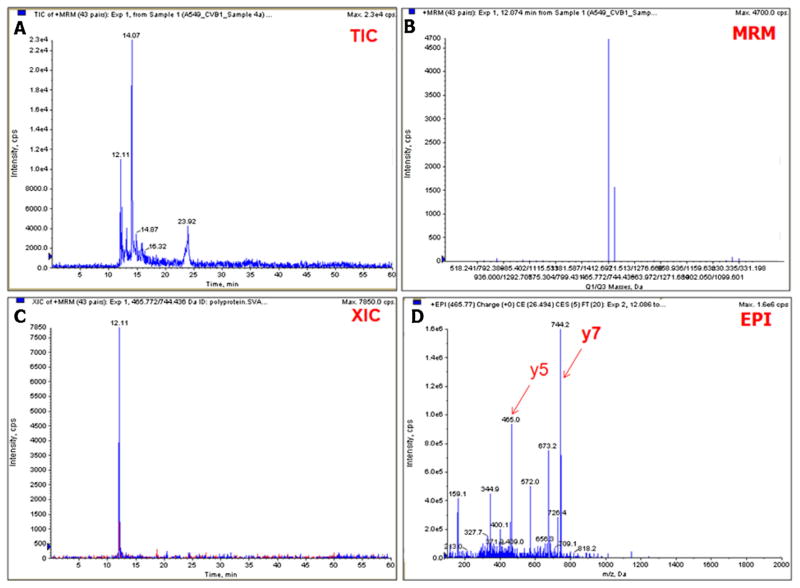
MS-based targeted LC/MRM/MS/MS assay focused on the CVB1 2C protein peptide SVATNLIGR and the peptide signal was detectable at cell dilutions as high as 10−7. Fig. 1 shows the LC/MRM/MS/MS results for the relative abundance of the 2C protein peptide in undiluted, virus-infected cells. It also shows the detection of the MRM transition pairs signals, and the enhanced product ion scan11 (EPI) showing the MS/MS fragmentation spectrum for the peptide.
Fig. 1.
Multiple reaction monitoring assay for CVB1 virus peptides. The total ion chromatogram and MRM peaks are shown in panels A and B. The extracted ion chromatogram (XIC) for the Protein 2C peptide is shown in panel C and the enhanced product ion scan (EPI) spectrum with the Q3 y5 and y7 fragment ions are shown in panel D. These two ions are the most intense in the tandem mass spectrum and their primary sequences correspond to the following c-terminus fragments of the peptide. y5 NLIGR (m/z = 572.3515) and y7 ATNLIGR (m/z = 744.4363).
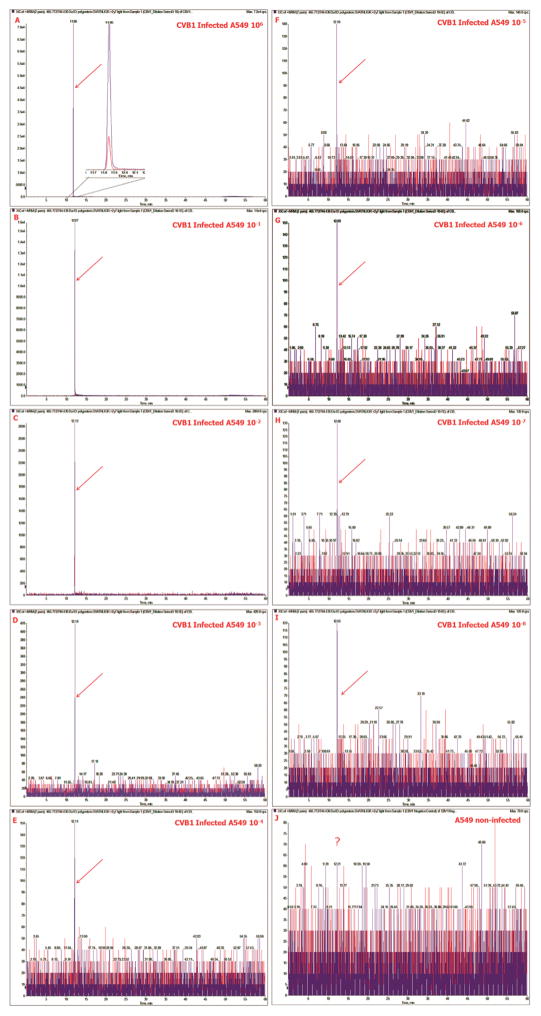
Fig. 2 shows extracted ion chromatograms of the two transition pairs 465.7720/572.3515 (red) and 465.7720/744.4363 (blue) for the non-diluted, infected A549 cells (Panel A), the dilution series of the infected cells (Panels B–J) and the non-infected A549 cells (Panel K). The relative intensity and the accompanying signal for the MRM assay decreases from that of the peptide.
Fig. 2.
MRM detection of CVB1 peptide in A549 cells LC/MRM/MS. Extracted ion chromatograms of the two transition pairs 465.7720/572.3515 (red) and 465.7720/744.4363 (purple) for the non-diluted CVB1 infected A549 cells panel (A), the dilution series of the infected cells (Panels B–I) and the non-infected A549 cells (Panel J). The MRM peaks in the samples are marked with a red arrow. Note the absence of signal (?) in Panel J. In panel A, the Zoom shows an expansion of the baseline to show the well resolved peaks of the extracted ion chromatograms of the two MRM transition pairs. (For interpretation of the references to color in this figure legend, the reader is referred to the web version of this article.)
4.3. Immunohistochemistry
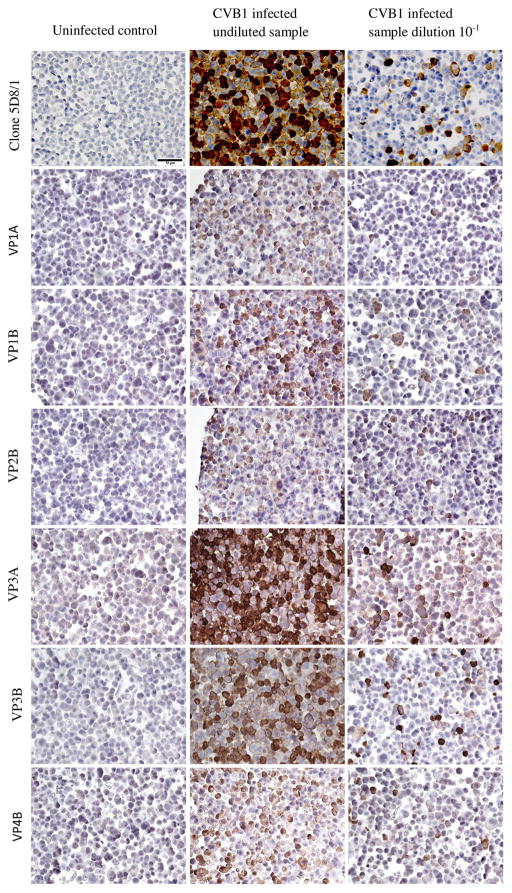
IHC also proved to be a sensitive method for detection of viral protein but was less sensitive than semi-nested RT-PCR, real-time RT-PCR and LC/MRM/MS/MS. IHC detected viral protein in virtually every cell in the undiluted sample, but the proportion of virus-positive cells decreased linearly as the dilution increased. Clone 5D8/1 was the most sensitive antibody tested detecting virus-positive cells at dilutions equal to or lower than 10−4 in Uppsala, 10−5 in Tampere and 10−6 in Exeter. At dilutions from 10−3 and beyond, the number of virus-positive cells was scarce, with only occasional cells stained positively (Fig. 3). In Tampere and Exeter, antibodies raised against CVB4 viral capsid proteins, stained efficiently the infected cells diluted over the range 10−2 to 10−4. The intensity of the staining with these antibodies varied to some extent, with the VP1 (10−3) and VP3 (10−4) antibodies giving the highest sensitivities which were comparable in both Tampere and Exeter laboratories.
Fig. 3.
Detection of CVB1 in infected A549 and uninfected A549 cells (FFPE) with different antibodies; commercial DAKO clone 5D8/1 and in-house anti-CVB4 antibodies VP1A, VP1B, VP2B, VP3A, VP3B and VP4B. Example micrographs of uninfected control, CVB1 infected undiluted sample and CVB1 infected dilution 10−1 are shown. 40× magnification. Scale bar = 50 μm.
4.4. In situ hybridization
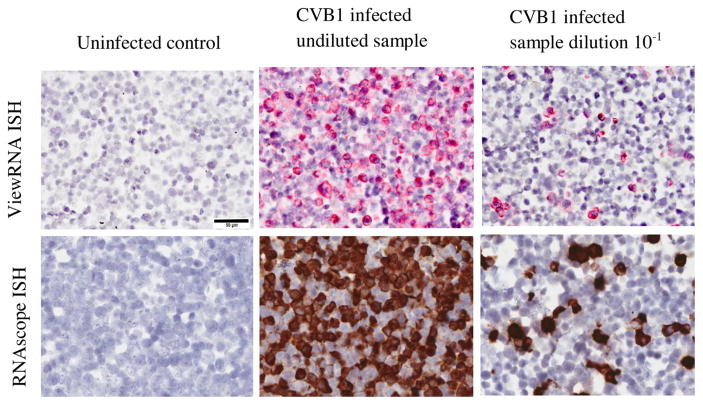
Both ISH methods (ViewRNA and RNAscope) demonstrated equal sensitivity, regardless of the probe used, detecting the virus at dilutions of 10−4 (Fig. 4). In the undiluted sample, almost all cells were EV-positive, and the number of positive cells decreased linearly as the ratio of CVB1-infected cells to uninfected cells was reduced.
Fig. 4.
Detection of CVB1 in infected A549 and in uninfected A549 cells (FFPE) using two different commercially available ISH (ViewRNA and RNAscope) methods. Example micrographs of uninfected control, CVB1 infected undiluted sample and CVB1 infected dilution 10−1 are shown. 40× magnification. Scale bar = 50 μm.
Comparison of the sensitivity results between the methodologies is summarized in Table 1.
Table 1.
Comparison of the sensitivity of different methodologies to detect CVB1 in A549 cells.
| Method | Sensitivity (dilution) |
|---|---|
| RT-PCR (frozen cells) | |
| Semi-nested (Uppsala) | 10−8 |
| Real-time (Tampere) | 10−7 |
| Proteomics (frozen cells) | |
| LC/MRM/MS/MS | 10−7 |
| MRM | 10−7 |
| IHC (FFPE cells) | |
| Anti-EV VP1: Clone 5D8/1 | 10−4–10−6 |
| Anti-CVB4 VP1, –VP2, –VP3, –VP4 | 10−2–10−4 |
| ISH (FFPE cells) | |
| Probes: EV ABa, CVB1b (Affymetrix) | 10−4 |
| Probe: CVB1-6, CVB3 (RNAscope) | 10−4 |
Targets members of EV species A and B.
Serotype-targeted probe.
5. Discussion
The present study provides important information to guide the selection of assays capable of optimally detect EVs in infected cells. Although the conditions prevailing in mammalian cells infected in vitro do not completely resemble those in clinical tissue samples, the results provide a firm indication of the sensitivity and specificity of each method.
All methods tested were able to detect CVB1 with good sensitivity. However, depending on the method used, the detection limit varied and RT-PCR was found to be the most sensitive one.
The new LC/MRM/MS/MS technology also demonstrated high sensitivity, while its sensitivity might be still further improved by use of higher capacity columns that allow the loading of larger amounts of peptides. This technology has the particular advantage that identification and validation experiments are performed at the same time; the overlapping extracted ion chromatograms for the MRM transition pairs provide confirmation that the signals are derived from the same peptide and the MS/MS spectrum data can be used for protein identification in database searches. These data highlight the potential utility of using modern sensitive MS approaches to identify viral sequences with a relatively high sensitivity, suggesting that its applicability for virus detection in human samples should be evaluated in detail. The differences in sensitivities observed among the laboratories using IHC approaches with the same antibody, and also the laboratories employing ISH, could be explained by the low number of virus-positive cells present in the more diluted samples. Once these dilutions are reached, the actual number of virus-positive cells is very low (1–2 cells per field); thus, positivity may vary from one section to another when cells are plated for analysis. Importantly, the different antisera tested exhibited broadly similar profiles among the different laboratories with the 5D8/1 clone consistently demonstrating the highest sensitivity. ISH sensitivity depends on a number of variables including the affinity with which the relevant probe sets bind to the CVB1 genome. Therefore, we cannot conclude that IHC and ISH data have yielded absolute sensitivities in each laboratory, but rather they provide an indication of the sensitivity range of each method.
Each of the tested methods clearly has its own advantages. The proteomics-based LC/MRM/MS/MS provides important molecular information about the detected viruses based on peptide sequences. We have also previously used mass spectrometry imaging12 (MSI) to identify insulin and other proteins in pancreas tissue since the technology is useful for the identification and determination of the spatial distribution of molecules in tissues [16]. The preservation of tissue morphology is a clear advantage of IHC and ISH, thereby making it possible to localize the virus in individual cells. ISH appeared to be less sensitive than IHC, but this varied according to the type of antibodies used in IHC. The main advantage of RT-PCR is its high sensitivity and the possibility to derive sequence information from the viral genome.
This study also has certain limitations. Firstly, it was based on infected cells and not ex-vivo tissue samples, and therefore the relative sensitivity of each assay might be different when tissues are examined. Secondly, a single EV strain was used and, theoretically, the binding of antibodies, probes and primers to different EV strains may differ. However, the used antibodies bind to several different EV serotypes and strains, the used PCR primers amplify practically all EVs, the used ISH techniques allow specific probes to be designed, enabling the detection of the virus of interest [6], and proteomics analyses are not dependent on the EV type, suggesting that other EV strains should give comparable results. Third, it is difficult to exclude the possibility that in spite of the repeated washes of the infected cells during the preparation of infected cell arrays, remnants of extracellular viral peptides and RNA may have remained in the samples. This could have led to overestimation of the PCR and proteomics sensitivity, which can detect both intra-cellular and extracellular viruses compared to IHC and ISH, which mainly detect intracellular viruses. In addition, one needs to consider the fact that the sensitivity of RT-PCR and proteomics may depend on the sample volume, while ISH and IHC methods detect the virus on a thin (5 μm) tissue section. Thus, the results should be put into the context of these limitations and the use of more than one of these assays is recommended to reach optimal sensitivity and specificity.
In conclusion, all methods proved suitable for the detection of EV in FFPE or frozen samples. The new proteomics technologies offer one of the most attractive alternatives for frozen tissues, being relatively sensitive and providing sequence information about the detected virus. On the other hand, the new non-radioactive ISH methods work well in FFPE samples. Even if IHC and proteomics were relatively sensitive, RT-PCR remains one of the most sensitive methods when frozen or fresh samples are available. Importantly, this effort was launched as part of the collaborative efforts of the JDRF nPOD-V Working Group, and these results are guiding virus analyses of pancreas specimens collected from T1D patients.
Supplementary Material
Acknowledgments
Funding
None
This study was supported by JDRF grants for the nPOD-Virus Group, JDRF 25-2012-516 and JDRF 25-2012-770, the Diabetes Research Foundation in Finland, the Sigrid Juselius Foundation, the Academy of Finland and the European Commission (Persistent Virus Infection in Diabetes Network [PEVNET], Frame Programme 7, Contract No. 261441). Additional support was from a Diabetes Research Wellness Foundation Non-Clinical Research Fellowship and, since 2014, a JDRF Career Development Award (5-CDA-2014-221-A-N) to S.J.R. We thank Anne Karjalainen, Mervi Kekäläinen and Eeva Tolvanen (Department of Virology, School of Medicine, University of Tampere, Tampere, Finland), Eini Eskola and Marja-Leena Koskinen (Department of Pathology, School of Medicine, University of Tampere, Tampere, Finland), Sari Toivola (BioMediTech, University of Tampere, Tampere, Finland) and Inga Hansson (Uppsala University, Department of Immunology, genetics and pathology, Uppsala, Sweden), Ann Fu (Molecular Pathology Core, University of Florida, Gainesville, FL) for technical assistance.
Appendix A. Supplementary data
Supplementary data associated with this article can be found, in the online version, at http://dx.doi.org/10.1016/j.jcv.2016.01.015.
Footnotes
EV, enterovirus.
T1D, type 1 diabetes.
IHC, immunohistochemistry.
CVB, Coxsackievirus B.
FFPE, formalin-fixed paraffin-embedded.
BCA, bicinchoninic acid.
LC/MRM/MS/MS, liquid chromatography multiple reaction monitoring mass spectrometry.
QqQ, triple quadrupole mass spectrometer.
XIC, extracted ion chromatogram.
VP, viral protein.
EPI, enhanced product ion scan.
MSI, mass spectrometry imaging.
Conflict of interest
HH is a minor (<5%) shareholder and a member of the Board in Vactech Ltd., which develops vaccines and diagnostic assays for picornavirus infections.
Ethical approval
Not required
References
- 1.Tam PE. Coxsackievirus myocarditis: interplay between virus and host in the pathogenesis of heart disease. Viral Immunol. 2006;19:133–146. doi: 10.1089/vim.2006.19.133. [DOI] [PubMed] [Google Scholar]
- 2.Chia JKS. The role of enterovirus in chronic fatigue syndrome. J Clin Pathol. 2005;58:1126–1132. doi: 10.1136/jcp.2004.020255. [DOI] [PMC free article] [PubMed] [Google Scholar]
- 3.Krogvold L, Edwin B, Buanes T, et al. Detection of a low-grade enteroviral infection in the islets of langerhans of living patients newly diagnosed with type 1 diabetes. Diabetes. 2015;64:1682–1687. doi: 10.2337/db14-1370. [DOI] [PubMed] [Google Scholar]
- 4.Jaidane H, Sauter P, Sane F, et al. Enteroviruses and type 1 diabetes: towards a better understanding of the relationship. Rev Med Virol. 2010;20:265–280. doi: 10.1002/rmv.647. [DOI] [PubMed] [Google Scholar]
- 5.Oikarinen M, Tauriainen S, Oikarinen S, et al. Type 1 diabetes is associated with enterovirus infection in gut mucosa. Diabetes. 2012;61:687–691. doi: 10.2337/db11-1157. [DOI] [PMC free article] [PubMed] [Google Scholar]
- 6.Laiho J, Oikarinen S, Oikarinen M, et al. Application of bioinformatics in probe design enables detection of enteroviruses on different taxonomic levels by advanced in situ hybridization technology. J Clin Virol. 2015 doi: 10.1016/j.jcv.2015.06.085. Available from: http://www.sciencedirect.com/science/article/pii/S138665321500270X. [DOI] [PubMed]
- 7.Wang F, Flanagan J, Su N, et al. RNAscope: a novel in Situ RNA analysis platform for formalin-fixed, paraffin-embedded tissues. J Mol Diagn. 2012;14:22–29. doi: 10.1016/j.jmoldx.2011.08.002. [DOI] [PMC free article] [PubMed] [Google Scholar]
- 8.Honkanen H, Oikarinen S, Pakkanen O, et al. Human enterovirus 71 strains in the background population and in hospital patients in Finland. J Clin Virol. 2013;56:348–353. doi: 10.1016/j.jcv.2012.11.018. [DOI] [PubMed] [Google Scholar]
- 9.Wang HX, Qian WJ, Mottaz HM, et al. Development and evaluation of a micro- and nanoscale proteomic sample preparation method. J Proteome Res. 2005;4:2397–2403. doi: 10.1021/pr050160f. [DOI] [PMC free article] [PubMed] [Google Scholar]
- 10.Guo X, Ward MD, Tiedebohl JB, et al. Interdependent phosphorylation within the kinase domain T-loop regulates CHK2 activity. J Biol Chem. 2010;285:33348–33357. doi: 10.1074/jbc.M110.149609. [DOI] [PMC free article] [PubMed] [Google Scholar]
- 11.Anderson L, Hunter CL. Quantitative mass spectrometric multiple reaction monitoring assays for major plasma proteins. Mol Cell Proteomics. 2006;5:573–588. doi: 10.1074/mcp.M500331-MCP200. [DOI] [PubMed] [Google Scholar]
- 12.Cox DM, Zhong F, Du M, et al. Multiple reaction monitoring as a method for identifying protein posttranslational modifications. J Biomol Tech. 2005;16:83–90. [PMC free article] [PubMed] [Google Scholar]
- 13.MacLean B, Tomazela DM, Shulman N, et al. Skyline: an open source document editor for creating and analyzing targeted proteomics experiments. Bioinformatics. 2010;26:966–968. doi: 10.1093/bioinformatics/btq054. [DOI] [PMC free article] [PubMed] [Google Scholar]
- 14.Richardson S, Leete P, Dhayal S, et al. Evaluation of the fidelity of immunolabelling obtained with clone 5D8/1, a monoclonal antibody directed against the enteroviral capsid protein, VP1, in human pancreas. Diabetologia. 2013 doi: 10.1007/s00125-013-3094-7. [DOI] [PubMed] [Google Scholar]
- 15.Richardson SJ, Leete P, Dhayal S, et al. Detection of enterovirus in the islet cells of patients with type 1 diabetes: what do we learn from immunohistochemistry? Reply to S.F. Hansson, S. Korsgren, F. Ponten et al. [letter] Diabetologia. 2014;57:647–649. doi: 10.1007/s00125-013-3138-z. [DOI] [PubMed] [Google Scholar]
- 16.Green-Mitchell SM, Cazares LH, Semmes OJ, et al. On-tissue identification of insulin: in situ reduction coupled with mass spectrometry imaging. Proteomics Clin Appl. 2011;5:448–453. doi: 10.1002/prca.201000152. [DOI] [PMC free article] [PubMed] [Google Scholar]
Associated Data
This section collects any data citations, data availability statements, or supplementary materials included in this article.


