Summary
The organization of the genome in the nucleus and the interactions of genes with their regulatory elements are key features of transcriptional control and their disruption can cause disease. We developed a novel genome-wide method, Genome Architecture Mapping (GAM), for measuring chromatin contacts, and other features of three-dimensional chromatin topology, based on sequencing DNA from a large collection of thin nuclear sections. We apply GAM to mouse embryonic stem cells and identify an enrichment for specific interactions between active genes and enhancers across very large genomic distances, using a mathematical model ‘SLICE’ (Statistical Inference of Co-segregation). GAM also reveals an abundance of three-way contacts genome-wide, especially between regions that are highly transcribed or contain super-enhancers, highlighting a previously inaccessible complexity in genome architecture and a major role for gene-expression specific contacts in organizing the genome in mammalian nuclei.
Our understanding of nuclear architecture and organization has improved dramatically over the past decade, mainly due to parallel developments in microscopy and molecular methods for capturing the spatial organization of the genome. The introduction of chromatin conformation capture (3C)1 and the emergence of its high-throughput descendants such as 4C2, 5C3, GCC4, Hi-C5–9 and ChIA-PET10 have led to a number of major breakthroughs. These include the identification of large self-associating regions called topologically associating domains (TADs)3,5, the elucidation of links between spatial positioning and the DNA replication program11,12 and the structural dissection of mitotic chromatin13,14. However, 3C-based approaches have important limitations, due to their reliance on digestion and ligation to capture interacting DNA segments15–20. Importantly, they have limited power to unequivocally quantify simultaneous contacts between multiple chromatin regions; for example although the detection of triplet contacts is possible, it is non-quantitative and inefficient (yielding <1% triplet contacts7,21,22). Other, more technical limitations of 3C are biases due to GC content, protein occupancy and restriction site density20,23–25, which can lead to discrepancies between 3C-based methods and 3D-fluorescence in situ hybridisation (FISH)18 that complicate data interpretation. Finally, 3C-based methods are inherently unable to measure other important aspects of chromatin organization, such as chromatin associations with the nuclear periphery or chromatin compaction, which rely on independent technologies26,27.
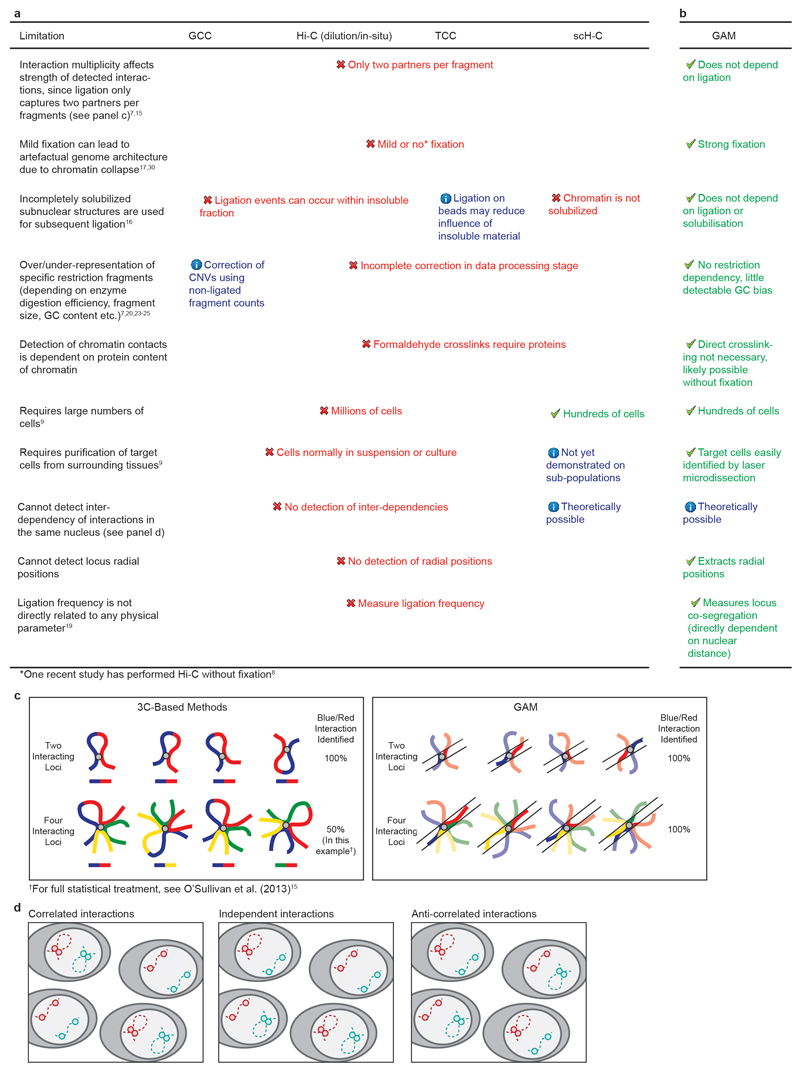
With an expanding catalogue of disease-associated DNA variants assigned to non-coding genomic sequences28, it remains essential to identify possible target genes in unbiased and precise ways. Here, we present Genome Architecture Mapping (GAM), the first genome-wide method for capturing three-dimensional (3D) proximities between any number of genomic loci without ligation. GAM overcomes several limitations of 3C-based methods, whilst presenting advantages in clinical application and requiring low cell numbers (Extended Data Fig. 1).
Principle of the method
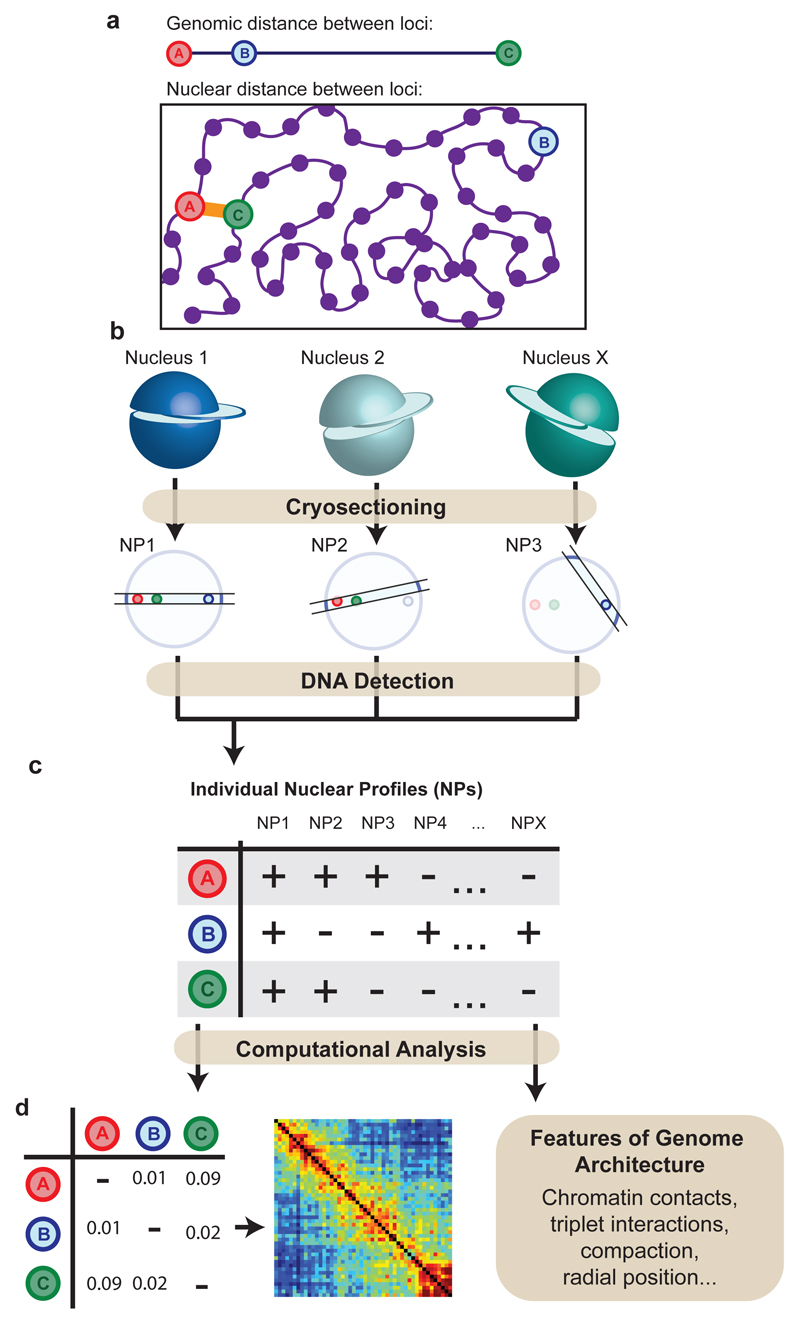
GAM applies a concept previously used for linear genomic distance mapping29 to measure 3D distances by combining ultracryosectioning with laser microdissection and DNA sequencing. By determining the presence/absence of all genomic loci in a set of single slices collected at random orientations from a population of nuclei, GAM infers parameters of chromatin spatial organization, including genome-wide chromatin contact frequencies, radial distributions and chromatin compaction. Structurally preserved, fixed cells embedded in sucrose and frozen30,31 are thinly cryosectioned, before isolating single nuclear profiles (NPs) by laser microdissection. The DNA content of each NP is extracted, amplified and sequenced. Loci that are closer to each other in the nuclear space (but not necessarily on the linear genome) are detected in the same NP more often than distant loci (Fig. 1a,b). The co-segregation of all possible pairs of loci among a large collection of NPs sliced at random orientations is used to create a matrix of inferred locus proximities, allowing the calculation of chromatin contacts genome-wide (Fig. 1c,d).
Figure 1. Concept of Genome Architecture Mapping.
a, Physical interactions between genomic loci do not follow linear genomic position. b, Physically proximal loci are found more frequently in the same thin nuclear section (nuclear profile; NP) than distant loci. c, Loci present in each NP are identified. d, Locus co-segregation scored in a large collection of NPs is used to infer preferred contacts, radial position and compaction of each locus.
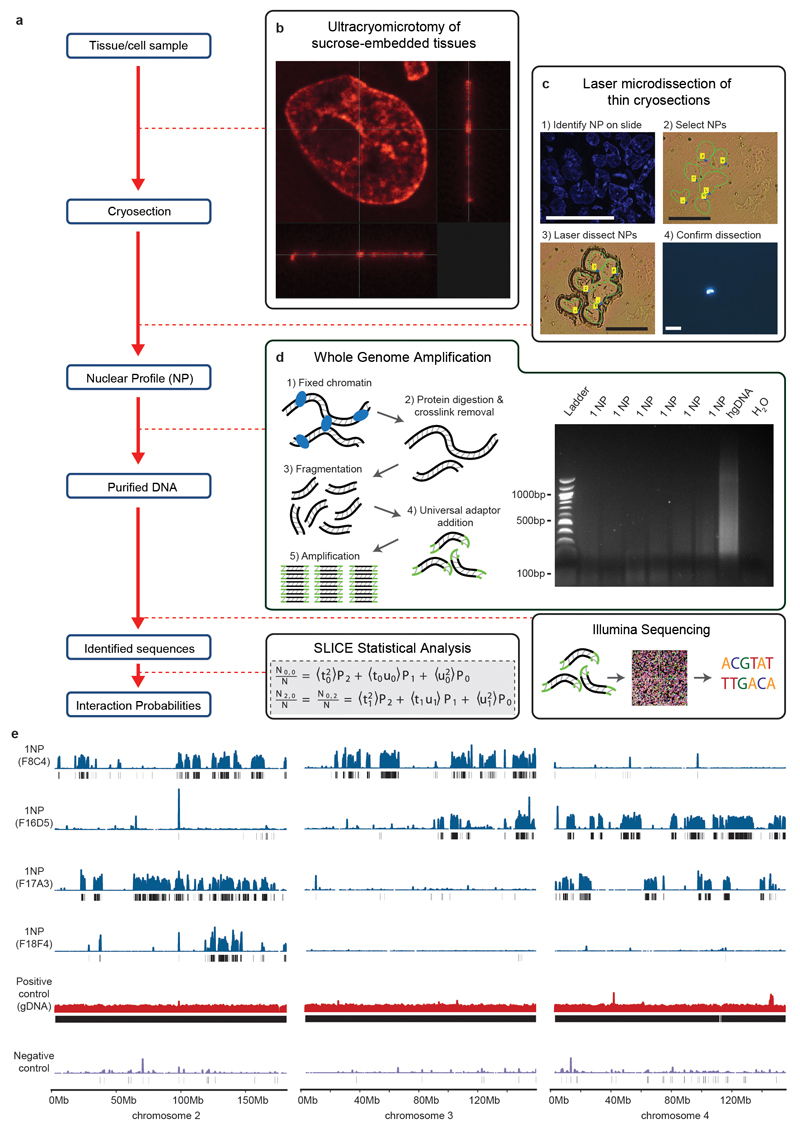
We applied GAM to mouse embryonic stem cells (mESCs) where abundant data is available relating to chromatin contacts and chromatin occupancy at enhancers and promoters5,26,32–35. mESCs were fixed in optimal conditions, and cryosectioned at a thickness of ~0.22 μm30,31,36,37. Each NP was isolated into a single PCR tube by laser microdissection (Extended Data Fig. 2a-c). The DNA content of each NP was extracted, fragmented, amplified using single-cell whole genome amplification (WGA)38, and sequenced using Illumina technology (Extended Data Fig. 2d,e). UCSC Genome Browser tracks of mapped reads from single NPs show that each NP contains a different complement of chromosomes and sub-chromosomal regions, as expected from chromatin passing in and out of each thin nuclear slice (Extended Data Fig. 2e).
Efficiency of locus detection with GAM
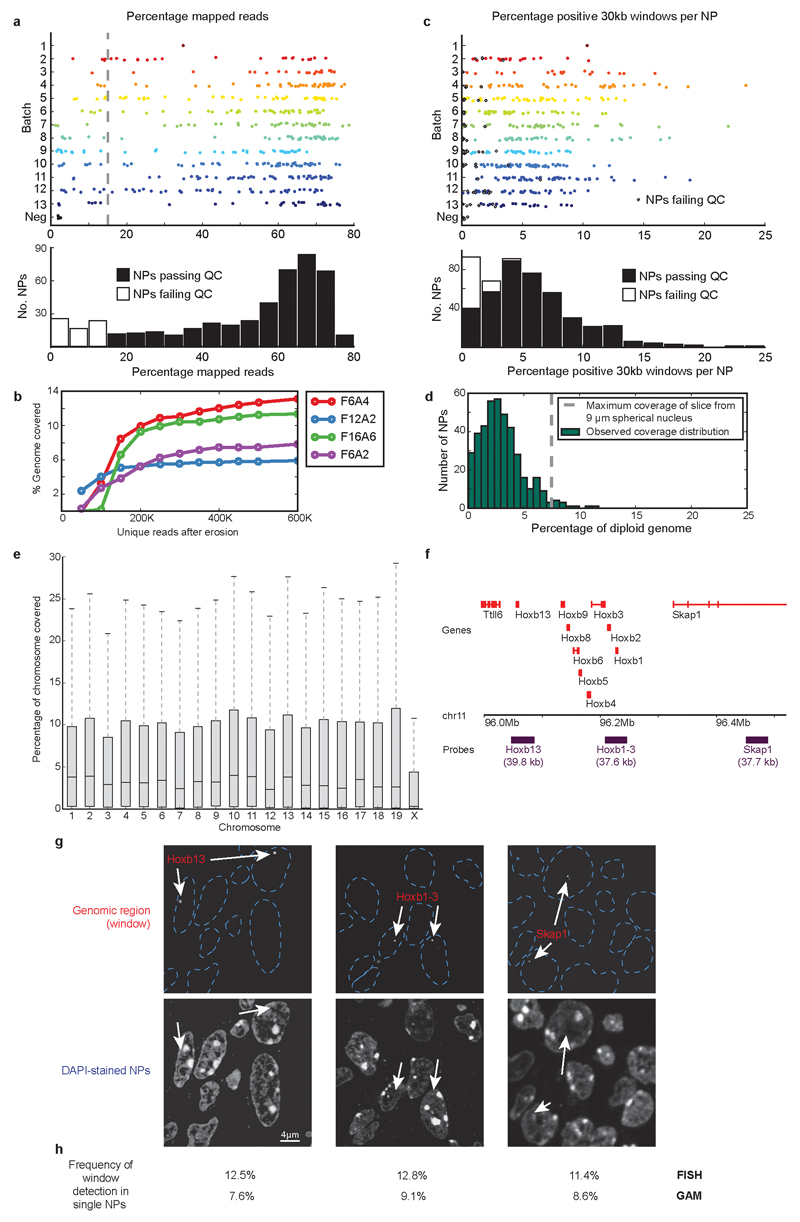
To map chromatin contacts genome-wide using GAM, we collected 471 NPs from mESCs at a mean sequencing depth of 1.1 million reads per NP (Supplementary Table 1). We selected 408 high quality NPs (the mESC-400 dataset) based on a combination of criteria (see Methods and Extended Data Fig. 3a). As the resolution of GAM is not fixed but directly dependent on the sequencing depth and on the number of NPs sequenced, we first estimated the optimal number of reads required to detect most windows. We find that 400,000 uniquely mapped reads per NP are required to detect >80% of positive windows at 30 kb resolution (Extended Data Fig. 3b).
To explore the genome coverage attained in the mESC-400 dataset, we computed the detection of 30 kb windows genome-wide. Single NPs contained an average of 6±4% (s.d.) of all 30 kb windows, as expected from the average proportion of the mESC nuclear volume contained in each NP (Extended Data Fig. 3c,d; Supplementary Note 1). The equal detection of mouse chromosomes known to occupy different preferred radial positions in mESCs35 is consistent with random collection of NPs (Extended Data Fig. 3e). Finally, comparisons with FISH confirm efficient detection of ~40 kb regions in GAM (Extended Data Fig. 3f-h).
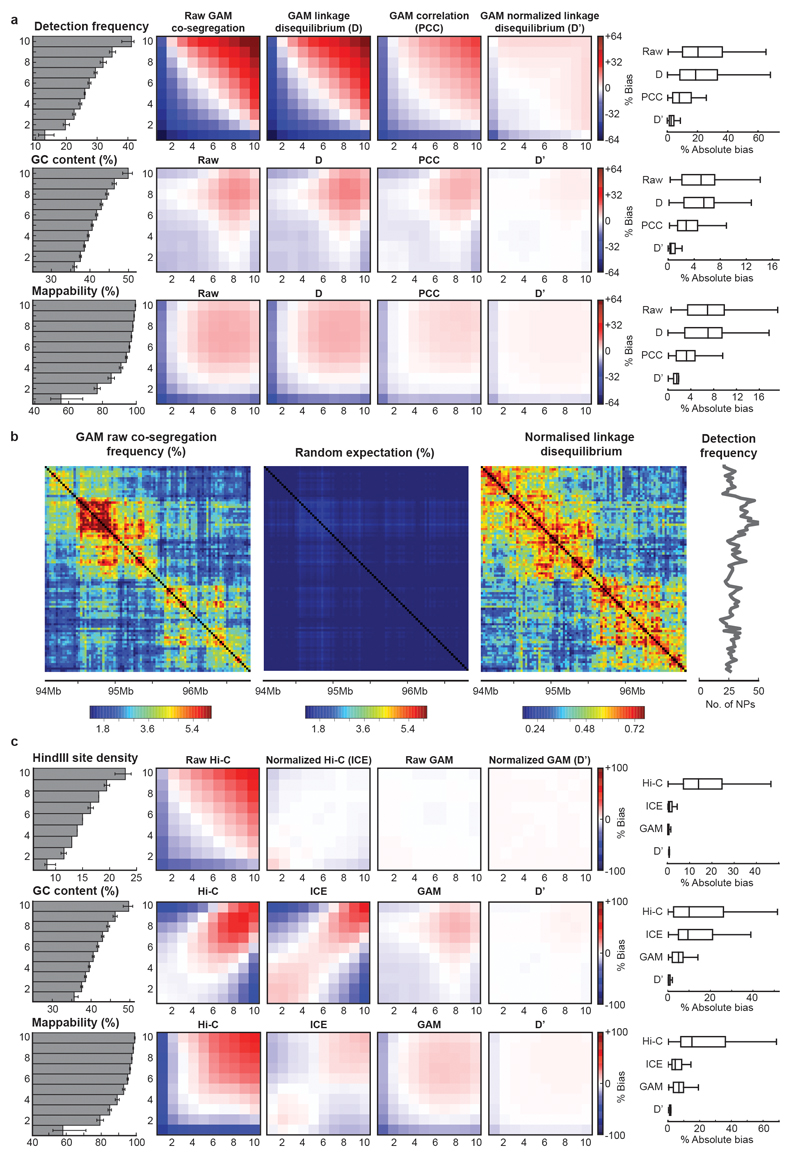
To consider variations in window detection, we tested different normalization approaches and found that the normalized linkage disequilibrium39 best reduced bias due to window detection frequency, GC content and mappability (Extended Data Fig. 4a,b). We find that GAM matrices show fewer biases than ICE23-corrected Hi-C matrices before and after normalization (Extended Data Fig. 4c).
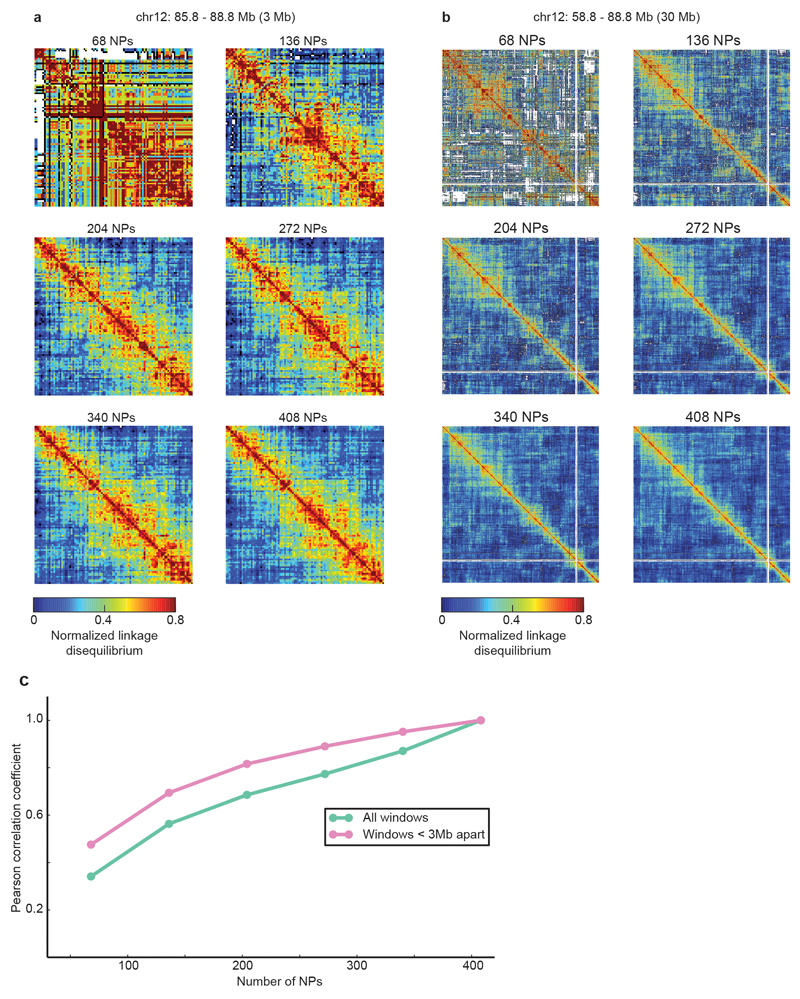
To further test the suitability of the mESC-400 dataset to study chromatin contacts at 30 kb resolution, we measured its reproducibility by erosion and find that most contact information is already obtained with 272 NPs (correlation coefficient is 0.77, which rises to 0.89 for contacts within 3Mb; Extended Data Fig. 5).
Mapping chromatin contacts using GAM
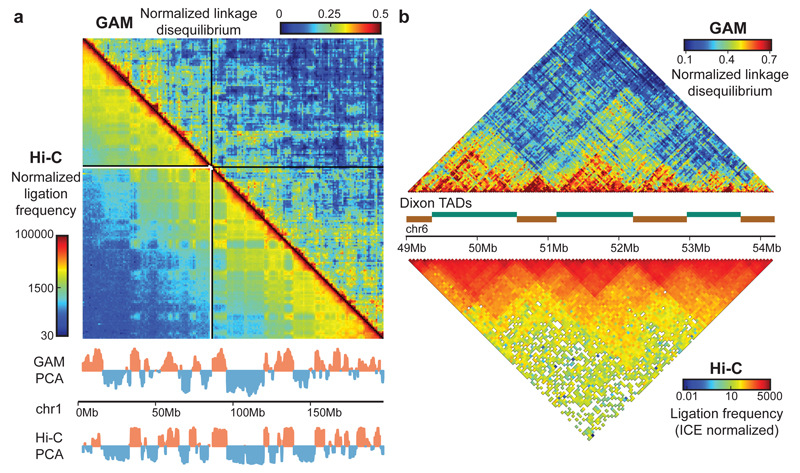
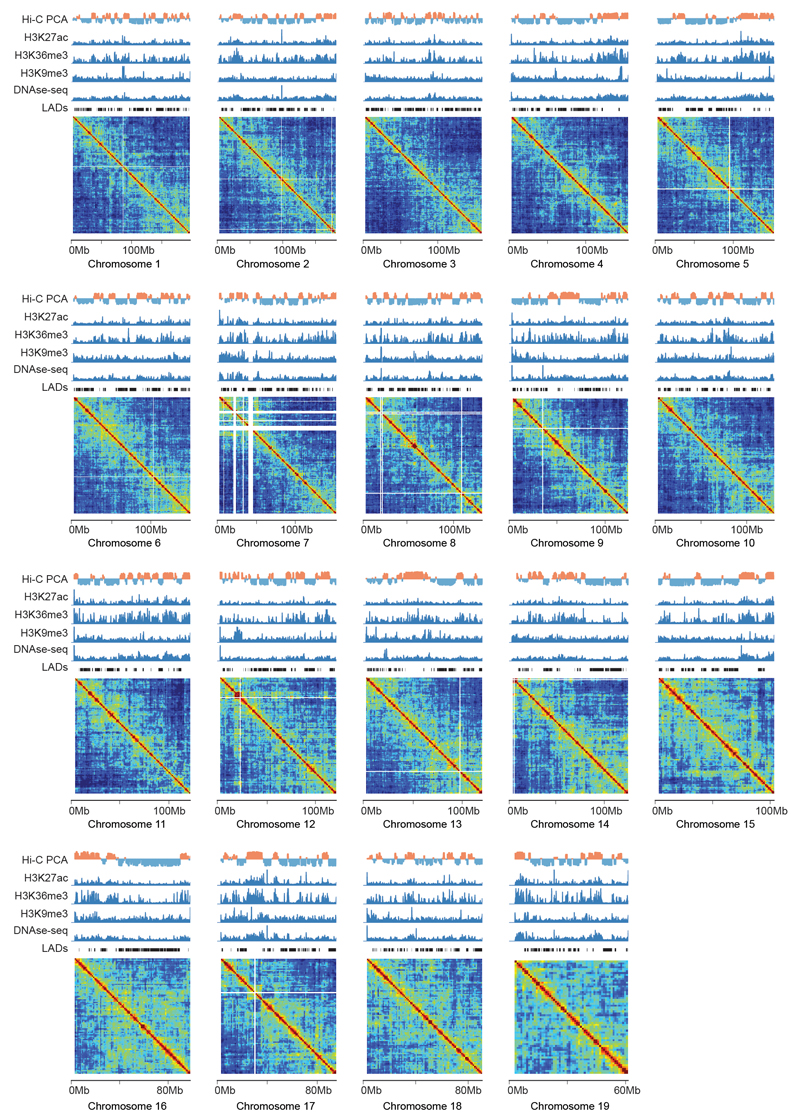
Before investigating in detail the properties of chromatin contacts detected by GAM, we tested whether the mESC-400 dataset captures general features of chromatin architecture previously identified by 3C-based approaches, in particular the detection of compartments A/B6 and of topologically associating domains (TADs3,5; Fig. 2; Extended Data Fig. 6; 7a-c). GAM and Hi-C contact matrices are highly correlated across whole chromosomes at 1Mb genomic resolution (0.63 Spearman's rank correlation coefficient; range 0.43 to 0.71 for individual chromosomes).
Figure 2. GAM independently reproduces general features of genome architecture identified by Hi-C.
a, GAM and Hi-C identify similar A and B compartments by PCA at 1Mb resolution. b, GAM independently identifies TADs.
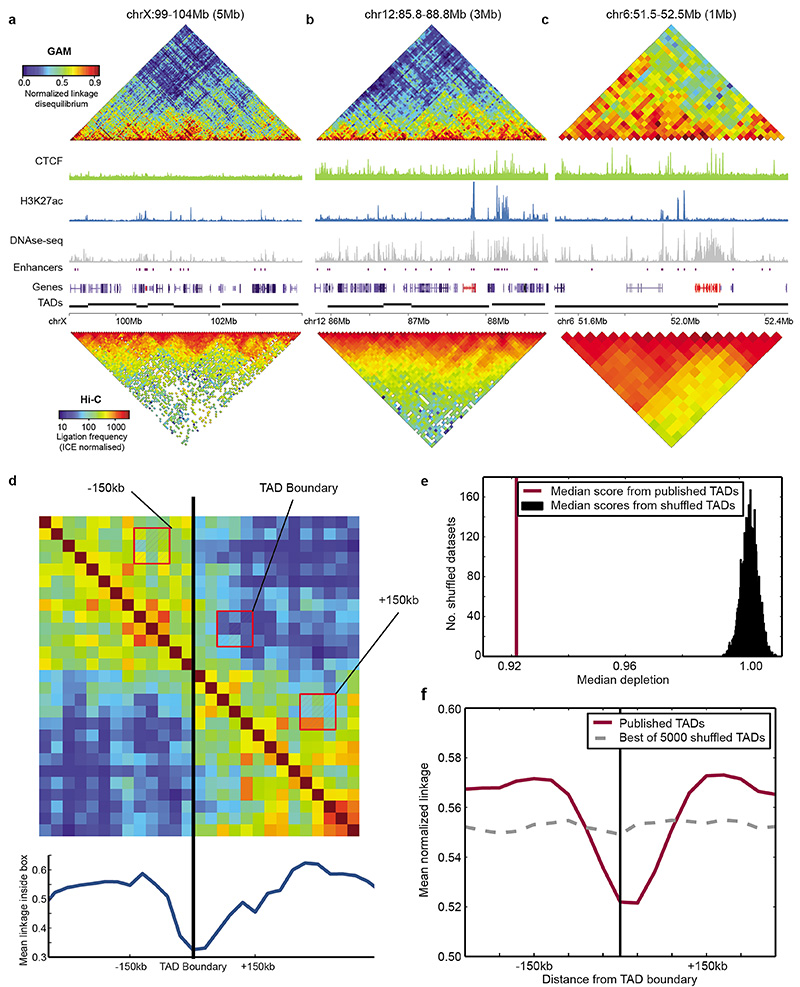
Earlier Hi-C studies have used principal component analysis (PCA) to classify all genomic loci into two compartments, A and B, based on their contact preference6. Compartments detected by PCA in the GAM dataset overlap significantly with Hi-C-derived compartments (Fisher’s exact test, P < 1x10-15; Fig. 2a), with 65% of 1Mb windows being assigned to the same compartment, rising to 75% for the 50% windows with the strongest compartmentalization. GAM contact matrices also independently confirm the existence of TADs3,5 (Fig. 2b; Extended Data Fig. 7d-f).
Identifying prominent interactions
Chromatin is in constant local motion in the cell nucleus, and adopts different conformations both across the cell population and over time. Maps of 3D genome proximity not only measure specific physical interactions but also random contacts, which are heavily dependent on linear genomic distance. A unique feature of GAM is that the detection of genomic windows is independent of their interaction with other regions. Thus, the “background” co-segregation frequency expected for non-interacting loci can be directly quantified across the genome for each genomic distance. We developed SLICE, a general mathematical model that identifies the interactions most likely to be specific (i.e. non-random according to genomic distance) from GAM co-segregation data.
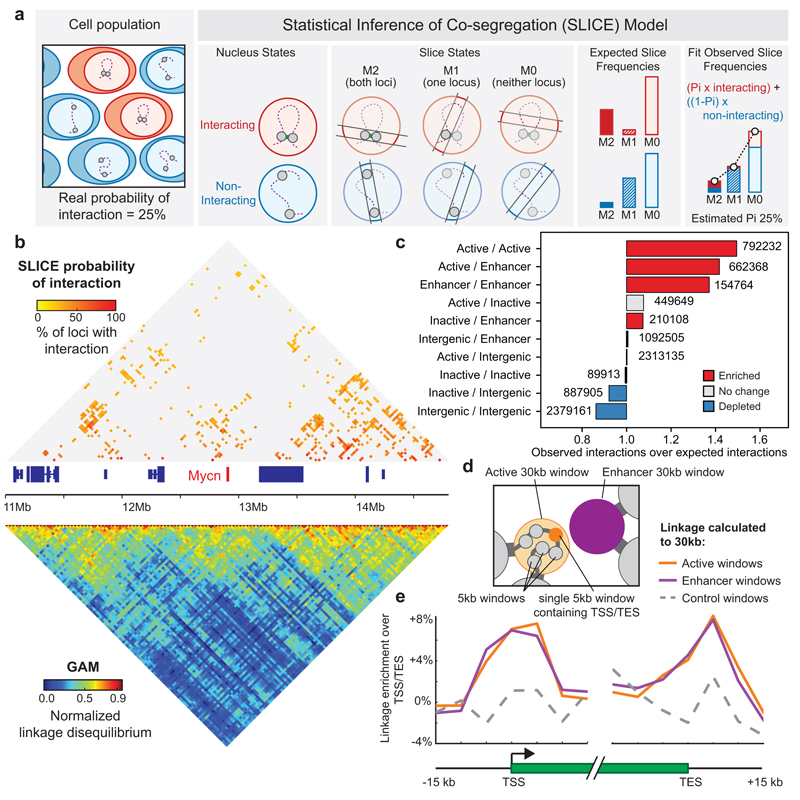
SLICE calculates a “Probability of Interaction” (or Pi), which is an estimate of the proportion of specific interactions for each pair of loci at a given time across the cell population (Fig. 3a). SLICE is fully described in Supplementary Note 1. To identify the most specific interactions in the mESC-400 dataset, we applied the SLICE model genome-wide (Supplementary Note 2). For further analyses, we considered only “prominently interacting” locus pairs that had a larger than expected Pi at a threshold of P ≤ 0.05, corresponding to locus pairs that most often co-segregate in the same slice (Extended Data Fig. 8a). As expected, Pi matrices are sparser than those of GAM co-segregation (Fig. 3b) or Hi-C ligation frequency (Extended Data Fig. 8b). These prominent chromatin contacts are therefore the best candidates to denote bases of chromatin loops formed by specific interactions at each genomic distance.
Figure 3. Enhancers and active genes are enriched among specifically interacting genomic regions detected using the SLICE statistical model.
a, SLICE model. Locus pairs across the genome exist in interacting or non-interacting states. Slicing through nuclei generates NPs containing both loci (M2), one locus (M1) or neither locus (M0) in different frequencies for interacting and non-interacting loci. The probability of interaction (Pi) is estimated by comparing observed with modelled state frequency. b, Prominent interactions (P ≤ 0.05) in a 3 Mb region. c, Enrichment of genomic features calculated relative to random permutation. d, Scheme for testing whether Active and Enhancer 30 kb windows preferentially contact the 5 kb window overlapping the active gene transcription start site (TSS) or transcription end site (TES). e, Average linkage from 5 kb windows overlapping active gene TSSs or TESs to prominently interacting 30 kb Active windows, Enhancer windows or non-interacting Active windows (control windows).
To study the influence of gene expression state on chromatin interactions, we classified each genomic 30 kb window according to its expression level in mESCs and the presence of putative mESC enhancers34. We found many interactions involving enhancer regions, active genes (FPKM > 1) or inactive genes (FPKM < 0.01; Extended Data Fig. 8c). The number of interactions decreases with genomic distance, as expected, but spans many tens of Mb. For example, of 4.5 million interactions involving active genes, 3.0 million span less than 60 Mb whilst 1.5 million span greater than 60 Mb (Extended Data Fig. 8d).
Next, we tested whether active genes, enhancers or inactive genes interact with each other more or less frequently than expected given their genomic distribution. Strikingly, we find an over-representation of interactions connecting active genes and enhancers (permutation test, P < 0.002), whereas inactive genes interact no more frequently than expected by chance (Fig. 3c). Further analyses verified that interactions within and between active genes and enhancer regions are a robust feature of the mESC-400 dataset (Extended Data Fig. 8e-i).
To examine more closely the nature of the interactions between 30 kb windows containing active genes or enhancers, we asked whether they are positioned specifically over the enhancer and/or gene of interest at 5 kb resolution (Fig. 3d). Interacting Active or Enhancer windows preferentially contact 5 kb windows containing the enhancer compared with 5 kb windows that lie 15 kb upstream or downstream (Extended Data Fig. 8j; paired t-test, P < 10-10). Preferred contacts are also seen between transcription start sites (P < 10-10) or transcription end sites (P < 2x10⁻³) and interacting Enhancer or Active 30 kb windows, but not for non-interacting Enhancer windows (P > 0.4, Fig. 3e). Therefore, GAM identifies preferred contacts of enhancer-containing genomic loci not only with gene promoters, but also through the region downstream of the polyadenylation site traversed by RNA polymerase II before termination40.
Taken together, these results identify interactions between regulatory sequences and active genes as major organizers of chromatin conformation. The specificity of contact detection with GAM suggests that it will be a powerful method for dissecting the cascade of enhancer-dependent events that accompany the transcription cycle41 and the role of specific SNPs and other genomic variants in genome folding and misregulated gene expression.
Detecting interacting triplets
GAM can capture many additional aspects of chromatin spatial organization genome-wide, such as the radial distributions of chromosomes and sub-chromosomal regions (Extended Data Fig. 9a,b), chromatin compaction (Extended Data Fig. 9c,d) and multivalent chromatin interactions involving three or more genomic regions. We were particularly interested in exploring whether the mESC-400 dataset already held enough information to reveal multivalent interactions. Detailed analyses of GAM statistics (Supplementary Notes 1 and 2) indicate that the current mESC-400 dataset allows detection of triplet contacts at the resolution of hundreds of kilobases, which corresponds to the chromatin organization level of TADs.
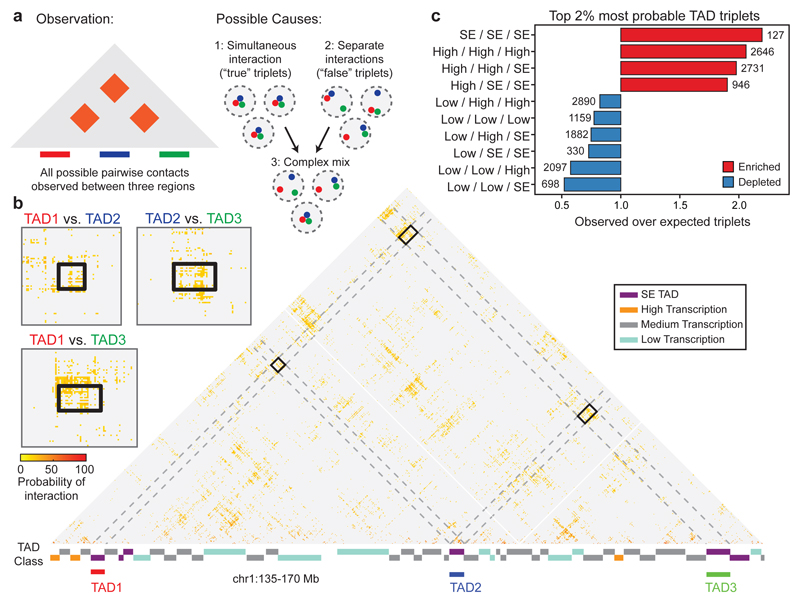
To distinguish true, simultaneous triplet interactions between TADs from the superposition of independent pairwise events that do not occur in the same cell (Fig. 4a), we extended SLICE to consider triplets and calculated a triplet score that reflects the likelihood of simultaneous, triplet interactions for each possible combination of three TADs. We further select the most likely TAD triplets by retaining only the 2% highest scoring (~101,000 “top TAD triplets”; Fig. 4b; Extended Data Fig. 10a; Supplementary Table 2).
Figure 4. Super-enhancers are highly enriched among the most highly interacting TAD triplets.
a, The detection of three simultaneously interacting regions cannot be inferred from pairwise contact data alone. b, Example of a three-way interaction between TADs on chromosome 1 detected by SLICE. Large matrix shows prominent pairwise interactions over the entire region; small matrices show zoom of prominent interactions between the three TADs. c, Enrichment or depletion of different TAD classes in triplet interactions, relative to the value obtained after random shuffling of triplet positions.
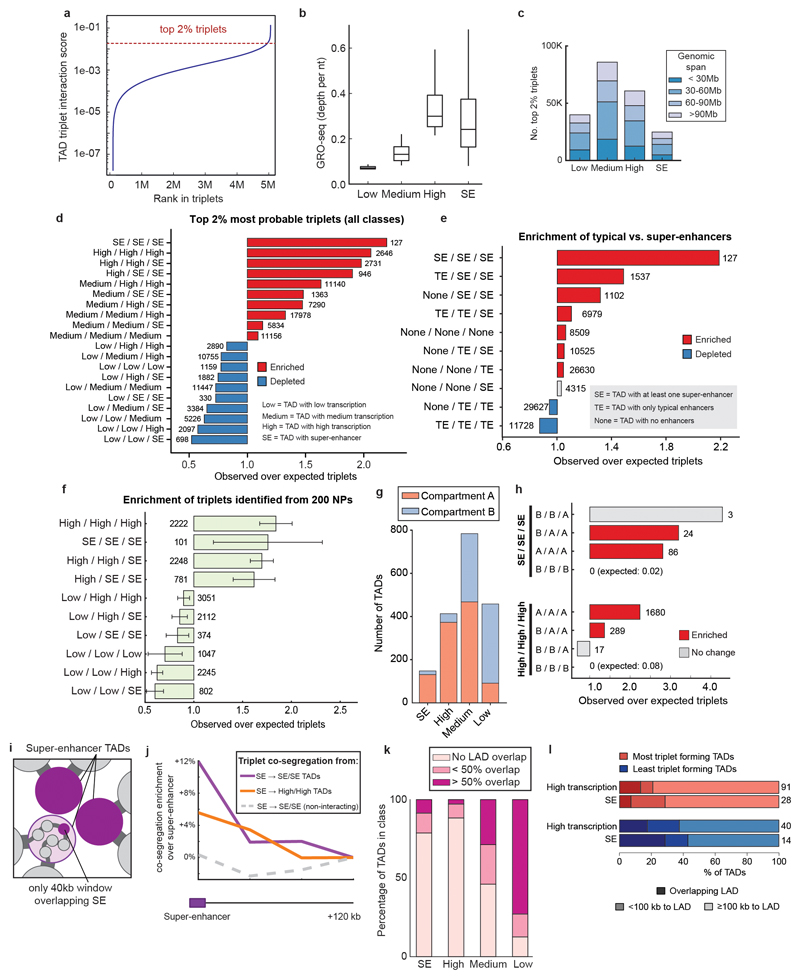
To assess the properties of the top TAD triplets, we classified TADs across the whole genome according to the presence of super-enhancers (SEs)34. TADs that did not contain SEs were classified in three additional categories according to their level of transcription using published GRO-seq data33 (low-, medium- or highly-transcribed; Extended Data Fig. 10b). Remarkably, the set of top triplets spans a large range of genomic distances and contains TADs in all four categories; for example, of ~25,000 triplets involving SEs, 81% span between 30 and 116 Mb (Extended Data Fig. 10c). We found that the top TAD triplets are significantly enriched for contacts that connect three SE-containing TADs (Fig. 4c; Extended Data Fig. 10d), but not for triplets involving TADs that contain only typical enhancers (Extended Data Fig. 10e). Remarkably, the top TAD triplets are also enriched for contacts formed between highly transcribed TADs, or combinations of SE and highly transcribed TADs, consistent with previous observations that active genes co-localize42,43 and that gene-rich R bands cluster44 in mammalian nuclei. These observations were also confirmed using subsamples of the mESC-400 dataset and found not to be a trivial consequence of A/B compartmentalization (Extended Data Fig. 10f-h). Therefore, SE-containing and highly transcribed TADs form clusters where multiple preferred partners interact simultaneously in 3D space in mESCs, expanding on previous observations of clustering of bound Sox245 and of pairwise contacts between super-enhancers detected by Hi-C46. Furthermore, we considered whether triplet SE-TAD associations might be driven by the SEs and found that SE-containing 40 kb windows co-segregate more frequently with the two other SE-TADs in their triplet than 40 kb windows located 120 kb upstream or downstream (paired t-test, P < 10-6; Extended Data Fig. 10i,j).
Next, we explored the role of the nuclear lamina in constraining triplet interactions, by scoring TAD proximity to lamina-associated domains27 (LADs; Supplementary Table 3). SE-containing and highly transcribed TADs that overlap or are close to LADs are involved in fewer triplet interactions (Extended Data Fig. 10k,l), indicating that TAD proximity to the nuclear lamina might restrict their access for interaction with more central enhancer clusters.
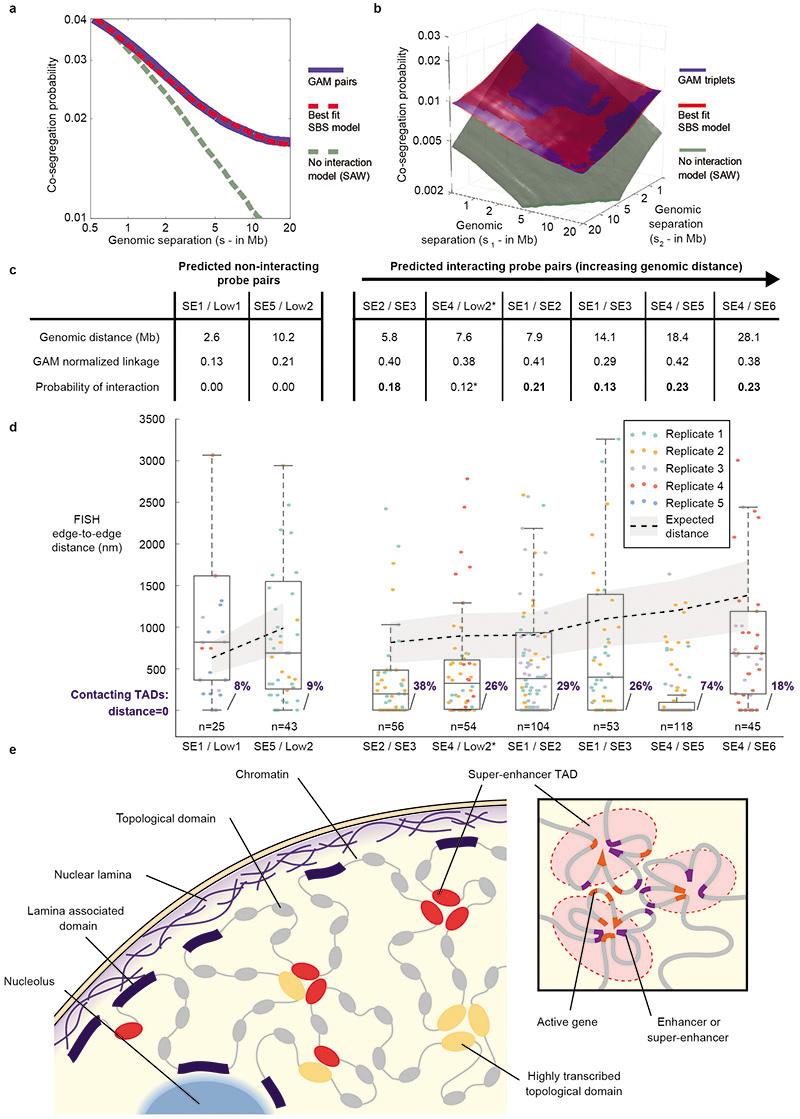
To investigate the contribution of complex contacts between multiple genomic regions more globally, we calculated the genome-wide co-segregation probabilities between all window pairs or triplets in the GAM data. The scaling of these probabilities with genomic distance is not consistent with a polymer model that lacks specific interactions (the self-avoiding walk polymer model). In contrast, we found that the observed scaling is consistent across large genomic distances with a polymer model that considers pair and triplet contacts as abundant features of chromatin folding (Strings & Binders Switch (SBS) polymer model; Extended Data Fig. 11a,b), in agreement with recent simulations of specific DNA loci47.
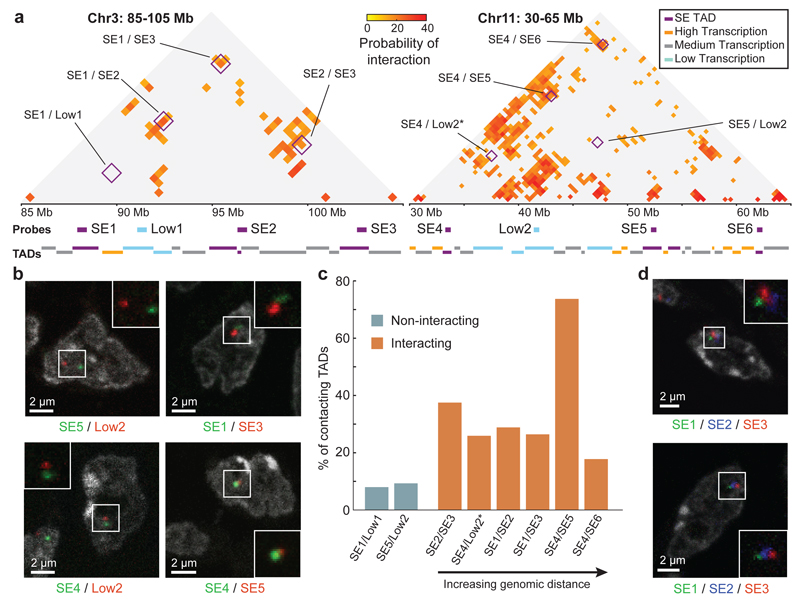
To explore the spatial conformation of SE-TAD interactions by an independent approach, we performed cryoFISH experiments on two sets of four TADs, spanning 15 and 29 Mb respectively. Each set contains three SE-TADs (SE1/SE2/SE3 or SE4/SE5/SE6) and one non-interacting low-transcribed TAD (Low1 or Low2, respectively; Fig. 5a; Supplementary Table 4). In the first region (containing Low1 and SE1-3), Low1 is not expected to interact with any SE, whereas in the second region (containing Low2 and SE4-6), Low2 is predicted to have a pairwise interaction with SE4 (Pi=0.12) but not with SE5 or SE6 (Fig. 5a,b). Contact frequencies measured for six interacting and two non-interacting pairwise combinations of TADs (Fig. 5b,c) show that TADs predicted to interact by GAM contact each other more frequently by FISH (18-74%) than non-interacting TADs (8-9%). The >50% interaction between SE4 and SE5 is particularly striking, due to their 19Mb linear separation. We also measured the median physical distance between TADs (Extended Data Fig. 11c,d; Supplementary Table 5) and found interacting TAD pairs at shorter physical distances than non-interacting TADs. Finally, three-colour FISH for SE1, SE2 and SE3 identifies examples of triplet TAD clustering in the same cell (Fig. 5d).
Figure 5. Complex interactions between SE-TADs span tens of megabases.
a, SLICE probability of interaction (Pi) matrices for two genomic regions spanning 20 and 35 Mb. Positions of 500 kb FISH probes are indicated. Interactions between tested combinations of TADs are indicated (purple boxes). *The predicted Pi for SE4/Low2 is not represented in the matrix as it falls just below the significance threshold at their genomic distance. b, CryoFISH images of DAPI-stained cryosections highlight examples of interacting and non-interacting TAD pairs. c, Frequency of TAD-TAD contacts from cryoFISH images. d, Images show examples of TAD triplets.
Discussion
GAM is a novel, ligation-free method for capturing chromatin contacts in an unbiased manner, independent of FISH and conformation-capture technologies. Using GAM, we uncover a complex organization of the 3D structure of chromatin in mESCs, where functional genomic regions underlie specific chromatin contacts (Extended Data Fig. 11e). Especially notable is the enrichment for pairwise chromatin interactions between enhancer elements and active genes, particularly at transcription start and termination sites (Fig. 3e). The enhancer interaction pattern mirrors the average distribution of RNA polymerase II over active genes32, which is of particular interest in the light of recent evidence for enhancer interactions that track with polymerase progression through coding regions during transcription elongation48. Moreover, the identification of abundant three-way TAD interactions, where multiple strong enhancers and highly transcribed regions associate simultaneously in the same nucleus, reveals that regulatory elements form higher-order contacts across large genomic regions.
With larger GAM datasets containing several thousand NPs and further developments of SLICE, it will become possible to extract a variety of spatial parameters to measure, at higher resolution, pairwise, triplet and higher multiplicity contacts, locus volume and radial positioning genome-wide, and the inter-dependency of different contacts. Most importantly, GAM requires small numbers of cells and is applicable to rare cell types specifically selected by microdissection from precious tissue samples, potentially including those obtained from biopsies of individual patients.
In summary, GAM is a powerful new tool in the genome biologist’s repertoire that significantly expands our ability to finely dissect 3D chromatin structures, rendering many previously unanswerable questions experimentally tractable in a wider range of model systems, cell types and valuable human samples.
Methods
Cell culture
The mESCs used for this study were the 46C line49, a Sox1-GFP derivative of E14tg2a and gift of Domingos Henrique (Institute of Molecular Medicine, Lisbon, Portugal). mESC culture was carried out as previously described50. Briefly, cells were grown at 37°C in a 5% CO2 incubator in Glasgow Modified Eagles Medium, supplemented with 10% fetal bovine serum, 2 ng/ml LIF and 1 mM 2-mercaptoethanol, on 0.1% gelatin-coated dishes. Cells were passaged every other day. After the last passage 24h before harvesting, mESCs were re-plated in serum-free ESGRO Complete Clonal Grade medium (Millipore Inc.). mESCs were routinely tested for mycoplasma contamination.
Preparation of cryosections
Ultrathin nuclear cryosections can be produced in the absence of resin embedding, by the Tokuyasu method51. This method preserves cellular architecture comparable to that observed in unfixed cryosections and maximizes the retention of nuclear proteins30,31,36,37. ESC-46C cells were prepared for cryosectioning as described previously37. Briefly, cells were fixed in 4% and 8% freshly-depolymerized (EM-grade) paraformaldehyde in 250 mM HEPES-NaOH (pH 7.6; 10 min and 2h, respectively), pelleted and embedded in saturated 2.1 M sucrose in PBS to prevent ice crystal damage before freezing in liquid nitrogen on copper stubs. Ultrathin cryosections were cut using an Leica ultracryomicrotome (UltraCut UCT 52 with EM FCS cryounit; Leica Microsystems, Milton Keynes, UK) at ~220 nm thickness, captured on sucrose-PBS drops and transferred to 1mm PEN membrane covered glass slides for laser microdissection (Leica, Milton Keynes, UK). Sucrose embedding medium was removed by washing with 0.2 µm filtered molecular-biology grade PBS (3x 5 min each), then with filtered ultra-pure H2O (3x 5 min each) and dried (15 min). In a few cases, the third PBS wash was substituted for a 5 min stain with molecular-biology grade propidium iodide (1 µg/ml in PBS; listed in Supplementary Table 1). The fixation protocol chosen provides optimal preservation of active RNA polymerases, nuclear components (such at TATA-binding protein) and nuclear architecture, unlike other commonly used fixation protocols using lower concentrations of formaldehyde in PBS buffers30.
Isolation of nuclear profiles
Individual NPs were isolated from cryosections by laser microdissection using a PALM Microbeam Laser microdissection microscope (Carl Zeiss, Jena, Germany). Nuclei were identified under bright-field imaging and the laser was used to cut the PEN membrane surrounding each nucleus. Cut NPs were then catapulted using the Laser Pressure Catapult into a PCR Cap Strip filled with opaque adhesive material. One well in each strip of eight was left empty and taken through the WGA process as a negative control. Five of these negative controls were also used to make sequencing libraries as negative controls, whilst genomic DNA isolated from E14 mESCs and amplified using WGA was used as a positive control (Extended Data Fig. 2e; Supplementary Table 1).
Whole genome amplification
Whole genome amplification (WGA) using the WGA4 kit (Sigma) was carried out with minor modifications to the previously described protocol38. Water (13 µl) was added to each of the upturned PCR lids containing an isolated NP (in this and the following steps, volumes of buffer have been increased relative to the supplier’s protocol in order to cover the entire inner surface of the PCR cap lid). PK mastermix (containing 8 µl proteinase K solution, 128 µl 10x single cell lysis and fragmentation buffer) was added to each lid (1.4 µl/lid), and 1 µl of human genomic DNA was added to a single lid without a nuclear profile to act as a positive control. The lids were pressed into a 96 well PCR plate and incubated upside down at 50 °C for 4 h.
After incubation, the PCR plate was left to cool at room temperature for 5 min, before it was inverted and centrifuged at 800 xg for 3 min. The plate was heat-inactivated at 99°C for 4 min in a PCR machine and cooled on ice for 2 min. 2.9 µl 1x single cell library preparation buffer and 1.4 µl library stabilisation solution were added to each well and the plate was incubated at 95°C for 4 min, before cooling on ice for 2 min. 1.4 μl of library preparation enzyme was added to each reaction, then the plate was incubated on a PCR machine at 16 °C for 20 min, 24°C for 20 min, 37 °C for 20 min and finally 75 °C for 5 min.
After WGA library preparation, the PCR plate was centrifuged at 800 xg for 3 min. 10x amplification master mix (10.8 μl), water (69.8 μl) and WGA DNA Polymerase (7.2 μl) were added to each well and the sample was PCR amplified using the program provided by the WGA4 kit supplier.
Cryosectioning and whole genome amplification were generally carried out in a single day, but in some cases samples were stored overnight at -20 °C midway through the protocol (Supplementary Table 1), without detectable differences in DNA extraction in controlled tests of this variable.
Preparation of libraries for high-throughput sequencing
WGA-amplified DNA was purified using a Qiagen MinElute PCR Purification Kit and eluted in 50 μl of the manufacturer’s elution buffer. The concentration of each sample was measured by PicoGreen quantification. Sequencing libraries were then made using either the Illumina TruSeq DNA HT Sample Prep Kit or the TruSeq Nano DNA HT kit. In both cases, samples were made up to 55μl with resuspension buffer. For the DNA HT kit, the entire yield of the WGA reaction was used as input DNA, up to a maximum of 1.1 μg, whereas for the Nano kits a maximum of 200 ng input DNA was used. Libraries were prepared according to the manufacturer’s instructions. For DNA HT kits, samples were size selected to 300-500nt using a Pippin Prep machine (Sage Science, Beverly, MA, USA) with EtBr-free 1.5% agarose cassettes. Samples prepared with the Nano kits were size selected to 350 nucleotides using the bead based selection protocol outlined in the kit.
Library concentrations were estimated using a Qubit 2.0 fluorometer (Thermo Fisher Scientific, Waltham, MA, USA) and libraries were pooled together in batches of 96. Each library pool was sequenced in single end 100 bp rapid-run mode on two lanes of an Illumina HiSeq machine. Each library has 30bp WGA adaptors at both ends, so the flow cell was not imaged for the first 30bp of each run (these are known as “dark cycles”). The custom run recipe was co-developed with Illumina.
High-throughput sequencing data analysis
Reads were mapped to the mm9 assembly of the M. musculus genome using Bowtie2 with default parameters. Reads that did not map uniquely (i.e. had quality scores of less than 20) or were PCR duplicates were removed.
Calling positive windows in GAM samples
To assess the efficiency of locus detection and the optimal resolution to study the mESC-400 dataset, we divided the mouse genome into windows of equal size (ranging from 10 kb to 1 Mb) and scored window detection amongst single NPs. The mouse genome was split into equal size windows using bedtools52, and bedtools multibamcov was used to calculate the number of reads from each NP overlapping each genomic window. A combination of two distributions was fitted to the histogram of the number of reads per window. Fitting was done separately for each NP. A negative binomial distribution represents sequencing noise, and the parameters of the fit for this distribution were used to determine a threshold number of reads X where the probability of observing more than X reads mapping to a single genomic window by chance was less than 0.001. Such a threshold was thus independently determined for each NP, and windows were scored as positive if the number of sequenced reads was greater than the determined threshold. To obtain a robust estimate of the sequencing noise, we fit a lognormal distribution (representing true signal) simultaneously with the negative binomial, although the parameters of the lognormal are not used in determining the threshold.
NP dataset quality control
In order to exclude low-quality datasets from our analysis, we measured a number of quality metrics for each sample. The percentage of mapped reads and percentage of non-PCR duplicate reads was measured by a custom Python script. Sequencing quality metrics (mean quality score per base, the number of dinucleotide repeats and the number of single nucleotide repeats) were determined for each sample using FastQC (bioinformatics.babraham.ac.uk/projects/fastqc). Samples were checked for contamination with Fastq-screen (bioinformatics.babraham.ac.uk/projects/fastq_screen). We expect thin sections through the nucleus to contain a characteristic proportion of the whole genome, organized in clusters and not containing all autosomal chromosomes, as shown previously37. Therefore, we measured the total number of windows scored positive, the number of positive windows immediately adjacent to another positive window and the number of positive chromosomes for each sample. All of these quality metrics were fed into a Principal Components Analysis and components were identified that best discriminated our five negative controls. This analysis determined that percentage of mapped reads was the most predictive metric. Negative controls had a maximum of 2% mapped reads, so of 471 NPs sequenced in total we excluded 63 with < 15% mapped reads to implement a conservative filter, giving a final dataset of 408 NPs. Quality values for all collected NPs can be found in Supplementary Table 1.
Determining optimum GAM resolution
We conducted a statistical power analysis, which confirmed that 408 NPs are sufficient to use GAM to study chromatin organization at 30 kb resolution (Supplementary Note 2). Across the whole collection of NPs, most genomic 30 kb windows (96%) are detected in at least one NP.
Calculating sequencing depth saturation point
Eroded datasets were created for each NP at each target read depth from 50,000 reads to 600,000 reads in steps of 50,000 reads by randomly removing mapped reads from the table of read depth per window per NP. Positive windows were called for each dataset and samples were compared across the eroded datasets to obtain a saturation curve, where the number of positive windows identified is plotted against the number of reads remaining after erosion. To calculating sequencing depth saturation point we classified samples as saturated or unsaturated by calculating a coverage estimator Cn, new to next-generation sequencing datasets, by analogy to species accumulation curves in ecology53 (Supplementary Note 3.1). The saturation point was taken as the minimum number of reads where Cn was greater than 0.8 (i.e. where we estimate that of 80% of the true population of positive windows have been detected).
cryoFISH
For localisation of TADs and their distance measurements (Fig. 5; Extended Data Fig. 11c,d), we performed cryoFISH as previously described37,54 with small modifications. Ultrathin cryosections from ESC-46C were cut at ~200-220 nm thickness, captured in sucrose-PBS drops, and transferred to glass coverslips. Cryosections were first washed (2x, 30min total) in 2xSSC, then incubated (2h, 37°C) with 250 μg/ml RNase A (Sigma; in 2xSSC), washed (2x) in 2xSSC, permeabilised (10 min) with 0.2% Triton X100 in 2xSSC and washed (3x) in 2xSSC. Cryosections were washed and treated (10 min) with 0.1 M HCl, washed (3x) in PBS and then incubated (15 min) in 20 mM glycine in PBS. Cryosections were then dehydrated in ice-cold ethanol (30%, 50%, 70%, 90% and 3x100%, 3 min each), dried briefly, denatured (10 min, 80 °C) in 70% deionized formamide, 2xSSC, 0.05M phosphate buffer pH 7.0, and then re-dehydrated as above. After a brief period of drying, coverslips were overlaid onto probe mixture on Hybrislips (Invitrogen, Eugene, USA) and sealed with rubber cement for in situ hybridisation. Probes consisted of MYtags custom labelled oligonucleotide libraries produced by MYcroarray (Ann Arbor, MI, USA). Probe co-ordinates and labels are given in Supplementary Table 4. Probe libraries were precipitated, air-dried and resuspended in deionised 100% formamide according to manufacturer’s instructions. Probes in formamide were mixed 1:1 with a 2x ‘hybridization mixture’ containing 20% dextran sulphate, 0.1 M phosphate buffer (pH 7.0) and 4xSSC. Probes were incubated (10 min) at 70°C before hybridization. Hybridization was carried out at 37°C in a moist chamber for ~40h. Post-hybridization washes were as follows: 50% formamide in 2xSSC (42°C; 3x over 25 min), 0.1xSSC (60°C, 3x over 20 min), and 0.1% Tween-20 in 4xSSC (42°C, 10 min). Nuclei were counterstained (45 min) with DAPI in PBS with 0.05% Tween-20, rinsed sequentially in 0.05% Tween-20 in PBS and then PBS alone. Coverslips were mounted in VectaShield (Vector Laboratories, Peterborough, UK) immediately before imaging. Images from cryosections were acquired on a confocal laser-scanning microscope (Leica TCS SP8; 63x objective, NA 1.4) equipped with a 405 nm diode, and a white light laser, using pinhole equivalent to 1 Airy disk. Images from the different channels were collected sequentially to prevent fluorescence bleedthrough. For automated quantitative image analyses, images (TIFF files) were merged and each channel manually thresholded in ImageJ to define masks for nuclei, and for each locus. Distances between the edges of FISH signals within each nucleus were measured using an in-house Python script. The median distance measured between two non-interacting TADs (dni) was used to estimate the non-interacting distance for a TAD pair with a different genomic separation (dest) using an equation that assumes homogeneous distribution of the genetic material in the nucleus (see Supplementary Note 3.2).
Applying this equation to the two pairs of non-interacting TADs provided us with a range of expected non-interacting distances at different genomic separations (grey shaded area in Extended Data Fig. 11d). For Fig. 5b,d, images (TIFF files) were merged in Adobe Photoshop and contrast stretched.
For measurements of detection frequency of 40 kb windows (Extended Data Fig. 3f-h), cryoFISH was performed as previously described37,54,55 in mouse ES-OS25 cells (kindly provided by W. Bickmore) grown as previously described32,55, and prepared for cryosectioning as described above. Fosmid probes (see Supplementary Table 4) were obtained from BACPAC Resources (California, USA). The specificity of fosmid probes was confirmed by PCR using specific primers. Probes were labelled with tetramethyl-rhodamine-5-dUTP by nick translation (Roche), and separated from unincorporated nucleotides using MicroBioSpin P-30 chromatography columns (BioRad, Hertfordshire, UK). Hybridization mixtures contained 50% deionised formamide (Sigma), 2xSSC, 10% dextran sulphate, 50 mM phosphate buffer (pH 7.0), 1 µg/µl Cot1 DNA, 2 µg/µl salmon sperm DNA and 2-4 µl nick-translated probe. Probes were denatured (10 min) at 70 °C and re-annealed (30 min) at 37 °C before hybridization. Post-hybridization washes were as follows: 50% formamide in 2xSSC (42 °C; 3x over 25 min), 0.1xSSC (60 °C, 3x over 30 min), and 0.1% Tween-20 in 4xSSC (42 °C, 10 min). For probe signal amplification, sections were then incubated (30 min) with casein-blocking solution (pH 7.8; Vector Laboratories) containing 2.6% NaCl, 0.5% BSA, and 0.1% fish skin gelatin. The signal of rhodamine-labelled probes was amplified with rabbit anti-rhodamine antibodies (2h; 1:500; Invitrogen) and Cyanine3-conjugated donkey antibodies against rabbit IgG (1h; 1:1000; Jackson ImmunoResearch Laboratories). Nuclei were stained with DAPI and coverslips were mounted with VectaShield (Vector Laboratories) immediately before imaging. Images were acquired on a confocal laser-scanning microscope (Leica TCS SP5; 63x oil objective, NA 1.4) equipped with a 405 nm diode, and HeNe (543 nm) laser, using pinhole equivalent to 1 Airy disk. Images from different channels were collected sequentially to prevent fluorescence bleedthrough. For image display in Extended Data Fig. 4, raw images (TIFF files) were merged in Photoshop and contrast stretched. Detection of individual NPs and of genomic loci within each image, of NP area and of locus coordinates were performed using an in-house supervised ImageJ script.
Calculation of linkage matrices
The detection frequency (fA) of a given locus “A” is the number of nuclear profiles in which A is detected divided by the total number of nuclear profiles. The co-segregation (fAB) of a pair of loci “A” and “B” is the number of nuclear profiles in which both A and B are detected divided by the total number of nuclear profiles. Linkage disequilibrium (D) and normalized linkage disequilibrium (D’) are calculated as previously defined39 (Supplementary Note 3.3). In short, linkage is the co-segregation of A and B minus the product of their individual detection frequencies. The detection frequencies of two loci can differ considerably. To normalize for these differences, we use a normalized variant of the linkage disequilibrium (Supplementary Note 3.4). Heatmaps of normalized linkage between all regions on the same chromosome were calculated from normalized linkage matrices L(i,j) where each entry is the normalized linkage of i and j.
Hi-C Analysis
mESC Hi-C data from Dixon et al. (2012)5 was mapped and corrected using the iterative correction pipeline23 and binned in either 50 kb or 1 Mb sized windows. Correlations between GAM and Hi-C were calculated across whole intra-chromosomal matrices.
Defining A and B compartments from GAM and Hi-C datasets
We calculated A and B compartments for GAM and Hi-C according to the previously published method6,23. Each chromosome is represented as a matrix O(i,j) where each entry records the observed interactions between locus i and locus j. We generate a new matrix E(i,j) where each entry is the mean number of contacts for all positions in matrix O with the same distance between i and j. We divide O by E to give K(i,j) a matrix of observed over expected values. We then calculate the final matrix C(i,j) where each position is the correlation between column i and column j of matrix K. We then perform a principal components analysis on the correlation matrix C and extract the three components that explain the most variance. Of these three components, the one with the best correlation to GC content is used to define the A and B compartments23.
Estimation of bias in GAM/Hi-C matrices
To examine the suitability of various normalization schemes for GAM data, we sorted all 30 kb genomic window into 10 bins based on their average GC content. We then calculated an observed over expected (OE) matrix for each chromosome (see “Defining A and B compartments from GAM and Hi-C datasets”). For each combination of two GC content bins, we took the mean OE values for contacts between windows in the two bins to create a heatmap of mean OE values by GC content. The same approach was then repeated, stratifying 30 kb windows by average mappability or their detection frequency in the mESC-400 dataset.
To compare biases between GAM and Hi-C, we repeated the above procedure using GAM or Hi-C matrices at 50 kb resolution, and additionally stratified 50 kb windows according to the number of HindIII sites they contained.
Analysis of topologically associating domains (TADs)
The list of TAD boundaries at 40 kb resolution was obtained from Dixon et al. (2012)5. Following a method published by Crane et al. (2015)56, the mean normalized linkage disequilibrium was measured in a 3x3 window box moved at an offset of two windows from the diagonal of the linkage matrix as a measure of long-range contacts. Depletion of long-range contacts was measured for previously defined TAD boundaries by comparing the long-range contacts at the boundaries with the long-range contacts 150 kb upstream and downstream. The statistical significance of this depletion was assessed by comparing the observed depletion of long-range contacts with the depletion measured from 5000 randomly shuffled sets of TADs.
Extracting Probabilities of Interaction (Pi) from GAM data
The modelling process used to convert pair or triplet co-segregation to Pi is described in Supplementary Notes 1 & 2.
Enrichment analysis of Pi matrices
We created three lists of genomic features: active genes, inactive genes and enhancers. The UCSC known genes list was used as a reference. All genes with FPKM > 1 were classed as active. Genes with FPKM < 0.01 were classed as inactive. FPKMs were taken from mRNA-seq datasets from Brookes et al. (2012)32. Enhancer locations were taken from Whyte et al. (2013)34. We next calculated which 30 kb windows overlapped any of these features and counted the number of prominent interactions at a P value of ≤ 0.05 which connected 30 kb windows overlapping particular features. As a random control, we permuted the list of pairwise contacts 500 times by shifting all their genomic positions by a given random distance (thus preserving the number of significant pairwise interactions per chromosome and their distance distribution). The fold change was calculated as the observed interaction count divided by the mean of 500 random permutations. Enrichment or depletion was scored as significant if the observed count was respectively greater than or smaller than all of the randomly permuted values. Similar enrichments were also observed for prominent interactions at P values thresholds of ≤ 0.025 and ≤ 0.01. To account for the presence of PCA compartments, we subdivided 30 kb windows classified using the above scheme according to whether they were entirely contained within A or B compartments derived from Hi-C at 100 kb resolution.
Analysis of TADs interacting in triplets
To identify triplets of TADs interacting simultaneously, we calculated all possible combinations of three TADs on the same chromosome. For all such triplets, we calculated the Pi3 of all the 40 kb windows making up the TADs using SLICE. 40 kb windows were used here as the TAD positions in Dixon et al. (2012) are given at 40 kb resolution. Finally, we ranked all triplets by their mean Pi3 and selected the top 2%. To predict TAD triplets using pairwise Pi values alone we took the top 2% of TAD triplets ranked according to the minimum average Pi calculated between all pairs of TADs i.e. min(PiAB, PiAC, PiBC), see equation 18 in Supplementary Note 1. Of the top triplet TADs, 41% could not be predicted using only the pairwise Pi values.
For the enrichment analysis, TADs were assigned as SE TADs if they overlapped any previously identified super-enhancers34. TADs not overlapping SEs were classified as low-transcription or high-transcription if they had GRO-seq coverage below the first or above the third quartile respectively. TADs in the middle two quartiles of coverage were classified as medium-transcription. Enrichment was calculated as the observed number of each TAD triplet class (e.g. SE/SE/SE) divided by the mean over 500 randomly permuted lists of TAD triplets, and was called as significant if the observed count was greater than or smaller than all of the randomly permuted values.
To account for the presence of PCA compartments, we subdivided TADs classified using the above scheme according to whether they were entirely contained within A or B compartments derived from Hi-C at 1 Mb resolution. To calculate the enrichment of TAD triplets involving typical enhancers (TEs), we classified all TADs according to their overlap with a published list of typical enhancers from mESCs34.
To analyse the impact of nuclear lamina association on triplet formation, we used a list of LAD regions in mESCs27. TADs were categorized into most (top 15%) and least (bottom 15%) triplet forming in accordance to the number of triplets in the top 2% that contained the TAD. The distances of TADs in each category to LADs where calculated using the closestBED tool52.
Analysis of average linkage at 5 kb resolution
To define if chromatin interactions of 30 kb windows are centred on features they comprise (TSS, TES or enhancers), each 30 kb window overlapping exactly one enhancer or a single TSS or TES of an active gene (FPKM>1; length > 120 kb), but no other gene or enhancer, was subdivided into 6 non-overlapping 5 kb windows. Subsequently, normalized linkage disequilibrium with other interacting “Enhancer” or “Active” 30 kb windows (SLICE P value ≤ 0.05 of the harbouring 30 kb window to the interacting 30 kb window) was calculated for the 5 kb window overlapping the feature of interest ± three 5 kb windows upstream/downstream. This resulted in a matrix in which each row represents a single interaction between two 30 kb windows and the columns represent the linkage for the 5 kb window of interest ± three 5 kb windows upstream/downstream. To normalize for distance effects, each row was divided by its own mean. Next, we took the mean of each column to obtain the average linkage at each distance from the 5 kb window of interest. Finally, these mean values were divided by the mean of the first and last column to obtain the average enrichment at the TSS relative to 15 kb upstream/downstream. The significance of each enrichment was calculated by performing a paired t-test between the list of linkages at the feature-containing 5 kb window and the average of the linkages measured at 15 kb upstream and downstream. As a control, non-interacting (SLICE P value > 0.05) 30 kb window pairs comprising the same features (enhancer, TSS, TES) were used. To ensure similar distance distributions, the true interactions were sorted into 10 bins by their genomic distance and the control group was randomly reduced so that bin counts for each genomic distance range were the same.
Analysis of average three-way co-segregation at 40 kb resolution
To define if “SE / SE / SE” triplet chromatin contacts are centred over the comprised super enhancers (SEs), all TADs containing a single SE that was less than 40 kb in length were selected. A 40 kb window was centred over the SE as well as ± three 40 kb windows upstream/downstream. TADs where the TAD boundary fell within any of these 40 kb windows were discarded. Next, based on all “SE / SE / SE” triplets that involved the selected TADs , the mean co-segregation frequencies between the SE containing 40 kb windows and all 40 kb windows in the two partner SE TADs were calculated. This was repeated for the 40 kb windows upstream/downstream of the selected SE. As described above for pairwise average linkage, we divided each resulting row by its mean, took the mean of each column and finally divided these by the average of the first/last column. The whole process was repeated for the same set of selected SE TADs and their partner highly-transcribed TADs in “SE / High / High” top triplets as well as non-interacting “SE / SE / SE” triplets which spanned the same genomic distances (control). The significance of the enrichment was tested by conducting a paired t-test between the co-segregation at each SE-overlapping 40 kb window and the average co-segregation at 40 kb windows 120 kb upstream or downstream.
Polymer modelling
We employed the Strings & Binders Switch (SBS) model19 to represent chromatin, modelled as a self-avoiding polymer chain on a cubic lattice. In the present case, the chain is made of N = 512 beads. Along the polymer chain, specific beads are sites of attachment for floating binding factors (binders). The polymer has a fraction, f, of binding sites and a concentration, Cm, of binders, which have an affinity E for those polymer sites. Here, for simplicity, we set E = 2 kBT for all sites and f =0.5 (for all details and general case, see references 19 and 57), as real transcription factor binding energies range from 2 kBT for non-specific binding sites to 20 kBT for specific ones. All other beads are inert, as they have no interactions apart from excluded volume effects (and chain length integrity constraints).
Over a range of SBS parameters (f, Cm, E), the SBS polymers show two thermodynamically stable configurations, an open randomly distributed configuration or a closed and highly compact configuration, divided by a sharp transition19,57. The co-segregation probability obtained from GAM data does not match the prediction of the SBS model run with low concentration of binders (which corresponds to a Self-Avoiding Walk polymer model), i.e. a model where only steric hindrance effects among chromatin regions are present. Instead, we obtain a good match by considering SBS modelling conditions that take into account interactions between the polymer beads. In particular, the GAM data can be well fit by considering a mixture of open and closed SBS configuration states (40% open and 60% closed; Extended Data Fig. 11a,b).
The SBS model is investigated by Metropolis Monte Carlo (MC) computer simulations58,59. Brownian molecular factors and polymer beads can randomly move from one site to a nearest neighbour site of the lattice, maintaining single site occupancy and polymer integrity. Binding is only permitted between adjacent particles on the lattice. The binders can form multiple bonds up to six. MC averages are over up to 104 runs, each run being fully equilibrated with up to 1012 single MC steps.
We estimated co-segregation probability on polymer configurations in analogy with GAM. We cut through polymers with randomly oriented slices and scored bead co-segregation in the slices in the same fashion as we scored locus co-segregation in NPs (see Fig. 1b). The co-segregation probability is the probability for two beads at a given distance s on the polymer to be co-segregated in the same randomly oriented slice, in analogy with the probability for two loci at a given genomic distance to be co-segregated in the same NP.
The co-segregation of triplets is the probability of three beads separated by s1 and s2 distances on the polymer to be co-segregated in the same slice (instead of two beads). We fixed the thickness of slices to correspond to the effective thickness (heff) of NP at genomic resolution 50 kb (heff = 500 nm; see Supplementary Note 1). The genomic length corresponding to each polymer bead is 50 kb, which gives a linear length, d0 = 200 nm, roughly estimated as: d0 ∼ D0 (s0/G)1/3, where D0 is the nuclear diameter (9 µm), and G the genome content (5.3 Gb for the mouse genome).
Estimation of chromosome radial position from GAM data
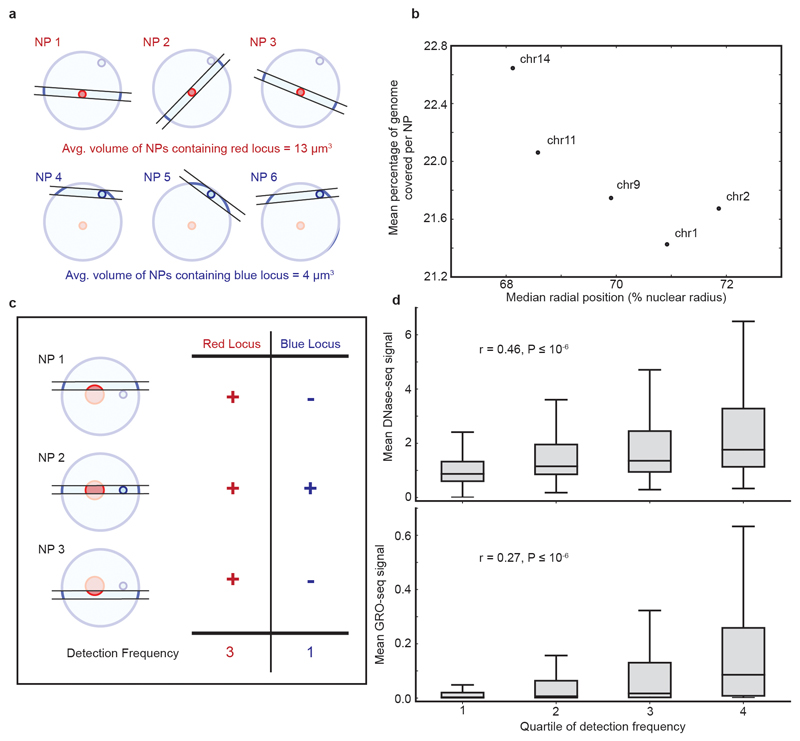
Thanks to the random orientation of sectioning with respect to the nucleus, the DNA content of NPs originated from different latitudes of the nucleus can be used to estimate radial distributions of genomic regions. For example, NPs cut through nuclei close to their periphery contain, by definition, a smaller proportion of the nuclear volume (or DNA content) than equatorial NPs (Extended Data Fig. 9a). Therefore, we predicted that the percentage of the genome covered by each NP could be used as a proxy for its latitude relative to the most equatorial NPs.
For each NP, we calculated the coverage of each chromosome as the mean number of reads per Mb. For each chromosome, we took every NP in which that chromosome was in the top quartile of coverage and calculated the percentage of all genomic 1 Mb windows that were positive. The percentage coverage of an NP is a measure of its radius60, and therefore the mean percentage coverage of NPs containing a given chromosome is a measure of the preference of that chromosome to appear in NPs with a large radius (as is expected of more centrally positioned chromosomes). As expected, we found that the mean percentage coverage of NPs containing chromosomes 1, 2, 9, 11 and 14 negatively correlates with their radial position, previously measured in Mayer et al. (2005)35. Therefore, chromosomes detected in NPs with lower average DNA content occupy more peripheral positions (Extended Data Fig. 9b).
Estimation of locus volume from GAM data
We reasoned that de-condensed genomic loci should occupy larger volumes (or adopt more elongated conformations) than more condensed loci. De-condensed loci would therefore be intersected more frequently (and be detected more frequently in randomly-oriented nuclear profiles) than smaller or more spherical loci (Extended Data Fig. 9c). We divided the mouse genome into 30 kb windows and calculated the number of NPs where each window was detected (its detection frequency). We find that the detection frequency of 30 kb windows positively correlates with their coverage in a published DNase-seq dataset26 (Spearman’s correlation coefficient = 0.47, P < 10; Extended Data Fig. 9d), as expected given that de-condensed chromatin ought to be more accessible to enzymatic cleavage. Furthermore, transcriptional activity has also been shown to correlate with chromatin de-condensation for individual loci61, or globally after overexpression of structural proteins62. Accordingly, we find that the transcriptional activity of 30 kb genomic windows (measured by GRO-seq coverage33) is also positively correlated with their detection frequency in single NPs (Spearman’s correlation coefficient = 0.27, P < 10; Extended Data Fig. 9d).
Code availability
Custom Python scripts used in this project are available from http://gam.tools/papers/nature-2016.
Data availability
The GAM sequencing data is available from GEO (GSE64881).
Extended Data
Extended Data Figure 1. Limitations of current genome-wide methods for measuring chromatin interactions.
a, The table lists the current genome-wide methods for measuring chromatin interactions and compares their various limitations. CNVs = copy number variants. b, GAM has few of the limitations that affect current genome-wide methods for mapping genome architecture. c, In 3C-based methods, the presence of multiple loci in a single interaction may dilute the measured ligation frequency between any two member loci. In GAM, the measured interaction is not affected by multiplicity. d, Two interactions on different chromosomes (or distant on the same chromosome) can be correlated (occur together in the same cells), anti-correlated (one interaction occurs whilst the other does not) or independent (they occur either together or in different single cells randomly).
Extended Data Figure 2. Outline of the GAM method.
a, Overview of the GAM methodology. b, Ultra-thin slice through a single nucleus produced by cryosectioning (reproduced from Histochemistry and Cell Biology, Advances in imaging the interphase nucleus using thin cryosections, 128, 2007, 97, A. P. (© Springer-Verlag 2007) with permission of Springer). c, Isolation of individual NPs from cryosections using laser capture microdissection. Scale bars are 30 µm. d, Whole genome amplified DNA extracted from microdissected NPs. e, Identification of regions in mouse chromosomes 2, 3 and 4, present in the four NPs, by next-generation sequencing. Coverage of mouse genomic DNA (gDNA) amplified by WGA is mostly even, with a few spikes possibly due to amplification biases. Black bars under each track indicate windows called as positive by a negative binomial approach.
Extended Data Figure 3. Quality control of the GAM dataset.
a, Percentage of reads mapped to the mouse genome was reproducible between 13 independently collected batches of NPs, and a minimal threshold of 15% mapped reads was used to identify highest quality NPs. Dashed line shows position of cut-off for low-quality samples. Histogram below shows overall distribution. b, Sequencing depth versus number of 30 kb windows identified by a negative binomial fitting approach for four individual NPs. c, Percentage of 30 kb genomic windows identified in each NP, was reproducible between collection batches. Black diamonds indicate NP samples that did not pass quality control. Histogram below shows overall distribution. d, Histogram showing the percentage of the diploid mouse genome identified in each NP. Dashed line shows maximum genomic coverage obtainable from 0.22 μm slices of a 9 μm diameter spherical nucleus. e, Boxplots showing the percentage of 30 kb windows from each chromosome identified in each NP. mESC-46C cells are male and therefore haploid for the X chromosome. f, Positions of three ~40 kb fosmid probes within the HoxB locus. g, cryoFISH experiments were carried out by hybridizing each fosmid probe to cryosections. Probes were detected using specific, fluorophore-conjugated antibodies. Arrows indicate the localization of 40 kb genomic windows only within a small proportion of NPs, as expected from their small thickness. h, Comparison of probe detection in single NPs by cryoFISH and GAM. Top row: percentage of NPs that were labelled by each probe (median of four replicate experiments in mESC-OS25 cells, each replicate containing 1500-2600 NPs). Bottom row: percentage of NPs from the mESC-400 dataset in which the region encompassing each probe was positively detected (in mESC-46C cells).
Extended Data Figure 4. Exploration and normalization of biases in the mESC-400 dataset.
a, Normalized linkage disequilibrium effectively reduces bias in GAM datasets. 30 kb windows were divided into equal groups according to their detection frequency, GC content or mappability (grey bar plots give mean ± interquartile range, left). Mean observed over expected values (% bias) between windows in each group are shown for three different normalization schemes (heat maps, middle). Calculating the normalized linkage disequilibrium results in the lowest absolute % bias in all three cases (box plots, right). b, The normalized linkage disequilibrium corrects for confounding effects on co-segregation matrices caused by small differences in the detection frequency of locus pairs. c, GAM matrices are less biased than Hi-C matrices both before and after ICE-normalization. Observed over expected values are given for 50 kb windows stratified by restriction site density, GC content and mappability.
Extended Data Figure 5. Four hundred NPs are sufficient to extract most of the information about co-segregation of loci at 30 kb resolution.
a and b, Normalized linkage disequilibrium matrix for a 3 Mb (a) and a 30 Mb (b) genomic region around the Esrrb locus plotted with increasing numbers of NPs included. c, Pearson Correlation Coefficient between eroded datasets including only the indicated number of NPs and the full mESC-400 dataset. Green line indicates correlation over all pairs of loci, and pink for only those loci within 3Mb of each other.
Extended Data Figure 6. GAM contact matrices for all chromosomes at 1 Mb resolution.
GAM matrices of normalized linkage disequilibrium are shown for all chromosomes at 1Mb resolution, alongside published ChIP-seq tracks for H3K27ac, H3K36me3 and H3K9me3, DNAse-seq, Hi-C PCA compartments and lamin associated domains (LADs) from mESCs (Supplementary Table 3). White lines within matrices represent genomic regions with poor mappability.
Extended Data Figure 7. GAM reproduces a significant depletion of long-range contacts around previously identified TAD boundaries.
a, TAD organization of the Xist locus (Xist highlighted in red). b, TAD organization of the Esrrb locus (Esrrb highlighted in red). c, TAD organization of the HoxA locus (HoxA gene cluster highlighted in red). d, Depletion of long-range contacts observed when a 3x3 window box is moved across an example TAD boundary, at an offset of 2 windows from the matrix diagonal (i.e. insulation score). e, Median ratio between linkage observed at a boundary vs. 150 kb upstream and downstream of the boundary was significantly lower for a previously published list of TAD boundaries in mESC (purple line) than for 5000 randomly shuffled versions of the list (permutation test, P < 2x10⁻⁴; black histogram). f, Average profile of long-range contacts calculated over all TAD boundaries (purple line). The average profile with the largest depletion observed after 5000 random permutations of TAD boundaries is shown for comparison (dashed grey line).
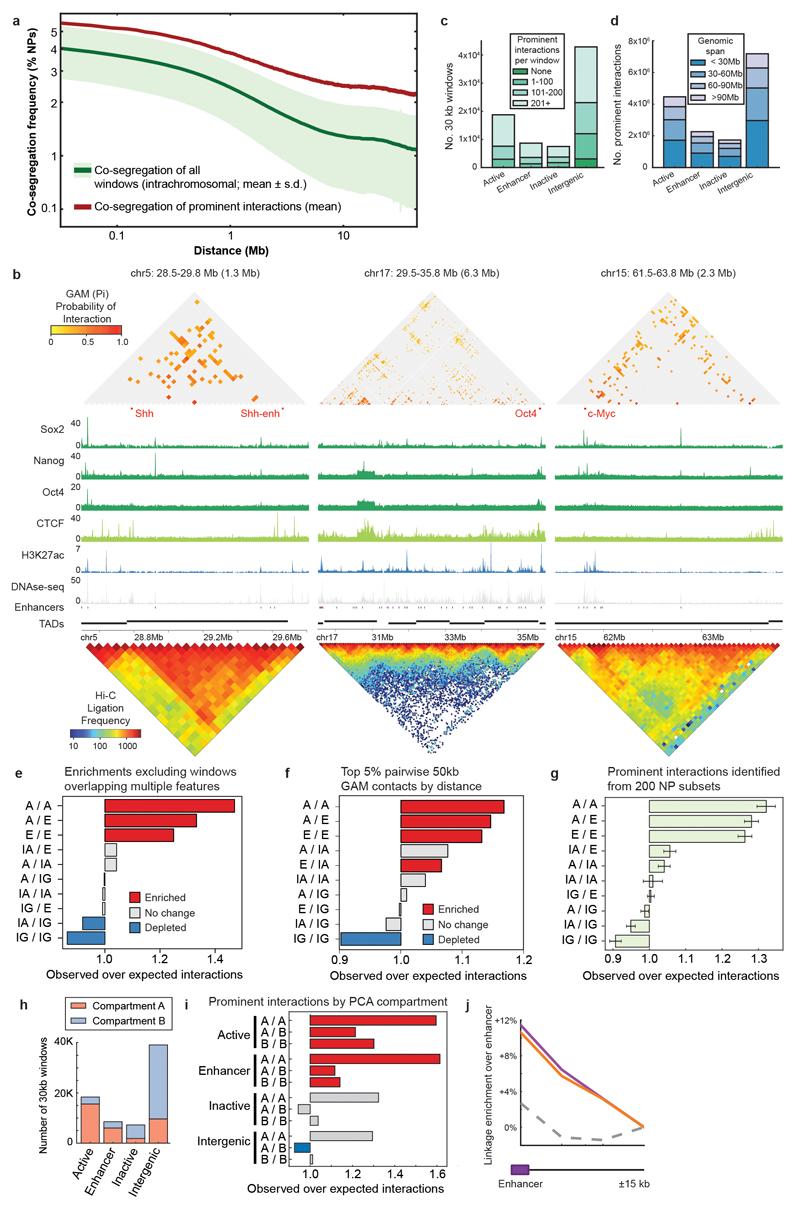
Extended Data Figure 8. Prominent interactions identified by SLICE co-segregate frequently in raw GAM data.
a, Mean co-segregation frequency of pairs of prominently interacting windows (red line) is consistently higher than the mean co-segregation frequency of all intrachromosomal window pairs (green line ± s.d.; green area) across a wide range of genomic distances. For example, when we consider all genomic loci separated by 10 Mb, we find that they co-segregate on average much less frequently (in 5.3 out of 408 NPs; ± 2.6 s.d.) than locus pairs classified as interacting (in 10.1 out of 408 NPs; ± 2.2 s.d.). b, Prominent interactions identified by SLICE over the Shh, Oct4 and c-Myc loci. Also shown are ChIP-seq tracks for pluripotency transcription factors Sox2, Nanog and Oct4, and for CTCF and H3K27ac, as well as DNAse-seq, positions of predicted enhancers and topological domains and published Hi-C data at 50 kb resolution. c, Number of prominent interactions by overlapping feature present in each window. d, Genomic distances between pairs of prominently interacting windows by overlapping feature. e, Enrichment of genomic features overlapped by prominently interacting 30 kb windows. As for Fig. 3c, but excluding windows overlapping more than one feature (e.g. both an inactive gene and an active gene). f, As for Fig. 3c except enrichments are calculated for the top 5% most interacting pairs of 50 kb windows at each genomic distance ranked by GAM normalized linkage. g, Enrichments calculated from independent 200 NP subsamples of the mESC-400 dataset (n=10, mean ± s.d.). h, A small proportion of 30 kb windows within the broadly inactive compartment B (calculated from Hi-C at 100 kb resolution) overlap active genes or enhancers. i, Prominent interactions involving Active and Enhancer windows are enriched irrespective of A or B compartmentalization, demonstrating that observed enrichments between Active regions and Enhancers are not a trivial consequence of nuclear compartmentalization j, Average linkage from 5 kb windows overlapping an enhancer to prominently interacting 30 kb Active windows (orange), Enhancer windows (purple) or non-interacting Active windows (control windows; grey).
Extended Data Figure 9. GAM also provides information about locus radial positioning and compaction.
a, A locus positioned centrally within the nucleus is more frequently found in equatorial NPs, which have a larger volume. In contrast, a locus positioned close to the nuclear periphery is more frequently found in apical sections, which have a smaller volume. b, The mean percentage of the genome covered per NP (as a proxy for NP volume) is negatively correlated with radial positioning in the five mouse autosomes for which radial position data is available. c, A more de-compacted locus with a smaller volume is intersected more frequently (i.e. is detected in more NPs) than a corresponding compacted locus with a larger volume. d, 30 kb windows in the highest quartiles of detection frequency also show a higher coverage by DNase-seq (upper panel) and GRO-seq (lower panel), indicating a greater level of active transcription. This is consistent with a general de-compaction of actively transcribed chromatin regions, leading to a volume-induced increase in detection frequency.
Extended Data Figure 10. TAD triplet enrichment analysis.
a, Ranking of candidate triplet TADs on the same autosomal chromosome by their mean Pi3 at a spatial distance of <100nm and position of the cut-off for the top 2% selected for further analysis. b, Classification of TADs. TADs overlapping Super Enhancers are designated SE. Non-SE TADs are designated low transcription when their GRO-seq coverage is in the bottom 25% quartile, or high transcription when it is in the top 25%. Remaining TADs are classified as medium transcription TADs. c, Genomic span of top 2% triplet interactions by TAD class. d, Enrichment analysis as in Fig. 4c additionally showing triplets containing medium transcription TADs. e, Enrichment analysis as in Fig. 4c, except TADs are classified according to whether they overlap super-enhancers (SE), typical enhancers (TE) or no enhancers (None). f, Enrichment of TAD triplet classes calculated from independent 200 NP subsamples of the mESC-400 dataset (n=10, mean ± s.d.). g, TAD classification stratified by overlap with A and B compartments calculated from Hi-C at 1 Mb resolution. h, Enrichments calculated between sets of three SE TADs or three highly transcribed TADs, stratified by their overlap with PCA compartments. i, Scheme for testing whether within an interacting triplet, two SE-TADs preferentially contact the 40 kb window overlapping the SE of the third SE-TAD. j, Average co-segregation between a 40 kb window directly overlapping an SE and two other SE-TADs in a triplet (purple line), two highly expressed TADs in a triplet (orange line), or two SE-TADs not in a triplet (dashed line). The SE-containing 40 kb windows co-segregate more frequently with the two other SE-TADs in their triplet than 40 kb windows located 120 kb upstream or downstream (paired t-test, P < 10). A lower, yet significant enrichment was also found for one SE-TAD interacting with two highly -transcribed TADs (P < 10), whilst no significant enrichment was detected between SE-TADs that did not form top triplets (P = 0.68). k, Percentage of TADs in each class that overlap Lamina Associated Domains (LADs). l, Highly transcribed and SE-TADs that form the least triplet contacts more frequently overlap or are closer to LADs compared with TADs that form the most triplet contacts. Therefore, proximity to the nuclear lamina appears to curb the formation of higher complexity contacts involving highly-transcribed TADs, either by restricting access to more central enhancer clusters or by limiting the surface available for the formation of multiple contacts.
Extended Data Figure 11. Model for chromatin organization in mESC nuclei.
a and b, Polymer modelling performed using the Strings & Binders Switch (SBS) model under different conditions. We sampled the ensemble of (1) polymers in the coil thermodynamics state, equivalent to the random-open conformation of a Self-Avoiding Walk (SAW) model; (2) polymers in the compact state, where binder-specific interactions prevail and fold the polymer in closed conformations; and (3) mixtures of the SBS polymers in coil and compact states. From these in silico models, we calculated the co-segregation frequency of polymer bead pairs (a) or triplets (b) for a wide range of genomic lengths (from 0.5 up to 20 Mb). The long-range decay of co-segregation probability observed in the mESC-400 dataset (blue line and surface) is not consistent with the SAW model that lacks specific interactions (grey line and surface). Instead, the observed decay of pairs or triplets are closely matched by a 40:60 mixture of coil/compact SBS polymers (best-fit SBS model: red line, RSS =1%; red surface RSS =2%), consistent with pair and triplet contacts being abundant features of chromatin folding across large genomic distances. c, Comparison of GAM normalized linkage and SLICE Probability of Interaction (Pi) between tested pairs of TADs. d, Distribution of inter-TAD distances obtained from cryoFISH data. Grey shading and dashed black line give the median distance expected between non-interacting TADs at different linear separations. e, The chromatin fibre is organized in topologically associating domains (TADs). Inactive TADs often coincide with LADs and are therefore generally associated with either the nuclear lamina or the surface of the nucleoli. Highly transcribed TADs and TADs containing strong enhancers form clusters away from the nuclear periphery. Inset: contacts within and between highly transcribed or strong enhancer TADs are nucleated by active genes and enhancer elements.
Supplementary Material
Acknowledgements
We thank J. Walter for critically reading the manuscript, C. Ferrai and E. Brookes for preparing mESCs, S. Robin, M.-F. Sagot, and K.N. Natarajan for initial contributions to the statistical and bioinformatic analyses of GAM, T. Baslan and J. Hicks for suggestions on sequencing strategy, J. Pang from Illumina for help with HiSeq recipes, O. Clarke from Zeiss Microdissection Systems for advice on microdissection, P.A. Dear for advice about HAPPY mapping, T. Rito for help with ImageJ scripts and D. Henrique and W.A. Bickmore for providing mESC cell lines. The work was supported by the Medical Research Council, UK (AP, RAB, MC, SQX, IdS, LML, LG, ND), by the Helmholtz Foundation (AP, RAB, MS, DCAK, MB), by the MRC-Technology (AP, MC, MRB), by the Berlin Institute of Health (BIH; AP, MB, DCAK), by Breast Cancer Campaign (PAWE) and by Cancer Research UK (PAWE). Work by JD and JF was supported by grants from the Canadian Institutes of Health Research (CIHR) [MOP-86716, CAP-120350]. Work by MN was supported by CINECA ISCRA Grants No. HP10CYFPS5 and No. HP10CRTY8P. MN also acknowledges computer resources from INFN and Scope at the University of Naples.
Footnotes
Contributions
AP and PAWE devised the GAM concept. AP, RAB, MC, LML and MRB optimized the GAM experimental protocol. RAB produced the GAM datasets, and with LG developed the sequencing strategy. MC produced the control WGA-amplified DNA dataset. DCAK and SQX performed the FISH experiments. AP and ND supervised the experiments. RAB, MS and IdS performed the bioinformatics analyses. MN conceived the SLICE model concept. MN, AS, AP, RAB developed the SLICE model and AS implemented full calculations. MB performed the polymer modelling analysis. AP and MN supervised computational analyses. AP and RAB developed the radial position and compaction analyses. JF processed the Hi-C data, supervised by JD. RAB, AP, AS, MN and MS wrote the paper, all authors revised the manuscript.
Author Information
Reprints and permissions information is available at www.nature.com/reprints. Readers are welcome to comment on the online version of the paper.
Competing Interests
The authors declare competing financial interests: a patent was filed on behalf of A.P., P.A.W.E., M.N., A.S. and R.A.B. by the Max-Delbrück Centre for Molecular Medicine, Berlin. The other authors declare no competing financial interests.
References
- 1.Dekker J, Rippe K, Dekker M, Kleckner N. Capturing chromosome conformation. Science. 2002;295:1306–11. doi: 10.1126/science.1067799. [DOI] [PubMed] [Google Scholar]
- 2.Simonis M, et al. Nuclear organization of active and inactive chromatin domains uncovered by chromosome conformation capture-on-chip (4C) Nat Genet. 2006;38:1348–54. doi: 10.1038/ng1896. [DOI] [PubMed] [Google Scholar]
- 3.Nora EP, et al. Spatial partitioning of the regulatory landscape of the X-inactivation centre. Nature. 2012;485:381–385. doi: 10.1038/nature11049. [DOI] [PMC free article] [PubMed] [Google Scholar]
- 4.Rodley CDM, Bertels F, Jones B, O’Sullivan JM. Global identification of yeast chromosome interactions using Genome conformation capture. Fungal Genet Biol. 2009;46:879–86. doi: 10.1016/j.fgb.2009.07.006. [DOI] [PubMed] [Google Scholar]
- 5.Dixon JR, et al. Topological domains in mammalian genomes identified by analysis of chromatin interactions. Nature. 2012;485:376–380. doi: 10.1038/nature11082. [DOI] [PMC free article] [PubMed] [Google Scholar]
- 6.Lieberman-Aiden E, et al. Comprehensive mapping of long-range interactions reveals folding principles of the human genome. Science. 2009;326:289–93. doi: 10.1126/science.1181369. [DOI] [PMC free article] [PubMed] [Google Scholar]
- 7.Sexton T, et al. Three-dimensional folding and functional organization principles of the Drosophila genome. Cell. 2012;148:458–72. doi: 10.1016/j.cell.2012.01.010. [DOI] [PubMed] [Google Scholar]
- 8.Rao SSP, et al. A 3D Map of the Human Genome at Kilobase Resolution Reveals Principles of Chromatin Looping. Cell. 2014;159:1665–80. doi: 10.1016/j.cell.2014.11.021. [DOI] [PMC free article] [PubMed] [Google Scholar]
- 9.van Berkum NL, et al. Hi-C: a method to study the three-dimensional architecture of genomes. J Vis Exp. 2010;39:e1869. doi: 10.3791/1869. [DOI] [PMC free article] [PubMed] [Google Scholar]
- 10.Zhang Y, et al. Chromatin connectivity maps reveal dynamic promoter-enhancer long-range associations. Nature. 2013;504:306–310. doi: 10.1038/nature12716. [DOI] [PMC free article] [PubMed] [Google Scholar]
- 11.Ryba T, et al. Evolutionarily conserved replication timing profiles predict long-range chromatin interactions and distinguish closely related cell types. Genome Res. 2010;20:761–70. doi: 10.1101/gr.099655.109. [DOI] [PMC free article] [PubMed] [Google Scholar]
- 12.Pope BD, et al. Topologically associating domains are stable units of replication-timing regulation. Nature. 2014;515:402–405. doi: 10.1038/nature13986. [DOI] [PMC free article] [PubMed] [Google Scholar]
- 13.Naumova N, et al. Organization of the mitotic chromosome. Science. 2013;342:948–53. doi: 10.1126/science.1236083. [DOI] [PMC free article] [PubMed] [Google Scholar]
- 14.Grand RS, et al. Chromosome conformation maps in fission yeast reveal cell cycle dependent sub nuclear structure. Nucleic Acids Res. 2014;42:12585–12599. doi: 10.1093/nar/gku965. [DOI] [PMC free article] [PubMed] [Google Scholar]
- 15.O’Sullivan JM, Hendy MD, Pichugina T, Wake GCG, Langowski J. The statistical-mechanics of chromosome conformation capture. Nucleus. 2013;4:390–398. doi: 10.4161/nucl.26513. [DOI] [PMC free article] [PubMed] [Google Scholar]
- 16.Gavrilov Aa, et al. Disclosure of a structural milieu for the proximity ligation reveals the elusive nature of an active chromatin hub. Nucleic Acids Res. 2013;41:3563–75. doi: 10.1093/nar/gkt067. [DOI] [PMC free article] [PubMed] [Google Scholar]
- 17.Belmont AS. Large-scale chromatin organization: the good, the surprising, and the still perplexing. Curr Opin Cell Biol. 2014;26:69–78. doi: 10.1016/j.ceb.2013.10.002. [DOI] [PMC free article] [PubMed] [Google Scholar]
- 18.Williamson I, et al. Spatial genome organization : contrasting views from chromosome conformation capture and fluorescence in situ hybridization. Genes Dev. 2014;28:2778–2791. doi: 10.1101/gad.251694.114. [DOI] [PMC free article] [PubMed] [Google Scholar]
- 19.Barbieri M, et al. Complexity of chromatin folding is captured by the strings and binders switch model. Proc Natl Acad Sci U S A. 2012;109:16173–8. doi: 10.1073/pnas.1204799109. [DOI] [PMC free article] [PubMed] [Google Scholar]
- 20.Yaffe E, Tanay A. Probabilistic modeling of Hi-C contact maps eliminates systematic biases to characterize global chromosomal architecture. Nat Genet. 2011;43:1–9. doi: 10.1038/ng.947. [DOI] [PubMed] [Google Scholar]
- 21.Ay F, et al. Identifying multi-locus chromatin contacts in human cells using tethered multiple 3C. BMC Genomics. 2015;16:1–17. doi: 10.1186/s12864-015-1236-7. [DOI] [PMC free article] [PubMed] [Google Scholar]
- 22.Darrow EM, et al. Deletion of DXZ4 on the human inactive X chromosome alters higher-order genome architecture. Proc Natl Acad Sci. 2016;113:E4504–E4512. doi: 10.1073/pnas.1609643113. [DOI] [PMC free article] [PubMed] [Google Scholar]
- 23.Imakaev M, et al. Iterative correction of Hi-C data reveals hallmarks of chromosome organization. Nat Methods. 2012;9:999–1003. doi: 10.1038/nmeth.2148. [DOI] [PMC free article] [PubMed] [Google Scholar]
- 24.Hu M, et al. HiCNorm: removing biases in Hi-C data via Poisson regression. Bioinformatics. 2012;28:3131–3133. doi: 10.1093/bioinformatics/bts570. [DOI] [PMC free article] [PubMed] [Google Scholar]
- 25.Kruse K, Sewitz S, Babu MM. A complex network framework for unbiased statistical analyses of DNA-DNA contact maps. Nucleic Acids Res. 2012;41:701–710. doi: 10.1093/nar/gks1096. [DOI] [PMC free article] [PubMed] [Google Scholar]
- 26.Yue F, et al. A comparative encyclopedia of DNA elements in the mouse genome. Nature. 2014;515:355–364. doi: 10.1038/nature13992. [DOI] [PMC free article] [PubMed] [Google Scholar]
- 27.Peric-Hupkes D, et al. Molecular Maps of the Reorganization of Genome-Nuclear Lamina Interactions during Differentiation. Mol Cell. 2010;38:603–613. doi: 10.1016/j.molcel.2010.03.016. [DOI] [PMC free article] [PubMed] [Google Scholar]
- 28.Hindorff LA, et al. Potential etiologic and functional implications of genome-wide association loci for human diseases and traits. Proc Natl Acad Sci. 2009;106:9362–9367. doi: 10.1073/pnas.0903103106. [DOI] [PMC free article] [PubMed] [Google Scholar]
- 29.Dear PH, Cook PR. Happy mapping: a proposal for linkage mapping the human genome. Nucleic Acids Res. 1989;17:6795–6807. doi: 10.1093/nar/17.17.6795. [DOI] [PMC free article] [PubMed] [Google Scholar]
- 30.Guillot PV, Xie SQ, Hollinshead M, Pombo A. Fixation-induced redistribution of hyperphosphorylated RNA polymerase II in the nucleus of human cells. Exp Cell Res. 2004;295:460–8. doi: 10.1016/j.yexcr.2004.01.020. [DOI] [PubMed] [Google Scholar]
- 31.Pombo A, Hollinshead M, Cook PR. Bridging the Resolution Gap: Imaging the Same Transcription Factories in Cryosections by Light and Electron Microscopy. J Histochem Cytochem. 1999;47:471–480. doi: 10.1177/002215549904700405. [DOI] [PubMed] [Google Scholar]
- 32.Brookes E, et al. Polycomb Associates Genome-wide with a Specific RNA Polymerase II Variant, and Regulates Metabolic Genes in ESCs. Cell Stem Cell. 2012;10:157–70. doi: 10.1016/j.stem.2011.12.017. [DOI] [PMC free article] [PubMed] [Google Scholar]
- 33.Min IM, et al. Regulating RNA polymerase pausing and transcription elongation in embryonic stem cells. Genes Dev. 2011;25:742–54. doi: 10.1101/gad.2005511. [DOI] [PMC free article] [PubMed] [Google Scholar]
- 34.Whyte Wa, et al. Master transcription factors and mediator establish super-enhancers at key cell identity genes. Cell. 2013;153:307–19. doi: 10.1016/j.cell.2013.03.035. [DOI] [PMC free article] [PubMed] [Google Scholar]
- 35.Mayer R, et al. Common themes and cell type specific variations of higher order chromatin arrangements in the mouse. BMC Cell Biol. 2005;6:44–66. doi: 10.1186/1471-2121-6-44. [DOI] [PMC free article] [PubMed] [Google Scholar]
- 36.McDowall A, Gruenberg J, Römisch K, Griffiths G. The structure of organelles of the endocytic pathway in hydrated cryosections of cultured cells. Eur J Cell Biol. 1989;49:281–94. [PubMed] [Google Scholar]
- 37.Branco MR, Pombo A. Intermingling of chromosome territories in interphase suggests role in translocations and transcription-dependent associations. PLoS Biol. 2006;4:e138. doi: 10.1371/journal.pbio.0040138. [DOI] [PMC free article] [PubMed] [Google Scholar]
- 38.Baslan T, et al. Genome-wide copy number analysis of single cells. Nat Protoc. 2012;7:1024–41. doi: 10.1038/nprot.2012.039. [DOI] [PMC free article] [PubMed] [Google Scholar]
- 39.Lewontin RC. The Interaction of Selection and Linkage. I. General Considerations; Heterotic Models. Genetics. 1964;49:49–67. doi: 10.1093/genetics/49.1.49. [DOI] [PMC free article] [PubMed] [Google Scholar]
- 40.Proudfoot NJ. Transcriptional termination in mammals: Stopping the RNA polymerase II juggernaut. Science. 2016;352 doi: 10.1126/science.aad9926. aad9926-aad9926. [DOI] [PMC free article] [PubMed] [Google Scholar]
- 41.Beagrie RA, Pombo A. Gene activation by metazoan enhancers: Diverse mechanisms stimulate distinct steps of transcription. BioEssays. 2016;38:881–893. doi: 10.1002/bies.201600032. [DOI] [PubMed] [Google Scholar]
- 42.Pombo A, et al. Regional specialization in human nuclei: visualization of discrete sites of transcription by RNA polymerase III. EMBO J. 1999;18:2241–53. doi: 10.1093/emboj/18.8.2241. [DOI] [PMC free article] [PubMed] [Google Scholar]
- 43.Osborne CS, et al. Active genes dynamically colocalize to shared sites of ongoing transcription. Nat Genet. 2004;36:1065–71. doi: 10.1038/ng1423. [DOI] [PubMed] [Google Scholar]
- 44.Shopland LS, Johnson CV, Byron M, McNeil J, Lawrence JB. Clustering of multiple specific genes and gene-rich R-bands around SC-35 domains: Evidence for local euchromatic neighborhoods. J Cell Biol. 2003;162:981–990. doi: 10.1083/jcb.200303131. [DOI] [PMC free article] [PubMed] [Google Scholar]
- 45.Liu Z, et al. 3D imaging of Sox2 enhancer clusters in embryonic stem cells. Elife. 2014;3:1–29. doi: 10.7554/eLife.04236. [DOI] [PMC free article] [PubMed] [Google Scholar]
- 46.Ing-Simmons E, et al. Spatial enhancer clustering and regulation of enhancer-proximal genes by cohesin. Genome Res. 2015;25:504–513. doi: 10.1101/gr.184986.114. [DOI] [PMC free article] [PubMed] [Google Scholar]
- 47.Chiariello AM, Annunziatella C, Bianco S, Esposito A, Nicodemi M. Polymer physics of chromosome large-scale 3D organisation. Sci Rep. 2016;6:29775. doi: 10.1038/srep29775. [DOI] [PMC free article] [PubMed] [Google Scholar]
- 48.Lee K, Hsiung CC-S, Huang P, Raj A, Blobel GA. Dynamic enhancer–gene body contacts during transcription elongation. Genes Dev. 2015;29:1992–1997. doi: 10.1101/gad.255265.114. [DOI] [PMC free article] [PubMed] [Google Scholar]
- 49.Ying Q-L, Stavridis M, Griffiths D, Li M, Smith A. Conversion of embryonic stem cells into neuroectodermal precursors in adherent monoculture. Nat Biotechnol. 2003;21:183–6. doi: 10.1038/nbt780. [DOI] [PubMed] [Google Scholar]
- 50.Abranches E, et al. Neural differentiation of embryonic stem cells in vitro: a road map to neurogenesis in the embryo. PLoS One. 2009;4:e6286. doi: 10.1371/journal.pone.0006286. [DOI] [PMC free article] [PubMed] [Google Scholar]
- 51.Tokuyasu KT. A technique for ultracryotomy of cell suspensions and tissues. J Cell Biol. 1973;57:551–65. doi: 10.1083/jcb.57.2.551. [DOI] [PMC free article] [PubMed] [Google Scholar]
- 52.Quinlan AR, Hall IM. BEDTools: a flexible suite of utilities for comparing genomic features. Bioinformatics. 2010;26:841–2. doi: 10.1093/bioinformatics/btq033. [DOI] [PMC free article] [PubMed] [Google Scholar]
- 53.Chao A, Jost L. Coverage-based rarefaction and extrapolation: Standardizing samples by completeness rather than size. Ecology. 2012;93:2533–2547. doi: 10.1890/11-1952.1. [DOI] [PubMed] [Google Scholar]
- 54.Ferrai C, et al. Poised transcription factories prime silent uPA gene prior to activation. PLoS Biol. 2010;8:e1000270. doi: 10.1371/journal.pbio.1000270. [DOI] [PMC free article] [PubMed] [Google Scholar]
- 55.Stock JK, et al. Ring1-mediated ubiquitination of H2A restrains poised RNA polymerase II at bivalent genes in mouse ES cells. Nat Cell Biol. 2007;9:1428–35. doi: 10.1038/ncb1663. [DOI] [PubMed] [Google Scholar]
- 56.Crane E, et al. Condensin-driven remodelling of X chromosome topology during dosage compensation. Nature. 2015;523:240–4. doi: 10.1038/nature14450. [DOI] [PMC free article] [PubMed] [Google Scholar]
- 57.Nicodemi M, Prisco A. Thermodynamic pathways to genome spatial organization in the cell nucleus. Biophys J. 2009;96:2168–77. doi: 10.1016/j.bpj.2008.12.3919. [DOI] [PMC free article] [PubMed] [Google Scholar]
- 58.Binder K. Applications of Monte Carlo methods to statistical physics. Reports Prog Phys. 1997;60:487–559. [Google Scholar]
- 59.Binder K, Heermann DW. Monte Carlo Simulation in Statistical Physics. Springer; Berlin Heidelberg: 2010. [DOI] [Google Scholar]
- 60.Branco MR, Branco T, Ramirez F, Pombo A. Changes in chromosome organization during PHA-activation of resting human lymphocytes measured by cryo-FISH. Chromosome Res. 2008;16:413–26. doi: 10.1007/s10577-008-1230-x. [DOI] [PubMed] [Google Scholar]
- 61.Chambeyron S, Bickmore WA. Chromatin decondensation and nuclear reorganization of the HoxB locus upon induction of transcription. Genes Dev. 2004;18:1119–1130. doi: 10.1101/gad.292104. [DOI] [PMC free article] [PubMed] [Google Scholar]
- 62.Rochman M, et al. The Interaction of NSBP1/HMGN5 with Nucleosomes in Euchromatin Counteracts Linker Histone-Mediated Chromatin Compaction and Modulates Transcription. Mol Cell. 2009;35:642–656. doi: 10.1016/j.molcel.2009.07.002. [DOI] [PMC free article] [PubMed] [Google Scholar]
- 63.Pombo A. Advances in imaging the interphase nucleus using thin cryosections. Histochemistry and Cell Biology. 2007;128:97–104. doi: 10.1007/s00418-007-0310-x. [DOI] [PubMed] [Google Scholar]
Associated Data
This section collects any data citations, data availability statements, or supplementary materials included in this article.
Supplementary Materials
Data Availability Statement
The GAM sequencing data is available from GEO (GSE64881).


