

Abstract
Background and Objective
Cilia-driven mucociliary clearance is an important self-defense mechanism of great clinical importance in pulmonary research. Conventional light microscopy possesses the capability to visualize individual cilia and its beating pattern but lacks the throughput to assess the global ciliary activities and flow dynamics. Optical coherence tomography (OCT), which provides depth-resolved cross-sectional images, was recently introduced to this area.
Materials and Methods
Fourteen de-identified human tracheobronchial tissues are directly imaged by two OCT systems: one system centered at 1300 nm with 6.5 μm axial resolution and 15 μm lateral resolution, and the other centered at 800 nm with 2.72 μm axial resolution and 5.52 μm lateral resolution. Speckle variance images are obtained in both cross-sectional and volumetric modes. After imaging, sample blocks are sliced along the registered OCT imaging plane and processed with hematoxylin and eosin (H&E) stain for comparison. Quantitative flow analysis is performed by tracking the path-lines of microspheres in a fixed cross-section. Both the flow rate and flow direction are characterized.
Results
The speckle variance images successfully segment the ciliated epithelial tissue from its cilia-denuded counterpart, and the results are validated by corresponding H&E stained sections. A further temporal frequency analysis is performed to extract the ciliary beat frequency (CBF) at cilia cites. By adding polyester microspheres as contrast agents, we demonstrate ex vivo imaging of the flow induced by cilia activities of human tracheobronchial samples.
Conclusion
This manuscript presents an ex vivo study on human tracheobronchial ciliated epithelium and its induced mucous flow by using OCT. Within OCT images, intact ciliated epithelium is effectively distinguished from cilia-denuded counterpart, which serves as a negative control, by examining the speckle variance images. The cilia beat frequency is extracted by temporal frequency analysis. The flow rate, flow direction and particle throughput are obtained through particle tracking. The availability of these quantitative parameters provides us with a powerful tool that will be useful for studying the physiology, pathophysiology and the effectiveness of therapies on epithelial cilia function, as well as serve as a diagnostic tool for diseases associated with ciliary dysmotility.
Keywords: motile cilia, mucociliary clearance, optical coherence tomography, speckle variance, flow dynamics, human tracheobronchial tissue
1. Introduction
Motile cilia are microscale protrusions from ciliated epithelium. They are found in the linings of various human organs such as the respiratory tract, fallopian tubes, epididymis, and middle ear, and are essential for organizing mucous or water flow across the epithelial surface (1,2). For example, the coordinated movements of motile cilia of the tracheobronchial epithelium generate a constant airway mucous flow towards the larynx (3). Thus, inhaled pathogens and particulate matter trapped by the airway mucus can be removed by swallowing or coughing. This process also known as mucociliary clearance (MCC) is an important self-defense mechanism of the respiratory system (4). Failure of MCC, which is found in patients that suffer from primary ciliary dyskinesia (PCD) (5), cystic fibrosis (CF) (6), and chronic obstructive pulmonary disease (COPD) (7), often leads to chronic infections and impaired lung function (8,9).
Conventional light microscopy and confocal microscopy have been widely used for direct visualization of cilia and measurement of related parameters such as ciliary beat frequency (CBF) (10). However, due to the inherent limits on the spatial-bandwidth product imposed on high numerical aperture (NA) system, the field-of-view of the aforementioned technology is inadequate to evaluate more global parameters such as (im)motility index (11,12), CBF statistics, flow pattern, and depth-resolved flow rate at a high throughput.
Recently, optical coherence tomography (OCT) has been applied to study the human respiratory system (13–15) and the MCC in specific, thanks to its cross-sectional imaging capability and fast imaging rate. Like conventional light microscopy, an OCT image can be used to directly assess ciliary motion. Liu et al used spectral domain (SD) high-resolution micro-OCT which enabled direct visualization of ciliary activities on cultured human bronchial epithelial (HBE) and swine trachea samples. The motion pattern of cilia and CBF were directly extracted from the intensity image (16). The latest work by the same group presented an in vivo animal study, in which they quantitatively measured the mucociliary transport rate (17). Although not every OCT possesses the high resolution to allow for the resolution of individual cilium, it is still possible to extract parameters from ensemble measurements. Oldenburg et al presented a quantitative imaging of mucus flow and a semi-quantitative analysis of CBF (18), Wang et al reported an in vivo mapping of cilia located in mouse oviduct using a similar method (19). Moreover, it is also possible to increase the contrast and study the flow dynamics by adding exogenous agents. Jonas et al proposed an OCT based particle tracking velocimetry (PTV) to characterize the cilia driven flow on the ciliated epithelium of Xenopus tropicalis embryos (20). Follow up studies by the same group further expanded the measurement to three dimensions (21,22).
In this manuscript, we presented an ex vivo demonstration of OCT characterization of intact human tracheobronchial ciliated epithelium. Both qualitative and quantitative studies on CBF and cilia driven flow were conducted. To our best knowledge, this is the first study on concurrent measurements of cilia distribution, CBF statistics, and flow dynamics in an ex vivo human tracheobronchial specimen.
2. Method
2.1 Sample preparation
This study used only de-identified human tissue, which was reviewed by the Columbia University Institutional Review Board and deemed not human subjects research. Human tracheal/bronchial tissues were obtained from discarded regions of healthy donor lungs at the time of surgical lung transplantation and processed as previously described (23). In brief, regions of trachea or mainstem bronchi that were trimmed in preparation for anastomosis of the donor lung to a recipient’s mainstem bronchus were collected and immersed in Medium 199 (Gibco, USA) and bubbled overnight in 5% carbon dioxide and 95% oxygen at 4 °C. The tissue was carefully dissected without damaging the ciliated epithelium, and cut into 10 mm by 10 mm rectangular patches. The tissue was warmed in a water bath at 37 °C right before the imaging experiments. All patches were kept in Medium 199 during transport, warming, and imaging.
2.2 Experiment procedure
During the experiment, one patch of the tissue was placed in Medium 199 in a 35-mm glass petri dish (Fisher Scientifics, USA) with the ciliated epithelium facing upward. The petri dish was heated by a close-looped heating platform (TC-423C, Warner Instruments, USA) at 37 °C, while the platform was placed under the sample objective of the 1300 nm spectral-domain optical coherence tomography system (SD-OCT) (Telesto I, Thorlabs, USA) and a custom built 800-nm high resolution SD-OCT system (24). For flow imaging, 20 μL 0.0099% solids 5.15-μm polyester microspheres (Bangs Laboratories, Inc., USA) were added to the solution as contrast enhancement agents.
Specifically, a total number of 14 samples (sample 1–14) were imaged. 7 samples were imaged by the high resolution system and 12 samples were imaged by the Thorlabs system, among which 5 samples were imaged by both systems. Speckle variance analysis was conducted on datasets from both systems for all samples. Flow analysis was only conducted on Thorlabs datasets for 12 samples, while temporal frequency analysis was only conducted on high resolution datasets for 6 samples. The number of datasets acquired from each system was limited due to the reduced viability of the samples over time under the current experiment protocol.
2.3 Image protocol
2.3.1. B-scan imaging
Two-dimensional cross-sectional OCT images were obtained from human tracheobronchial tissues. The FOV was set to 4 mm or 2 mm (length) by 2.51 mm (depth) for Thorlabs system and 2 mm (length) by 1.78 mm (depth) for high-resolution system. The axial resolution for Thorlabs and high-resolution system were 6.5 μm and 2.72 μm, and the lateral resolution for Thorlabs and high resolution system were 15 μm and 5.52 μm, respectively. For each B-scan location, 200 frames were acquired consecutively at 28 kHz A-line rate by Thorlabs system and 42 kHz A-line rate by high-resolution system, respectively. For Thorlabs Telesto system, the data was acquired at a frame rate of 13.5 Hz and each frame included 2048 A-lines, and for the high-resolution system, the frame rate was 84 Hz and each frame consisted of 500 A-lines.
2.3.2. Volumetric functional imaging
Three-dimensional functional images were only acquired by using high-resolution system. A special scanning protocol was programed in LabView (National Instruments, USA). The FOV was 2 mm (length) by 4.4 mm (width) by 1.78 mm (depth). For each width location, 30 consecutive B-scans were acquired at 42 kHz. The step size in width direction was 100 μm.
2.4 Histology processing
The tracheobronchial tissue samples were fixed in 10% neutral buffered formalin solution for 24 hours. They were then transferred to 70% ethanol, dehydrated, embedded in paraffin and sectioned as per standard protocols by the Histology Service Center of the Molecular Pathology department at Columbia University Medical Center. For each specimen, ten 5-μm-thick tissue sections were taken with 100 μm displacement. The tissue sections were stained by H&E and digitalized by using an Aperio system (Leica Biosystems, Germany) at 40×. ImageScope (v12.1.0.5015, Aperio Technologies, USA) was used to review and export the digital images.
2.5 Post processing
2.5.1. Intensity B-scan image
For intensity B-scan images, we were mostly interested in the structural information and its correlation with the histology slides. Therefore, the raw images were first spatially filtered by a 3×3 median filter (2.93 or 5.86 μm × 14.7 μm for the Thorlabs system, and 12 μm × 5.21 μm for the high resolution system) frame by frame to reduce the salt-and-pepper noise. The preprocessed data were then averaged for 4 consecutive B-scans to further improve the contrast. The histogram of averaged B-scans was adjusted in ImageJ for best visual effect.
2.5.2. Speckle variance contrast for cilia mapping
The time-series B-scan images were processed in a way similar to that reported in (18). No preprocessing was performed. The standard deviation of the raw intensity OCT image was first calculated over 200 frames acquired. The calculated standard deviation map was then normalized by the intensity pixel-by-pixel and thresholded by a binary mask to suppress both the high intensity background as well as the dense part of the mucus. The binary mask was obtained by thresholding the minimum intensity projection of the B-scan image stack.
2.5.3. Temporal frequency analysis on the ciliary beat frequency
By taking advantages of the higher axial resolution of the custom-built system, we performed a temporal frequency analysis on the time-series B-scan images following the method reported by Wang et al (19,25). The imaging configurations as described in section 2.3.1 were the same, except the number of the frames acquired for analysis was increased to 1350. 1D Fourier transform was performed on the time-series data in a pixel-by-pixel manner. For each pixel within a B-scan, a temporal spectrum was obtained. We then looked for a dominant frequency with maximum power spectral density corresponding to the CBF in the temporal spectrum in the range of 3 Hz to 20 Hz. The amplitudes of the dominant frequencies were first thresholded to create a binary mask. Color-coded maps were used to visualize the spatial distribution of the dominant frequencies as well as the peak amplitudes above the selected threshold.
2.5.4. Qualitative flow imaging
The flow image was presented in two ways after we subtracted the static background from the raw image. In the first approach, we took the maximum intensity projection (MIP) of acquired 200 B-scans that provided a direct visualization of the beads moving trajectory over time. In the second approach, 200 B-scans were used to construct a color-encoded time-elapsed flow image as described in (20). This color-encoded flow image provided us with additional qualitative perception of the flow rate.
2.5.5 Quantitative flow analysis
We also implemented a quantitative flow analysis to further analyze the flow direction, flow rate, and regional particle statistics. The entire process can be divided into four stages: preprocessing the raw image, locating microspheres within each image, matching microspheres between adjacent frames, and visualizing and calculating the results.
The preprocessing was similar to that described in section 2.5.1; the images were spatially median filtered and the background was suppressed by using MIP. The preprocessed images were thresholded to produce a series of binary masks, where only the highly scattering microspheres were preserved.
We then calculated the centroid of each microsphere based on the mask frame by frame. After locating all the microspheres in the first frame and recording their location in stacks, we paired the microspheres from the next frame based on following criteria,
The microsphere #m in ith frame was paired with the microsphere #n in (i+1)th frame if and only if the nearest neighbor of microsphere #m in (i+1)th frame is #n and the nearest neighbor of microsphere #n in ith frame was #m.
The presumption was that the inter-frame displacement (velocity) of each microsphere was relatively smaller than the distance between neighboring microspheres. In other words, as long as the frame rate was high to keep the inter-frame displacement low, we could always correctly pairing microspheres from frame to frame.
After pairing, the coordinates of the microspheres in the second frame were pushed into the corresponding stacks. By repeating this procedure, we created a series of stacks, each of which corresponded to a unique microsphere. The stacks saved all the evolved coordinates of the microspheres, and the length of an individual stack represented the life time of a microsphere. Therefore, based on the data, we evaluated the parameters of our interest such as the microsphere traveling velocity and its distribution.
3. Results
3.1. OCT structural image
To show the usefulness of OCT, we took OCT images from multiple human tracheobronchial samples, and compared them with their corresponding H&E stained tissue section. Figure 1 shows a comparison between the OCT images and the corresponding H&E stained section for the intended FOV. The OCT images were taken by using Thorlabs Telesto I system. From the structural OCT images, we could clearly see the structures such as mucus gland duct (MD), mucus secreting glands (MG), and perichondrium (P) with high contrast. However, the boundary between ciliated epithelium (CE) and basement membrane (BM) was not well discriminated in OCT images other than Figure 1(a), which was mainly due to the limited axial resolution and low optical contrast between these two layers. The mucous layer was not visualized in the H&E tissue sections due to its removal during tissue processing.
Figure 1.

Human tracheobronchial tissue OCT images (a), (c), (e), and (g) and corresponding H&E stained tissue section (b), (d), (f), and (h). The samples represented in (a), (c), (e), (g) were sample 8, sample 1, sample 8, and sample 3, respectively. The OCT images were imaged by Thorlabs Telesto system. BM: Basement membrane, C: Cartilage ring. CE: Ciliated Epithelium, M: Mucus. MG: Mucus secreting glands. MD: Mucus gland duct. PC: Perichondrium.
Other than the structural images that showed the morphology of the tracheobronchial tissues, OCT images also provided us with an intriguing perspective about the way MCC functions; The OCT B-scan in Figure 2 illustrates that mucus is secreted from the human mucus gland duct as previously described by Liu et al in swine trachea (16). It is worth noting that in these ex vivo preparations, the OCT visible mucus was the one that was actively secreted by the mucus grands and highly scattering, but as the mucus became more hydrated and less dense, it became less scattering and OCT invisible. In addition, the active secretion of mucus visualized during the imaging process demonstrated the viability of the intact tissue.
Figure 2.

Observation of mucus excretion and its effect. Mucus secreted from the mucus gland duct (sample 2). The images were imaged by Thorlabs Telesto system. M: Mucus. MD: Mucus gland duct. T: Tracheal wall.
3.2. Speckle variance image of ciliated epithelium layer
Although the OCT systems used in this study did not have sufficient resolutions to directly visualize individual cilium structurally, we could indirectly identify intact ciliated regions through speckle variance images as reported in literatures (18,26); as the beating of cilia resulted in fluctuations of the acquired OCT image’s intensity. Therefore, we can separate the intact ciliated epithelium from the cilia-denuded regions by using the method mentioned in section 2.5.2. We presented a resultant image by processing Figure 1(e) in Figure 3, where we also compared the resultant speckle variance image with its corresponding H&E stained tissue section. We could see that an intensified layer covered most of the sample in Figure 3(c), which was very likely due to high ciliary motion. The speculation was further confirmed by the corresponding H&E stained section. One zoom-in region from the Figure 3(c) was shown in Figure 3(d), where we can see a uniformly intensified layer on the epithelial surface. From the corresponding H&E stained section in Figure 3(e), we could verify that the entire region was covered by dense cilia. On the other hand, we selected another region that shows a discontinued layer of intensified variance in Figure 3(f). Comparing it with its corresponding H&E stained section (Figure 3(g)), we can recognize that the discontinuity of the layer indeed stemmed from the absence of the cilia.
Figure 3.

The calculated speckle variance image in comparison with its original intensity OCT image as well as corresponding H&E stained tissue (sample 8). (a) H&E stained tissue histology slide. (b) The intensity OCT image. (c) Calculated speckle variance image, where the ciliated epithelium has a higher variance than other parts of the sample. It is visualized as a layer on top of the specimen. Two zoom-in regions (d) and (f) of the speckle variance image and their corresponding zoomed-in H&E stained tissue (e) and (g). In (d), the entire specimen is covered by ciliated epithelium as confirmed in (e). In (f), there are two regions, where no high contrast layer-like structure is presented. Those two regions are not covered by cilia, as verified by the H&E stained tissue (g). The images were imaged by Thorlabs Telesto system. NC: cilia-denuded. C: ciliated epithelium. Note: the protrusions that C1 pointed to in (f) is an interpolation artifact instead of cilia. The cilia are represented by the high intensity layer beneath.
Then, a volumetric visualization of ciliated epithelium of human trachea was presented in Figure 4(a), where the speckle variance was color-encoded, thresholded above 0.5, and overlaid against a volumetric OCT dataset. A side-by-side comparison between the structural OCT B-scan and its functional counterpart was also given. In the volume, we can see that the ciliated epithelium only covered the right half of the sample. We believe this might be ascribed to physical injury sustained by the sample during the excision and handling, in which the left half of the ciliated epithelium was denuded by external forces.
Figure 4.
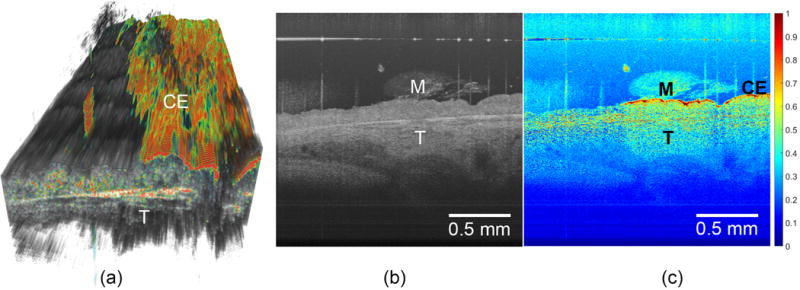
Three-dimensional visualization of human tracheal specimen (sample 9). The volumetric dataset consists of 500 pixels (width) × 45 pixels (length) × 1024 pixels (depth) and was obtained by using the customized scanning protocol with high resolution SDOCT detailed in the method section. (a) Structural image overlaid against threshold variance image. The ciliary motion is only observed on the right half surface of the sample (b) The cross-sectional view of the sample, and (c) its corresponding variance image. M: mucus. CE: ciliated epithelium, which is visible in speckle variance image. T: trachea.
3.3. Temporal frequency analysis on the ciliary beat frequency
The CBF of 11 regions of 3 donor samples that were immersed in medium were measured. The mean CBF was 8.6 Hz with a standard deviation of 1.0 Hz. For comparison, the CBF of another 9 regions from 4 donor samples were imaged without immersion in medium. The mean CBF was measured 5.3 Hz with a standard deviation of 0.8 Hz. We presented a color-coded spatial map of peak amplitudes of dominant frequencies of ex vivo human trachea samples taken by the custom-built system in Figure 5(a). This sample was imaged without being immersed in medium and with an intact dense mucus layer. The pseudo-color map, which indicated the location of the motile cilia, was overlaid with the original intensity OCT image.
Figure 5.
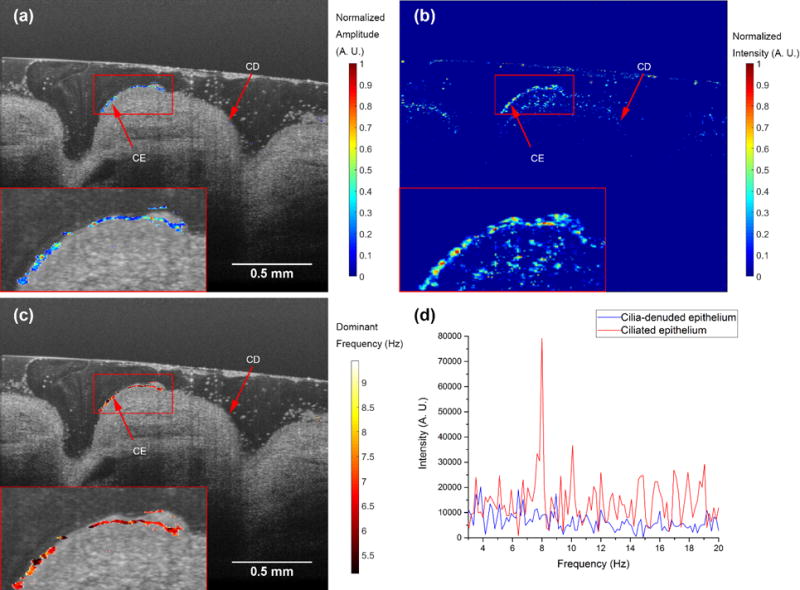
The temporal frequency analysis on the ciliary beat frequency of human trachea sample with the presence of mucus layer (sample 13). (a) A color-coded spatial map of dominant frequency amplitude after thresholding and normalization. The pseudo-color spatial map was overlaid with the original intensity OCT image. (b) Speckle variance image. (c) A color-coded spatial map of dominant frequency. The pseudo-color spatial map was overlaid with the original intensity OCT image. (d) The temporal spectra of two locations. The red curve represents the ciliated epithelium, and the blue curve represents the cilia-denuded epithelium. We observed an 8 Hz peak on ciliated epithelium. The original intensity OCT image was averaged 4 times. All images were taken by the custom-built high-resolution SD-OCT system. CE: ciliated epithelium. CD: ciliadenuded Epithelium.
By comparing the temporal frequency analysis results with the speckle variance image presented in Figure 5(b), the ciliated epithelium on the surface of the tissue was recognized by the temporal frequency analysis, and the mucus artifact presented in speckle variance images were mostly rejected. For example, the artifacts due to the mucus presence in the left part of the speckle variance image were rejected by the temporal frequency analysis. Zoomed-in views of the ciliated epithelium region were provided in the insets.
In Figure 5 (c), the dominant frequencies were color-coded and overlaid with the original OCT image. The mean CBF was measured 6.5 Hz±0.47 Hz. We also picked two locations, one on the ciliated epithelium and the other off, and plotted their temporal spectra in Figure 5(d). The red curve, which represents the ciliated epithelium, shows a dominant frequency around 8 Hz, while the spectrum of the cilia-denuded epithelium (blue curve) was more randomly distributed. The mean CBF we measured from the samples was slightly smaller than expected, which can be ascribed to the imperfect tissue preservation protocol.
3.4 Qualitative flow image
In Figure 6, we presented the results by applying both the MIP and color-encoded time-elapsed imaging as mentioned in section 2.5.3. The MIP cilia-driven fluid flow patterns from two human tracheobronchial samples were visualized in Figure 6(a) and (c), while their color-encoded counterparts were illustrated in Figure 6(b) and (d). The time span for all the images was 16.627 s. The MIP images provided us with a general idea of the flow pattern; the particle path-lines roughly followed the surface topography of the tissue at the beginning, and then they started to circulate whenever the flow was blocked by the dense mucus areas. On the other hand, the color-coded images offered a semi-quantitative picture; the frequency of the change in color could help gain a basic view of the flow rate.
Figure 6.
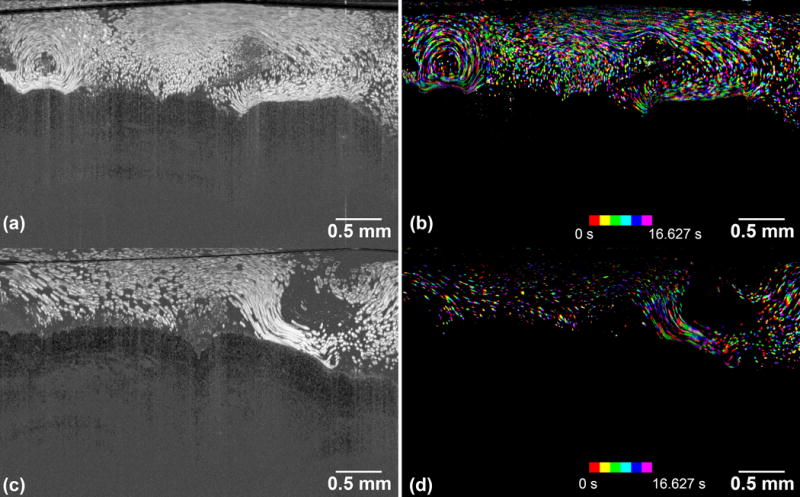
The flow images of the microspheres induced by the beating of ciliated epithelium. (a) and (c) are MIP image by integrating all 200 B-scans. (b) and (d) are corresponding color-encoded time-elapsed images. The sample represented in (a), (c) are sample 5 and sample 6, respectively. The time span of all the images are 16.627 s, while the 1st eighth interval of the entire time duration is colored by red, the 2nd of that is colored by yellow, …, and 8th of that is colored by purple. The images were imaged by Thorlabs Telesto system.
3.5 Quantitative flow analysis
The dataset from Figure 6(a) was used in this quantitative flow analysis following the procedure in section 2.5.4. The results were illustrated in Figure 7. The direction of each arrow represents the local averaged direction of particle movements, and the averaged particle velocity was color- and length-encoded. In Figure 7(a), we further focused on the statistics of the particles that were in the closest proximity of the ciliated epithelium as shown in the red box. A total number of 2,251 microspheres were tracked and the mean velocity is measured 54.9 μm/s with a standard deviation of 12.3 μm/s, and a corresponding histogram was presented in Figure 7(b).
Figure 7.
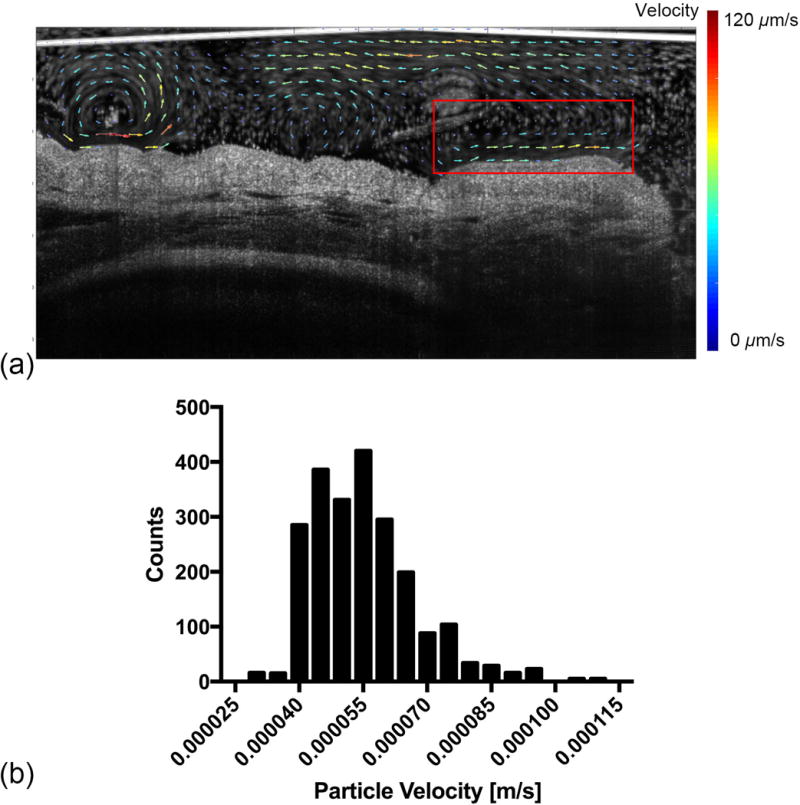
The quantitative cilia-driven flow analysis (sample 5). The dataset is the same as that in Figure 5 (a). (a) The vector visualization of flow dynamics. The direction of the arrow represents the averaged flow direction and the flow rate is encoded in both arrow length and color. (b) The histogram of all the tracked particles inside the red box shown in (a). The total time duration is 16.627 s and 2,251 microspheres are tracked. The images were imaged by Thorlabs Telesto system.
Here we are not providing an aggregated flow statistics of all 10 samples we have imaged with contrast agents. The rationale behind is that we believe the flow rates velocity we measured were influenced by multiple variables such as the medium viscosity, beads mass density, ciliary motion, and sample morphology. This makes a complete aggregated flow statistics less informative.
4. Discussions
To our best knowledge, this is the first time that ciliary motion on human tracheobronchial tissue as well as its induced flow is simultaneously analyzed by using OCT. With the help of functional OCT technique, speckle variance imaging, we successfully differentiated the ciliated epithelium from its cilia-denuded region. The results were validated by corresponding H&E stained sections. We were also able to directly measure the CBF and its statistics. Moreover, both qualitative and quantitative flow analyses were performed to assess the cilia-induced flow direction and rate.
4.1 The effect of residual mucus
One of the issues we had encountered in our speckle variance imaging was the adverse influence from the residual dense mucus layer. As illustrated in both Figure 1(e) and Figure 3(c), the dense mucus layer not only scattered excessive light in structural image, but also introduced noises in speckle variance images and reduce the visibility of cilia. However, it was possible to utilize the temporal frequency analysis to spectrally filter the signal and reject the noises from the mucus. As we presented in Figure 5, the ciliary activities induced dominant frequencies in the temporal frequency domain, and we could use both amplitude and frequency of the dominant frequencies to differentiate the cilia against the mucus (19,25). It is worth mentioning that the mucus located in the proximity of the ciliated epithelium possessed a similar dominant frequency as the underlying cilia. However, its peak amplitude was much lower than that of the underlying cilia, and we could reject those signals by carefully thresholding the peak amplitude.
4.2 The particle tracking and flow rate measurement
The particle tracking algorithm we used in this study heavily relied on the presumption that the distance traveled by one microsphere within two consecutive frames was less than the minimum distance between the microsphere and its neighbors. This effectively confined our dynamic range in terms of rate measurement; for a fixed microsphere density, the higher frame rate, the faster flow rate we can detect with better accuracy.
Furthermore, we placed a realistic check on the measured inter-frame displacement to eliminate the possibility of mispairing a microsphere with its nearest neighbor, when it is moving out of the field-of-view. The maximum allowed inter-frame displacement is set to 20 μm, which is corresponding to a flow rate of 273.4 μm/s at 13.5 frame/s. While we didn’t measure the smallest detectable velocity, if it is assumed that the smallest displacement is single-pixel, then for a total frame of 200 (a duration of 14.8 s), the minimum detectable rate was 0.066 μm/s in × direction and 0.33 μm/s in y direction.
It is also worth noting that the measured flow rate might be underestimated due to the imperfect alignment of the B-scan direction and the superior-inferior axis of the airway. Currently, the alignment relied on visual inspection. After roughly finding a B-scan angle with fastest flow rate, we rotated the B-scan direction by 90° and inspected the movement of microspheres. If the microspheres did not present any horizontal movement in this orthogonal direction, we considered the original B-scan direction is aligned. On the other hand, if we took an MIP image at the orthogonal direction of a well aligned B-scan direction, we would see an increased density of microspheres in addition to a high-contrast cilia layer as illustrated in Figure 8. To better estimate the flow rate, the incorporation of three-dimensional flow velocimetry could be a viable solution (21).
Figure 8.

The MIP image of microsphere flow at an orthogonal direction to superior-inferior axis of trachea tissue (sample 5). No particle path-line is presented. The left half of the sample has much higher microsphere intensity than right half, which implies the ciliary motion is stronger in the left half than that of the right half. The images were imaged by Thorlabs Telesto system.
4.3 Study limitations
The human tissues we received were discarded samples from healthy donors. The tissues were bubbled with 95% oxygen and 5% carbon dioxide in medium 199 in the operation room to maintain viability until imaging. This process diluted the mucus concentration from what would be observed in vivo. We observed that dense and thick mucus layers reduce the ability to observe the cilia-induced speckle variance signals. Moreover, the presence of mucus prevented microspheres from reaching the ciliated epithelium and thus made it difficult to conduct flow analysis. On the contrary, temporal frequency analysis was robust against the presence of the mucus as shown in section 3.3 and Figure 5. In the future, flow dynamics can be conducted by tracking inherent scatters within thick and dense mucus, as within samples from CF patients, and we can also conduct OCT imaging within physiologically-relevant mucus environment that are comparable to in vivo situation by utilizing an air-liquid interface experimental setup (27). One way of doing this is through utilizing the active mucus secretion (Figure 2) from the excised tracheobronchial tissue (16) or we can first unload the mucus attached to the sample upon retrieval, and load with newly secreted mucus. Nevertheless, our current system can be helpful in assessing ciliary motility abnormalities that is primarily due to intrinsic ciliated epithelium defects, such as in PCD.
It was also important to control the temperature of the sample through the entire process; the tissue had to be immediately placed in ice after excision, and bubbled at 4 °C. After the tissue being transferred to the nutrition solution, it was necessary to gradually heat the nutrition solution up to 37 °C and then maintain the temperature at this level throughout the imaging session by using a heating plate. Higher or lower temperature will lead to reduced vitality of the sample and suppressed viability of cilia (28), which thus reduces speckle variance or flow rate.
4.4 Future work
4.4.1 Cilia coverage data
The cilia coverage data is of great interest in early detection of primary ciliary dyskinesia (PCD) among children, a disease that stems from intrinsic ciliated epithelial cell abnormalities that affect ciliary motility. It is often termed as “(im)motility index” and is used as one of the parameters in PCD diagnosis (11). Historically, this parameter was manually calculated and extracted from in vitro cultured cells by researchers or clinicians based on the images taken by electron microscopy or high-speed digital camera. Here in this manuscript, we presented that the (im)motility index can be automatically measured from ex vivo human samples, and the results was then validated by histological slides. Quantification of cilia coverage percentage can also be used in experiments where damage, injury, and regeneration are studied.
4.4.2 Ciliary beat frequency and flowing imaging using contrast agents
CBF is one of the most important parameters in studying MCC. Previously, this parameter was mainly manually measured even with the aid of OCT (16,29). Recently, temporal frequency/Fourier analysis was adopted by different groups on different subjects, including mice oviduct and swine trachea (17,19,25). In this manuscript, we presented a similar demonstration on ex vivo human trachea. One of the highlights of our study is the presence of dense mucus; we presented that the temporal frequency analysis is robust against a mucus layer up to 0.4 mm.
With the capability of measuring CBF with mucus layer, we could further seed contrast agents in the mucus layer, and measured the flow rate simultaneously. The combined knowledge of CBF and flow rate could provide us with more insights about the biomechanics of the ciliary beating as well as the MCC in ex vivo models.
5. Conclusion
In this manuscript, we reported ex vivo characterization of human tracheobronchial tissues by using OCT. Both structural imaging and two types of functional imaging were performed. By using speckle variance imaging, we could differentiate the ciliated epithelium from the denuded-ciliated regions in both B-scans and volumetric images, and the results were validated by histological analysis. We also conducted both qualitative and quantitative flow studies by adding micro-scale contrast agents to construct flow patterns, which makes this platform promising for the study of normal and pathological ciliary function and for the development of future therapeutics for the modulation of mucociliary clearance. Additionally, it can serve as a functional diagnostic tool for those with suspected ciliary motility abnormalities, such as in primary ciliary dyskinesia (PCD). Compared with previous OCT studies on ciliary motion, this was the first time that both cilia distribution and flow dynamics are simultaneously obtained from a human tracheobronchial specimen. The incorporation of the real morphology of human tissue as well as the residue mucus made this study valuable.
Acknowledgments
The authors would like to thank Dr. Yi Zhang for sample preparation, Mr. Yu Gan for helpful discussion, Mr. Dajiang Sun for histology processing. This work was funded by the following sources: NIH 1DP2HL127776-01 (CPH), and NIH 1R01HL118419-01 (MAC).
Footnotes
Conflict of Interest Disclosures: All authors have completed and submitted the ICMJE Form for Disclosure of Potential Conflicts of Interest and none were reported.
References
- 1.Afzelius BA. Cilia-related diseases. The Journal of Pathology. 2004;204(4):470–477. doi: 10.1002/path.1652. [DOI] [PMC free article] [PubMed] [Google Scholar]
- 2.Baker K, Beales PL. Making sense of cilia in disease: The human ciliopathies. American Journal of Medical Genetics Part C: Seminars in Medical Genetics. 2009;151C(4):281–295. doi: 10.1002/ajmg.c.30231. [DOI] [PubMed] [Google Scholar]
- 3.Matsui H, Randell SH, Peretti SW, Davis CW, Boucher RC. Coordinated clearance of periciliary liquid and mucus from airway surfaces. The Journal of Clinical Investigation. 1998;102(6):1125–1131. doi: 10.1172/JCI2687. [DOI] [PMC free article] [PubMed] [Google Scholar]
- 4.Knowles MR, Boucher RC. Mucus clearance as a primary innate defense mechanism for mammalian airways. The Journal of Clinical Investigation. 2002;109(5):571–577. doi: 10.1172/JCI15217. [DOI] [PMC free article] [PubMed] [Google Scholar]
- 5.Camner P, Mossberg B, Afzelius BA. Measurements of tracheobronchial clearance in patients with immotile-cilia syndrome and its value in differential diagnosis. Eur J Respir Dis Suppl. 1983;127:57–63. [PubMed] [Google Scholar]
- 6.Boucher RC. New concepts of the pathogenesis of cystic fibrosis lung disease. European Respiratory Journal. 2003;23(1):146. doi: 10.1183/09031936.03.00057003. [DOI] [PubMed] [Google Scholar]
- 7.Hogg JC. Pathophysiology of airflow limitation in chronic obstructive pulmonary disease. The Lancet. 2004;364(9435):709–721. doi: 10.1016/S0140-6736(04)16900-6. [DOI] [PubMed] [Google Scholar]
- 8.Livraghi A, Randell SH. Cystic fibrosis and other respiratory diseases of impaired mucus clearance. Toxicologic Pathology. 2007;35(1):116–129. doi: 10.1080/01926230601060025. [DOI] [PubMed] [Google Scholar]
- 9.Houtmeyers E, Gosselink R, Gayan-Ramirez G, Decramer M. Regulation of mucociliary clearance in health and disease. European Respiratory Journal. 1999;13(5):1177–1188. doi: 10.1034/j.1399-3003.1999.13e39.x. [DOI] [PubMed] [Google Scholar]
- 10.Delmotte P, Sanderson MJ. Ciliary beat frequency is maintained at a maximal rate in the small airways of mouse lung slices. American Journal of Respiratory Cell and Molecular Biology. 2006;35(1):110–117. doi: 10.1165/rcmb.2005-0417OC. [DOI] [PMC free article] [PubMed] [Google Scholar]
- 11.Greenstone M, Rutman A, Dewar A, MacKay I, Cole PJ. Primary ciliary dyskinesia: Cytological and clinical features. QJM. 1988;67(2):405–423. [PubMed] [Google Scholar]
- 12.Smith CM, Kulkarni H, Radhakrishnan P, Rutman A, Bankart MJ, Williams G, Hirst RA, Easton AJ, Andrew PW, O’Callaghan C. Ciliary dyskinesia is an early feature of respiratory syncytial virus infection. European Respiratory Journal. 2014;43(2):485–496. doi: 10.1183/09031936.00205312. [DOI] [PubMed] [Google Scholar]
- 13.Armstrong JJ, Leigh MS, Sampson DD, Walsh JH, Hillman DR, Eastwood PR. Quantitative upper airway imaging with anatomic optical coherence tomography. American Journal of Respiratory and Critical Care Medicine. 2006;173(2):226–233. doi: 10.1164/rccm.200507-1148OC. [DOI] [PubMed] [Google Scholar]
- 14.Ridgway JM, Su J, Wright R, Guo S, Kim DC, Barretto R, Ahuja G, Sepehr A, Perez J, Sills JH, Chen Z, Wong BJF. Optical coherence tomography of the newborn airway. The Annals of otology, rhinology, and laryngology. 2008;117(5):327–334. [PMC free article] [PubMed] [Google Scholar]
- 15.Han S, El-Abbadi NH, Hanna N, Mahmood U, Mina-Araghi R, Jung WG, Chen Z, Colt H, Brenner M. Evaluation of tracheal imaging by optical coherence tomography. Respiration. 2005;72(5):537–541. doi: 10.1159/000087680. [DOI] [PubMed] [Google Scholar]
- 16.Liu L, Chu KK, Houser GH, Diephuis BJ, Li Y, Wilsterman EJ, Shastry S, Dierksen G, Birket SE, Mazur M, Byan-Parker S, Grizzle WE, Sorscher EJ, Rowe SM, Tearney GJ. Method for quantitative study of airway functional microanatomy using micro-optical coherence tomography. PLoS ONE. 2013;8(1):e54473. doi: 10.1371/journal.pone.0054473. [DOI] [PMC free article] [PubMed] [Google Scholar]
- 17.Chu KK, Unglert C, Ford TN, Cui D, Carruth RW, Singh K, Liu L, Birket SE, Solomon GM, Rowe SM, Tearney GJ. In vivo imaging of airway cilia and mucus clearance with micro-optical coherence tomography. Biomedical optics express. 2016;7(7):2494–2505. doi: 10.1364/BOE.7.002494. [DOI] [PMC free article] [PubMed] [Google Scholar]
- 18.Oldenburg AL, Chhetri RK, Hill DB, Button B. Monitoring airway mucus flow and ciliary activity with optical coherence tomography. Biomedical optics express. 2012;3(9):1978–1992. doi: 10.1364/BOE.3.001978. [DOI] [PMC free article] [PubMed] [Google Scholar]
- 19.Wang S, Burton JC, Behringer RR, Larina IV. In vivo micro-scale tomography of ciliary behavior in the mammalian oviduct. Scientific reports. 2015;5:13216. doi: 10.1038/srep13216. [DOI] [PMC free article] [PubMed] [Google Scholar]
- 20.Jonas S, Bhattacharya D, Khokha MK, Choma MA. Microfluidic characterization of cilia-driven fluid flow using optical coherence tomography-based particle tracking velocimetry. Biomedical optics express. 2011;2(7):2022–2034. doi: 10.1364/BOE.2.002022. [DOI] [PMC free article] [PubMed] [Google Scholar]
- 21.Huang BK, Gamm UA, Bhandari V, Khokha MK, Choma MA. Three-dimensional, three-vector-component velocimetry of cilia-driven fluid flow using correlation-based approaches in optical coherence tomography. Biomedical optics express. 2015;6(9):3515–3538. doi: 10.1364/BOE.6.003515. [DOI] [PMC free article] [PubMed] [Google Scholar]
- 22.Gamm UA, Huang BK, Syed M, Zhang X, Bhandari V, Choma MA. Quantifying hyperoxia-mediated damage to mammalian respiratory cilia-driven fluid flow using particle tracking velocimetry optical coherence tomography. Journal of biomedical optics. 2015;20(8):080505–080505. doi: 10.1117/1.JBO.20.8.080505. [DOI] [PMC free article] [PubMed] [Google Scholar]
- 23.Danielsson J, Perez-Zoghbi J, Bernstein K, Barajas MB, Zhang Y, Kumar S, Sharma PK, Gallos G, Emala CW. Antagonists of the tmem16a calcium-activated chloride channel modulate airway smooth muscle tone and intracellular calcium. Anesthesiology. 2015;123(3):569–581. doi: 10.1097/ALN.0000000000000769. [DOI] [PMC free article] [PubMed] [Google Scholar]
- 24.Yao X, Gan Y, Marboe CC, Hendon CP. Myocardial imaging using ultrahigh-resolution spectral domain optical coherence tomography. Journal of biomedical optics. 2016;21(6):061006–061006. doi: 10.1117/1.JBO.21.6.061006. [DOI] [PMC free article] [PubMed] [Google Scholar]
- 25.Burton JC, Wang S, Behringer RR, Larina IV. Three-dimensional imaging of the developing mouse female reproductive organs with optical coherence tomography. 2016:97160E-97160E–97165. [Google Scholar]
- 26.Huang BK, Gamm UA, Jonas S, Khokha MK, Choma MA. Quantitative optical coherence tomography imaging of intermediate flow defect phenotypes in ciliary physiology and pathophysiology. Journal of biomedical optics. 2015;20(3):030502–030502. doi: 10.1117/1.JBO.20.3.030502. [DOI] [PMC free article] [PubMed] [Google Scholar]
- 27.Pezzulo AA, Starner TD, Scheetz TE, Traver GL, Tilley AE, Harvey B-G, Crystal RG, McCray PB, Zabner J. The air-liquid interface and use of primary cell cultures are important to recapitulate the transcriptional profile of in vivo airway epithelia. American Journal of Physiology – Lung Cellular and Molecular Physiology. 2011;300(1):L25–L31. doi: 10.1152/ajplung.00256.2010. [DOI] [PMC free article] [PubMed] [Google Scholar]
- 28.Christopher AB, Ochoa S, Krushansky E, Francis R, Tian X, Zahid M, Muñoz R, Lo CW. The effects of temperature and anesthetic agents on ciliary function in murine respiratory epithelia. Frontiers in Pediatrics. 2014;2(111) doi: 10.3389/fped.2014.00111. [DOI] [PMC free article] [PubMed] [Google Scholar]
- 29.Liu L, Shastry S, Byan-Parker S, Houser GK, Chu K, Birket SE, Fernandez CM, Gardecki JA, Grizzle WE, Wilsterman EJ, Sorscher EJ, Rowe SM, Tearney GJ. An autoregulatory mechanism governing mucociliary transport is sensitive to mucus load. American Journal of Respiratory Cell and Molecular Biology. 2014;51(4):485–493. doi: 10.1165/rcmb.2013-0499MA. [DOI] [PMC free article] [PubMed] [Google Scholar]