

Abstract
Patients with type 2 diabetes mellitus (T2DM) have increased fracture risk despite normal or increased bone mineral density (BMD). Elevations in marrow adipose tissue (MAT) and declines in MAT unsaturation are both associated with increased skeletal fragility. The objective of our study was to characterize the quantity and composition of MAT in adults with morbid obesity and T2DM, and to evaluate determinants of MAT. We studied 21 adults with morbid obesity prior to bariatric surgery, 8 of whom had T2DM. All subjects underwent 1H-MR spectroscopy of the lumbar spine and femur for assessment of MAT and dual-energy x-ray absorptiometry (DXA) and quantitative computed tomography (QCT) of the lumbar spine and hip for assessment of areal BMD (aBMD) and volumetric BMD (vBMD). Visceral (VAT) and subcutaneous adipose tissue (SAT) were quantified by CT at L1-2. Subjects with T2DM had higher vBMD of the femoral neck and higher total MAT at the lumbar spine and femoral metaphysis compared to non-diabetic controls (p≤0.04). Lipid unsaturation index (UI) was significantly lower at the femoral diaphysis in T2DM (p=0.03). Within the entire cohort, HbA1c was positively associated with MAT (p≤0.03), and age was associated with higher MAT and lower MAT unsaturation (p≤0.05). Lumbar spine vBMD was inversely associated with lumbar spine MAT (p=0.04). There was an inverse association between SAT and diaphyseal MAT (p<0.05) while there were no associations with VAT. Subjects with morbid obesity and T2DM have higher MAT with a lower proportion of unsaturated lipids, despite higher femoral neck vBMD. MAT is positively associated with age and HbA1c, and inversely associated with vBMD, suggesting that MAT may serve as an imaging biomarker of skeletal health and metabolic risk.
Keywords: marrow adipose tissue (MAT); marrow adipose tissue composition; proton MR spectroscopy, bone mineral density; quantitative computed tomography (QCT); dual-energy x-ray absorptiometry (DXA); type 2 diabetes mellitus (T2DM); morbid obesity
1. INTRODUCTION
Type 2 diabetes mellitus (T2DM) is characterized by chronic hyperglycemia and insulin resistance, and is frequently accompanied by obesity [1]. Patients with T2DM often have normal or increased bone mineral density (BMD), but a paradoxical increase in fracture risk [2-6]. Recent studies have revealed the potential impact of marrow adipose tissue (MAT) in the pathogenesis of bone loss. Bone strength is affected not only by BMD and bone microarchitecture but also its micro-environment [7]. Many osteoporotic states, including old age, glucocorticoid use, immobility and anorexia nervosa are associated with increased marrow adiposity [8-10], suggesting that MAT may contribute to decreased bone strength and increased fracture risk. In fact, increased MAT content could play a role in the detrimental effects of obesity on bone. Studies have shown higher MAT content in subjects with obesity compared to normal-weight controls and positive associations with visceral adipose tissue (VAT) and MAT [11, 12].
MAT can be quantified non-invasively using proton magnetic resonance spectroscopy (1H-MRS) which correlates closely with bone biopsies [13]. Moreover, MAT content measured by 1H-MRS in combination with BMD may be more valuable than either parameter alone in evaluating skeletal integrity [7, 14]. We have previously demonstrated inverse associations between MAT and BMD in adults with obesity and low body weight [8, 12, 15].
Moreover, recent studies have used 1H-MRS to also assess the composition of MAT, such as unsaturated and saturated lipids, as a biomarker of skeletal integrity [16-19]. Elevations in MAT content and declines in MAT unsaturation of the lumbar spine were associated with osteoporosis [19] and fragility fractures [18]. Furthermore, lower vertebral MAT unsaturation was found in women with T2DM compared to healthy controls, suggesting that it may also serve as a biomarker for metabolic risk, such as insulin resistance [16, 18].
In addition to impacting skeletal integrity, MAT has been postulated to have extraskeletal effects on energy metabolism. Bone marrow adipocytes express the insulin receptor and are known to produce adipokines [20, 21]. MAT expansion has been observed in the setting of metabolic stress, including anorexia nervosa, high fat feeding, and leptin deficiency [8, 22-24]. Therefore, it is possible that bone marrow adiposity is a contributing player in the pathogenesis of T2DM.
The purpose of this pilot study study was to characterize the quantity and composition of MAT in adults with morbid obesity and T2DM, and to evaluate determinants of MAT at the lumbar spine and hip. We hypothesized that subjects with obesity and T2DM would have higher MAT content but lower unsaturation compared to non-diabetic controls of similar weight.
2. MATERIALS AND METHODS
Our study was IRB approved and Health Insurance Portability and Accountability Act compliant. Written informed consent was obtained from all subjects prior to performance of any study procedures.
2.1. Subjects
Subjects with morbid obesity who were scheduled to undergo bariatric surgery were recruited from the MGH Weight Center. Inclusion criteria were age ≥ 18 years. Exclusion criteria were history of medical disorders known to affect bone metabolism, use of bone-active medication including thiazolidinediones, pregnancy, weight >182 kg (due to limitations of the MRI scanner) and contraindications to MRI, such as the presence of a pacemaker or metallic implant. The following blood tests were obtained after an overnight fast: serum glucose, insulin, hemoglobin A1c (HbA1c), calcium, 25-hydroxyvitamin D, and parathyroid hormone (PTH), triglycerides, total, high-density lipoprotein (HDL), and low-density lipoprotein (LDL) cholesterol. Diabetes status was assessed by self-report of diabetes and/or use of diabetic medications, and confirmed by review of medical records.
2.2 Marrow adipose tissue assessment
Subjects underwent 1H-MRS of the 1st and 2nd lumbar vertebrae (L1-L2) and the left proximal femoral metaphysis and mid femoral diaphysis. All studies were performed on a 3.0-T MR imaging system (Siemens Trio; Siemens Medical Systems, Erlangen, Germany) after an overnight fast. Single-voxel 1H-MRS data were acquired with a point-resolved spatially localized spectroscopy pulse sequence (TR/TE 3000/30, eight acquisitions, 1024 data points, and receiver bandwidth of 1000 Hz). For lumbar spine MAT assessment, a voxel measuring 15 × 15 × 15 mm (3.4 ml) was placed within the anterior L1 and the L2 vertebral bodies avoiding cortical bone and posterior venous plexus. For femoral MAT assessment, a voxel measuring 12 × 12 × 12 mm (1.7 ml) was positioned within the in the proximal femoral metaphysis at the intertrochanteric region and the mid-diaphysis, equidistant to femoral head and medial femoral condyle (Figure 1). Spectral data were acquired with and without frequency selective water signal suppression. For each voxel placement, automated optimization of gradient shimming was performed [8, 11, 17].
Figure 1.

Voxel placement for lumbar spine (A), femoral metaphysis (B) and femoral diaphysis (C) marrow adipose tissue quantification.
Fitting of all 1H-MRS data was performed using LCModel (version 6.3-0K, Stephen Provencher, Oakville, Canada). Data were transferred from the scanner to a Linux workstation and metabolite quantification was performed using eddy current correction and water scaling. A customized fitting algorithm for bone marrow analysis provided estimates for 5 lipid peaks: olefinic protons at 5.2 and 5.3 ppm (-CH=CH-), an estimate of fatty acid unsaturated bonds; methylene protons at 1.3 ppm [(-CH2-)n], an estimate of fatty acids saturated bonds; allylic methylene protons at 2.0 ppm (-CH=CH-CH2-); methyl protons at 0.9 ppm (-CH3); and methylene protons β to carbonyl at 1.6 ppm (-CH2-O-CO-CH2-CH2-). Total marrow lipid content was determined from the unsuppressed spectra by combining all lipid peaks (0.9, 1.3, 1.6, 2.0, 5.2 and 5.3 ppm). Average MAT content of L1-L2 was assessed. Lipid resonances were scaled to unsuppressed water peak (4.7 ppm) and expressed in lipid-to-water ratios. Unsaturated lipid estimates were obtained from water suppressed spectra (Figure 2). The unsaturation index (UI) was determined by obtaining a ratio between the olefinic resonance at 5.2 and 5.3 ppm and total lipid content as previously described [18, 19]. Coefficient of variation for MAT quantification (total and unsaturated lipids) at our institution is 5% [25].
Figure 2.
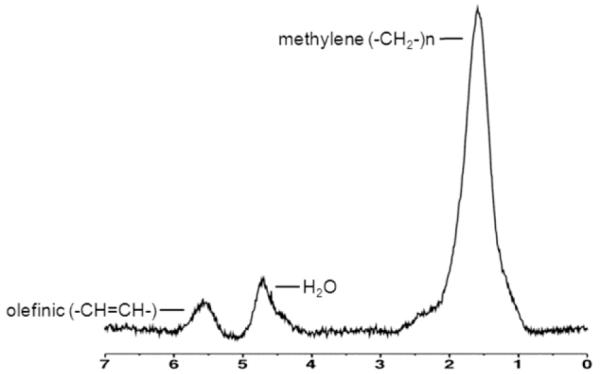
1H-MR spectroscopy of L2 obtained at 3.0T with water suppression in a 58 year-old woman with obesity and type 2 diabetes mellitus demonstrating combined olefinic protons at 5.2 and 5.3 ppm (-CH=CH-, an estimate of fatty acid unsaturated bonds) and methylene protons at 1.3 ppm [(-CH2-)n, an estimate of fatty acids saturated bonds]. Residual water (H2O) is noted at 4.7 ppm.
2.3. Bone mineral density assessment
2.3.1. Dual-energy x-ray absorptiometry (DXA)
Areal bone mineral density (aBMD, g/cm2) of the lumbar spine (L1-L4), total hip and femoral neck was assessed by DXA (QDR Discovery, Hologic, Inc, Bedford, MA). If necessary, manual retraction of pannus overlying the proximal femur was performed during hip measurements.
2.3.2 Quantitative Computed Tomography (QCT)
As DXA is less precise in obesity compared to QCT [26] volumetric bone mineral density (vBMD, g/cm3) of the lumbar spine (L1-L2) and proximal femur was assessed using a 16-multidetector-row CT scanner (LightSpeed Pro, GE Healthcare, Waukesha, WI, USA). Subjects were placed supine on the CT scanner on a calibration phantom (Mindways Software, Inc., Austin, TX, USA), and helical scanning of L1-L2 and from the proximal articular surface of the femoral head to 1 cm below the lesser trochanter, was performed using the following parameters: 120kV, 100mA (L1-2), 120 KV, 200 mA (proximal femur), slice thickness of 2.5 mm and table height of 144 mm.
Analysis of vBMD of L1-L2, total hip, and femoral neck was performed with QCTPro software (Mindways Software, Inc., Austin, TX) as previously described [27].
2.4. Abdominal fat assessment
Visceral adipose tissue (VAT) and abdominal subcutaneous adipose tissue (SAT) compartments were quantified using a single-slice at the level of L1-L2 using the CT performed for BMD assessment. This level has been found to correlate strongly with adipose tissue volumes [28]. Fat attenuation coefficients were set at −50 to −250 Hounsfield unit as described by Borkan et al. [29] and VAT and SAT cross sectional areas (CSA) (cm2) were assessed based on offline analysis of tracings obtained utilizing commercial software (Alice version 4.3.9; Parexel, Waltham, MA).
2.5. Statistical Analysis
Statistical analyses were performed using SAS 9.3 (SAS Institute, Cary, NC). Differences between subjects with and without T2DM were assessed by the Wilcoxon signed-rank test or the Fisher’s exact test. Correlation analyses between MAT and clinical characteristics, body composition, and BMD were performed and nonparametric Spearman rank correlation coefficients are reported. P < 0.05 was used to denote significance. Data are presented as mean ± SD.
3. RESULTS
3.1. Clinical characteristics
Clinical and body composition characteristics are summarized in Table 1. The study group included 21 subjects (mean age 49 ± 11 years, range 25 to 66 years), 18 women, 3 men, with morbid obesity (mean BMI 43.9 ± 5.4 kg/m2). Eight subjects had T2DM. Diabetes medication included metformin (n=7), insulin (n=3), sulfonylurea (n=1), and GLP-1 agonist (n=1). No subjects reported use of thiazolidinedioines. Subjects with and without T2DM were well-matched for age and gender, and had similar levels of serum calcium, 25-hydroxyvitamin D, and parathyroid hormone. There were a higher number of African American subjects in the T2DM group. As expected, subjects with T2DM had higher HbA1c, insulin, homeostasis model assessment of insulin resistance (HOMA-IR), serum total cholesterol, and serum LDL levels compared to subjects with morbid obesity without T2DM. Although subjects with T2DM tended to weigh less than non T2DM controls, which may reflect referral bias for bariatric surgery, this difference was not statistically significant. Furthermore, VAT and SAT CSA were similar between the groups.
Table 1. Clinical characteristics and body composition of study subjects.
Data are presented as mean ± SD for continuous variables and n for categorical variables
| Non-T2DM (n=13) | T2DM (n=8) | p | |
|---|---|---|---|
| Age (years) | 48.2 ± 10.9 | 50.3 ± 12.0 | 0.9 |
| Premenopausal women/Postmenopausal women/Men (n) |
8/3/2 | 3/4/1 | 0.6 |
| Fracture History (n) | 3 | 3 | 0.6 |
| Weight (kg) | 121 ± 18 | 109 ± 10 | 0.1 |
| BMI (kg/m2) | 45.4 ± 5.7 | 41.5 ± 4.0 | 0.1 |
| Visceral Adipose Tissue (cm2) | 220 ± 33 | 185 ± 101 | 0.5 |
| Subcutaneous Adipose Tissue (cm2) | 483 ± 119 | 481 ± 114 | 0.9 |
| Race/Ethnicity | 0.01 | ||
| White non-hispanic | 11 | 3 | |
| White hispanic | 2 | - | |
| African American non-hispanic | - | 4 | |
| African American hispanic | - | 1 | |
| Serum fasting glucose (mg/dl) | 93 ± 8 | 101 ± 23 | 0.3 |
| Serum calcium (mg/dl) | 9.6 ± 0.5 | 9.5 ± 0.5 | 1.0 |
| Serum 25-hydoxyvitamin D (ng/ml) | 25 ± 5 | 33 ± 14 | 0.1 |
| Serum PTH (pg/ml) | 49 ± 17 | 69 ± 35 | 0.2 |
| HbA1c (%) | 5.3 ± 0.3 | 6.3 ± 0.4 | <0.0001 |
| Insulin (μIU/ml) | 13.4 ± 9.8 | 25.3 ± 15.9 | 0.02 |
| HOMA IR | 3.2 ± 2.7 | 6.0 ± 3.6 | 0.02 |
| Triglycerides (mg/dl) | 132 ± 76 | 97 ± 46 | 0.3 |
| Total Cholesterol (mg/dl) | 194 ± 25 | 160 ± 28 | 0.02 |
| LDL (mg/dl) | 117 ± 23 | 90 ± 24 | 0.02 |
| HDL (mg/dl) | 51 ± 8 | 51 ± 14 | 1.0 |
T2DM: type 2 diabetes mellitus; PTH: parathyroid hormone, HbA1c: hemoglobin A1c, HOMA IR: homeostasis model assessment of insulin resistance, LDL: low-density lipoprotein, HDH: high-density lipoprotein. P-values < 0.05 are bolded.
3.2. Bone mineral density (BMD)
There were no differences in aBMD at any site by DXA between obese adults with and without T2DM. Subjects with T2DM had higher vBMD by QCT at the femoral neck compared to non-T2DM controls, while there were no differences in lumbar spine and total hip vBMD (Table 2).
Table 2. Bone mineral density and marrow adipose tissue of study subjects.
Data are presented as mean ± SD
| Non-T2DM | T2DM | p | |
|---|---|---|---|
| DXA (g/cm2) | |||
| Spine aBMD | 1.1 ± 0.1 | 1.2 ± 0.2 | 0.3 |
| Total Hip aBMD | 1.1 ± 0.1 | 1.1 ± 0.2 | 0.8 |
| Femoral Neck aBMD | 0.9 ± 0.1 | 1.0 ± 0.2 | 0.6 |
| QCT (mg/cm3) | |||
| Spine vBMD | 166 ± 33 | 172 ± 37 | 0.7 |
| Total Hip vBMD | 360 ± 43 | 374 ± 45 | 0.4 |
| Femoral Neck vBMD | 357 ± 52 | 404 ± 55 | 0.02 |
| Marrow Adipose Tissue (lipids/water) | |||
| L1-L2 | 0.64 ± 0.3 | 0.93 ± 0.3 | 0.03 |
| Femoral Metaphysis | 2.4 ± 0.9 | 4.0 ± 2.6 | 0.04 |
| Femoral Diaphysis | 3.2 ± 1.9 | 2.7 ± 0.9 | 1.0 |
| Marrow Adipose Tissue (unsaturation index) |
|||
| L1-L2 | 0.08 ± 0.03 | 0.1 ± 0.02 | 0.9 |
| Femoral Metaphysis | 0.06 ± 0.01 | 0.06 ± 0.02 | 0.9 |
| Femoral Diaphysis | 0.07 ± 0.01 | 0.06 ± 0.001 | 0.03 |
DXA: dual-energy x-ray absorptiometry; QCT: quantitative computed tomography; aBMD: areal bone mineral density; vBMD: volumetric bone mineral density
3.3. Marrow adipose tissue (MAT)
Subjects with T2DM had higher total MAT at the lumbar spine and the femoral metaphysis compared to non-T2DM controls. There were no differences in lipid UI of the lumbar spine and femoral metaphysis, whereas the UI of the femoral diaphysis was significantly lower in subjects with T2DM (Table 2).
3.4. Associations between clinical characteristics, body composition, bone mineral density and marrow adipose tissue
Within the entire cohort there was a positive correlation between HbA1C and MAT of the lumbar spine (r=0.61, p=0.004) (Figure 3) and femoral metaphysis (r=0.47, p=0.03). HOMA-IR was not significantly associated with MAT or MAT UI. Increasing age was associated with higher lumbar MAT (r=0.55, p=0.01) and lower lumbar unsaturation index (r= −0.52, p= 0.045). Diaphyseal MAT was inversely associated with SAT (r= −0.48, p=0.049) while there were no associations between VAT and MAT (p≥0.2). Lumbar vBMD was inversely associated with lumbar MAT (r= −0.46, p=0.04). There were no associations between hip vBMD or aBMD and femoral MAT (p≥0.3).
Figure 3.

Correlation analysis between glycemic control and marrow adiposity. There was a positive correlation between HbA1c and lumbar marrow adipose tissue.
4. DISCUSSION
Our pilot study shows that subjects with morbid obesity and T2DM have higher MAT with a lower proportion of unsaturated lipids compared to non-diabetic obese controls, despite higher vBMD. In addition, MAT is positively associated with HbA1c. Lumbar MAT is positively associated and unsaturation index is negatively associated with age. Lumbar vBMD is inversely associated with lumbar MAT content whereas no such associations are present in the hip.
Multiple studies have demonstrated the clinical paradox that patients with T2DM have impaired skeletal integrity and increased fracture risk, despite normal or increased BMD [2-6]. Meta-analyses have indicated that especially hip fracture risk is increased in T2DM [3, 30] and fractures occur at a higher femoral neck BMD T-score than in non-diabetics [31]. We therefore focused our study of bone density and marrow fat comparisons at both the lumbar spine and femur. In our study subjects with T2DM had higher vBMD at the femoral neck and higher metaphyseal and lumbar MAT compared to non-T2DM controls, while there was no significant difference in lumbar spine areal or volumetric BMD. Our findings are consistent with animal models of T1DM and T2DM which also demonstrate increased MAT quantity [32-34].
It is possible that our observation of increased MAT content at the lumbar spine and hip among subjects with T2DM may contribute to the skeletal fragility of this population. Indeed, recent studies have highlighted the role of MAT in skeletal health and metabolism [35, 36]. MAT is distinct from white or brown adipose tissue with unique gene expression and the ability to respond to nutritional status [25, 35]. The non-invasive assessment of MAT using 1H-MRS allows assessment of different skeletal sites and has been proposed as an imaging biomarker for fracture risk [18, 37]. Furthermore, several studies in humans have revealed inverse associations between MAT and BMD, as well as elevations of MAT content in subjects with impaired bone microarchitecture and fragility fractures [12, 15, 37]. Consistent with these results, we found an inverse association between lumbar MAT and vBMD.
It is possible that MAT also plays a role in the metabolic phenotype of T2DM. We have previously shown that MAT secretes adiponectin and can function as an endocrine organ [20]. Elevations in MAT content have been found in chronic undernutrition [8, 17] but also in obesity [11, 12]. In our current study, lumbar and femoral MAT were positively associated with HbA1c, suggesting that it might serve as a marker of skeletal integrity and metabolic risk in T2DM. These results are in line with the study by Baum et al that also found positive correlations between lumbar MAT and HbA1c [16]. Abdominal SAT was inversely associated with femoral MAT whereas there were no associations between MAT and VAT. Elevations in VAT are associated with inflammation and decreased BMD and bone microarchitecture [12, 15, 38], while SAT has been found to be protective against bone loss [39, 40].
Moreover, not just the amount of MAT but also its composition might affect skeletal health and metabolism. In particular, the ratio of saturated and unsaturated lipids may differ depending on anatomic site. Only a few studies in humans have assessed the composition of MAT using 1H-MRS and have found that increased saturated and decreased unsaturated lipids are associated with impaired skeletal integrity [16-19]. We found a decrease in UI of the lumbar spine with age, consistent with a study by Yeung et al that showed a higher UI in young women compared to postmenopausal women over 60 years [19]. Two studies have assessed MAT composition of the lumbar spine in subjects with T2DM using 1H-MRS. Both studies showed that postmenopausal women with T2DM had similar lumbar total MAT content but lower UI compared to non-diabetic controls [16, 18] and women with T2DM and fragility fractures had the lowest UI [18]. Our results confirm the findings of lower MAT UI content at the lumbar spine in T2DM but differ in that we also found that total lumbar MAT content was high. Furthermore, we provide new data demonstrating parallel findings in the femur with lower MAT UI and higher MAT content in T2DM compared to non-diabetic controls. Our observed higher total MAT content in subjects with T2DM might reflect differences in age and BMI of our subjects that were younger and more obese than in other reported studies.
Our study has the following limitations. The cross-sectional study design limits our ability to ascertain causality. Another limitation is our small sample size. However, in this pilot study even with a limited number of subjects in each group, we were able to detect a difference in MAT content and composition between T2DM and non-diabetic controls. There was more racial diversity within the T2DM patients, and it is therefore possible that racial/ethnic components contributed to the observed differences in MAT. Strengths of our study include the detailed assessments of MAT content and composition at the lumbar spine, the femoral metaphysis, and diaphysis, as well as the assessment of BMD by DXA and QCT.
In conclusion, our pilot study shows that subjects with morbid obesity and T2DM have higher MAT with a lower proportion of unsaturated lipids as compared with non-diabetic obese controls, despite higher femoral neck vBMD. MAT increases with age, is positively associated with HbA1c, and inversely associated with vBMD, suggesting that MAT may serve as an imaging biomarker of skeletal health and metabolic risk.
Highlights.
Subjects with morbid obesity and T2DM have higher marrow adipose tissue (MAT) than non-diabetic controls of similar weight.
Subjects with morbid obesity and T2DM have a lower proportion of unsaturated lipids within MAT in the femoral diaphysis.
MAT is positively associated with age, and is inversely associated with volumetric BMD.
Acknowledgments
Funding: This work was supported by National Institutes of Health (NIH) Grants K23 DK093713, R03DK107869, and a pilot grant from the Nutrition Obesity Research Center at Harvard (P30 DK040561). The Clinical Research Center was supported by Grant Number 1UL1TR001102.
Footnotes
Publisher's Disclaimer: This is a PDF file of an unedited manuscript that has been accepted for publication. As a service to our customers we are providing this early version of the manuscript. The manuscript will undergo copyediting, typesetting, and review of the resulting proof before it is published in its final citable form. Please note that during the production process errors may be discovered which could affect the content, and all legal disclaimers that apply to the journal pertain.
Disclosures: The authors do not have any conflicts of interests to disclose.
References
- 1.Meigs JB, Wilson PW, Fox CS, et al. Body mass index, metabolic syndrome, and risk of type 2 diabetes or cardiovascular disease. J Clin Endocrinol Metab. 2006;91:2906–2912. doi: 10.1210/jc.2006-0594. [DOI] [PubMed] [Google Scholar]
- 2.Bonds DE, Larson JC, Schwartz AV, et al. Risk of fracture in women with type 2 diabetes: the Women's Health Initiative Observational Study. J Clin Endocrinol Metab. 2006;91:3404–3410. doi: 10.1210/jc.2006-0614. [DOI] [PubMed] [Google Scholar]
- 3.Dytfeld J, Michalak M. Type 2 diabetes and risk of low-energy fractures in postmenopausal women: meta-analysis of observational studies. Aging Clin Exp Res. 2016 doi: 10.1007/s40520-016-0562-1. [DOI] [PMC free article] [PubMed] [Google Scholar]
- 4.Melton LJ, 3rd, Riggs BL, Leibson CL, et al. A bone structural basis for fracture risk in diabetes. J Clin Endocrinol Metab. 2008;93:4804–4809. doi: 10.1210/jc.2008-0639. [DOI] [PMC free article] [PubMed] [Google Scholar]
- 5.Schwartz AV, Vittinghoff E, Bauer DC, et al. Association of BMD and FRAX score with risk of fracture in older adults with type 2 diabetes. JAMA. 2011;305:2184–2192. doi: 10.1001/jama.2011.715. [DOI] [PMC free article] [PubMed] [Google Scholar]
- 6.Vestergaard P. Discrepancies in bone mineral density and fracture risk in patients with type 1 and type 2 diabetes--a meta-analysis. Osteoporos Int. 2007;18:427–444. doi: 10.1007/s00198-006-0253-4. [DOI] [PubMed] [Google Scholar]
- 7.Schellinger D, Lin CS, Hatipoglu HG, Fertikh D. Potential value of vertebral proton MR spectroscopy in determining bone weakness. AJNR Am J Neuroradiol. 2001;22:1620–1627. [PMC free article] [PubMed] [Google Scholar]
- 8.Bredella MA, Fazeli PK, Miller KK, et al. Increased bone marrow fat in anorexia nervosa. J Clin Endocrinol Metab. 2009;94:2129–2136. doi: 10.1210/jc.2008-2532. [DOI] [PMC free article] [PubMed] [Google Scholar]
- 9.Rosen CJ, Ackert-Bicknell C, Rodriguez JP, Pino AM. Marrow fat and the bone microenvironment: developmental, functional, and pathological implications. Crit Rev Eukaryot Gene Expr. 2009;19:109–124. doi: 10.1615/critreveukargeneexpr.v19.i2.20. [DOI] [PMC free article] [PubMed] [Google Scholar]
- 10.Rosen CJ, Bouxsein ML. Mechanisms of disease: is osteoporosis the obesity of bone? Nat Clin Pract Rheumatol. 2006;2:35–43. doi: 10.1038/ncprheum0070. [DOI] [PubMed] [Google Scholar]
- 11.Bredella MA, Gill CM, Gerweck AV, et al. Ectopic and serum lipid levels are positively associated with bone marrow fat in obesity. Radiology. 2013;269:534–541. doi: 10.1148/radiol.13130375. [DOI] [PMC free article] [PubMed] [Google Scholar]
- 12.Bredella MA, Torriani M, Ghomi RH, et al. Vertebral bone marrow fat is positively associated with visceral fat and inversely associated with IGF-1 in obese women. Obesity (Silver Spring) 2011;19:49–53. doi: 10.1038/oby.2010.106. [DOI] [PMC free article] [PubMed] [Google Scholar]
- 13.Cohen A, Shen W, Dempster DW, et al. Marrow adiposity assessed on transiliac crest biopsy samples correlates with noninvasive measurement of marrow adiposity by proton magnetic resonance spectroscopy ((1)H-MRS) at the spine but not the femur. Osteoporos Int. 2015;26:2471–2478. doi: 10.1007/s00198-015-3161-7. [DOI] [PMC free article] [PubMed] [Google Scholar]
- 14.Schellinger D, Lin CS, Lim J, Hatipoglu HG, Pezzullo JC, Singer AJ. Bone marrow fat and bone mineral density on proton MR spectroscopy and dual-energy X-ray absorptiometry: their ratio as a new indicator of bone weakening. AJR Am J Roentgenol. 2004;183:1761–1765. doi: 10.2214/ajr.183.6.01831761. [DOI] [PubMed] [Google Scholar]
- 15.Bredella MA, Lin E, Gerweck AV, et al. Determinants of bone microarchitecture and mechanical properties in obese men. J Clin Endocrinol Metab. 2012;97:4115–4122. doi: 10.1210/jc.2012-2246. [DOI] [PMC free article] [PubMed] [Google Scholar]
- 16.Baum T, Yap SP, Karampinos DC, et al. Does vertebral bone marrow fat content correlate with abdominal adipose tissue, lumbar spine bone mineral density, and blood biomarkers in women with type 2 diabetes mellitus? J Magn Reson Imaging. 2012;35:117–124. doi: 10.1002/jmri.22757. [DOI] [PMC free article] [PubMed] [Google Scholar]
- 17.Bredella MA, Fazeli PK, Daley SM, et al. Marrow fat composition in anorexia nervosa. Bone. 2014;66:199–204. doi: 10.1016/j.bone.2014.06.014. [DOI] [PMC free article] [PubMed] [Google Scholar]
- 18.Patsch JM, Li X, Baum T, et al. Bone marrow fat composition as a novel imaging biomarker in postmenopausal women with prevalent fragility fractures. J Bone Miner Res. 2013;28:1721–1728. doi: 10.1002/jbmr.1950. [DOI] [PMC free article] [PubMed] [Google Scholar]
- 19.Yeung DK, Griffith JF, Antonio GE, Lee FK, Woo J, Leung PC. Osteoporosis is associated with increased marrow fat content and decreased marrow fat unsaturation: a proton MR spectroscopy study. J Magn Reson Imaging. 2005;22:279–285. doi: 10.1002/jmri.20367. [DOI] [PubMed] [Google Scholar]
- 20.Cawthorn WP, Scheller EL, Learman BS, et al. Bone marrow adipose tissue is an endocrine organ that contributes to increased circulating adiponectin during caloric restriction. Cell Metab. 2014;20:368–375. doi: 10.1016/j.cmet.2014.06.003. [DOI] [PMC free article] [PubMed] [Google Scholar]
- 21.Lecka-Czernik B. Marrow fat metabolism is linked to the systemic energy metabolism. Bone. 2012;50:534–539. doi: 10.1016/j.bone.2011.06.032. [DOI] [PMC free article] [PubMed] [Google Scholar]
- 22.Doucette CR, Horowitz MC, Berry R, et al. A High Fat Diet Increases Bone Marrow Adipose Tissue (MAT) But Does Not Alter Trabecular or Cortical Bone Mass in C57BL/6J Mice. J Cell Physiol. 2015;230:2032–2037. doi: 10.1002/jcp.24954. [DOI] [PMC free article] [PubMed] [Google Scholar]
- 23.Hamrick MW, Della-Fera MA, Choi YH, Pennington C, Hartzell D, Baile CA. Leptin treatment induces loss of bone marrow adipocytes and increases bone formation in leptin-deficient ob/ob mice. J Bone Miner Res. 2005;20:994–1001. doi: 10.1359/JBMR.050103. [DOI] [PubMed] [Google Scholar]
- 24.Lecka-Czernik B, Stechschulte LA, Czernik PJ, Dowling AR. High bone mass in adult mice with diet-induced obesity results from a combination of initial increase in bone mass followed by attenuation in bone formation; implications for high bone mass and decreased bone quality in obesity. Mol Cell Endocrinol. 2015;410:35–41. doi: 10.1016/j.mce.2015.01.001. [DOI] [PubMed] [Google Scholar]
- 25.Scheller EL, Doucette CR, Learman BS, et al. Region-specific variation in the properties of skeletal adipocytes reveals regulated and constitutive marrow adipose tissues. Nat Commun. 2015;6:7808. doi: 10.1038/ncomms8808. [DOI] [PMC free article] [PubMed] [Google Scholar]
- 26.Yu EW, Thomas BJ, Brown JK, Finkelstein JS. Simulated increases in body fat and errors in bone mineral density measurements by DXA and QCT. J Bone Miner Res. 2012;27:119–124. doi: 10.1002/jbmr.506. [DOI] [PMC free article] [PubMed] [Google Scholar]
- 27.Yu EW, Bouxsein ML, Roy AE, et al. Bone loss after bariatric surgery: discordant results between DXA and QCT bone density. J Bone Miner Res. 2014;29:542–550. doi: 10.1002/jbmr.2063. [DOI] [PMC free article] [PubMed] [Google Scholar]
- 28.Irlbeck T, Massaro JM, Bamberg F, O'Donnell CJ, Hoffmann U, Fox CS. Association between single-slice measurements of visceral and abdominal subcutaneous adipose tissue with volumetric measurements: the Framingham Heart Study. Int J Obes (Lond) 2010;34:781–787. doi: 10.1038/ijo.2009.279. [DOI] [PMC free article] [PubMed] [Google Scholar]
- 29.Borkan GA, Gerzof SG, Robbins AH, Hults DE, Silbert CK, Silbert JE. Assessment of abdominal fat content by computed tomography. Am J Clin Nutr. 1982;36:172–177. doi: 10.1093/ajcn/36.1.172. [DOI] [PubMed] [Google Scholar]
- 30.Janghorbani M, Van Dam RM, Willett WC, Hu FB. Systematic review of type 1 and type 2 diabetes mellitus and risk of fracture. Am J Epidemiol. 2007;166:495–505. doi: 10.1093/aje/kwm106. [DOI] [PubMed] [Google Scholar]
- 31.Giangregorio LM, Leslie WD, Lix LM, et al. FRAX underestimates fracture risk in patients with diabetes. J Bone Miner Res. 2012;27:301–308. doi: 10.1002/jbmr.556. [DOI] [PubMed] [Google Scholar]
- 32.Botolin S, McCabe LR. Bone loss and increased bone adiposity in spontaneous and pharmacologically induced diabetic mice. Endocrinology. 2007;148:198–205. doi: 10.1210/en.2006-1006. [DOI] [PubMed] [Google Scholar]
- 33.Devlin MJ, Van Vliet M, Motyl K, et al. Early-onset type 2 diabetes impairs skeletal acquisition in the male TALLYHO/JngJ mouse. Endocrinology. 2014;155:3806–3816. doi: 10.1210/en.2014-1041. [DOI] [PMC free article] [PubMed] [Google Scholar]
- 34.Huang S, Kaw M, Harris MT, et al. Decreased osteoclastogenesis and high bone mass in mice with impaired insulin clearance due to liver-specific inactivation to CEACAM1. Bone. 2010;46:1138–1145. doi: 10.1016/j.bone.2009.12.020. [DOI] [PMC free article] [PubMed] [Google Scholar]
- 35.Liu LF, Shen WJ, Ueno M, Patel S, Kraemer FB. Characterization of age-related gene expression profiling in bone marrow and epididymal adipocytes. BMC Genomics. 2011;12:212. doi: 10.1186/1471-2164-12-212. [DOI] [PMC free article] [PubMed] [Google Scholar]
- 36.Scheller EL, Rosen CJ. What's the matter with MAT? Marrow adipose tissue, metabolism, and skeletal health. Ann N Y Acad Sci. 2014;1311:14–30. doi: 10.1111/nyas.12327. [DOI] [PMC free article] [PubMed] [Google Scholar]
- 37.Schwartz AV, Sigurdsson S, Hue TF, et al. Vertebral bone marrow fat associated with lower trabecular BMD and prevalent vertebral fracture in older adults. J Clin Endocrinol Metab. 2013;98:2294–2300. doi: 10.1210/jc.2012-3949. [DOI] [PMC free article] [PubMed] [Google Scholar]
- 38.Bredella MA, Torriani M, Ghomi RH, et al. Determinants of bone mineral density in obese premenopausal women. Bone. 2011;48:748–754. doi: 10.1016/j.bone.2010.12.011. [DOI] [PMC free article] [PubMed] [Google Scholar]
- 39.Gilsanz V, Chalfant J, Mo AO, Lee DC, Dorey FJ, Mittelman SD. Reciprocal relations of subcutaneous and visceral fat to bone structure and strength. J Clin Endocrinol Metab. 2009;94:3387–3393. doi: 10.1210/jc.2008-2422. [DOI] [PMC free article] [PubMed] [Google Scholar]
- 40.Russell M, Mendes N, Miller KK, et al. Visceral fat is a negative predictor of bone density measures in obese adolescent girls. J Clin Endocrinol Metab. 2010;95:1247–1255. doi: 10.1210/jc.2009-1475. [DOI] [PMC free article] [PubMed] [Google Scholar]