Abstract
Background and Objective
Sarcomas are rare but highly aggressive tumors, and local recurrence after surgical excision can occur up to 50% cases. Therefore, there is a strong clinical need for accurate tissue differentiation and margin assessment to reduce incomplete resection and local recurrence. The purpose of this study was to investigate the use of optical coherence tomography (OCT) and a novel image texture-based processing algorithm to differentiate sarcoma from muscle and adipose tissue.
Study Design and Methods
In this study, tumor margin delineation in 19 feline and canine veterinary patients was achieved with intraoperative OCT to help validate tumor resection. While differentiation of lower-scattering adipose tissue from higher-scattering muscle and tumor tissue was relatively straightforward, it was more challenging to distinguish between dense highly scattering muscle and tumor tissue types based on scattering intensity and microstructural features alone. To improve tissue-type differentiation in a more objective and automated manner, three descriptive statistical metrics, namely the coefficient of variation, standard deviation, and range, were implemented in a custom algorithm applied to the OCT images.
Results
Over 22,800 OCT images were collected intraoperatively from over 38 sites on 19 ex vivo tissue specimens removed during sarcoma surgeries. Following the generation of an initial set of OCT images correlated with standard hematoxylin and eosin-stained histopathology, over 760 images were subsequently used for automated analysis. Using texture-based image processing metrics, OCT images of sarcoma, muscle, and adipose tissue were all found to be statistically different from one another (p ≤ 0.001).
Conclusion
These results demonstrate the potential of using intraoperative OCT, along with an automated tissue differentiation algorithm, as a guidance tool for soft tissue sarcoma margin delineation in the operating room.
Keywords: Cancer, Computer-Aided Detection, Image Processing, Imaging, OCT, Surgery, Surgical Margins
Introduction
Soft tissue sarcomas (STS) are aggressive, locally invasive, malignant tumors that require wide excision as the mainstay of treatment. In 2015, there were 11,930 estimated cases of soft tissue sarcomas in adult humans and 4,870 deaths [1]. The reported international incidence ranged from 1.8 to 5 per 100,000 per year [2]. In a study by Shiu et al. [3], out of 297 patients recruited for the study, 46% were returning with locally recurrent disease, while the remaining presented for initial therapy. Even higher recurrence rates (53.1%) have been previously reported [4]. Current evaluation of STS relies on clinical history, evaluation, lesion location, determination of mineralization on radiographs, and signal intensity characterization on magnetic resonance images [5]. Additional available imaging modalities that have been used to evaluate STS include ultrasonography, computed tomography (CT), and positron emission tomography (PET) [6]. However, presently, the use of only a single imaging technique offers a somewhat limited evaluation since it cannot reliably distinguish between benign and malignant soft-tissue lesions in some cases, which leads to false positives and the likelihood of unnecessary surgical procedures. Biopsies of lesions are commonly performed following imaging to differentiate between benign soft tissue lesions and soft tissue sarcoma. There is often over-estimation of lesion size, leading to imprecise surgical planning and resection of increased amounts of tissue. Therefore, STS identification and pre-operative surgical planning usually involves a combination of the aforementioned imaging techniques.
Magnetic resonance imaging (MRI) has been used for guiding the surgical resection of STS intraoperatively, and the extent of the tumor on MRI was found to be greater than suggested by clinical examination [7]. This technique, however, is expensive, and constrains the procedure to the location of the equipment. The current gold standard for surgical margin assessment of STS is post-operative histopathology, or in some surgeries, intraoperative frozen-section histopathology obtained during the time of the operation. However, the latter technique is often limited to only 1 or 2 margin assessments of small areas due to time constraints; thus, reducing the confidence of clean margins and complete tumor removal.
An imaging modality that has the potential to be used for tissue differentiation during and immediately after tumor resection is optical coherence tomography (OCT). This label-free imaging modality can be used in situ to visualize large surface areas of tissue microstructure within seconds [8-12]. In a study by Wang et al., liposarcomas (sarcoma occurring in adipose tissue) and adipose tissue were compared, as well as skeletal muscle with leiomyosarcoma (a sarcoma occurring in smooth muscle), via individual A-line computational analysis from OCT images. All tissue samples were taken from surgical resections and a total of six specimens from six patients were imaged within 12 h [10]. In their analysis, the A-line slope was linearly fitted and removed, and the standard deviation of the intensity signal was then calculated, followed by a fast Fourier transform to provide amplitude information of the spatial frequency spectrum, which in turn was used for a Beer-Lambert law exponential fit. Different measurements were acquired from regions of adipose, liposarcoma, skeletal muscle, and leiomyosarcoma tissue. Results indicated a higher optical attenuation coefficient for liposarcoma compared to adipose tissue, and noted smaller attenuation differences between skeletal muscle and leiomyosarcoma tissue [10]. In our current study, analysis of entire B-scans is performed, with additional information provided by texture-based features that appear from adjacent and local A-line data. While the previous study investigated A-line data below the air-tissue interface, the segmented B-scans in this current study include the tissue surface, which is particularly important for assessing the surgical margin, one of the main goals of this current study.
Intrinsic texture properties of speckle in OCT images of normal and tumor tissues have also been studied [11]. In this study, OCT pixel intensity distribution within a region of interest (without log-compression) were represented as a histogram. Then, for optimal histogram comparison of many images, a fixed binning of the distribution was applied based on the Shimazaki method. The histograms were then fitted using the least square method, and in an analogous manner to high frequency ultrasound, a ratio of parameters was determined, proportional to the effective tissue scatterer number density, and related to cellular changes that affect the scattering properties of the tissue in question [11]. With their method, they were able to differentiate between normal and tumor tissues in vivo in a mouse xenograft model.
In a recent study from our group, intraoperative OCT was used for the in vivo assessment of human breast tumor margins, and compared to post-operative histopathology as the gold-standard. OCT was found to have a 92% sensitivity and a 92% specificity for identifying positive and negative margins [12]. These early successful intraoperative studies in breast cancer have motivated the investigation of using intraoperative OCT for other solid tumor surgeries, especially those such as STS, which suffer from high re-operation rates and high local recurrence rates.
Prior to applications in humans, we conducted this study involving STS in feline and canine veterinary medicine patients, with the goal of gaining insight into the OCT image properties of soft tumor sarcomas and their margin delineation in normal soft tissues, primarily muscle. The incidence of STS in feline and canine patients (17 and 35 per 100,000, respectively [13], is approximately 10 times greater than in humans, and the use of OCT would not only benefit these veterinary patients (health and preventive approach) and their owners (budget savings), but also allow for a straightforward translation to intraoperative human studies.
In animals, injection-site-associated sarcomas develop as several histological sub-types including fibrosarcoma, rhabdomyosarcoma, extra-skeletal osteosarcoma, chondrosarcoma, and histocytic sarcoma, and they all are known to characteristically spread invasively into surrounding tissue [14]. Cats biologically respond to inflammation by fibroblast proliferation and have a higher rate of tumorigenesis compared to dogs [14]. Feline injection site sarcomas are locally invasive tumors, and their complete removal has been associated with longer tumor-free interval and survival time compared to those with positive or incomplete margins [15]. However, despite determination of negative surgical margins using current post-operative histopathology assessment methods, a recurrence of 14%-36% has been observed [12,13]. Current post-operative margin assessment methods usually under-sample the total margin due to time constraints and feasibility. This spatial under-sampling of the surgical margins likely accounts for the high recurrence rate.
OCT image textures of various tissue types are often challenging to characterize because tissues are frequently heterogeneous. This heterogeneity can be attributed to cell and tissue microstructure, structural orientation, cellular density, and tissue hydration level, among others. The various textures of tissue microstructure that appear in OCT images can, however, contain important cues for tissue type detection and diagnosis that are not always discernible visually by the human eye. Other statistical metrics and algorithms have also been investigated to quantify differences in tissue types [16,17]. For example, statistical parameters and filters such as mean, standard deviation, and range of local scattering variations have been applied in OCT volumes to segment dense collagen, loose collagen, and normal myocardium in human atrial tissue [17], and classification results are often then color coded. Texture feature extraction has also been demonstrated using a gray level co-occurrence matrix in which the classification is achieved by extracting the spatial relationship of pixels in the matrix [18], then statistical features such as contrast, correlation, energy, and homogeneity can be calculated [19].
In this study, intraoperative OCT images of tissue types present in areas near or within soft tissue sarcomas were obtained from ex vivo specimens collected during STS surgeries, and these were used to develop an image processing-based statistical algorithm to compare sarcoma, muscle, and adipose tissue types, with the future goal of delineating tumor margins in vivo in the operating room. To test whether or not OCT is a viable tool for tissue differentiation between soft-tissue sarcomas and tissues that surround a sarcoma in vivo (i.e adipose and muscle tissue), a two-step process comprised of a learning phase and a comparison phase was employed. In the learning phase, a data set which comprised of images with known tissue type labels was generated, accomplished by co-registering OCT images with corresponding histology. In the second phase, each tissue type was compared using the means of three statistical parameters: coefficient of variation (CV), standard deviation (STD), and Range, over the intensity values in the given OCT images. This comparison showed statistically significant differences between the tissue types in the OCT images.
Materials and Methods
Tissue acquisition and OCT imaging
Animal tissues were acquired under protocols approved by the Institutional Animal Care and Use Committee at the University of Illinois at Urbana-Champaign. For this study, ex vivo tissue specimens were collected intraoperatively from 17 dogs and 2 cats (client-owned) which were undergoing resection of a STS or FISS. Histologically, since no microstructural differences between feline and canine soft tissues (adipose, muscle, and soft tissue sarcoma) were observed, for the purpose of this study, the feline and canine tumors were considered together. The tissues were imaged with OCT to generate the sets of OCT images with corresponding histological images encompassing three primary tissues types: tumor (STS), muscle, and adipose. The tissues and tumors were excised by an American College of Veterinary Surgeon (L.E.S.) board-certified in small animal surgery.
A commercial spectral-domain OCT imaging system (Envisu C2300, Bioptigen) was used to generate three dimensional volumetric scans of the areas of interest in the tissues. With a central wavelength of 1310 nm and an incident illumination power of ~ 5 mW, the system was able to image with ~ 8 μm axial resolution, ~ 10 μm lateral resolution, and to an imaging depth of ~ 1-2 mm, depending on the optical properties of the tissue. OCT imaging was performed in the operating room and/or adjacent imaging room, immediately after tissue resection. Each B-scan had physical dimensions of 5 mm (lateral) × 2 mm (depth), represented by 600 × 257 pixels, respectively. The tissue was placed in a Petri dish and positioned on a mounted micrometer positioning stage. The sample arm beam was positioned over an area of interest. Typically, 2-4 areas per resected specimen were imaged, depending on the available tissue types per specimen. The imaging goal was to acquire images from at least one area where a sarcoma was suspected to be present (determined by visual and manual palpation), and other areas which contained other tissue types. In the sample arm of the OCT system, lateral beam scanning was performed with galvanometers, passing the OCT beam through a fixed focus objective lens to volumetrically scan the selected tissue (5 × 5 × 2 mm3) at 7.4 frames/sec (6 kHz A-scan rate) via raster collection of B-scans along the x-y plane. The imaged area corresponded to 600 sequentially-acquired and adjacent OCT images, and required approximately 1 minute to capture the image data at each site.
Following OCT imaging, the selected areas were marked with surgical ink applied in a U-shape on the specimen surface to delineate the imaged area, which was then used for histology/OCT co-registration. Surgical ink was applied with a toothpick and allowed to dry for 5 minutes. The specimens were then placed in 10% neutral buffered formalin. In addition to standard histopathological processing and margin assessment, the inked areas were histologically sectioned and stained for correlation with OCT images.
An American College of Veterinary Pathology (ACVP) board-certified pathologist (J.S.) acquired multiple histological tissue sections from the same location and plane as the OCT B-scans. Each ~3 μm-thick tissue section was stained with hematoxylin and eosin (H&E) and digitized with a digital slide scanner (NanoZoomer 2.0 RS, Hamamatsu C10730). The pathologist performing the standard tumor histopathology and assessment of the inked regions was blinded to the results of the OCT imaging. Tissue sections were classified as sarcoma, adipose, or muscle tissue based on the predominant cell/tissue type present within the section. When multiple tissue types were present, boundaries were noticeably distinct with little intermixing of cell types in any region.
Image processing and statistical analysis
Light scattering from tissue is dictated by the morphological and biochemical features of the tissue, and variations in optical scattering are represented in the OCT images. The most commonly observed tissue types within the resected specimens were STS, muscle, and adipose. A series of 600 consecutive OCT images were acquired in each 5 × 5 mm2 area imaged. Then, 10 non-consecutive frames (separated by at least 500 μm) were further selected to be used as input for the statistical analysis. The selected frames were chosen based on image quality, avoiding image artifacts such as strong reflections that resulted from sensor saturation. The requirement to select 10 images with at least 500 μm separation was applied to each imaged area. The choice of sampling at least every 500 μm was based on the empirical observation that the different OCT images would appear structurally different, implying a different area of the tissue. Images were primarily excluded from further analysis if the tissue surface or fluid collection at the surface was flat, with the beam normally incident on the flat surface. This resulted in strong back-reflections, saturation, and poor image quality. Images were also excluded if the tissue/surface was too far away from the beam focus near the center of the image, which would result in poor image quality often with low SNR. There were 2 specimen sites where only 7 or 8 high-quality images were selected, but all images were at least 500 μm apart. An algorithm was then generated to process the selected OCT images (Fig. 1). Within the OCT images, variations in signal intensity suggest underlying scattering structures and features, and time-dependent signal intensity fluctuations were largely driven by Brownian motion or tissue settling.
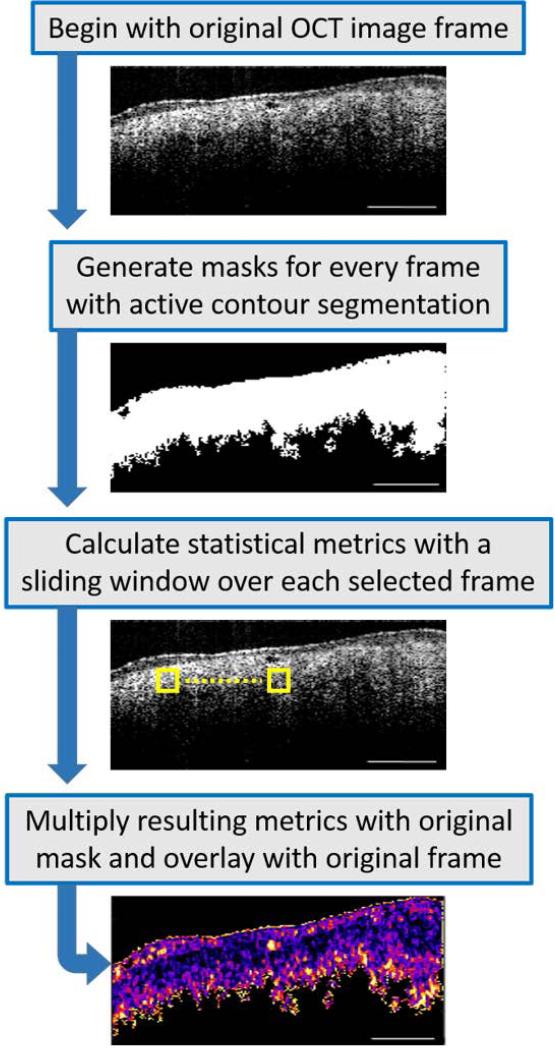
Fig. 1.
Image processing flowchart. Out of 600 images acquired from each imaged site, 10 were selected, ensuring that there was an adequate separation between the chosen images. Segmentation masks were then generated by choosing areas of interest, avoiding areas of saturation and background noise. An active contour was then applied to every mask. A sliding window (yellow box) was applied over every image to determine the statistical metrics of Coefficient of Variation, Standard Deviation, and Range. The results were then multiplied with each mask and overlaid with the original frame. Statistical comparisons between tissue types were made between these resulting B-scan images.
First, the foreground (tissue) was segmented from the background via manual segmentation. A binary image, identified in this paper as a polygonal mask, was interactively generated by selecting <10 user defined initial contour positions that were around the periphery of the tissue region. Once the points were selected, 300 iterations of contour evolution with the Chan-Vese method [19] would then define the segmented region, against a uniformly black background. Then, within the segmented tissue regions, three statistical parameters were calculated: CV, STD, and Range. Coefficient of Variation is a measure of the spread of the data (pixel intensity) that describes variability relative to the mean (STD divided by the mean), and was chosen because it can compare the spread of image regions that have different means. For example, sarcoma is known to have a dense, relatively homogeneous, yet randomly organized structure. Therefore, STS CV values were expected to be lower than muscle CV values since muscle is more linearly structured and does not appear as homogeneous as sarcoma tissue. The STD measures the degree of pixel intensity variability, and was chosen as a variable to visualize the distribution or spread of the intensity data about the mean value. The Range parameter corresponds to the minimum-to-maximum range of the data in the window, and is another estimate of distribution of intensity values in each B-scan. This minimum-to-maximum range is a sub-range of the full dynamic range of the data throughout the entire image, and is an indicator of the full distribution of local intensity values. Outlying intensity values (OCT images suffer from outliers if the pre-processing tissue/background segmentation was not performed) usually have an undue influence on this statistic, which makes the range a less reliable estimator. Therefore, it was expected that this metric would probably be the least robust of the three.
A sliding window of 11 × 11 pixels, which corresponds to 91.3 μm × 85.8 μm, was used to calculate the aforementioned metrics over each OCT image, and was found suitable for differentiating tissue types in this study. This window size was selected based on trade-offs. The larger the window, the longer the processing time. Also, a larger window would average out fine variations within the image data, while too small of a window would tend to increase contributions from sub-structural fluctuations in the data. Adipocytes, myofibers, fibroblasts, and neoplastic cells vary in their size, as do any bundles or larger structural groups they may form. From the literature, and as seen histologically in our tissue sections, an adipocyte is approximately 10 μm in diameter, myocytes range from 10-100 μm in diameter, and a soft-tissue sarcoma tumor cell has a diameter of ~10 μm [20]. A typical dimension of a skeletal muscle fiber is 100 μm, while a myofibril is ~200 μm [21]. The dimensions of our sliding window fall roughly in the middle of the dimensional scale range we wish to interrogate, roughly between the size of individual cells, and the size of the larger ordered structures such as the fibers. Using this window size, the statistical metrics (means of CV, STD, and Range) were determined in less than 1 minute using a standard multi-core desktop PC. A robust non-parametric statistical test for independent samples (Wilcoxon test) was then used to test whether or not the different tissue types were statistically different. The Wilcoxon test was chosen because it does not assume that the data follows a specific distribution.
Results
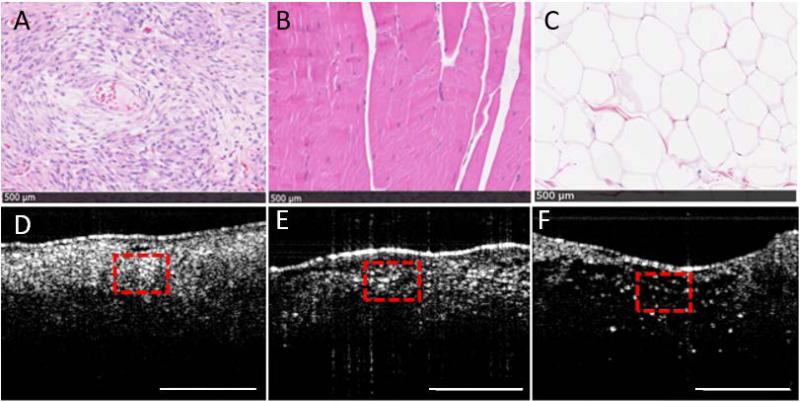
The three primary tissue types present in the tissue samples were sarcoma, muscle, and adipose tissue, which are shown both microscopically on histology and indicated in corresponding OCT images (Fig. 2). Adipose tissue was expectedly found to have a characteristic honeycomb structure which exhibited relatively lower scattering, and had a distinctive hole-filled appearance and texture pattern on OCT. The refractive index of adipose tissue has been previously reported to be 1.333 ± 0.024 (mean ± standard deviation), which is different from that of muscle, which was found to be 1.399 ± 0.013 [23].
Fig. 2.
Physical (histology) and textural (OCT) properties of (A) sarcoma, (B) muscle, and (C) adipose tissue with corresponding OCT images (D-F, respectively). The top row shows H&E-stained digitized histological images of the resected tissue, and the corresponding OCT images are shown in the bottom row. The dashed red boxes in the OCT images correspond to the dimensions of the histology images. The black scale bars across the bottom of each image in (A-C) represent 500 μm, and the scale bars in (D-F) represent 1 mm.
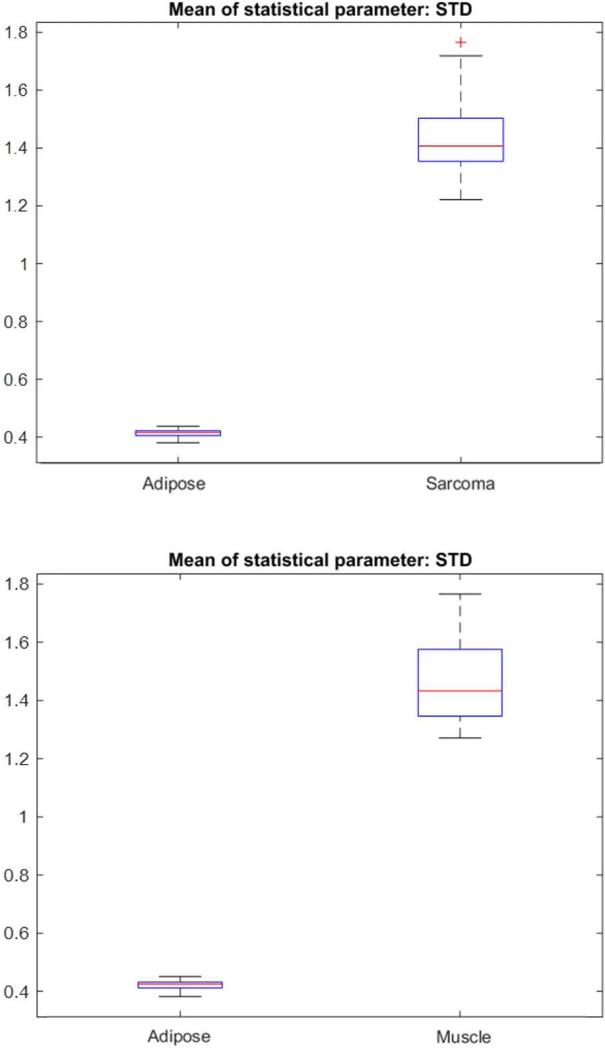
Even though adipose tissue can be readily identified and discriminated against sarcoma and muscle, both visually and with OCT, it was still analyzed with these metrics against muscle and then against sarcoma. Figure 3 shows a representative set of box plots for comparing the STD between adipose and sarcoma, and between adipose and muscle. Using the Wilcoxon test, adipose tissue was determined to be statistically different (p ≤ 0.0000001) from both muscle and sarcoma.
Fig. 3.
Box plots of the means of Standard Deviation comparing (top) all the adipose and sarcoma B-scans, and (bottom) all the adipose and muscle B-scans.
In contrast to adipose tissue, muscle and sarcoma tissue are both dense and highly scattering; thus, more challenging to differentiate with OCT. A photograph of a representative tissue specimen resected during surgery is shown in Fig. 4, along with the representative corresponding OCT images and histology. This specimen contains marked regions of the three tissue types encountered in this study: sarcoma, muscle, and adipose tissue. Sarcoma tissue is highly cellular (there is a larger quantity of smaller cells present in a given area (Fig. 4.A) and sarcoma is structurally disorganized due to the irregular growth patterns that are typical of most cancers. In contrast, muscle tissue has a more distinct and defined cellular content (with fewer but larger cells) with aligned structural organization (Fig. 4.B).
Fig. 4.
OCT and corresponding histopathology from an excised specimen from the dorsal thorax of a domestic long hair cat. Specimen dimensions were 9.5 cm × 6.5 cm × 5 cm. Three OCT images and corresponding histology are shown for the three inked areas on the specimen. (A) Sarcoma, (B) Muscle, (C) Muscle (m) and Adipose (a). The scale bars for the OCT images represent 1 mm and the scale bars for the histology represent 10 mm.
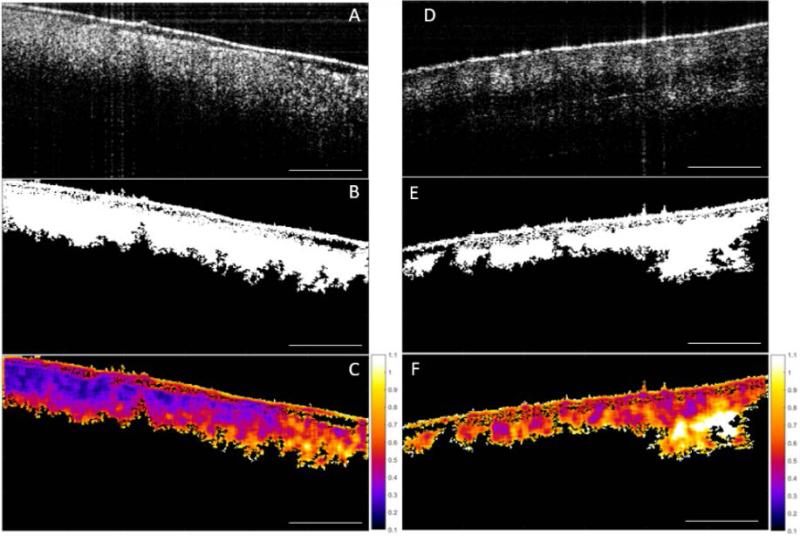
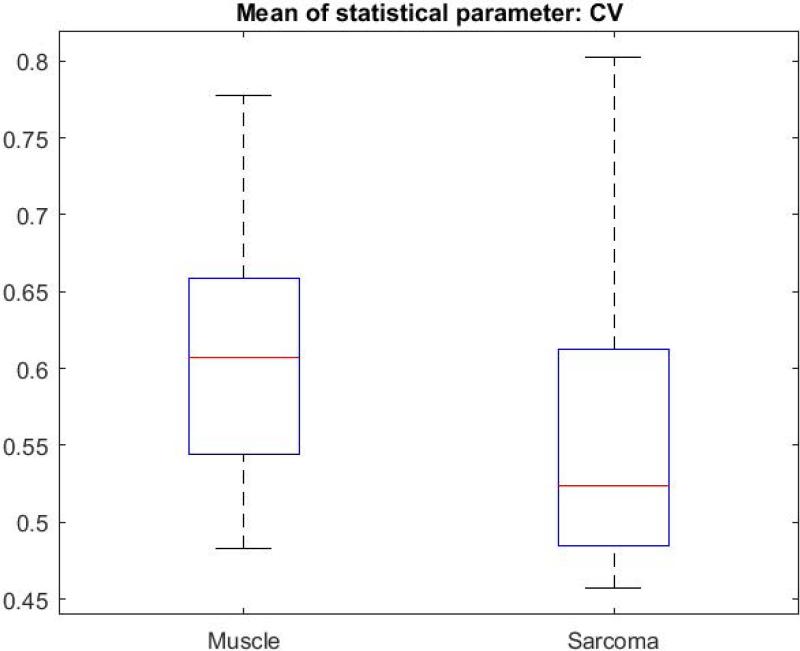
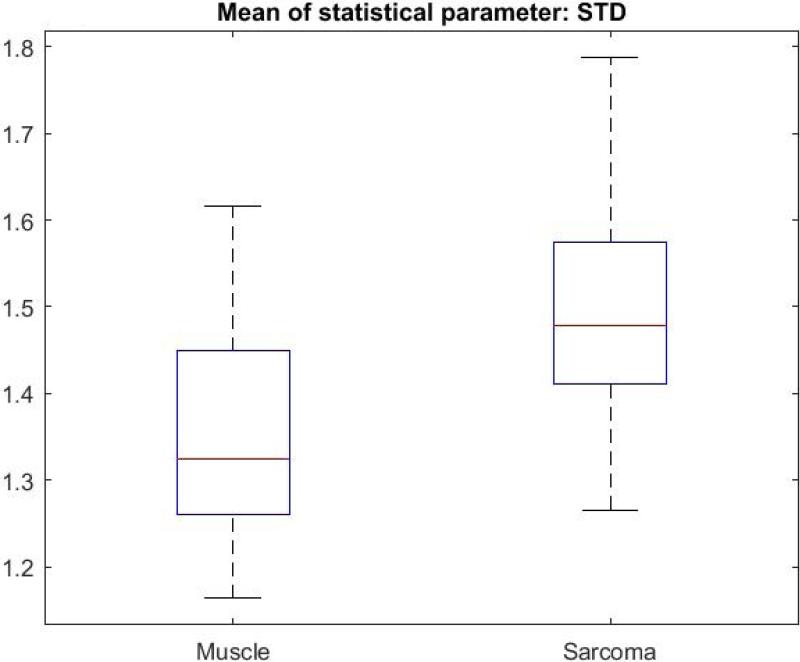
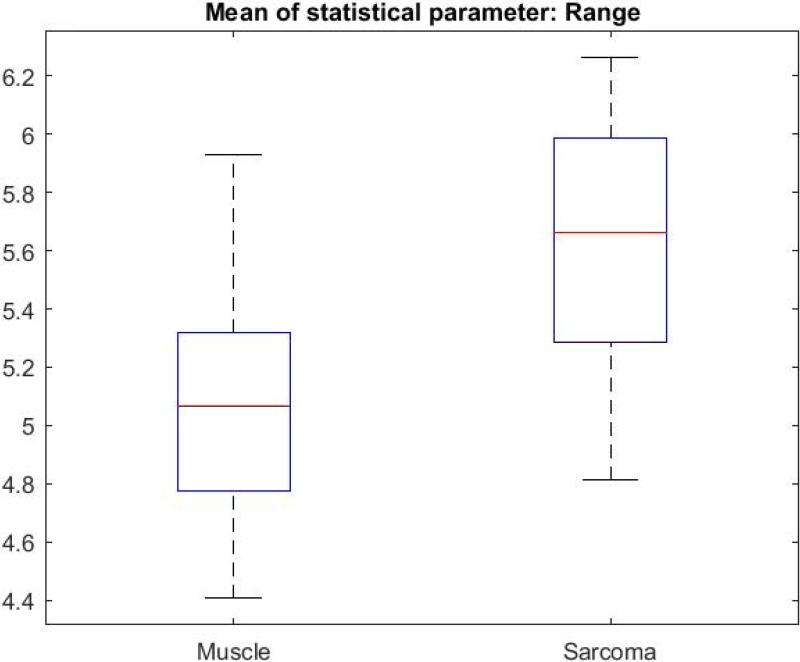
Figure 5 illustrates the image processing steps for the CV metric, with a direct comparison between sarcoma and muscle tissue. The original intensity image (OCT image) of sarcoma tissue is shown with its corresponding mask, followed by the result of multiplying the CV with the mask (Fig. 5.A-C). The same CV metric was calculated on an original OCT intensity image of muscle tissue and similarly processed (Fig. 5.D-F). B-scans were grouped based on tissue types. The CV, STD, and Range were calculated over all of the segmented B-scans in every group, then the mean of each statistical parameter was calculated, and the Wilcoxon rank sum test was applied to compare the means of each statistical parameter. The Wilcoxon rank sum test tested the null hypothesis that the data from the two groups have equal means, against the alternative that they are not equal. Finally, a box plot was generated to visualize the results (Fig. 6). The means for the STD and Range metrics can be visualized in the box plots shown in Figs. 7 and 8, respectively.
Fig. 5.
Image processing sequence for the descriptive Coefficient of Variation (CV) statistical metric. (A) Original OCT image of sarcoma, (B) corresponding mask, and (C) calculated CV. (D) Raw OCT image of muscle, (E) corresponding mask, and (F) calculated CV. Scale bar represents 1 mm and the color bar ranges from 0.1 to 1.1 in steps of 0.1.
Fig. 6.
Box plot of the means of Coefficient of Variation for all muscle and sarcoma B-scans.
Fig. 7.
Box plot of the means of Standard Deviation for all muscle and sarcoma B-scans.
Fig. 8.
Box plot of the means of Range for all muscle and sarcoma B-scans.
The CV metric illustrated in Fig. 5 demonstrates that with our image processing algorithm and display, there is a visually perceptible difference between sarcoma and muscle. The sarcoma image in Fig. 5.C reveals lower CV values (towards purple on the color scale). In contrast, the muscle image in Fig. 5.F reveals higher CV values (towards orange and white). The two-sided Wilcoxon rank sum test (set to the 5% significance level) tested the null hypothesis that the means of the CV for muscle and sarcoma in OCT images are equal, against the alternative that they are different. For all three metrics, the test rejected the null hypothesis, indicating that indeed there were statistically significant differences between sarcoma and muscle in the OCT images. For the CV metric, p-values were ≤ 0.001, and for STD and Range values, p-values were ≤ 0.0001.
Discussion
To summarize these results, there were statistically significant differences between the means of the CV, STD, and Range metrics for OCT images of sarcoma and muscle, and clearly for adipose tissue. While these three metrics are somewhat related, it is validating that all three showed significant differences, and demonstrated their use as discriminating metrics between these two highly scattering tissue types (sarcoma and muscle). In the OCT images, sarcoma tissue appeared to be more homogenous and texturally smooth. In contrast, muscle tissue had image-based structure that was somewhat disruptive and less texturally smooth or homogeneous. In terms of signal intensity, both tissues are highly scattering, with sarcoma having a higher cellular density and a more random homogeneous pattern compared to muscle, which exhibited a more aligned, anisotropic structure with higher angles of potential light scatterers.
The sarcoma group showed a lower CV but a higher STD metric. We interpret that the lower CV values are likely due to a higher intensity mean, which is a differentiating factor between tissue types. The lower CV metric could also be due to the more uniform or homogeneous texture or structure of sarcoma tumor tissue at these resolutions/scales, compared to the larger honeycomb-like adipose tissue or more linear structural features in the muscle tissue. It should be noted that the Range metric for sarcoma is also greater than for muscle, which parallels that of the STD metric. It appears that while locally, within the windowed regions, sarcoma appear more homogenous, but when considering the Range and STD across the entire image and between images of the same tissue type, there is a greater variation of structures encountered, thereby increasing the STD and Range. Furthermore, muscle tissue, within a local windowed region, appears more heterogeneous, but exhibits more uniform longer-range order and similarities due to the muscle fibers and structures. These differences, both the subtle visual differences and the differences in cellular architecture, were likely responsible for the statistically different metrics investigated in this study. Ongoing studies are investigating the use of polarization-sensitive OCT (PS-OCT) to further differentiate these tissue types, just as we have previously demonstrated for breast cancer [24], given that muscle is birefringent and sarcoma tissue is likely to be less so.
In this study, there were several sources of variability. Since the statistical parameters/metrics were calculated over the entire foreground image of tissue (instead of smaller individual windows of local pixel neighborhoods), the variability of intensity values is likely to be higher. Visual inspection of sarcoma and muscle tissue in OCT images suggests that there is a higher variability of signal intensity and coarser texture in muscle tissue compared to sarcoma. However, images inherently contain a mixture of multiple tissue types (including tissue types other than adipose, sarcoma, and muscle) as well as a wide range of microscopic cellular and structural orientations (notably muscle fibers), as these tissue specimens come from different areas of the body, and are imaged at varying orientations. These architectural variations likely also increase the inherent variability of the OCT signal intensity and texture patterns. In this study, samples were not aligned specifically along any inherent direction of the tissue fibers, so sample rotation invariance should be considered in future imaging sessions and analysis, particularly for the use of PS-OCT. Nevertheless, statistically, the adipose, muscle, and sarcoma tissues evaluated in this study were found to be significantly different.
Conclusion
Due to the inherent cellular microstructural and organizational differences, texture analysis of scattering signal intensity in OCT images has been shown to be appropriate for differentiating sarcoma, muscle, and adipose tissue. The mean values of CV, STD, and Range showed that these tissues are indeed significantly different under OCT. This study was developed with the future goal of improving intraoperative differentiation of these tissue types.. While the surgical resection of the sarcoma includes a supposedly clear margin, there are significant risks that the tissue left behind in the patient still contains residual tumor, or tumor cells, particularly for delicate surgical procedures near sensitive tissue structures. Frozen-section histology is often used to assess margins, but at the expense of undersampling the large margin area, and delaying the surgical procedure for tens of minutes until the pathologist has a result. Therefore, an intraoperative imaging tool such as OCT that is able to identify tissue structure and differentiate tissue types in real time has the potential to reduce surgery costs as well as reduce or eliminate the high local recurrence rates of sarcomas in humans and companion animals. Similar approaches should be investigated in other sub-types of sarcoma, and these methods may also extend into other solid-tumor surgeries where rapid intraoperative margin assessment is critical.
Future implementation of this algorithm and method will focus on ways to automatically differentiate tissue types in real time displays for immediate feedback during the surgical procedure, and with samples that have a diverse mixture of poorly defined tissue types.
Acknowledgements
The authors thank the surgical and pathology lab staff from the College of Veterinary Medicine for their assistance with this research, and Darold Spillman from the Beckman Institute for Advanced Science and Technology for his operations and information technology support. This research was supported in part by grants from the Morris Animal Foundation, the American Kennel Club, and the National Institutes of Health (R01 CA166309). K.J.M. was supported by a U.S. National Science Foundation Graduate Research Fellowship. Additional information can be found at http://biophotonics.illinois.edu.
Footnotes
Conflict of Interest:
S.A.B. is co-founder and chief medical officer for Diagnostic Photonics, which is commercializing Interferometric Synthetic Aperture Microscopy for intraoperative imaging of cancer. He also receives royalties for patents licensed by the Massachusetts Institute of Technology related to Optical Coherence Tomography. All other authors report no conflicts of interest.
References
- 1.Cancer Facts & Figures 2015. American Cancer Society; 2015. [Google Scholar]
- 2.Wibmer C, Leithner A, Zielonke N, Sperl M, Windhager R. Increasing incidence rates of soft tissue sarcomas? A population-based epidemiologic study and literature review. Annals of Oncology. 2010;21(5):1106–1111. doi: 10.1093/annonc/mdp415. [DOI] [PubMed] [Google Scholar]
- 3.Shiu MH, Castro EB, Hajdu SI, Fortner JG. Surgical treatment of 297 soft tissue sarcomas of the lower extremities. Annals of Surgery. 1975;182(5):597–602. doi: 10.1097/00000658-197511000-00011. [DOI] [PMC free article] [PubMed] [Google Scholar]
- 4.Daigeler A, Zmarsly I, Hirsch T, Goertz O, Steinau HU, Lehnhardt M, Harati K. Long-term outcome after local recurrence of soft tissue sarcoma: a retrospective analysis of factors predictive of survival in 135 patients with locally recurrent soft tissue sarcoma. Br J Cancer. 2014;100(6):1456–1464. doi: 10.1038/bjc.2014.21. [DOI] [PMC free article] [PubMed] [Google Scholar]
- 5.Wu JS, Hochman MG. Soft-tissue tumors and tumor-like lesions: A systematic imaging approach. Radiology. 2009;253(2):297–316. doi: 10.1148/radiol.2532081199. [DOI] [PubMed] [Google Scholar]
- 6.Aga P, Singh R, Parihar A, Parashari U. Imaging spectrum in soft tissue sarcomas. Indian J Surg Oncol. 2011;2(4):271–279. doi: 10.1007/s13193-011-0095-1. [DOI] [PMC free article] [PubMed] [Google Scholar]
- 7.Gould SW, Agarwal T, Benoist S, Patel B, Gedroyc W, Darzi A. Resection of soft tissue sarcomas with intra-operative magnetic resonance guidance. JMRI. 2002;15(1):114–9. doi: 10.1002/jmri.10037. [DOI] [PubMed] [Google Scholar]
- 8.Boppart SA, Luo W, Marks DL, Singletary KW. Optical coherence tomography: feasibility for basic research and image-guided surgery of breast cancer. Breast Cancer and Research Treatment. 2004;84:85–97. doi: 10.1023/B:BREA.0000018401.13609.54. [DOI] [PubMed] [Google Scholar]
- 9.Nguyen FT, Zysk AM, Chaney EJ, Kotynek JG, Oliphant UJ, Bellafiore FJ, Rowland KM, Johnson PA, Boppart SA. Intraoperative evaluation of breast tumor margins with optical coherence tomography. Cancer Research. 2009;69(22):8790–8796. doi: 10.1158/0008-5472.CAN-08-4340. [DOI] [PMC free article] [PubMed] [Google Scholar]
- 10.Lindenmaier AA, Conroy L, Farhat G, DaCosta RS, Flueraru C, Vitkin IA. Texture analysis of optical coherence tomography speckle for characterizing biological tissues in vivo. Optics Letters. 2013;38(8):1280–1282. doi: 10.1364/OL.38.001280. [DOI] [PubMed] [Google Scholar]
- 11.Wang S, Liu CH, Zakharov VP, Lazar AJ, Pollock RE, Larin KV. Three-dimensional computational analysis of optical coherence tomography images for the detection of soft tissue sarcomas. J Biomed Opt. 2013;19(2):021102. doi: 10.1117/1.JBO.19.2.021102. [DOI] [PubMed] [Google Scholar]
- 12.Erickson SJ, Nolan RM, Shemonski ND, Adie SG, Putney J, Darga D, McCormick DT, Cittadine AJ, Zysk AM, Marjanovik M, Chaney EJ, Monroy GL, South FA, Cradock KA, Liu ZG, Sudaram M, Ray PS, Boppart SA. Real-time imaging of the resection bed using a handheld probe to reduce incidence of microscopic positive margins in cancer surgery. Cancer Research. 2015;75(18):3706–3712. doi: 10.1158/0008-5472.CAN-15-0464. [DOI] [PMC free article] [PubMed] [Google Scholar]
- 13.Bonagura JD, Twedt DC. Kirk's Current Veterinary Therapy XV. 27. Elsevier Saunders; Missouri: 2014. p. 2. [Google Scholar]
- 14.Ladlow J. Injection site-associated sarcoma in the cat: treatment recommendations and results to date. Journal of Feline Medicine and Surgery. 2013;15(5):409–418. doi: 10.1177/1098612X13483239. [DOI] [PMC free article] [PubMed] [Google Scholar]
- 15.Phelps HA, Kuntz CA, Milner RJ, Powers BE, Bacon NJ. Radical excision with five-centimeter margins for treatment of feline injection-site sarcomas: 91 cases (1998-2002). Journal of the American Veterinary Medical Association. 2011;239(1):97–106. doi: 10.2460/javma.239.1.97. [DOI] [PubMed] [Google Scholar]
- 16.Ojala T, Pietikainen M. Texture classification. http://www.ee.oulu.fi/research/imag/texture.
- 17.Gan Y, Tsay D, Amir SB, Marboe CC, Hendon CP. Automated classification of optical coherence tomography images of human atrial tissue. J Biomed Opt. 2016;21(10):101407. doi: 10.1117/1.JBO.21.10.101407. [DOI] [PMC free article] [PubMed] [Google Scholar]
- 18.Suresh A, Shunmuganathan KL. Image texture classification using gray level co-occurrence matrix based statistical features. European Journal of Scientific Research. 2012;75(4):591–597. [Google Scholar]
- 19.Gossage KW, Tkaczyk TS, Rodriguez JJ, Barton JK. Texture analysis of optical coherence tomography images: feasibility for tissue classification. J Biomed Opt. 2003;8(3):570–575. doi: 10.1117/1.1577575. [DOI] [PubMed] [Google Scholar]
- 20.Friberg S, Mattson S. On the growth rates of human malignant tumors: Implications for medical decision making. J Surg Oncol. 1997;65(4):284–297. doi: 10.1002/(sici)1096-9098(199708)65:4<284::aid-jso11>3.0.co;2-2. [DOI] [PubMed] [Google Scholar]
- 21.Moran DT. [October 15, 2016];Histology Text Atlas Book Chapter 7: Muscle [Visual Histology Web site] Available at: http://www.visualhistology.com/products/atlas/VHA_Chpt7_Muscle.html.
- 22.Chan TF, Vese LA. Active contours without edges. IEEE Transactions on Image Processing. 2001;10(2):266–277. doi: 10.1109/83.902291. [DOI] [PubMed] [Google Scholar]
- 23.Zysk AM, Adie SG, Armstrong JJ, Leigh MS, Paduch A, Sampson DD, Nguyen FT, Boppart SA. Needle-based refractive index measurement using low-coherence interferometry. Optics Letters. 2007;32(4):385–7. doi: 10.1364/ol.32.000385. [DOI] [PubMed] [Google Scholar]
- 24.South FA, Chaney EJ, Marjanovik M, Adie SG, Boppart SA. Differentiation of ex vivo human breast tissue using polarization-sensitive optical coherence tomography. Biomed Opt Express. 2014;5(10):3417–3426. doi: 10.1364/BOE.5.003417. [DOI] [PMC free article] [PubMed] [Google Scholar]


