

Abstract
The anti‐inflammatory agent palmitoylethanolamide (PEA) reduces cyclooxygenase (COX) activity in vivo in a model of inflammatory pain. It is not known whether the compound reduces prostaglandin production in RAW264.7 cells, whether such an action is affected by compounds preventing the breakdown of endogenous PEA, whether other oxylipins are affected, or whether PEA produces direct effects upon the COX‐2 enzyme. RAW264.7 cells were treated with lipopolysaccharide and interferon‐γ to induce COX‐2. At the level of mRNA, COX‐2 was induced >1000‐fold following 24 h of the treatment. Coincubation with PEA (10 μmol/L) did not affect the levels of COX‐2, but reduced the levels of prostaglandins D2 and E2 as well as 11‐ and 15‐hydroxyeicosatetraenoic acid, which can also be synthesised by a COX‐2 pathway in macrophages. These effects were retained when hydrolysis of PEA to palmitic acid was blocked. Linoleic acid‐derived oxylipin levels were not affected by PEA. No direct effects of PEA upon the oxygenation of either arachidonic acid or 2‐arachidonoylglycerol by COX‐2 were found. It is concluded that in lipopolysaccharide and interferon‐γ‐stimulated RAW264.7 cells, PEA reduces the production of COX‐2‐derived oxylipins in a manner that is retained when its metabolism to palmitic acid is inhibited.
Keywords: Palmitoylethanolamide, cyclooxygenase, prostaglandin, oxylipin, RAW264.7 cells, fatty acid amide hydrolase, N‐acylethanolamine hydrolysing acid amidase, bootstrapped linear model
Abbreviations
- 2‐AG
2‐arachidonoylglycerol
- AA
arachidonic acid
- AEA
arachidonoylethanolamide, anandamide
- BCa
bias‐corrected and accelerated
- BHT
butylhydroxytoluene
- COX
cyclooxygenase
- CUDA
12‐[[(cyclohexylamino)carbonyl] amino]‐dodecanoic acid
- DHEA
docosahexaenoylethanolamide
- ESI
electrospray ionization
- FBS
fetal bovine serum
- IFNγ
interferon‐γ
- LEA
linoleoylethanolamide
- LPS
lipopolysaccharide
- MS/MS
tandem mass spectrometry
- NAAA
N‐acylethanolamine hydrolysing acid amidase
- OEA
oleoylethanolamide
- PA
palmitic acid
- PEA
palmitoylethanolamide
- PG
prostaglandin
- Q:Q
quantile:quantile
- SEA
stearoylethanolamide
- UPLC
ultra‐performance liquid chromatography
- URB597
3′‐carbamoyl‐biphenyl‐3‐yl‐cyclohexyl‐carbamate)
Introduction
Palmitoylethanolamide (PEA) is an endogenous N‐acylethanolamine related to the cannabinoid ligand anandamide (arachidonoylethanolamide, AEA). Although PEA does not directly activate cannabinoid receptors, it has anti‐inflammatory and antinociceptive properties (reviews, see Alhouayek and Muccioli 2014; Gabrielsson et al. 2016). Macrophages are intimately involved in the responses to inflammation and infection, and PEA produces a number of potentially useful effects upon their function, including an increased rate of phagocytosis of Escherichia coli (Redlich et al. 2014), a reduced infiltration into inflamed colon criptae (Esposito et al. 2014) and a reduction in nitric oxide production in response to the bacterial endotoxin lipopolysaccharide (LPS) (Ross et al. 2000). The PEA hydrolytic enzyme N‐acylethanolamine hydrolysing acid amidase (NAAA) is highly expressed in macrophages, and NAAA inhibitors also are active in models of inflammation and inflammatory pain (Solorzano et al. 2009; Sasso et al. 2013; Alhouayek et al. 2015).
A key family of mediators in inflammation and pain are the prostaglandins derived from cyclooxygenase (COX)‐1 and ‐2. Costa et al. (2002) reported that 4 days after intraplantar administration of carrageenan, the total activity of COX and nitrite/nitrate production in the rat paws were increased, and that repeated oral administration of PEA (10 mg/kg p.o.) reduced these levels back to those seen in the noninflamed paws. The ability of PEA to reduce COX‐2 expression and/or prostaglandin (PG) release is seen in other in vivo studies using models of pain and/or inflammation (Esposito et al. 2014; D'Agostino et al. 2009; Sayd et al. 2015).
Thus, PEA can affect the function of macrophages and can reduce in vivo the COX‐2 induction following inflammation produced by LPS. However, it is not known whether PEA affects COX‐2 expression or PG production in LPS‐stimulated macrophages, akin to that seen for the PEA homologues docosahexaenoylethanolamide (DHEA) and linoleoylethanolamide (LEA) (Ishida et al. 2013; Meijerink et al. 2015). In consequence, we have investigated the effects of PEA upon COX expression and PG production in LPS + interferon‐γ (IFNγ)‐treated RAW264.7 macrophages. The following three main questions have been asked:
Does PEA reduce PG production in RAW264.7 cells and is this affected by compounds preventing the breakdown of endogenous PEA?
Is the effect of PEA upon PG production in the macrophages restricted to these oxylipins, or is it seen for other biologically important oxylipins?
Does PEA have direct effects upon the COX isoenzymes?
Materials and Methods
Compounds and materials
Ovine COX‐1 (cat. no. 60100), human recombinant COX‐2 (cat. no. 60122), COX‐2 polyclonal antibody (rabbit anti‐mouse, cat #: 160106), URB597 (3′‐carbamoyl‐biphenyl‐ 3‐yl‐cyclohexyl‐carbamate), arachidonic acid (AA), AEA, PEA, stearoylethanolamide (SEA), oleoylethanolamide (OEA), 2‐arachidonoylglycerol (2‐AG), PEA‐d4, SEA‐d3, PGD2, PGE2, 11‐HETE, 15‐HETE, 9‐HODE, 13‐HODE, butylhydroxytoluene (BHT), 12‐[[(cyclohexylamino)carbonyl]amino]‐dodecanoic acid (CUDA), 9‐HODE‐d4, PGE2‐d4 and PGD2‐d4 were purchased from the Cayman Chemical Co. (Ann Arbor, MI, USA). PEA is described by the manufacturers as ≥98% pure. We detected a ~1.8 and ~0.9% impurity of the PEA by SEA and OEA, respectively, in our stock solutions (Fig. S1). The abbreviations for the oxylipins investigated in this study are given in Table 1. LPS from E. coli, flurbiprofen, palmitic acid and pentadecylamine were obtained from Sigma‐Aldrich (St. Louis, MO). Recombinant mouse IFNγ and protease inhibitor cocktail set III were obtained from Merck Millipore (Darmstadt, Germany). [Ethanolamine 1‐3H]PEA (specific activity 20 Ci/mmol) was obtained from American Radiolabeled Chemicals Inc (St. Louis, MO.).
Table 1.
Abbreviations of the oxylipins presented in this study
| Lipid | Full name |
|---|---|
| Linoleic acid derivatives | |
| 9‐HODE | 9‐Hydroxy‐10E,12Z‐octadecadienoic acid |
| 13‐HODE | 13‐Hydroxy‐9Z,11E‐octadecadienoic acid |
| 9,10‐DiHOME | 9(10)‐Dihydroxy‐12Z‐octadecenoic acid |
| 12,13‐DiHOME | 12(13)‐Dihydroxy‐9Z‐octadecenoic acid |
| 9,10,13‐TriHOME | 9,10,13‐Trihydroxy‐11‐octadecenoic acid |
| 9,12,13‐TriHOME | 9,12,13‐Trihydroxy‐10E‐octadecenoic acid |
| 12(13)‐EpOME | 12(13)‐Epoxy‐9Z‐octadecenoic acid, iso‐leukotoxin |
| Dihomo‐γ‐linolenic acid derivative | |
| 15(S)‐HETrE | 15(S)‐Hydroxy‐8Z,11Z,13Z‐eicosatrienoic acid |
| Arachidonic acid derivatives | |
| PGD2 | 9α,15(S)‐Dihydroxy‐11‐oxo‐prosta‐5Z,13E‐dien‐1‐oic acid, prostaglandin D2 |
| PGE2 | 9‐Oxo‐11 α,15(S)‐dihydroxy‐prosta‐5Z,13E‐dien‐1‐oic acid, prostaglandin E2 |
| 11‐HETE | 11‐Hydroxy‐5Z,8Z,12E,14Z‐eicosatetraenoic acid |
| 15‐HETE | 15‐Hydroxy‐5Z,8Z,11Z,13E‐eicosatetraenoic acid |
| 5(S),6(R)‐LXA4 | 5S,6R,15S‐Trihydroxy‐7E,9E,11Z,13E‐eicosatetraenoic acid, lipoxin A4 |
Culture of RAW264.7 cells
RAW264.7 mouse leukaemic monocyte/macrophage cells (ECACC, Porton Down, UK, passage numbers 13–16) were cultured in Dulbecco's Modified Eagle's Medium – high glucose, 10% fetal bovine serum (FBS), 100 U mL−1 penicillin and 100 μg mL−1 streptomycin. Cells were cultured in 75‐cm2 flasks prior to seeding to six‐well plates.
mRNA assays
RAW264.7 cells (2.5 × 10⁵ per well) were seeded into six‐well plates and incubated for 24 h. The cells were then treated with either phosphate‐buffered saline or LPS (0.1 μg/mL in each well) + INFγ (100 U/mL in each well) and PEA (10 μmol/L) or vehicle for either 30 min or 24 h, after which media was removed. The cells were washed with 600 μL cold phosphate‐buffered saline, after which 600 μL of lysis/binding buffer (Thermo Fisher Scientific, Waltham, MA) was added and plates were placed in −80°C. A Dynabeads mRNA direct purification kit was used to extract mRNA according to the manufacturer's instructions. The extracted mRNA was stored at −20°C until used for reverse transcription. The mRNA samples were thawed and analysed in Nanodrop Lite® (Thermo Fisher Scientific) and then diluted in TE‐buffer to a concentration of 5 ng/μL and mixed with the 2XRT master mix (High capacity cDNA reverse transcription kit, Thermo Fisher Scientific). Samples were run in a Life Touch thermal cycler (BIOER, Hangzhou, China). If not directly used, samples were stored at −20°C until qPCR was performed. cDNA was diluted 1/10 and loaded into the assay plates. qPCR was performed with the Eco Real‐Time PCR system (Illumina Inc., San Diego, CA). PCR reactions were run using a SYBR Green mix (KAPA SYBR FAST qPCR kit Master Mix, KAPA Biosystems, Wilmington, MA). Each sample was measured in duplicate. The following conditions were used for amplification: an initial holding stage of 3 min at 95°C, then 45 cycles consisting of denaturation at 95°C for 3 sec and annealing/extension at 60°C for 30 sec. Products were analysed by performing a melting curve at the end of the PCR reaction. Data were normalised to the 60S ribosomal protein L19 (RPL19) mRNA expression and relative quantification was performed using the ∆ΔCt method. The primers used are given in Table S1.
Measurement of COX‐2 levels in RAW264.7 cells
COX‐2 levels in RAW264.7 cells were measured using the AbCam mouse Cox2 Simple Step Elisa kit (art. no. ab210574; AbCam plc, Cambridge, UK). Briefly, cells (passage 16) were seeded at a concentration of 8 × 10⁵ cells/mL and cultured for 24 h. Cells were then cultured for a further 20 h in the absence or presence of LPS/INFγ and PEA. After removal of medium, the cells were rinsed twice with phosphate‐buffered saline and then solubilised by addition of 800 μL of the chilled cell extraction buffer provided in the kit. COX‐2 levels were measured at either one dilution (in triplicate, for the unstimulated cells) or two dilutions (in duplicate, for the stimulated cells) according to the instructions provided with the kit, and COX‐2 concentrations calculated from an eight‐point calibration curve (in triplicate). The undiluted protein concentrations used were in the range 2.2–12 μg/well.
Lipid quantification by UPLC‐ESI‐MS/MS
Seeded cells (2.5 × 10⁵/well) were incubated for 24 h and then treated with either phosphate‐buffered saline (when indicated) or LPS + INFγ for 24 h at 37°C. Half of the plates were also incubated with PEA during this period (“24 h” in the Results). For the other half (“30 min”), medium was discarded and fresh medium (at 37°C) was added before adding the PEA solutions and incubation for 30 min. After the incubation period, the plates were placed on ice and methanol (1 mL) was added to the wells. The mixture was scraped using a rubber policeman, and the extracts were pipetted into Falcon tubes. An additional 1 mL of methanol was added to the wells, which were again scraped and the mixture was pipetted into the same tubes. The tubes were centrifuged at 2000g for 15 min (4°C) to sediment cell debris, and the methanol phase was collected and stored at −80°C until used for analysis of lipids. The storage period was never longer than 3 days.
The validated method of Gouveia‐Figueira and Nording (2015) was used to measure lipid concentrations. MilliQ water was added to the cell extracts to give a final methanol concentration of 5% (v/v). Samples were spiked with 10 μL internal standard solutions and 10 μL antioxidant solution (0.2 mg/mL BHT/EDTA in methanol/water (1:1)) and then applied directly to the solid phase extraction cartridge. Compounds were extracted using Waters Oasis HLB cartridges (60 mg of sorbent, 30 μm particle size). The cartridges were washed with 2 mL of ethyl acetate, followed by 2 × 2 mL of methanol, after which they were conditioned with 2 × 2 mL of wash solution (95:5 v/v water/methanol with 0.1% acetic acid). After loading the sample (containing internal standard and antioxidant solution), cartridges were washed with 2 × 4 mL of wash solution. They were then dried under high vacuum for about 1 min, and eluted with 3 mL acetonitrile, followed by 2 mL of methanol, and 1 mL of ethyl acetate into polypropylene tubes containing 6 μL of a glycerol solution (30% in methanol). Eluates were concentrated with a MiniVac system (Farmingdale, NY), reconstituted in methanol (100 μL), and vortexed. Solutions were transferred to LC vials with low‐volume inserts. A quantity of 10 μL of a recovery standard (CUDA, 50 ng/mL) was added in order to normalise for changes in volume and instrument variability, and ultra‐performance liquid chromatography–tandem mass spectrometric (UPLC–MS/MS) analysis was performed immediately using an Agilent ultra‐performance (UP)LC system (Infinity 1290) coupled with an electrospray ionization source (ESI) to an Agilent 6490 Triple Quadrupole system equipped with the iFunnel Technology (Agilent Technologies, Santa Clara, CA). Runs in positive mode (for PEA and related N‐acylethanolamines) and negative mode (for the prostaglandins and other oxylipins) were undertaken. Analyte separation was performed using a Waters BEH C18 column (2.1 mm × 150 mm, 1.7 μm particle size) with mobile phase consisting of (A) 0.1% acetic acid in MilliQ water and (B) acetonitrile:isopropanol (90:10). Injection volumes for each run were 10 μL. Quantification was undertaken using appropriate internal deuterated standards for each metabolite. Calibration curves were calculated by least‐squares linear regression without reciprocal factor. Further details of the analytical parameters used and the accuracy and precision ranges are given in Appendix S1.
[3H]PEA hydrolysis by intact RAW 264.7 cells
The assay was based on a method for [3H]AEA hydrolysis by intact cells (Björklund et al. 2014). RAW 264.7 cells (2.5 × 10⁶ cells/well) were seeded and cultured overnight prior to addition of either phosphate‐buffered saline or LPS (0.1 μg/mL) + INFγ (100 U/mL) and incubation for a further 24 h. Medium was discarded and fresh medium was added before performing the hydrolysis experiments. Vehicle (DMSO, 0.1% v/v), URB597 (1 μmol/L) and pentadecylamine (30 μmol/L) or a combination of both were added followed 10 min later by [3H]PEA (10 μmol/L of nonradioactive compound + 1.25 nmol/L of [ethanolamine 1‐3H]PEA) and the cells were incubated for 30 min at 37°C. Reactions were stopped by addition of 3 mL of activated charcoal buffer. Aliquots were placed on ice and thereafter centrifuged at 1420 g for 10 min. Aliquots of the supernatants were analysed for tritium content by liquid scintillation spectroscopy with quench correction.
Measurement of COX‐1 and ‐2 activity
The assay was performed as described in (Meade et al. 1993) with minor modifications (Onnis et al. 2010). Samples were diluted in DMSO and then prepared in 0.1 mol/L Tris‐HCl buffer pH 7.4–7.6 containing 1 mmol/L haematin, 2 mmol/L phenol and 2 or 10 μmol/L enzyme substrate (AA or 2‐AG) to a final assay volume of 2 mL. A baseline was established for 5 min before initiation of reaction by addition of 200 units of ovine COX‐1 or human recombinant COX‐2. Change in oxygen consumption was monitored in an Oxygraph (Hansatech Instruments, King's Lynn, U.K.) for approximately 5 min. The first 120 sec following addition of COX are presented in the results.
Statistical methods
The experiments were designed for ANOVA statistical analyses. However, ANOVA assumes that the residuals are normally distributed and that the variances (SD2) of the groups are equal. ANOVA is fairly robust to unequal variances when the sample sizes are the same, but not otherwise. In our experiments, these assumptions were in many cases not met (see e.g. Fig. 1A, where there is an obvious difference in the variance for each group from the unstimulated and stimulated cells), and this situation is compounded by unequal group sizes, which occurred in some cases, usually due to removal of outliers. Nonparametric methods such as, for example, the Mann–Whitney comparison do not require the normality assumption, but a significant P value can only be interpreted in terms of differences in median values if the distributions of the groups are the same (Fagerland and Sandvik 2009).
Figure 1.
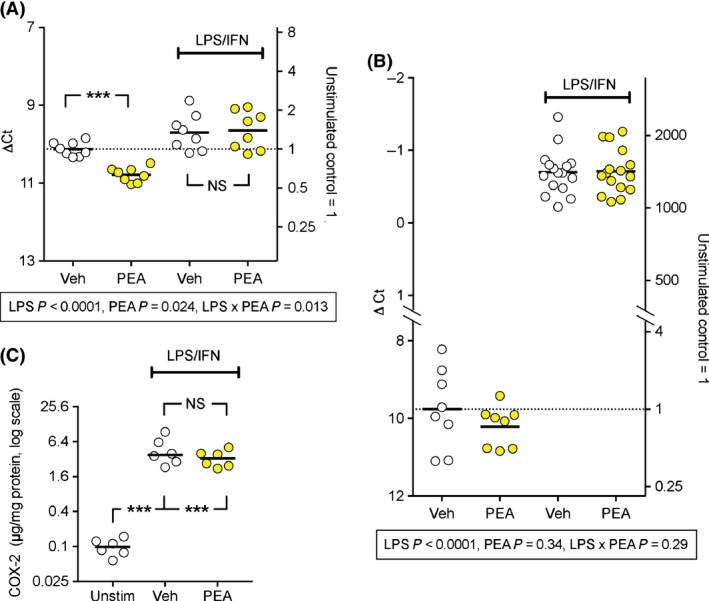
Effect of PEA and LPS + IFNγ treatment of RAW264.7 cells upon mRNA and the protein levels of COX‐2. RAW264‐7 cells (2.5 × 10⁵ per well) in six‐well plates were treated with LPS (0.1 μg/mL) + INFγ (100 U/mL) (or vehicle) and either 0 or 10 μmol/L PEA and cultured at 37°C for either 30 min (Panel A), 24 h (Panel B) or 20 h (Panel C); n = 6–16. In Panels A and B, the individual ∆Ct values (the difference in threshold cycle between the mRNA of interest and the housekeeper mRNA, in this case RPL19), are shown with the means represented by the bars. The right y‐axes show data where the mean value in the absence of either PEA or LPS + IFNγ are set to unity. The scale is antilogged since a change of ∆Ct of −1 unit corresponds to a doubling of mRNA. Under the figures are the P values (calculated using bootstrapped linear models for the data expressed as ∆Ct as described in Methods) for each time point, given the significant interaction LPS x Time in the main analysis (Table 2). ***P < 0.001, NS P > 0.05 for the comparisons shown in Panel A (i.e. where the LPS × PEA interaction was significant). In Panel C, the data are shown on a log scale, since the variances were unequal for the untransformed data. An one‐way ANOVA on the log‐transformed data gave F2,15 = 163, P < 0.0001. The residual Q.Q plot was consistent with a normal distribution of the residuals. ***P < 0.001, NS P > 0.05 for the comparisons shown (Holm–Sidak's multiple comparison test).
As pointed out by Field et al. (2012), ANOVA is just a special case of regression. In consequence, we have elected to use the standard linear model and to obtain reliable P values (when testing if the parameters in the model are different from zero), by estimating the sample distribution of the test statistic via a bootstrap approach described in Hall and Wilson (1991) instead of using the t‐distribution. This was undertaken both for a main effect model and for a model including interactions. In the latter model, only the P values for the interaction terms have been reported. When the assumptions of normality of residuals and equal variances are met in the dataset, the sample distribution of the test statistic will be essentially identical to the t‐distribution, and hence, the P values will be the same (with a slight variation due to the randomness built into the bootstrap approach, even with 10,000 iterations). However, the bootstrap approach will be robust to deviations from normality of residues and equal variances (providing there are no outliers in the dataset), whereas the standard approach will not.
Data bootstrapping with replacement was undertaken using the package “boot” within the R project for statistical computing (versions 3.1.1, 3.2.3 and 3.3.1) (R Core Team, 2016). RStudio (version 0.99.489 for the Macintosh) was used as the interface. For the bootstrapped linear model, P values are determined as the 2× the number of occasions when the distribution under the null hypothesis gave t values more extreme than the observed t value for the coefficient in question, divided by the number of bootstrap iterations. In all cases, the number of iterations used was 10,000. The script (for R) is provided in Appendix S2. Bias‐corrected and accelerated (BCa, Efron 1987) bootstrapped (10,000 iterations) 95% confidence intervals (CI) were calculated using the function boot.ci in the boot package for R. For the lipid experiments, anomalous values were identified using box and whisker plots. Possible outliers (1.5× interquartile range above or below the 25% and 75% values) are shown as triangles in the figures, but were included in the analyses. Probable outliers (3× interquartile range above or below the 25% and 75% values, shown as red squares in the figures) were excluded from the analyses. Box plots for identification of anomalous values, Kruskall–Wallis and Mann–Whitney U‐tests, calculation of areas under the curves, and curve fitting procedures were undertaken using the GraphPad Prism computer program (GraphPad Software Inc., San Diego, CA), versions 6.0 h and 7.0a, for the Macintosh. Residual Q:Q (quantile:quantile) plots were undertaken using the car package in R.
Throughout the text, N refers to the number of separate experiments conducted on different occasions, and n refers to the number of separate samples extracted and analysed from different wells on 1–2 different occasions.
Results
Effects of LPS + IFNγ and PEA upon mRNA levels of COX‐1, COX‐2, 15‐LOX, FAAH and NAAA in RAW 264.7 cells
RAW 264.7 cells were cultured in the absence or presence of LPS + IFNγ and in the absence or presence of PEA (10 μmol/L) for either 30 min or 24 h after which time cell lysates were collected for qPCR. The mRNA data for COX‐2, COX‐1, 15‐LOX, FAAH and NAAA (relative to the housekeeping gene RPL19 which codes for ribosomal protein L19) are shown in Figure 1, 2 and S2. The statistical analyses are summarised in Table 2. There were significant interactions with the incubation time for COX‐2, FAAH and NAAA, and so the data were reanalysed at each time point, with the P values for the bootstrapped linear models being given in the figures. When interactions in these models were significant, comparisons between vehicle and PEA were made for the control and LPS + IFNγ conditions, and these are shown in the figures. For COX‐2, LPS + IFNγ produced a massive increase in mRNA levels after 24 h and a more modest increase at 30 min. PEA significantly reduced the levels of control COX‐2 at 30 min, whereas no significant effect on the LPS + IFNγ‐stimulated levels at this time point was seen. No significant effects of PEA upon COX‐2 levels were seen at the 24‐h time point (Fig. 1). In the case of COX‐1 and 15‐LOX, no interactions were significant (Table 2), but a significant main effect of LPS + IFNγ was seen, and, in the case of 15‐LOX, a significant main effect, a reduction in expression, of PEA (Fig. S2). For the hydrolytic enzymes FAAH and NAAA, LPS + IFNγ did not significantly affect mRNA levels at the 30 min time point, but increased FAAH and decreased NAAA at the 24 h time point (Fig. 2). This means that while the mRNA levels of FAAH and NAAA are very different under control conditions (NAAA >> FAAH), they are rather similar following 24 h of LPS + IFNγ treatment.
Figure 2.
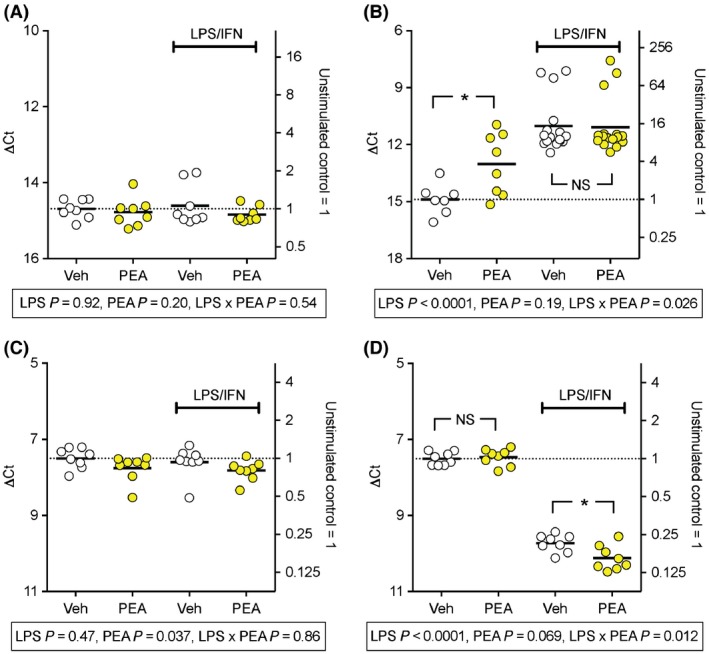
Effect of PEA and LPS + IFNγ treatment of RAW264.7 cells upon mRNA levels of FAAH (Panels A, B) and NAAA (Panels C, D). For experimental details, see Legend to Figure 1. The incubation times were 30 min (Panels A, C) and 24 h (Panels B,D). *P < 0.05, NSP > 0.05.
Table 2.
P values for the effects of LPS + IFNγ (“LPS”) and PEA treatments and incubation times upon the ∆Ct values for COX‐1, COX‐2, 15‐LOX, FAAH and NAAA
| COX‐1 | COX‐2 | 15‐LOX | FAAH | NAAA | |
|---|---|---|---|---|---|
| Main effects | |||||
| LPS | <0.0001 | <0.0001 | <0.0001 | <0.0001 | <0.0001 |
| PEA | 0.58 | 0.69 | 0.0028 | 0.43 | 0.33 |
| Time | 0.55 | <0.0001 | 0.13 | <0.0001 | <0.0001 |
| Interactions | |||||
| LPS × PEA | 0.33 | 0.011 | 0.16 | 0.55 | 0.54 |
| LPS × Time | 0.17 | <0.0001 | 0.054 | <0.0001 | <0.0001 |
| PEA × Time | 0.25 | 0.60 | 0.66 | 0.0066 | <0.0001 |
| LPS × PEA × Time | 0.43 | 0.60 | 0.42 | 0.047 | <0.0001 |
RAW264.7 cells (2.5 × 10⁵ per well) in six‐well plates were treated with LPS (0.1 μg/mL) + INFγ (100 U/mL) (or vehicle) and either 0 or 10 μmol/L PEA and cultured at 37°C for either 30 min or 24 h. Cell lysates were prepared for qPCR. Ct values for the probes minus the corresponding values for the housekeeping gene (RPL19) gave the individual ∆Ct values shown in the scatter plots in Figs. 1, 2 and S2. The P values were calculated using ∆Ct and linear models as described in Methods. In the linear models, a main effect of an explanatory variable is given relative to a reference. In this case, the reference values are LPS = 0, PEA = 0, Time = 30 min. Thus, for example, a significant main effect of time refers to the difference between the 24 h time point with respect to the 30 min time point.
COX‐2 protein levels were also determined using a commercial ELISA kit. Due to the assay requirements, a higher cell density was used in the incubations than for the other experiments described in this paper, and the LPS + IFNγ (±PEA)‐treated, but not control, wells showed discolouration of the medium. In consequence, the incubations were stopped at 20 h rather than 24 h. This impacted upon the protein recovered in the extracts: 3.21 (2.72–3.71), 1.70 (1.29–2.11) and 1.82 (1.51–2.21) mg (means, with 95% confidence limits in brackets, n = 6) for the control, LPS + IFNγ and LPS + IFNγ + PEA‐treated cells, respectively. However, there was a clear effect of the LPS + IFNγ treatment per se upon the COX‐2 levels (Fig. 1C). No significant effect of PEA upon the COX‐2 levels of LPS + IFNγ‐treated cells was seen (Fig. 1C).
Effects of PEA upon oxylipin levels in LPS + IFNγ‐stimulated RAW264.7 cells
RAW 264.7 cells were cultured in the presence of LPS + IFNγ and in the absence or presence of PEA for either the final 30 min or for the entire 24 h. Oxylipin levels in the extracts were then measured (for the chemical names of the oxylipins that were reliably quantitated (i.e. could be quantitated in all the experiments undertaken in this study), see Table 1). There were significant main effects of 10 μmol/L (but not 3 μmol/L) PEA upon the levels of PGD2, PGE2, 11‐ and 15‐HETE, but not upon the levels of the linoleic acid derivatives or of 15(S)‐HETrE (Fig. 3; Table S2). Following 24 h of incubation, the % reductions of the median values produced by 10 μmol/L PEA were 35, 37, 48 and 33% for PGD2, PGE2, 11‐ and 15‐HETE, respectively. A significant effect of PEA upon 5(S),6(R)‐LXA4 levels was seen (Tables S2). However, in a follow‐up experiment, the mean 5(S),6(R)‐LXA4 levels in the absence and presence of 10 μmol/L PEA (30 min incubation) were 0.052 (0.043–0.063) and 0.050 (0.045–0.055) pmol per well, respectively (means, with 95% BCa CI in brackets, n = 18).
Figure 3.
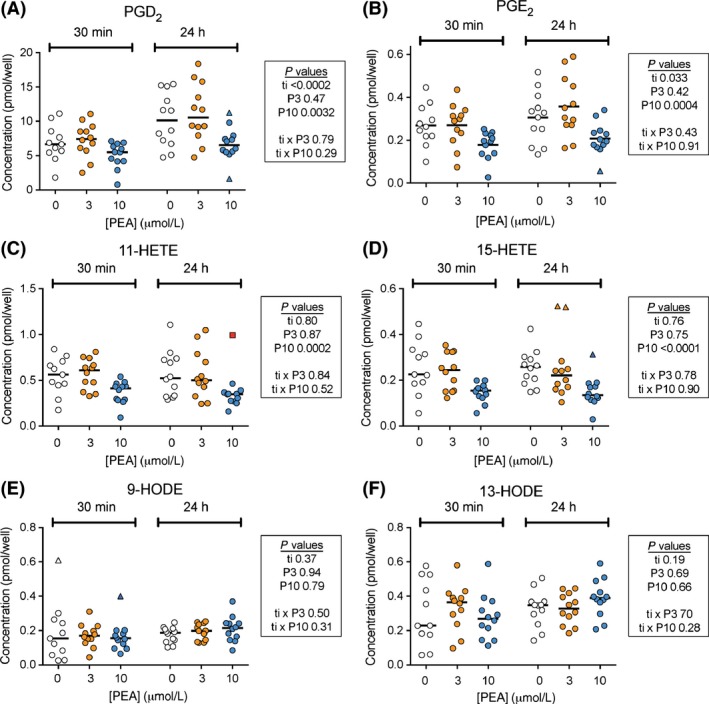
Effect of PEA upon levels of (A) PGD2; (B) PGE2; (C) 11‐HETE; (D) 15‐HETE; (E) 9‐HODE and (F) 13‐HODE in LPS + IFNγ‐treated RAW264.7 cells. Cells (2.5 × 10⁵ per well) were added to six‐well plates with LPS (0.1 μg/mL well) and INFγ (100 U/mL) and cultured at 37°C for 24 h. PEA (3 μmol/L, P3; or 10 μmol/L, P10) or vehicle were added either at the beginning of this culturing period (“24 h”) or for 30 min after the LPS + INFγ incubation phase (“30 min”). The P values were from linear models for main effects alone (top three rows, ti = time component, with 30 min as the reference value) or for a model including interactions (bottom two rows), calculated using t‐distributions determined by bootstrap with replacement sampling (10,000 iterations) of the data under the null hypothesis. Possible and probable outliers, flagged in Boxplot (Tukey) plots, are shown as triangles and red squares, respectively. The possible outliers were included in the statistical analyses, whereas the probable outlier was excluded. The bars represent median values after exclusion of the probable outlier (n = 11–12). For 11‐HETE, the P values for the entire data set (i.e. including the probable outlier) were: ti, 0.87; P3, 0.86; P10, 0.0020; ti × P3, 0.83; ti x P10, 0.93.
A potential weakness of the above experiments is that they do not take into account effects of LPS + IFNγ upon cell proliferation, which might be different under the different conditions used (or even between different wells treated under the same conditions, as we have shown previously for LPS + IFNγ‐treated RAW264.7 cells, see Gouveia‐Figueira et al. 2015). A neat way of controlling for this is to use the combined concentration of the seven linoleic acid‐derived oxylipins as a lipid equivalent of a housekeeping gene (since these are not affected by either LPS + IFNγ (Gouveia‐Figueira et al. 2015) or by PEA), and to express the PGD2, PGE2, 11‐ and 15‐HETE levels relative to these values for each well. The effect of 10 μmol/L PEA upon the levels of these lipids remained significant using this measure (Fig. S3).
Metabolism of PEA by LPS + IFNγ‐stimulated RAW264.7 cells
PEA levels were measured in the experiment summarised in Fig. 3. The endogenous PEA levels (pmol/well) were 3.89 (95% BCa 2.95–5.34, n = 11) and 2.89 (1.96–5.16, n = 12), for the 30 min and 24 h samples, respectively. Following addition of PEA, the amount of the compound recovered in the samples was lower in the 24‐h samples than in the 30‐min samples. Thus, for 3 μmol/L added PEA, the concentrations (pmol/well) were 184 (95% BCa CI 172–196, n = 11) and 51 (44–57, n = 12), respectively, and for 10 μmol/L added PEA the concentrations were 551 (449–624, n = 12) and 266 (228–354, n=12), respectively. This raises the possibility that the effects of PEA are mediated by its primary metabolite, palmitic acid (PA). We investigated the rate of hydrolysis of 10 μmol/L [3H]PEA by the RAW264.7 cells. Following 30 min of incubation of untreated cells with [3H]‐PEA, <1% of the added compound had been hydrolysed, and for the LPS + IFNγ‐treated cells, only ~0.6% of the added compound was hydrolysed at this time point. The hydrolysis was inhibited by both the FAAH inhibitor URB597 (1 μmol/L) and the NAAA inhibitor pentadecylamine (30 μmol/L), with the combination of the two producing ~80% inhibition of the hydrolysis at this time point (Fig. 4). Following a 24‐h incubation, the data were less clear‐cut, but for LPS + IFNγ‐treated cells, only ~10% of the added [3H]PEA had been hydrolysed (data not shown). In a second experimental series, conducted 6 months later with a new batch of [3H]PEA, the activity was even lower, with ~0.4 and ~0.1 of the added [3H]PEA being hydrolysed by the untreated and LPS + IFNγ‐treated cells, respectively, following a 30 min incubation. When the mean rates of hydrolysis after 30 min incubation for the untreated cells were set to unity for each of the two experiments, the mean and 95% BCa CIs, n = 8, for untreated and LPS + IFNγ‐treated cells, respectively, were 1 (0.94–1.12) and 0.45 (0.32–0.55). These data are consistent with the qPCR experiments (Fig. 2).
Figure 4.
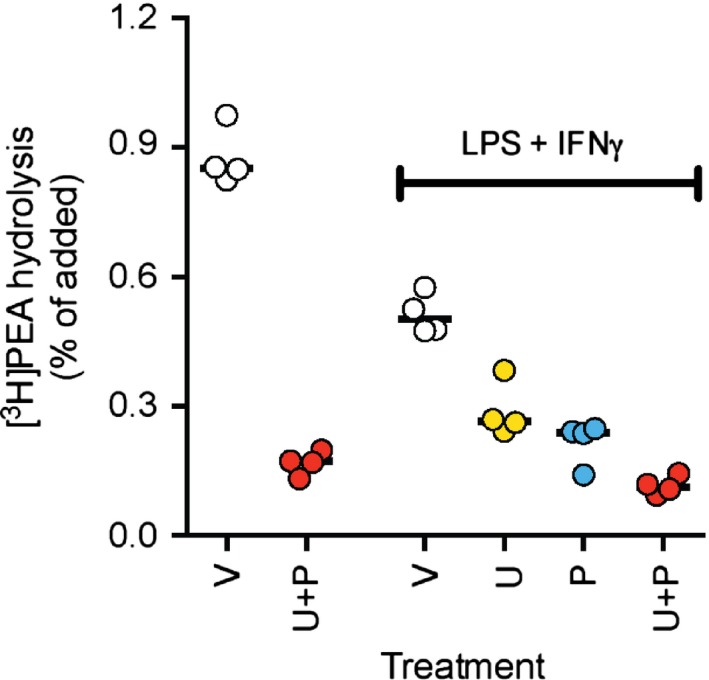
Metabolism of PEA in LPS + IFNγ‐stimulated RAW264.7 cells. Untreated or LPS + INFγ‐treated (24 h) cells were preincubated for 10 min with either vehicle (“V”), 1 μmol/L URB597 (“U”), 30 μmol/L pentadecylamine (“P”) or a combination of the two compounds, prior to addition of 10 μmol/L [3H]PEA and incubation for 30 min. The recovered [3H]ethanolamine is expressed as % of the added tritium.
Given that some of the PEA is hydrolysed in the experiments, we investigated the effects of the combination of URB597 and pentadecylamine upon the response to a 30‐min incubation with either vehicle or PEA in the LPS + IFNγ ‐stimulated RAW264.7 cells. The hypothesis to be tested was whether the combination of the PEA hydrolysis inhibitors blocks the effects of PEA, which would be expected if PA produced by hydrolysis of PEA rather than PEA per se was responsible for the observed effects. The endogenous PEA levels (pmol/well) in the absence and presence of URB597 and pentadecylamine were 1.45 (0.93–3.27, n = 15) and 4.96 (2.80–9.90, n = 17), respectively (means, with 95% BCa CI in brackets). The exogenous levels following addition of 10 μmol/L PEA were 450 (340–510, n = 18) and 440 (350–490, n = 18) pmol, respectively. The data for the PGD2, PGE2, 11‐ and 15‐HETE are shown in Figure 5. PEA treatment again reduced the levels of these oxylipins. The combination of URB597 and pentadecylamine per se affected PGE2 levels but there was no significant interaction PEA x hydrolysis inhibitors for any of the four oxylipins, which would have been expected had the effects of PEA treatment been the result of its conversion into PA.
Figure 5.
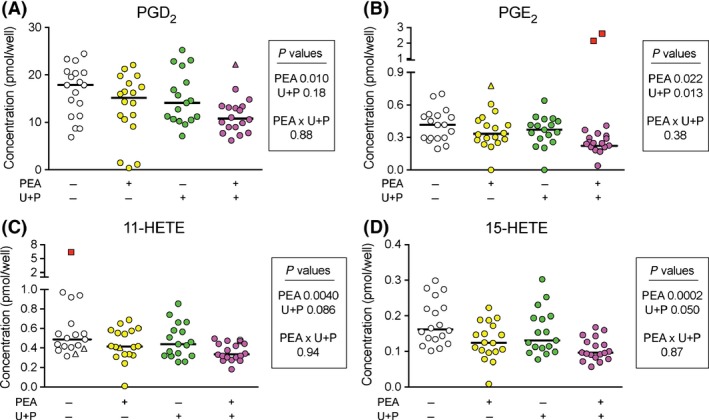
Effect of the combination of 1 μmol/L URB597 (“U”) and 30 μmol/L pentadecylamine (“P”) prior to addition of 0 or 10 μmol/L PEA upon the levels of (A) PGD2; (B) PGE2; (C) 11‐HETE and (D), 15‐HETE in LPS + IFNγ‐treated RAW264.7 cells. Cells (2.5 × 10⁵ per well) were added to six‐well plates with LPS (0.1 μg/mL well) and INFγ (100 U/mL) and cultured at 37°C for 24 h. URB597 and pentadecylamine (or vehicle) were added 10 min prior to addition of vehicle or 10 μmol/L PEA and incubation for 30 min. The raw data are shown as scatterplots (n = 17–18, bars indicate the medians). Possible and probable outliers are shown as triangles and squares, respectively. The possible outliers were included in the statistical analyses, whereas the probable outlier was excluded. The P values were calculated using t‐distributions determined by bootstrap with replacement sampling (10,000 iterations) of the data under the null hypothesis. For PGE2, inclusion of the two probable outliers gave P values of: PEA, 0.57; U + P, 0.60; PEA × U + P, 0.24. For 11‐HETE, inclusion of the two probable outliers gave P values of: PEA, 0.023; U + P, 0.056; PEA × U + P, 0.19.
Effects of PEA upon the catalytic activity of COX‐2
The effects of PEA upon the oxygenation of AA and 2‐AG by COX‐2 were analysed using an oxygraph method. Two substrate concentrations, 2 and 10 μmol/L, were used. However, with AA as substrate, the data at the lower concentration were not sufficiently robust to justify publication, and are not included here. The data are shown in Figure 6A–C. AUC0–120 values were calculated for each individual experiment as a way of describing the total output of the enzyme during the assay (Table 3). There were no significant effects for PEA for any of the assay conditions used. Analysis of enzyme progress curves is not facile (Duggleby 2001), but Cao and De La Cruz (2013) have suggested a generic method whereby data is fitted to the formula: [P] = (v o/η)(1‐e−ηt) where [P] is the product concentration (in our case, the negative value of the oxygen consumption), v o the initial velocity, and η a term describing the reduction in the velocity over time due to substrate depletion, product inhibition (or time‐dependent inhibition by a compound) and/or lack of enzyme stability in the assay. The curves shown in Figure 6 use this fitting with the pooled data, and the constants derived are summarised in Table 3. No obvious effects of PEA upon the observed values were seen.
Figure 6.
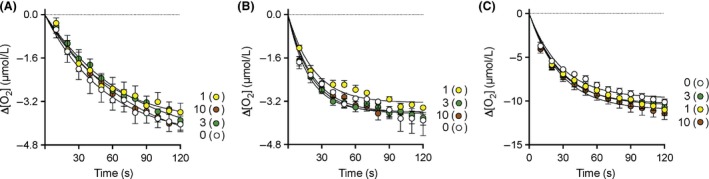
Effects of PEA upon the activity of human recombinant COX‐2. Substrates and concentrations were: (A) 10 μmol/L AA, N = 9; B, 2 μmol/L 2‐AG, N = 6; (C) 10 μmol/L 2‐AG, N = 6. Values are means ± S.E.M, (unless enclosed by the symbols) of the change in oxygen utilisation following addition of enzyme to the oxygen electrode chamber. The PEA concentrations are shown beside each curve.
Table 3.
Effect of PEA upon the catalytic properties of COX‐2
| AUC | vo | η | |||||||
|---|---|---|---|---|---|---|---|---|---|
| [PEA] (μmol/L) | Mean | Lower | Upper | Mean | Lower | Upper | Mean | Lower | Upper |
| 10 μmol/L AA | |||||||||
| 0 | 327 | 231 | 423 | 0.084 | 0.077 | 0.091 | 0.019 | 0.016 | 0.021 |
| 1 | 288 | 200 | 375 | 0.075 | 0.063 | 0.086 | 0.019 | 0.014 | 0.024 |
| 3 | 288 | 190 | 386 | 0.063 | 0.056 | 0.070 | 0.013 | 0.010 | 0.016 |
| 10 | 307 | 240 | 375 | 0.068 | 0.062 | 0.073 | 0.013 | 0.011 | 0.015 |
| P value | 0.87 | ||||||||
| 2 μmol/L 2‐AG | |||||||||
| 0 | 353 | 280 | 426 | 0.16 | 0.12 | 0.21 | 0.045 | 0.030 | 0.060 |
| 1 | 315 | 287 | 344 | 0.14 | 0.11 | 0.17 | 0.043 | 0.032 | 0.054 |
| 3 | 362 | 336 | 389 | 0.19 | 0.16 | 0.22 | 0.054 | 0.044 | 0.063 |
| 10 | 360 | 309 | 411 | 0.17 | 0.14 | 0.20 | 0.047 | 0.038 | 0.056 |
| P value | 0.29 | ||||||||
| 10 μmol/L 2‐AG | |||||||||
| 0 | 892 | 807 | 977 | 0.34 | 0.28 | 0.40 | 0.035 | 0.028 | 0.043 |
| 1 | 963 | 848 | 1079 | 0.37 | 0.31 | 0.42 | 0.035 | 0.029 | 0.041 |
| 3 | 962 | 782 | 1143 | 0.39 | 0.34 | 0.43 | 0.037 | 0.032 | 0.043 |
| 10 | 1014 | 836 | 1192 | 0.39 | 0.34 | 0.44 | 0.035 | 0.029 | 0.042 |
| P value | 0.28 | ||||||||
AUC values (μmol.s/L) were calculated over the period 0–120 sec for the individual curves (N = 9, 6 and 6 for arachidonic acid (AA), 2 μmol/L 2‐AG and 10 μmol/L 2‐AG, respectively, as substrates), whereas the vo (μmol/L sec−1) and η (unitless) terms were calculated for the pooled data. “Lower” and “Upper” refer to the 95% confidence limits. P values for the AUC data were determined by one‐way ANOVA. Visual inspection of residual plots and Levene's tests on the residuals indicated no evidence of non‐normality or heteroscedasticity.
COX‐1 was also investigated. For PEA, only five experiments could be run due to delivery issues with the enzyme. However, a significant difference between AUC0–120 values was seen, due to differences between 3 and 10 μmol/L PEA, rather than between PEA and vehicle (Fig. S4, Table S3). The PEA homologues SEA and PA were without significant effect upon this parameter. Flurbiprofen (10 μmol/L), used as a positive control, produced a large decrease in the AUC0–120 values, and reduced both v o and η (Fig. S4 , Table S3), consistent with the time‐dependent nature of COX‐1 inhibition by this compound (Rome and Lands 1975).
Discussion
The present study had three main aims: to determine (1) whether the ability of PEA to reduce prostaglandin production is seen in a macrophage cell line and whether it is negated by compounds preventing the breakdown of endogenous PEA; (2) whether other oxylipins are also affected by PEA; and (3) whether or not PEA has direct effects upon COX isoenzymes. RAW264.7 cells were chosen since they are known to respond to PEA (Ross et al. 2000) and its homologues DHEA and LEA (Ishida et al. 2013; Meijerink et al. 2015). These aims are discussed in turn.
PEA reduces prostaglandin production in LPS + IFNγ‐stimulated RAW264.7 cells
A concentration of 10 μmol/L PEA was required to reduce PGD2 and PGE2 production in the RAW264.7 cells. These effects are consistent with an action of PEA, rather than its hydrolytic metabolite PA, since they remain in the presence of the FAAH + NAAA inhibitors. A caveat is that PA as a contaminant in the PEA could in theory negate the validity of this experiment. However, the supplier gives the purity of their PEA as “>98%”, and we found ~2% contamination with SEA and OEA, which would point to a low level of contamination, if present, by PA. Further, in an analogous situation, Meijerink et al. (2015) reported that while 10 μmol/L of DHEA reduced LPS‐stimulated PGE2 production, 10 μmol/L of the corresponding docosahexaenoic acid produced the opposite effect. We attempted to investigate the effect of PA, but at the concentration of 10 μmol/L tested, the compound precipitated out of medium during the incubation with the cells. Thus, we cannot rule out this caveat, but we feel it to be unlikely on the basis of the evidence summarised above.
The potency of PEA in our study is consistent with the data of Ross et al. (2000) who found that 10 and 30 μmol/L, but not 1 μmol/L PEA reduced nitric oxide production by LPS‐stimulated RAW264.7 cells. The reduction in nitric oxide production produced by 10 μmol/L PEA was ~40% (Ross et al. 2000), that is, a similar level reduction as seen in the present study. These data are also in line with studies investigating the ability of PEA to affect COX activity in other cell types. In antigen‐treated canine skin mast cells, concentrations of PEA in the range 1–10 μmol/L are required to reduce PGD2, histamine and TNF‐α responses to anti‐IgE challenge (Cerrato et al. 2012). The reduction of PGD2 release in that study produced by 10 μmol/L PEA was 26%. In primary astrocytes from neonatal mouse brains, the increased mRNA expressions of COX‐2, iNOS and tumour necrosis factor α were reduced by 10 μmol/L PEA (by about 25–30% in the case of COX‐2) (Benito et al. 2012). In mouse organotypic spinal cord slice cultures, the increased expression of COX‐2 produced by a sagittal cut was completely blocked by pretreatment with 2.7 μmol/L PEA + 0.27 μmol/L luteolin and 27 μmol/L PEA + 2.7 μmol/L luteolin but not by 0.27 μmol/L PEA + 0.027 μmol/L luteolin (Paterniti et al. 2013).
Are these actions of PEA reported here pharmacologically relevant? Comparison of in vitro and in vivo data is difficult, but plasma concentrations of PEA of ~60 (2 h), ~420 (15 min) and ~25 (2 h) nmol/L have been reported at the times shown after oral administration of 30 mg/kg, 100 mg/kg and 300 mg of PEA to beagle dogs, Wistar rats and humans, respectively (Vacondio et al. 2015; Petrosino et al. 2016). The human dose of 300 mg is at the lower end of the dose range used (300–1200 mg). Given that the distribution volume of PEA is high (Gabrielsson et al. 2016), it is not unreasonable to suggest that micromolar concentrations of PEA can be attained locally in humans given the higher doses of PEA. For comparison, peak plasma concentrations of approximately 300, 160 and 10 μmol/L are found in humans following single dosing of the commonly used nonsteroidal anti‐inflammatory drugs ibuprofen (800 mg), naproxen (250 mg immediate‐release tablet) and diclofenac (100 mg sustained release tablet) (calculated from data collated bv Thummel et al. 2011).
PEA reduces the concentrations of 11‐ and 15‐HETE in LPS + IFNγ‐stimulated RAW264.7 cells
An important finding of the present study is that the effects of PEA upon oxylipin concentrations are not restricted to prostaglandins alone, but are also seen for 11‐ and 15‐HETE. It has been argued that COX‐2 is an important source of both 11‐ and 15‐HETE in activated macrophages, including RAW264.7 cells (Norris et al. 2011; see also Gouveia‐Figueira et al. 2015), and our data are in support of this contention. 15‐HETE is an inflammatory mediator (Johnson et al. 1985), and in patients with low‐grade inflammation in symptomatic knee osteoarthritis, plasma levels of both PGE2 and 15‐HETE are increased (Attur et al., 2015). In mice treated with supernatants of biopsies from patients with irritable bowel syndrome, visceral hypersensitivity is induced and this is associated with an increased level of 15‐HETE in their colons (Cenac et al. 2015). Given the important role(s) of macrophages in inflammatory bowel disease (Ohashi et al. 2015), our data raise the possibility that effects upon 15‐HETE (and PG) production from macrophages may contribute to the efficacy of PEA in mouse models of this disorder (Esposito et al. 2014).
PEA does not have direct effects upon COX‐2 oxygenation of AA (or 2‐AG)
A direct effect of PEA upon the COX‐2 to change the rate of oxygenation of AA by the enzyme could contribute to the changes in prostaglandin and HETE levels seen in the RAW264.7 cells. Long‐chain fatty acids interact with COX isoenzymes and affect their catalytic activity by binding to the allosteric subunit of the homodimeric enzyme (Yuan et al. 2009; Dong et al. 2011, 2016; Zou et al. 2012). Crystallographic studies suggested that the carboxyl group of palmitic acid binds to Arg120 and Tyr355 of COX‐2 (Dong et al. 2011). Given that PEA lacks this carboxyl group, its interaction, if any, with COX‐2 will be different, and it is thus not surprising that the compound did not modify the catalytic properties of the COX‐2.
One other observation in the present study is worth comment, namely that while untreated RAW264.7 cells have a much lower expression of FAAH than NAAA, the balance is shifted following LPS + IFNγ treatment. In terms of hydrolytic activity, the activated cells have a lower total activity than the control cells, and combined NAAA + FAAH inhibition is required to block the hydrolysis of PEA. Such a change in the relative expression of the two enzymes would suggest that compounds with combined NAAA‐FAAH activity may be superior to selective NAAA (or FAAH) inhibitors when a therapeutic strategy aimed at potentiating macrophage PEA levels is followed.
In conclusion, the present data demonstrate that PEA reduces the levels of PGD2, PGE2, 11‐ and 15‐HETE in cell extracts from LPS + IFNγ‐treated RAW264.7 cells, and that these effects remain in the presence of FAAH + NAAA inhibitors. Direct effects upon the catalytic activity of COX‐2 were not observed under the conditions used. Further studies are required to elucidate the mechanism of action of PEA in LPS + IFNγ‐treated RAW264.7 cells.
Author Contributions
All authors participated in the research design and wrote or contributed to the writing of the manuscript. Gabrielsson, Gouveia‐Figueira, Alhouayek and Fowler conducted experiments and performed data analysis. Häggström developed the statistical script for R given in Appendix S2.
Disclosures
None declared.
Supporting information
Table S1. Primers used in the study. When shown, primer efficiencies were calculated using six sample serial dilutions over a 50‐fold dilution range.
Table S2. Effects of PEA upon oxylipin levels (pmol/well) in LPS + IFNγ‐stimulated RAW264.7 cells
Table S3. Effects of PEA, SEA, palmitic acid (PA) and flurbiprofen (Flur) upon the catalytic properties of COX‐1.
Figure S1. Presence of SEA and OEA, but not AEA, in the stock solutions of PEA used in the experiments.
Figure S2. Effect of PEA and LPS + IFNγ treatment of RAW264.7 cells upon mRNA levels of COX‐1 (Panels A, B) and 15‐LOX (Panels C,D).
Figure S3. Effect of PEA upon normalised levels of A, PGD2; B, PGE2; C, 11‐HETE and D, 15‐HETE in LPS + IFNγ‐treated RAW264.7 cells.
Figure S4. Effects of A, PEA; B, SEA; C, palmitic acid and D, flurbiprofen upon the activity of ovine COX‐1.
Appendix S1. Description of the analytical parameters used for lipid analyses.
Appendix S2. R script for the bootstrapped linear model used in the present study.
Acknowledgements
This work was supported by grants from the Swedish Science Research Council (Grant no. 12158, medicine, to CJF), and the Research Funds of Umeå University Medical Faculty (to CJF).
Gabrielsson L., Gouveia‐Figueira S., Häggström J., Alhouayek M., Fowler C. J.. The anti‐inflammatory compound palmitoylethanolamide inhibits prostaglandin and hydroxyeicosatetraenoic acid production by a macrophage cell line, Pharma Res Per, 5(2), 2017, e00300, doi: 10.1002/prp2.300
References
- Alhouayek M, Muccioli GG (2014). Harnessing the anti‐inflammatory potential of palmitoylethanolamide. Drug Discov Today 19: 1632–1639. [DOI] [PubMed] [Google Scholar]
- Alhouayek M, Bottemanne P, Subramanian KV, Lambert DM, Makriyannis A, Cani PD, et al. (2015). N‐Acylethanolamine‐hydrolyzing acid amidase inhibition increases colon N‐palmitoylethanolamine levels and counteracts murine colitis. FASEB J 29: 650–661. [DOI] [PMC free article] [PubMed] [Google Scholar]
- Attur M, Krasnokutsky S, Statnikov A, Samuels J, Li Z, Friese O, et al. (2015). Low‐grade inflammation in symptomatic knee osteoarthritis: prognostic value of inflammatory plasma lipids and peripheral blood leukocyte biomarkers. Arthritis Rheumatol 67: 2905‐2915. [DOI] [PMC free article] [PubMed] [Google Scholar]
- Benito C, Tolón RM, Castillo AI, Ruiz‐Valdepeñas L, Martínez‐Orgado JA, Fernández‐Sánchez FJ, et al. (2012). β‐Amyloid exacerbates inflammation in astrocytes lacking fatty acid amide hydrolase through a mechanism involving PPAR‐ α, PPAR‐γ and TRPV1, but not CB1 or CB2 receptors. Br J Pharmacol 166: 1474–1489. [DOI] [PMC free article] [PubMed] [Google Scholar]
- Björklund E, Blomqvist A, Hedlin J, Persson E, Fowler CJ (2014). Involvement of fatty acid amide hydrolase and fatty acid binding protein 5 in the uptake of anandamide by cell lines with different levels of fatty acid amide hydrolase expression: a pharmacological study. PLoS ONE 9: e103479. [DOI] [PMC free article] [PubMed] [Google Scholar]
- Cao W, De La Cruz EM (2013). Quantitative full time course analysis of nonlinear enzyme cycling kinetics. Sci Rep 3: 2658. [DOI] [PMC free article] [PubMed] [Google Scholar]
- Cenac N, Bautzova T, Le Faouder P, Veldhuis NA, Poole DP, Rolland C, et al. (2015). Quantification and potential functions of endogenous agonists of transient receptor potential channels in patients with irritable bowel syndrome. Gastroenterology 149: 433–444. [DOI] [PubMed] [Google Scholar]
- Cerrato S, Brazis P, Della Valle MF, Miolo A, Petrosino S, Di Marzo V, et al. (2012). Effects of palmitoylethanolamide on the cutaneous allergic inflammatory response in Ascaris hypersensitive Beagle dogs. Vet J 191: 377–382. [DOI] [PubMed] [Google Scholar]
- Costa B, Conti S, Giagnoni G, Colleoni M (2002). Therapeutic effect of the endogenous fatty acid amide, palmitoylethanolamide, in rat acute inflammation: inhibition of nitric oxide and cyclo‐oxygenase systems. Br J Pharmacol 137: 413–420. [DOI] [PMC free article] [PubMed] [Google Scholar]
- D'Agostino G, La Rana G, Russo R, Sasso O, Iacono A, Esposito E, et al. (2009). Central administration of palmitoylethanolamide reduces hyperalgesia in mice via inhibition of NF‐κB nuclear signalling in dorsal root ganglia. Eur J Pharmacol 613: 54–59. [DOI] [PubMed] [Google Scholar]
- Dong L, Vecchio AJ, Sharma NP, Jurban BJ, Malkowski MG, Smith WL (2011). Human cyclooxygenase‐2 is a sequence homodimer that functions as a conformational heterodimer. J Biol Chem 286: 19035–19046. [DOI] [PMC free article] [PubMed] [Google Scholar]
- Dong L, Zou H, Yuan C, Hong YH, Kuklev DV, Smith WL (2016). Different fatty acids compete with arachidonic acid for binding to the allosteric or catalytic subunits of cyclooxygenases to regulate prostanoid synthesis. J Biol Chem 291: 4069–4078. [DOI] [PMC free article] [PubMed] [Google Scholar]
- Duggleby RG (2001). Quantitative analysis of the time courses of enzyme‐catalyzed reactions. Methods 24: 168–174. [DOI] [PubMed] [Google Scholar]
- Efron B (1987). Better bootstrap confidence intervals. J Am Stat Ass 82: 171–185. [Google Scholar]
- Esposito G, Capoccia E, Turco F, Palumbo I, Lu J, Steardo A, et al. (2014). Palmitoylethanolamide improves colon inflammation through an enteric glia/toll like receptor 4‐dependent PPAR‐ α activation. Gut 63: 1300–1312. [DOI] [PubMed] [Google Scholar]
- Fagerland MW, Sandvik L (2009). The Wilcoxon‐Mann‐Whitney test under scrutiny. Stats Med 28: 1487–1497. [DOI] [PubMed] [Google Scholar]
- Field A, Miles J, Field Z (2012). Discovering statistics using R. Sage Publications Ltd, London. [Google Scholar]
- Gabrielsson L, Mattsson S, Fowler CJ (2016). Palmitoylethanolamide for the treatment of pain: pharmacokinetics, safety and efficacy. Br J Clin Pharmacol 82: 932–942. [DOI] [PMC free article] [PubMed] [Google Scholar]
- Gouveia‐Figueira S, Nording ML (2015). Validation of a tandem mass spectrometry method using combined extraction of 37 oxylipins and 14 endocannabinoid‐related compounds including prostamides from biological matrices. Prostaglandins Other Lipid Mediat 121: 110–121. [DOI] [PubMed] [Google Scholar]
- Gouveia‐Figueira S, Karlsson J, Deplano A, Hashemian S, Svensson M, Fredriksson Sundbom M, et al. (2015). Characterisation of (R)‐2‐(2‐fluorobiphenyl‐4‐yl)‐N‐(3‐methylpyridin‐2‐yl)propanamide as a dual fatty acid amide hydrolase: cyclooxygenase inhibitor. PLoS ONE 10: e0139212. [DOI] [PMC free article] [PubMed] [Google Scholar]
- Hall P, Wilson SR (1991). Two guidelines for bootstrap hypothesis testing. Biometrics 47: 757–762. [Google Scholar]
- Ishida T, Nishiumi S, Tanahashi T, Yamasaki A, Yamazaki A, Akashi T, et al. (2013). Linoleoyl ethanolamide reduces lipopolysaccharide‐induced inflammation in macrophages and ameliorates 2,4‐dinitrofluorobenzene‐induced contact dermatitis in mice. Eur J Pharmacol 699: 6–13. [DOI] [PubMed] [Google Scholar]
- Johnson HG, McNee ML, Sun FF (1985). 15‐Hydroxyeicosatetraenoic acid is a potent inflammatory mediator and agonist of canine tracheal mucus secretion. Am Rev Respir Dis 131: 917–922. [DOI] [PubMed] [Google Scholar]
- Meade EA, Smith WL, DeWitt DL (1993). Differential inhibition of prostaglandin endoperoxide synthase (cyclooxygenase) isozymes by aspirin and other non‐steroidal anti‐inflammatory drugs. J Biol Chem 268: 6610–6614. [PubMed] [Google Scholar]
- Meijerink J, Poland M, Balvers MGJ, Plastina P, Lute C, Dwarkasing J, et al. (2015). Inhibition of COX‐2‐mediated eicosanoid production plays a major role in the anti‐inflammatory effects of the endocannabinoid N‐docosahexaenoylethanolamine (DHEA) in macrophages. Br J Pharmacol 172: 24–37. [DOI] [PMC free article] [PubMed] [Google Scholar]
- Norris PC, Reichart D, Dumlao DS, Glass CK, Dennis EA (2011). Specificity of eicosanoid production depends on the TLR‐4‐stimulated macrophage phenotype. J Leukoc Biol 90: 563–574. [DOI] [PMC free article] [PubMed] [Google Scholar]
- Ohashi W, Hattori K, Hattori Y (2015). Control of macrophage dynamics as a potential therapeutic approach for clinical disorders involving chronic inflammation. J Pharmacol Exp Ther 354: 240–250. [DOI] [PubMed] [Google Scholar]
- Onnis V, Congiu C, Björklund E, Hempel F, Söderström E, Fowler CJ (2010). Synthesis and evaluation of paracetamol esters as novel fatty acid amide hydrolase inhibitors. J Med Chem 53: 2286–2298. [DOI] [PubMed] [Google Scholar]
- Paterniti I, Impellizzeri D, Di Paola R, Navarra M, Cuzzocrea S, Esposito E (2013). A new co‐ultramicronized composite including palmitoylethanolamide and luteolin to prevent neuroinflammation in spinal cord injury. J Neuroinflammation 10: 91. [DOI] [PMC free article] [PubMed] [Google Scholar]
- Petrosino S, Schiano Moriello A, Cerrato S, Fusco M, Puigdemont A, De Petrocellis L, et al. (2016). The anti‐inflammatory mediator palmitoylethanolamide enhances the levels of 2‐arachidonoyl‐glycerol and potentiates its actions at TRPV1 cation channels. Br J Pharmacol 173: 1154–1162. [DOI] [PMC free article] [PubMed] [Google Scholar]
- R Core Team: R (2016). A language and environment for statistical computing. R Foundation for Statistical Computing, Vienna, Austria. ISBN 3‐900051‐07‐0, URL Avaliable at: https://www.R-project.org/accessed (accessed January to December 2016)
- Redlich S, Ribes S, Schütze S, Nau R (2014). Palmitoylethanolamide stimulates phagocytosis of Escherichia coli K1 by macrophages and increases the resistance of mice against infections. J Neuroinflammation 11: 108. [DOI] [PMC free article] [PubMed] [Google Scholar]
- Rome LH, Lands WEM (1975). Structural requirements for time‐dependent inhibition of prostaglandin biosynthesis by anti‐inflammatory drugs. Proc Natl Acad Sci USA 72: 4863–4865. [DOI] [PMC free article] [PubMed] [Google Scholar]
- Ross R, Brockie H, Pertwee R (2000). Inhibition of nitric oxide production in RAW264.7 macrophages by cannabinoids and palmitoylethanolamide. Eur J Pharmacol 401: 121–130. [DOI] [PubMed] [Google Scholar]
- Sasso O, Moreno‐Sanz G, Martucci C, Realini N, Dionisi M, Mengatto L, et al. (2013). Antinociceptive effects of the N‐acylethanolamine acid amidase inhibitor ARN077 in rodent pain models. Pain 154: 350–360. [DOI] [PMC free article] [PubMed] [Google Scholar]
- Sayd A, Antón M, Alén F, Caso JR, Pavón J, Leza JC, et al. (2015). Systemic administration of oleoylethanolamide protects from neuroinflammation and anhedonia induced by LPS in rats. Int J Neuropsychopharmacol 18: pyu111. [DOI] [PMC free article] [PubMed] [Google Scholar]
- Solorzano C, Zhu C, Battista N, Astarita G, Lodola A, Rivara S, et al. (2009). Selective N‐acylethanolamine‐hydrolyzing acid amidase inhibition reveals a key role for endogenous palmitoylethanolamide in inflammation. Proc Natl Acad Sci USA 106: 20966–20971. [DOI] [PMC free article] [PubMed] [Google Scholar]
- Thummel KE, Shen DD, Isoherranen N (2011). Design and optimization of dosage regimes: pharmacokinetic data Pp. 1891–1990 in Brunton LL, Chabner BA. and Knollmann BC, eds. Goodman & Gilman's The Pharmacological Basis of Therapeutics, 12th ed. Appendix II. McGraw Hill, New York. [Google Scholar]
- Vacondio F, Bassi M, Silva C, Castelli R, Carmi C, Scalvini L, et al. (2015). Amino acid derivatives as palmitoylethanolamide prodrugs: synthesis, in vitro metabolism and in vivo plasma profile in rats. PLoS ONE 10: e0128699. [DOI] [PMC free article] [PubMed] [Google Scholar]
- Yuan C, Sidhu RS, Kuklev DV, Kado Y, Wada M, Song I, et al. (2009). Cyclooxygenase allosterism, fatty acid‐mediated cross‐talk between monomers of cyclooxygenase homodimers. J Biol Chem 284: 10046‐10055. [DOI] [PMC free article] [PubMed] [Google Scholar]
- Zou H, Yuan C, Dong L, Sidhu RS, Hong YH, Kuklev DV, et al. (2012). Human cyclooxygenase‐1 activity and its responses to COX inhibitors are allosterically regulated by nonsubstrate fatty acids. J Lipid Res 53: 1336–1347. [DOI] [PMC free article] [PubMed] [Google Scholar]
Associated Data
This section collects any data citations, data availability statements, or supplementary materials included in this article.
Supplementary Materials
Table S1. Primers used in the study. When shown, primer efficiencies were calculated using six sample serial dilutions over a 50‐fold dilution range.
Table S2. Effects of PEA upon oxylipin levels (pmol/well) in LPS + IFNγ‐stimulated RAW264.7 cells
Table S3. Effects of PEA, SEA, palmitic acid (PA) and flurbiprofen (Flur) upon the catalytic properties of COX‐1.
Figure S1. Presence of SEA and OEA, but not AEA, in the stock solutions of PEA used in the experiments.
Figure S2. Effect of PEA and LPS + IFNγ treatment of RAW264.7 cells upon mRNA levels of COX‐1 (Panels A, B) and 15‐LOX (Panels C,D).
Figure S3. Effect of PEA upon normalised levels of A, PGD2; B, PGE2; C, 11‐HETE and D, 15‐HETE in LPS + IFNγ‐treated RAW264.7 cells.
Figure S4. Effects of A, PEA; B, SEA; C, palmitic acid and D, flurbiprofen upon the activity of ovine COX‐1.
Appendix S1. Description of the analytical parameters used for lipid analyses.
Appendix S2. R script for the bootstrapped linear model used in the present study.