Significance
The mammalian master circadian clock, the suprachiasmatic nucleus (SCN), contains a network composed of various neuron types. The SCN network plays critical roles in expressing robust circadian rhythms in physiology and behavior, such as sleep–wake cycles. The molecular clock in individual SCN neurons controls membrane excitability, and sends output signals to various organs. However, how the SCN neurons transmit output signals remains unknown. Using a genetically encoded voltage sensor, we directly measured the circadian rhythms of membrane voltage in the SCN network. Remarkably, the circadian voltage rhythms are synchronous across the entire SCN network, whereas simultaneously recorded Ca2+ rhythms are asynchronous in the dorsal and ventral SCN regions. These results indicate that the SCN network produces coherent output signals.
Keywords: circadian rhythm, membrane potential, intracellular calcium, time-lapse imaging, neuronal network
Abstract
The suprachiasmatic nucleus (SCN), the master circadian clock, contains a network composed of multiple types of neurons which are thought to form a hierarchical and multioscillator system. The molecular clock machinery in SCN neurons drives membrane excitability and sends time cue signals to various brain regions and peripheral organs. However, how and at what time of the day these neurons transmit output signals remain largely unknown. Here, we successfully visualized circadian voltage rhythms optically for many days using a genetically encoded voltage sensor, ArcLightD. Unexpectedly, the voltage rhythms are synchronized across the entire SCN network of cultured slices, whereas simultaneously recorded Ca2+ rhythms are topologically specific to the dorsal and ventral regions. We further found that the temporal order of these two rhythms is cell-type specific: The Ca2+ rhythms phase-lead the voltage rhythms in AVP neurons but Ca2+ and voltage rhythms are nearly in phase in VIP neurons. We confirmed that circadian firing rhythms are also synchronous and are coupled with the voltage rhythms. These results indicate that SCN networks with asynchronous Ca2+ rhythms produce coherent voltage rhythms.
In mammals, daily rhythms in biochemistry, physiology, and behavior are coordinated by the master circadian clock located in the hypothalamic suprachiasmatic nucleus (SCN) in the brain (1). In rats and mice the SCN consists of ∼20,000 neurons, each of which demonstrates self-sustained circadian oscillations (2, 3). In individual SCN neurons, cellular circadian rhythms are generated by an autoregulatory transcriptional and translational feedback loop (core loop) consisting of the clock genes Period (Per) 1, Per2, Cryptochrome (Cry) 1, Cry2, Bmal1, and Clock and their protein products (4). These cellular clocks regulate membrane excitability and define firing patterns in the SCN neurons (5). In vivo and in vitro electrophysiological studies revealed that rhythms in resting membrane potentials and the frequency of action potential firings are high during the subjective day and low during the subjective night (5). Blockade of neuronal firings by tetrodotoxin (TTX) leads to the desynchronization of the SCN network in vitro (6, 7) and behavioral arrhythmicity in vivo (8). These studies indicate that output signals of neuronal firings in the SCN are crucial not only for intercellular communications within the SCN network but also for conveying time cues to synchronize rhythms in the peripheral tissues.
At the network level, bioluminescence and fluorescence imaging revealed the topologically specific patterns of rhythms in the expression of clock genes such as Per1 (6) and PER2 (9) and the intracellular Ca2+ concentration (7) in the dorsal to ventral SCN regions. It has been proposed that there is more than one regional oscillator in the SCN and that within these regional oscillators a group of oscillating neurons synchronize with each other and behave differently from groups in other regional oscillators (10, 11). These groups include the oscillators in the dorsal SCN where arginine-vasopressin (AVP) neurons are abundant and in the ventral SCN where vasoactive intestinal peptide (VIP) neurons predominate (10, 12–15).
To examine how and where different SCN neurons regulate membrane excitability and send output signals, we need to record neuronal activities on a large scale at a single-cell resolution for several days. Conventional electrophysiology techniques, such as patch-clamp recording, allow us to monitor only a few neurons for few hours. Extracellular recordings, such as multiunit activity (16–19) and multielectrode array dish (MED) recordings (20), have limited spatial resolution. Recent advances in Ca2+ imaging methods enable us to record neuronal firing patterns optically in vitro and in vivo (21). However, a subthreshold membrane excitation or depolarizing state that does not change the firing rate is believed to contribute to information processing in the brain (22, 23). Indeed, daily silencing of neuronal firing by SCN neurons has been reported (24). Thus, there is a need to measure membrane potentials in master circadian clock neurons directly.
Over the last 40 y, since an organic voltage probe was first applied in the central nervous system (25), direct optical measurement of membrane potentials has been a goal in neuroscience. However, the voltage probe had drawbacks; its signal was very small compared with that of other probes, such as Ca2+ probes. Nevertheless, the recent improvement in fluorescent protein-based voltage sensors enabled us to record neuronal activities accurately in real time (26, 27). Voltage sensors have the important advantage of being able to be specifically expressed in an individual cell type in the brain for several days. We recently developed high-resolution time-lapse imaging methods to visualize the spatiotemporal dynamics of intracellular Ca2+ in the SCN network for many days without noticeable photo-induced toxicity or bleaching. Thus, all the tools necessary for direct monitoring of membrane potentials are now available.
In this study, we successfully measured the circadian rhythms of membrane voltage in the neurons of cultured SCN using a genetically encoded voltage sensor, ArcLightD (27), and high-resolution confocal imaging microscopy (7, 28). Using RGECO (29), a red Ca2+ indicator, and cell-type specifically expressed ArcLightD, we successfully demonstrated the rhythmic change in membrane voltage and Ca2+ rhythms simultaneously in the SCN network. Unexpectedly, circadian voltage rhythms are synchronous throughout the entire SCN network, whereas Ca2+ rhythms are topologically specific to the dorsal and ventral regions in the same SCN slice. These findings provide an important insight into how the SCN network encodes circadian time in vivo.
Results
Expression Patterns of a Genetically Encoded Voltage Sensor, ArcLightD.
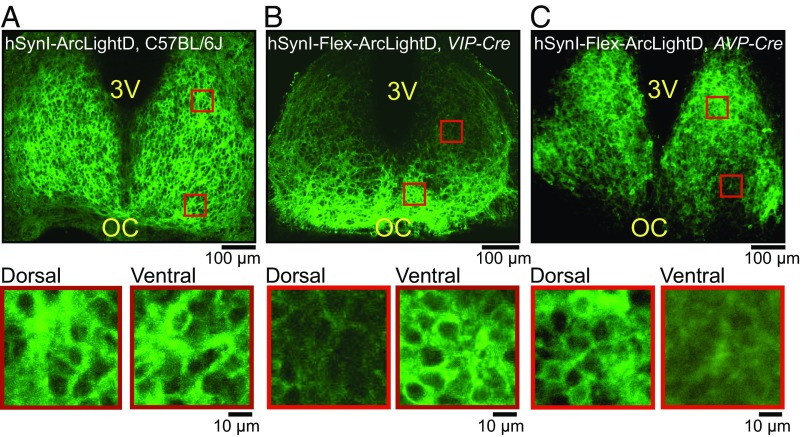
To elucidate the spatiotemporal patterns of membrane potentials in SCN neurons, ArcLightD was transfected in cultured SCN slices of newborn mice [postnatal day (P) 4–6] using a recombinant adeno-associated virus (AAV) under a neuron-specific promoter, human synapsin I (hSynI) (Fig. S1). Fig. 1A shows representative expression patterns of ArcLightD fluorescence in the SCN prepared from C57BL/6J mice. The expression pattern of ArcLightD in the SCN network was distinct from that of the Ca2+ probes, such as Yellow Cameleon 3.60 (7, 28) and GCaMP6s (30). ArcLightD signals were detected in the plasma membrane of soma and fibers (i.e., axon and dendrites) but not in the cytosol or nucleus (Fig. 1A, Lower).
Fig. S1.
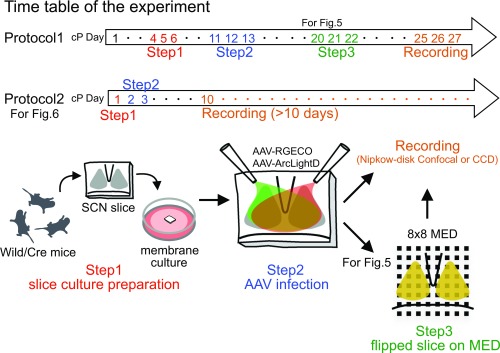
Schema of the experimental procedure. Step 1: The SCN slice was prepared from C57BL/6J or VIP/AVP-Cre newborn mice and was explanted onto a culture membrane. Step 2: Aliquots of the AAV (1 μL) harboring ArcLightD and RGECO were inoculated onto the surface of the SCN cultures. Step 3: The membrane with the cultured SCN slice was cut out, flipped over, and transferred to a glass-bottomed dish (for confocal microscopy) or a MED with 64 electrodes (for CCD imaging). Recording (confocal or CCD) was performed on days cP25–cP27 (Protocol 1) or days cP1–cP10 (Protocol 2).
Fig. 1.
Expression patterns of the voltage probe ArcLightD in the SCN network. Expression patterns of ArcLightD fluorescence in the entire SCN (Upper) and the dorsal/ventral regions (ROIs marked by red squares in the upper panel) (Lower) of the cultured SCN slices from C57BL/6J mice (A), VIP-Cre mice (B), and AVP-Cre mice (C). 3V, third ventricle; OC, optic chiasm.
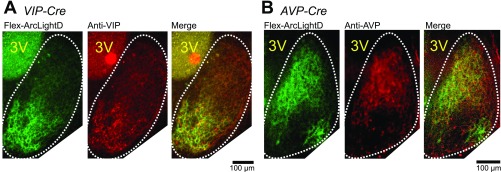
Because ArcLightD is expressed throughout the plasma membrane, including the axon and dendrites, it is difficult to identify the origin of the signals. To overcome this difficulty, the SCN slices from VIP- and AVP-Cre mice were transfected with AAV-encoding hSynI-Flex-ArcLightD. Cell-type–specific expression of ArcLightD allowed us to identify the VIP (Fig. 1B) and AVP (Fig. 1C) neurons separately and to estimate the distribution of fluorescence in dendrites and axons. The VIP neurons whose cell bodies were localized in the ventral SCN sent fibers to the dorsal SCN region (Fig. 1B), whereas the AVP neurons with cell bodies located mostly in the dorsal SCN sent fibers to the entire SCN (Fig. 1C). Cell-type–specific expressions of ArcLightD in the VIP and AVP neurons were confirmed by immunohistochemical staining against VIP and AVP neuropeptides, respectively (Fig. S2).
Fig. S2.
Comparison of Cre-dependent ArcLightD expression and localization of VIP/AVP neuropeptides. (A and B) Expression patterns of Flex-ArcLightD fluorescence of the cultured SCN slices prepared from VIP-Cre mice (A) and AVP-Cre mice (B). Images of ArcLightD fluorescence (Left), AVP and VIP immunopositive signals (Center), and the overlays (Right) are displayed. The estimated border of the SCN is indicated by a white dotted line. 3V, third ventricle.
Simultaneous Recording of Circadian Rhythms in Voltage and Intracellular Calcium.
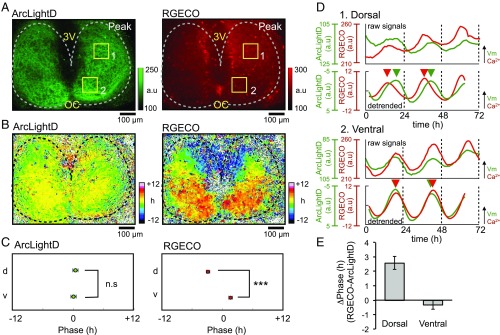
Using ArcLightD together with RGECO, we successfully detected the circadian rhythms in membrane potential (voltage rhythm) and intracellular Ca2+ levels (Ca2+ rhythm) simultaneously in the SCN (Fig. 2). Remarkably, we found that the voltage rhythms were synchronous throughout the entire SCN network. To quantify the rhythms at the level of the SCN network, we created acrophase (peak phase) maps using a pixel-based analysis program as described previously (7, 30, 31). The acrophase maps, expressed relative to the slice mean, showed that the voltage rhythms were nearly in phase throughout the entire SCN region (shown in yellow-green colors) (Fig. 2B, Left). On the other hand, the Ca2+ rhythms were topologically specific, with an advanced phase in the dorsal region (shown in cold colors) and a delayed phase in the center and ventral regions (shown in warm colors) (Fig. 2B, Right), as previously reported (7). We statistically compared the regional difference between representative areas (each 100 × 100 μm) in the dorsal and ventral SCN. The mean acrophase of the voltage rhythm was not significantly different in these areas, indicating that they were synchronous (12.4 ± 0.5 h and 12.0 ± 0.5 h, respectively; n = 6; P = 0.61) (Fig. 2C, Left), whereas the mean acrophase of the Ca2+ rhythm in these areas was significantly different, indicating topological specificity (9.1 ± 0.3 h and 13.6 ± 0.4 h, respectively; n = 6; P < 0.001) (Fig. 2C, Right). We compared the phase difference between the voltage and Ca2+ rhythms in these regions. The Ca2+ rhythm was phase-advanced relative to the voltage rhythms in the dorsal region (2.6 ± 0.4 h) (P < 0.001), but these two rhythms were nearly in phase in the ventral region (−0.3 ± 0.3 h) (P = 0.62) (Fig. 2 D and E).
Fig. 2.
Simultaneous recordings of the voltage and Ca2+ rhythms. (A) Expression patterns of ArcLightD (Left) and RGECO (Right) fluorescence at the peak circadian phase. The estimated border of the SCN is indicated by a dashed line. (B) Acrophase maps of the voltage rhythms (Left) and Ca2+ rhythms (Right). Mean acrophase of the entire SCN regions was separately normalized to zero for voltage and Ca2+ rhythms. Color bars indicate the relative time of day (hours). (C) The mean acrophase of the circadian voltage (Left) and Ca2+ (Right) rhythms from two regions in the SCN (square ROIs in A). For a regional comparison of the rhythms, 100 × 100 μm ROIs in the top third (near the third ventricle) and bottom two-thirds (near the optic chiasma) were selected as the dorsal and ventral regions, respectively. A significant phase difference was detected between the dorsal (d) and ventral (v) regions in the Ca2+ rhythms but not in the voltage rhythms. (D) Raw (Upper) and 24-h detrended (Lower) traces of the voltage rhythms (green traces) and Ca2+ rhythms (red traces) in the dorsal (1) and ventral (2) SCN from the square ROIs in A. The circadian peak is indicated by arrowheads of each color. Detrended data were smoothed with a 3-h moving average method. (E) The phase difference (ΔPhase) between the voltage and Ca2+ rhythms in the dorsal and ventral SCN (six slices). All data are given as the mean ± SEM; ***P < 0.001. a.u., arbitrary units. Note that in all figures the vertical scale bar was inverted because ArcLightD fluorescence indicates that the fluorescence dims upon depolarization of the plasma membrane, reported to be a characteristic feature of ArcLightD (27).
Signal Origin of ArcLightD.
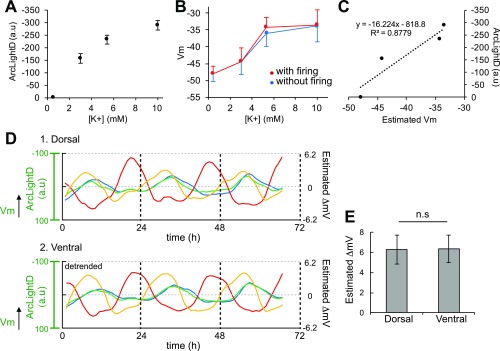
To validate the signal origin and dynamic range of ArcLightD fluorescence in our experimental conditions, we manipulated the membrane potentials of SCN neurons by changing extracellular concentrations of potassium ion (0.5, 0.3, 5.4, and 10 mM KCl), as reported previously (32). We recorded the resting membrane potentials and action potentials by whole-cell patch-clamp recordings from single SCN neurons (23 neurons in six slices) and detected the fluorescence changes in ArcLightD in six SCN slices. We confirmed that ArcLightD reports changes in the membrane potentials with a dynamic range from −50 mV to −30 mV under this condition (Fig. S3). The mean membrane potentials were almost identical with or without firings (Fig. S3B). The estimated range of circadian oscillation was 6.26 ± 1.43 mV in the dorsal region and 6.35 ± 1.36 mV in the ventral region, a difference that was not statistically significant (P = 0.96) (Fig. S3 D and E). We concluded that ArcLightD signals reflect the change in the resting membrane potential, not the firing level.
Fig. S3.
ArcLightD reports a change in membrane potentials. (A) ArcLightD fluorescence changes in the SCN slices under various extracellular KCl concentrations (0.5, 3.5, 5.4, 10 mM); n = 6 slices. (B) Mean membrane potentials (Vm) with (red) and without (blue) neuronal firings in various extracellular KCl concentrations (23 neurons in six slices). (C) Estimated changes in ArcLightD fluorescence plotted against the estimated Vm. (D) The voltage rhythms are shown in fluorescence (left ordinate) and in estimated ΔmV (right ordinate) in the dorsal and ventral SCN regions (100 × 100 μm). Each color trace represents a different slice (n = 4). (E) The estimated amplitude expressed in ΔmV in the dorsal and ventral SCN regions. Note that all data in this figure were taken with same experimental settings (i.e., exposure time, excitation light intensity, EM gain) using an iXon EM-CCD camera (Andor). n.s., statistically not significant.
Cell-Type–Specific Recording of the Voltage Rhythms.
Voltage rhythms in VIP neurons.
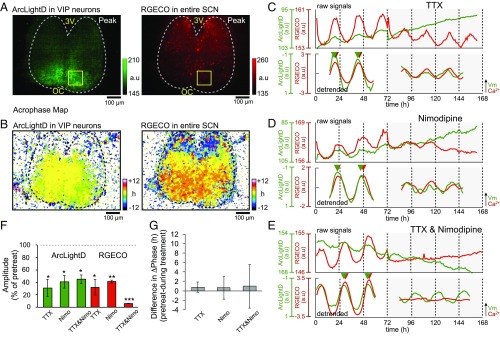
Fig. 3 shows cell-type–specific monitoring of the voltage rhythms in the VIP neurons. The voltage rhythms were detectable mostly in the ventral region and were absent in the dorsal region near the third ventricle (Fig. 3B, Left). They were in phase throughout the SCN. The Ca2+ rhythms, monitored in entire SCN neurons by RGECO, were localized across the dorsal to the ventral SCN (Fig. 3B, Right), as reported previously (7, 30). The voltage and Ca2+ rhythms in the ventral SCN were nearly in phase (−0.6 ± 0.3 h, n = 9 slices).
Fig. 3.
Spatiotemporal profiles of the voltage and Ca2+ rhythms in VIP neurons. (A) Expression patterns of ArcLightD in the VIP neurons (Left) and RGECO in the entire SCN (Right). (B) Acrophase maps of the voltage rhythms (Left) and the Ca2+ rhythms (Right). Mean acrophase of the entire SCN regions was separately normalized to zero for voltage and Ca2+ rhythms. (C–E) Representative circadian voltage rhythms (green traces) and Ca2+ rhythms (red traces). The upper and lower traces in each panel show raw and 24-h detrended data (smoothed with a 3-h moving average), respectively. (C) Fast Na+ channel blocker (1 μM TTX) (n = 3). (D) l-type Ca2+ channel blocker (3 μM nimodipine) (n = 3). (E) Coapplication of the fast Na+ channel blocker (1 μM TTX) and the l-type Ca2+ channel blocker (3 μM nimodipine) (n = 3). (F) Mean amplitudes of the Ca2+ and voltage rhythms after application of the respective channel blockers expressed as the percent of the pretreatment level. A one-sample t test was used to validate the blocker effects. (G) Phase differences (ΔPhase) between the voltage and Ca2+ rhythms after application of the respective channel blockers (n = 3 in each condition). A paired t test was used to validate the blocker effects. *P < 0.05; **P < 0.01; ***P < 0.001. All data are given as the mean ± SEM.
To examine the roles of the SCN neural network in the circadian ArcLightD and RGECO rhythms, we tested the effects of blockers for voltage-dependent fast Na+ and Ca2+ channels. The amplitude of the circadian rhythms in terms of a peak–trough difference was compared before (pretreatment) and after the drug application. To confirm the circadian rhythmicity, the fluorescence signals were fitted to a cosine curve using a least-square regression method, and the goodness of fit was statistically evaluated (P < 0.001 by percent rhythm).
Each blocker differentially affected the amplitude of the two rhythms. A fast Na+ channel blocker, TTX (1 μM), reduced the amplitudes of the voltage rhythms (30.8 ± 13.7% of the pretreatment level; P = 0.037) and of Ca2+ rhythms (32.1 ± 12.4% of the pretreatment level; P = 0.032) in the VIP neurons (n = 3 slices). However, the voltage and Ca2+ levels still exhibited statistically significant circadian rhythms even after TTX treatment (Fig. 3 C and F). These results indicate the presence of circadian voltage and Ca2+ rhythms independent of neuronal firings in VIP neurons.
Ca2+ channels are known to contribute to the membrane potential (32–35). Particularly, l-type Ca2+ channels are reported to be the primal Ca2+ source in the SCN (34, 36). Indeed, we found that an l-type Ca2+ channel blocker, nimodipine (3 μM), significantly suppressed both the voltage rhythms (40.9 ± 10.2% of the pretreatment level; P = 0.028) and Ca2+ rhythms (41.2 ± 2.2% of the pretreatment level; P = 0.0014) (n = 3 slices) (Fig. 3 D and F). A blocker mixture of TTX and nimodipine greatly suppressed the amplitude of the Ca2+ rhythms (6.1 ± 0.2% of the pretreatment level; P < 0.001), but the effect was less profound in the voltage rhythms (45.0 ± 7.1% of the pretreatment level; P = 0.016) (n = 3 slices) (Fig. 3 E and F). These results indicate that fast Na+ channels and l-type Ca2+ channels contribute additively to the Ca2+ rhythms, but the two channels contribute redundantly to the voltage rhythms. These findings suggest that the voltage rhythms are independent of the Ca2+ rhythms in the VIP neurons.
We then analyzed the effects of blockers on the phase relationship in the VIP neurons. Phase differences between the Ca2+ and voltage rhythms were unchanged after the application of TTX (0.8 ± 0.5 h, P = 0.24) (n = 3 slices) or nimodipine (0.6 ± 1.1 h, P = 0.61) (n = 3 slices). However, they became more variable after coapplication of TTX and nimodipine (1.0 ± 4.6 h, P = 0.85) (n = 3 slices) (Fig. 3G).
Voltage rhythms in AVP neurons.
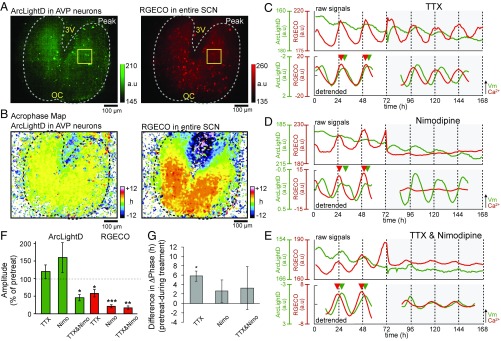
We conducted the same series of experiments in the AVP neurons (Fig. 4). As shown in Fig. 1C, the cell bodies of the AVP neurons located in the dorsal SCN sent fibers to the entire SCN, including the ventral region. We found that the voltage rhythms of the AVP neurons were synchronous in large areas of the SCN. RGECO expressed in the entire SCN revealed that the Ca2+ rhythms were topologically specific in the dorsal to ventral SCN (Fig. 4B, Right). The Ca2+ rhythms were phase-advanced relative to the voltage rhythms, and the phase difference between the two rhythms was 3.1 ± 0.5 h in the AVP neurons (n = 9 slices).
Fig. 4.
Spatiotemporal profiles of the voltage and Ca2+ rhythms in AVP neurons. (A) Expression patterns of ArcLightD in the AVP neurons (Left) and RGECO in the entire SCN (Right). (B) Acrophase maps of the voltage rhythms (Left) and the Ca2+ rhythms (Right). Mean acrophase of the entire SCN regions was separately normalized to zero for voltage and Ca2+ rhythms. (C–E) Representative circadian voltage rhythms (green traces) and Ca2+ rhythms (red traces). (C and D) Application of 1 μM TTX (n = 3) (C) or 3 μM nimodipine (n = 3) (D). (E) Coapplication of TTX (1 μM) and nimodipine (3 μM) (n = 3). (F) Mean amplitudes of the Ca2+ and voltage rhythms after application of the respective channel blockers expressed as the percentage of the pretreatment level. A one-sample t test was used to validate the blocker effects. (G) Differences in phase (ΔPhase) between the voltage and Ca2+ rhythms after the application of the respective channel blockers (n = 3 in each condition). A paired t test was used to validate the blocker effects. *P < 0.05; **P < 0.01; ***P < 0.001. All data are given as the mean ± SEM.
Application of 1 μM TTX significantly reduced the amplitude of the Ca2+ rhythms (58.5 ± 10.9% of the pretreatment amplitude, P = 0.032) but did not change the amplitude of the voltage rhythms (119.8 ± 20.0%; P = 0.39) (n = 3 slices) (Fig. 4 C and G). Similarly, nimodipine (3 μM) reduced the amplitude of the Ca2+ rhythms (41.2 ± 2.2%; P < 0.001) but did not change the amplitude of the voltage rhythms (159.9 ± 42.8%; P = 0.26) (n = 3 slices) (Fig. 4D). Coapplication of TTX and nimodipine reduced the amplitude of both Ca2+ rhythms (17.5 ± 4.8%, P = 0.0034) and voltage rhythms (45.5 ± 9.0%; P = 0.026) (n = 3 slices) (Fig. 4D). These results indicate that the Ca2+ rhythms were mediated by the activation of fast Na+ and l-type Ca2+ channels in the AVP neurons, whereas the voltage rhythms were mediated by a TTX- and nimodipine-insensitive mechanism. The suppression of the voltage rhythms by coapplication of TTX and nimodipine could be caused by the reduced inputs from the damped VIP rhythms (Fig. 3F). The phase differences between the Ca2+ rhythms and voltage rhythms were unchanged on the first cycle (4.2 ± 1.7 h; P = 0.13) but were changed significantly on the second cycle (5.8 ± 1.1 h; P = 0.03) after TTX application (n = 3 slices). On the other hand, the application of nimodipine (2.6 ± 2.4 h; P = 0.39) (n = 3 slices) or the coapplication TTX and nimodipine (3.2 ± 4.6 h; P = 0.55) (n = 3 slices) did not change the phase difference (Fig. 4G).
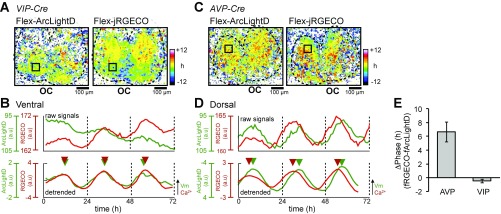
We confirmed these findings by double transfection of AAVs encoding hSynI-Flex-ArcLightD and hSynI-Flex-jRGECO (37) in the SCN from VIP-Cre and AVP-Cre mice. The circadian Ca2+ rhythms were in phase with the voltage rhythms in the VIP neurons (−0.5 ± 0.3 h; n = 3 slices) (Fig. S4 A and B) but were phase-advanced by 6.6 ± 1.4 h (n = 3 slices) relative to the voltage rhythms in the AVP neurons (Fig. S4 C and D).
Fig. S4.
The voltage and Ca2+ rhythms in VIP and AVP neurons. Using two Flex-AAVs, both ArcLightD and jRGECO are expressed only in the VIP neurons (A and B) or AVP neurons (C and D). (A) Acrophase maps of the voltage rhythms (Left) and Ca2+ rhythms (Right) in the VIP neurons. The mean acrophase of the entire SCN regions is separately normalized to zero for voltage and Ca2+ rhythms. (B) Raw (Upper) and 24-h detrended (Lower) traces of the voltage rhythms (green traces) and Ca2+ rhythms (red traces). Triangles indicate the peak phase of each rhythm. (C) Acrophase maps of the voltage rhythms (Left) and Ca2+ rhythms (Right) in the AVP neurons. (D) Raw (Upper) and 24-h detrended (Lower) traces of the voltage rhythms (green traces) and Ca2+ rhythms (red traces). Traces were taken from the square ROIs in C. (E) Phase difference (ΔPhase) between voltage and Ca2+ rhythms in the AVP (n = 4) and VIP (n = 3) neurons. OC, optic chiasm. Data are given as the mean ± SEM.
Simultaneous Recording of the Voltage and Firing Rate Rhythms.
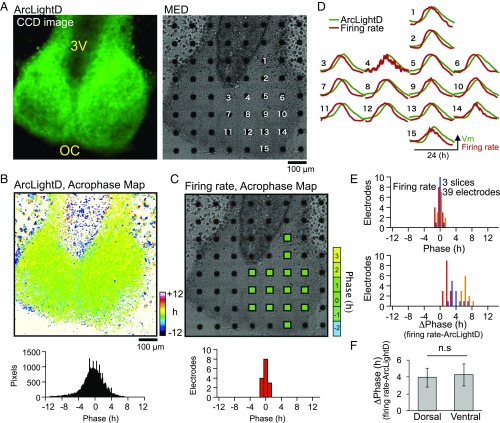
To verify the synchronization of the voltage rhythms in the SCN, we performed simultaneous recordings of ArcLightD and neuronal firing using a MED with 8 × 8 planar electrodes (each, 20 × 20 μm) (Fig. 5). The cultured SCN slice transfected with AAV encoding hSynI-ArcLightD was flipped over and placed on the MED probe (Fig. S1, Protocol 2). ArcLightD signals were measured by a highly sensitive CCD camera mounted on an upright microscope, and multiunit spontaneous firings were measured by the MED system.
Fig. 5.
Spatiotemporal profiles of the firing and voltage rhythms. (A) Images of ArcLightD fluorescence (Left) and of MED in brightfield (Right). (B) An acrophase map of the voltage rhythm (Upper) and a phase distribution histogram (Lower). (C) Acrophase of the firing rhythm (Upper) mapped on each electrode covering the right SCN and the phase distribution histogram (Lower). (D) Representative circadian voltage rhythms (green traces) and firing rhythms (red traces). Data were detrended by 24-h moving average subtraction and were normalized relative to the peak amplitude. (E) Histograms of the acrophase of firing rhythm (Upper) and the phase difference (ΔPhase) between the two rhythms (Lower) examined in the ROIs covering each electrode (three slices, 39 electrodes). The colored columns represent three individual experiments. (F) The phase difference (ΔPhase) between the voltage and firing rhythms in the dorsal and ventral regions. All data are given as the mean ± SEM; n.s., statistically not significant.
The voltage and firing rhythms were analyzed in 20 × 20 μm regions of interest (ROIs) on each MED electrode. A typical example is shown in Fig. 5D. The distribution of acrophase on pixel or ROI level was unimodal in the respective voltage and firing rhythm, indicating synchronization of the circadian rhythms throughout the SCN (Fig. 5 B and C). We analyzed the phase relationship between the firing and voltage rhythms in 39 electrodes (three slices) and found that the firing rhythms were significantly phase-advanced (by 3.9 ± 0.3 h) relative to the voltage rhythms (Fig. 5E, Lower). There was no significant regional difference in phase difference between the dorsal (4.1 ± 0.5 h) and ventral (3.8 ± 0.4 h) SCN regions (P = 0.644) (Fig. 5F). Together, these results indicate that the voltage and firing rhythms are synchronous throughout the entire SCN network and are coupled to each other with a phase difference of ∼4 h.
Voltage and Ca2+ Rhythms During Development.
Previously, we observed that ∼10% of MED electrodes demonstrated firing rhythms that were antiphasic to the majority rhythms (38, 39). However, the firing rhythms were synchronous in all MED electrodes in the present study. Because the SCN slices in this study were cultured for longer periods of time than in previous studies, we tested the possibility of developmental changes in the SCN network for synchronization.
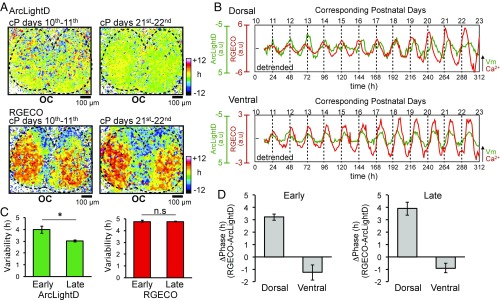
To this end, we performed simultaneous recordings of the voltage and Ca2+ rhythms for more than 10 d starting at an early developmental stage (Fig. 6). The SCN slice was prepared from mice at day P1. Entire SCN neurons were transfected with two AAVs, one encoding ArcLightD and the other RGECO, on days P2 and P3, and confocal recordings were started 1 wk later, on corresponding (cP) day 10 (Fig. S1, Protocol 2). We found that the topological patterns of the voltage and Ca2+ rhythms in the SCN were similar in both the early and late recording stages (Fig. 6A) (n = 6 slices). However, judging from the SD, the voltage rhythms were more synchronized at the late stage (SD = 3.0 ± 0.1 h) (days cP21–22) than at the early stage (SD = 4.0 ± 0.3 h) (days cP10–11) (P = 0.038) (Fig. 6C). By contrast, the Ca2+ rhythms were not significantly different between the early (4.7 ± 0.1 h) and late (4.8 ± 0.03 h) stages (P = 0.87) (Fig. 6C). We calculated the phase difference between the voltage and Ca2+ rhythms separately in the dorsal (3.2 ± 0.2 h vs. 3.9 ± 0.5 h) and ventral SCN (−1.3 ± 0.6 h vs. −0.9 ± 0.4 h) at both the early and late stage and found no significant regional difference between the two stages (Fig. 6D). These results indicate that the coherence of voltage rhythms, but not of the Ca2+ rhythms, is developmentally regulated in the SCN.
Fig. 6.
Long-term recording of the voltage and Ca2+ rhythms. (A) Acrophase maps of the voltage rhythm (Upper) and Ca2+ rhythm (Lower) at the early stage (days cP10–cP11) (Left) and the late stage (days cP21–cP22) (Right) of long-term recording. The mean acrophase of the entire SCN regions was separately normalized to zero for voltage and Ca2+ rhythms. (B) Time course of the voltage rhythms (green traces) and Ca2+ rhythms (red traces) in the dorsal (Upper) and ventral (Lower) regions during 13 d of recording. (C) Network synchronization of the voltage (Left) and Ca2+ (Right) rhythms at the early and late stages of the recordings. The variability of network synchrony is represented by the acrophase SD. (D) Phase difference (ΔPhase) between voltage and Ca2+ rhythms in the dorsal and ventral SCN at the early (Left) and late (Right) stages of the recording (n = 5). *P < 0.05. Data are given as the mean ± SEM.
Discussion
In the present study, we found cell-type–specific couplings of circadian rhythms, the synchronous circadian voltage rhythms as well as the firing rhythms in the entire SCN, despite topologically specific Ca2+ rhythms. We also found that ion channel blockers had differential effects on the amplitude of voltage and Ca2+ rhythms in the AVP neurons but not in the VIP neurons. These findings are explained by assuming an interaction between an intrinsic cellular oscillation and the inputs from the SCN neural network.
Cell-Type Specificity of the Circadian Functions.
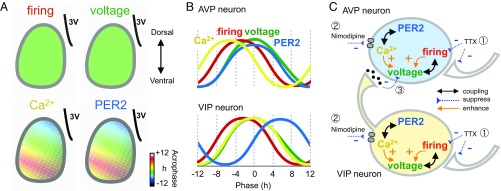
Circadian rhythms in the expression of clock genes, such as Per1 and Per2, have been reported to have topological patterns similar to those of Ca2+ rhythms (6, 7); thus the rhythms in Ca2+ and clock gene expression and the rhythms in voltage and firing behave similarly (Fig. 6A). These results imply that SCN neurons have two functionally coupled oscillatory components: One is composed of the voltage and neuronal firing rhythms, and the other is composed of Ca2+ and PER2 rhythms. These two oscillatory components might interact directly or through the core molecular loop for circadian oscillation. The phase relationship of the circadian PER2 and Ca2+ rhythms is not different in VIP and AVP neurons, and the same is true for the circadian voltage and firing rhythms. However, the phase relationship between the former component and the latter was substantially different in the two neurons (Figs. 2D, 3G, and 4G). Because the voltage rhythms were synchronous throughout the entire SCN, the cell-specific difference is ascribed to the oscillatory component of circadian Ca2+ and PER2 rhythms. Interestingly, TTX changed the phase relationship between the two components in the AVP neurons (Fig. 4G), suggesting that the SCN neural network is involved in the coupling between them. TTX did not affect the coupling in the VIP neurons (Fig. 3G). As a result, the phase relationship of two oscillatory components was changed between the AVP and VIP neurons. The findings are consistent with our previous report that TTX desynchronizes the circadian Ca2+ rhythms between the dorsal and ventral regions of the SCN (7).
Signal Origin of the Voltage Rhythm.
The voltage rhythms were synchronous throughout the entire SCN (Fig. 1). The finding is unique in the face of regional differences in the circadian phase of other measures such as clock gene expression in the SCN (3). In this study, we used pixel-level analysis using time-series CCD images (7, 30, 40). Each pixel size is smaller than the average size of the cell body of a single SCN neuron. We are not able to exclude the possibility that some pixels represent the soma of a certain cell and other pixels represent the processes of different cells. However, such compartmentalization cannot explain the synchrony of the voltage rhythms throughout the entire SCN (Fig. 2B). We showed the synchronization of the voltage rhythms in the same group of SCN neurons (Figs. 3B and 4B), including the regions where the somas and processes exist intermixed (Fig. 1 B and C and Fig. S2).
The dendrite is known as the major target of synaptic inputs in a variety of neurons. The voltage changes in the dendrites propagate in the process and soma within a few second, based on the cable properties of the dendrite (41, 42). The synchrony of voltage rhythm throughout the SCN might be caused by a rapid propagation of a subcellular voltage change.
Neural Network and Intracellular Couplings of Circadian Rhythms.
Application of the channel blockers for either fast Na+ or l-type Ca2+ channels reduced the amplitude of both the Ca2+ and voltage rhythms in the VIP neurons but only diminished the amplitude of the Ca2+ rhythm in the AVP neurons. The amplitude of the circadian voltage rhythm in the AVP neurons persisted without damping. The neuron-specific differences suggest the impairment of a specific pathway from the intrinsic circadian oscillation to both overt rhythms and/or desynchrony among cellular rhythms rather than a loss of cell-intrinsic rhythms in particular types of neurons. In addition, a significant change in the phase difference between the Ca2+ and voltage rhythms indicates desynchrony between them and suggests that the two circadian rhythms are regulated by different mechanisms or at least through different pathways from the core molecular loop of circadian oscillation in the AVP neurons.
According to the theory of a multioscillator system (43), the phase of an intrinsic cellular circadian oscillation is affected by but is not completely in phase with the system oscillation in which the cell involved. The circadian voltage and firing rhythms may represent the system oscillation in the SCN, and the circadian Ca2+ and PER2 rhythms may represent the intrinsic cellular oscillation. Interruption of the inputs from the neural system by TTX may release the intrinsic oscillation from the impact of system oscillation to change the characteristics of cellular oscillation. The present findings are adequately explained by this theory.
Possible Mechanisms of Intra- and Intercellular Couplings.
Based on the present findings, we advanced a model in which the cell-type specificity of circadian rhythms is explained by asymmetric impacts from the VIP to AVP neurons. In this model, the SCN neural network differentially influences the two oscillatory cell components in which the voltage and Ca2+ rhythms are involved separately (Fig. 7C). The notion is based on the differential effects of TTX and nimodipine on the amplitude of voltage rhythms in the two neuron groups (Figs. 3F and 4F). The neural network sensitive to TTX or nimodipine has a much greater influence on the Ca2+ rhythms than on the voltage rhythms in the AVP neurons. In the SCN, neuronal firings and Ca2+ conductance contribute the membrane potential (34, 36). TTX blocks fast Na+ channels and neuronal firings, and it also suppresses the neuronal inputs from network (Fig. 7 C, 1). Nimodipine inhibits l-type Ca2+ channels, thus suppressing Ca2+ and voltage rhythms in the AVP and VIP neurons (Fig. 7 C, 2). Inhibition of either fast Na+ or l-type Ca2+ channels enhances the amplitude of the voltage rhythm in AVP neurons, probably by disinhibiting the coupling from the VIP to AVP neurons (Fig. 7 C, 3). Alternatively, other ion channels, such as the calcium-activated BK potassium channel (5, 44, 45), which is more abundant in the AVP neurons than in the VIP neurons, might be involved. Suppression of rhythm amplitude may weaken the coupling between the two oscillatory components, thereby changing the phase relationship of the rhythms. Another possible explanation is a change in the threshold for generating neuronal firings by modulating the ion channel activation or inactivation.
Fig. 7.
Summary schema of the spatiotemporal profiles and cell-type specificity of the circadian rhythms. (A) Spatial patterns of the circadian firing, voltage, Ca2+, and PER2 rhythms. Acrophases are schematically shown in pseudocolor with the mean phase of the entire slice set to 12 h. (B) Estimated temporal orders of the circadian rhythms in the AVP (Upper) and VIP (Lower) neurons. (C) Schematic drawing for the functional links between the two oscillating cell components and between the VIP and AVP neurons. Nerve terminals on the right represent inputs from the SCN networks. Double-headed arrows indicate the stable phase relationship of the two functions suggesting strong coupling. Arrows indicate the direction of the effect. Plus and minus signs denote enhancement and suppression effects, respectively, and numbers within circles (①–③) show the effects of blockers (Discussion for details).
The firing rhythms phase-lead the voltage rhythms by nearly 4 h. This lead is not predictable from the experiments in molluscan clock neurons (46) or the Hodgkin–Huxley model in neurons. The maximum level of depolarization was associated with a decline in the firing rate. Depolarization block is a possible explanation of this phase difference but is unlikely, considering that the estimated amplitude of the voltage rhythm was as small as 6.3 mV on average (Fig. S3). Unknown circadian mechanisms, such as activation of a calcium-activated BK-type potassium channel and a change in action potential threshold might account for this phenomenon.
Developmental Regulation of the Voltage Rhythms.
We found that the voltage rhythms became coherent during the course of recordings (Fig. 6), possibly as the result of the maturation of the SCN network during the development. To support this idea, we recently found VIP and AVP signaling differentially integrated in the SCN neural network during development (40). It is worth noting that the amplitude of the voltage and Ca2+ rhythms became larger during culturing. Rhythm amplitude could be reinforced by intercellular coupling during development. Coherent and robust voltage rhythms would lead to stable output signals and ultimately would sustain coherent and robust rhythms in animal behaviors. The function is of special importance in maintaining activity–rest cyclicity under perturbing influences such as transmeridian flights and extreme photoperiods.
Physiological Roles of Differentially Phased Voltage and Ca2+ Rhythms.
The physiological roles of the synchronous voltage and asynchronous Ca2+ rhythms are unknown, but it is surmised that the SCN uses two rhythms differentially for the circadian clockwork: the voltage rhythms for uniform sensitivity to environmental stimulation and the Ca2+ rhythms for the regional-specific responses.
Previously, in vivo recording using stationary electrodes showed that the peak phase of the firing rhythms was similar in the dorsal and ventral SCN (16). Furthermore, a fixed phase relationship between Per1 and firing rate has been reported in the SCN slices; however, the spatial pattern and regional specificity were not reported (47). On the other hand, differential responses in the firing and Per1 rhythms to a shifted light–dark cycle have been reported both in vivo and in vitro (18). The phase shift was large and persistent in the Per1 rhythm but was transient in the firing rhythm in vitro. The SCN network may keep the sensitivity of circadian clock through the circadian voltage rhythm and respond rapidly to environmental stimulation through the Ca2+ rhythms. Further studies will be required to clarify the physiological roles of the synchronous voltage rhythms in the SCN.
Materials and Methods
Animal Care.
C57BL/6J mice (Clea Japan), AVP-Cre mice (12), and Viptm1(cre)Zjh/J mice (Jackson Laboratory) on the C57BL/6J background were used for the experiments. Mice were born and bred in our animal quarters under controlled environmental conditions (temperature: 22 ± 2 °C, humidity: 60 ± 5%, 12-h light/12-h dark, with lights on from 0600 to 1800 h). Light intensity was around 100 lx at the cage surface. The mice were fed commercial chow and tap water ad libitum. Experiments were conducted in compliance with the rules and regulations established by the Animal Care and Use Committee of Hokkaido University under the ethical permission of the Animal Research Committee of Hokkaido University (approval no. 15-0153).
SCN Slice Culture.
Mice were decapitated in the middle of the light phase. The brains of neonate (1-d-old or 4- to 6-d-old) male and female mice were removed rapidly and dipped in an ice-cold balanced salt solution comprising 87 mM NaCl, 2.5 mM KCl, 7 mM MgCl2, 0.5 mM CaCl2, 1.25 mM NaH2PO4, 25 mM NaHCO3, 25 mM glucose, 10 mM Hepes, and 75 mM sucrose. A 200-μm coronal brain slice containing the mid rostrocaudal region of the SCN was carefully prepared using a vibratome (VT 1200; Leica). The bilateral SCNs were dissected from the slice using a surgical knife and were explanted onto a culture membrane (Millicell CM; pore size, 0.4 μm; Millipore) in a 35-mm Petri dish containing 1.0 mL of DMEM (Invitrogen) and 5% FBS (Sigma-Aldrich). Before the recordings, the membrane containing the cultured SCN slice was cut out, flipped over, and transferred to glass-bottomed dishes (35 mm, No. 1-S; AGC Techno Glass) or MED probes (20 × 20 μm) that were collagen coated (Cellmatrix type 1-C, Nitta Gelatin; Wako) and supplemented with 180−250 μL DMEM containing 5% supplement solution. MED dishes were sealed with O2-permeable filters (High-Sensitivity Membrane Kit; YSI) using silicone grease compounds (SH111; Dow Corning Toray).
AAV-Mediated Gene Transfer into SCN Slices.
Aliquots of the AAV (1 μL) harboring hSyn1-jRGECO1 (37), hSyn1-ArcLightD, hSyn1-Flex-ArcLightD (produced by the University of Pennsylvania Gene Therapy Program Vector Core), and custom-made Elongation Factor 1 (EF1) α-RGECO were inoculated onto the surface of the SCN cultures on day 4–6 of culture (Protocol 1) or on day 2 of culture (Protocol 2) (Fig. S1). When multiple sensors were transfected in the SCN, AAVs were transfected on two subsequent days. Infected slices were cultured further for at least 14 d before confocal imaging (Protocol 1) or for 7 d before CCD/MED imaging (Protocol 2) (Fig. S1). The titers of hSyn1-jRGECO1, hSyn1-ArcLightD, and hSyn1-Flex-ArcLightD vector were 1.1 × 10¹³, 2.4 × 10¹³, and 1.2 × 10¹³ genome copies/mL, respectively.
To make AAV encoding EF1α-RGECO, the AAV-2 inverted terminal repeat (ITR)-containing plasmid pAAV-EF1α-DIO-hChR2(H134R)-EYFP (provided by K. Deisseroth, Stanford University, Stanford, CA) was modified to construct pAAV-EF1α-RGECO1 by replacing DIO-hChR2(H134R)-EYFP cDNA with the RGECO1 cDNA fragment from the plasmid CMV-RGECO1 (provided by T. Nagai, Osaka University, Osaka). AAV-RGECO with a mutant form of the AAV-2 cap gene (provided by A. Srivastava, University of Florida, Gainesville, FL) (48) was produced using a triple-transfection, helper-free method and was purified as described previously (49). The titer of RGECO vector was 9.8 × 10¹² genome copies/mL.
High-Resolution Confocal Imaging of ArcLightD and RGECO.
Fluorescence images were captured at an exposure of 2–5 s. Images of 100-μm depth in the z axis were obtained at 2-μm z-steps. The imaging system was composed of a Nipkow spinning disk confocal microscope (X-Light; Crest Optics), a NEO sCMOS CCD camera (2,560 × 2,160 pixels, 0.325-μm resolution) (Andor Technology) or an iXon3 EM-CCD camera (1,024 × 1,024 pixels, 0.8125-μm resolution) (Andor Technology), a Ti-E inverted microscope (Nikon), Plan Apo VC dry objectives (20×, 0.75 NA) (Nikon), a TIXHB box incubator (Tokai-hit), and MetaMorph software (Molecular Devices). ArcLightD was excited by cyan color (475/28 nm) with an LED light source (Spectra X Light Engine; Lumencor, Inc.), and the fluorescence was visualized with 495-nm dichroic mirror and 550/49-nm emission filters (Semrock). RGECO/jRGECO was excited by green color (542/27 nm), and the fluorescence was visualized with 593-nm dichroic mirror and 630/92-nm emission filters (Semrock). Expression patterns of ArcLightD fluorescence were visualized using confocal laser-scanning microscopy (1,024 × 1,024 pixels) (A1R-FN1; Nikon). All experiments were performed at 36.5 °C and 5% CO2.
Simultaneous Recording of the ArcLightD and Spontaneous Firing.
The SCN slice was cultured in 100% air at 36.5 °C on an MED probe with 64 electrodes (20 × 20 μm) arranged in an 8 × 8 grid with a distance of 100 μm between electrodes. Before the recording, the MED dish was placed in a mini-incubator installed on the stage of a microscope (Eclipse 80i; Nikon). ArcLightD fluorescence and spontaneous firing were recorded simultaneously while culturing in culture medium. Fluorescence was recorded with a cooled CCD camera at −80 °C (ImagEM; Hamamatsu Photonics) every 60 min with an exposure time of 2–3 s. ArcLightD was excited with an LED light (Light Engine; Lumencor, Inc.) at cyan color (475/28 nm), and the fluorescence was visualized with 495-nm dichroic mirrors and 520/35-nm emission filters (Semrock).
Patch-Clamp Recordings.
Whole-cell patch-clamp recordings were made from cultured SCN slice neurons. Neurons were visualized with a 60× water-immersion objective lens (LumPlanFL N, 1.0 NA; Olympus) using an upright microscope (BX50WI; Olympus) equipped with infrared/differential interference contrast systems and an EM-CCD camera (ImagEM; Hamamatsu Photonics) and a spinning disk confocal unit (CSU10; Yokogawa Electric). The whole-cell electrodes (resistance of 5–7 MΩ) were fabricated from borosilicate capillaries (GD-1.5; Narishige Scientific Instruments) and were pulled on a micropipette puller (Sutter Instrument). Whole-cell current clamp recordings were made with an internal solution containing the following: 140 mM K-gluconate, 4 mM KCl, 0.2 mM MgCl2, 10 mM Hepes, 0.2 mM EGTA, 2 mM MgATP, 0.2 mM NaGTP, adjusted to pH 7.3 with KOH. Slices were continuously superfused with a physiological recording solution containing the following: 0.81 mM MgSO4, 5.36 mM KCl, 0.44 mM KH2PO4, 1.26 mM CaCl2, 136.9 mM NaCl, 0.34 mM Na2HPO4, 4.17 mM NaHCO3, and 5.55 mM d-glucose, at flow rates of 2–3 mL/min. All experiments were performed at 32 °C. Responses were recorded using a MultiClamp700B amplifier, Digidata 1550A, and pClamp10.5 (Molecular Devices), filtered at 10 kHz, and digitized at 10 kHz. For validation of ArcLightD signals, current-clamp recordings were obtained in solutions containing 0.5, 3, 5.36, and 10 mM KCl. Mean membrane potentials were calculated using 1-s data from individual cells.
Immunohistochemistry.
The SCN slices expressing ArcLightD were incubated in DMEM containing 50 μg/mL colchicine for 24 h and were fixed with 4% paraformaldehyde in 0.1 M PBS for 60 min at room temperature. Nonspecific antibody binding was blocked by 60-min incubation with skim milk at room temperature. For labeling AVP and VIP neurons, the SCN slices were stained using mouse anti-AVP monoclonal antibody (generous gift of H. Gainer, NIH/National Institute of Neurological Disorders and Stroke, Bethesda) (1:1,000 dilution) and rabbit anti-VIP polyclonal antibody (1:10,000 dilution; Peptide Institute), respectively. Two days later, Alexa 594-conjugated goat IgG (1:200 dilution; Invitrogen) was used as the secondary antibody for mouse IgG (AVP) and rabbit IgG (VIP). The slices were mounted on a glass-bottomed dish with Prolong Gold-DAPI (Invitrogen). Fluorescence was visualized using an iXon3 Nipkow spinning disk confocal and EM-CCD camera (Andor Technology) and MetaMorph software (Molecular Devices).
Data Analysis and Statistics.
Statistical analyses were performed using Prism GraphPad (GraphPad Software). The group mean was presented as the mean ± SEM. The t test was used when two independent group means were compared, and the Mann–Whitney u test or Welch’s t test was used when the variances of two group means were different. A paired t test or a one-sample t test was used when two dependent group means were compared. Peak phases of the rhythms were estimated by the midpoint of the rising and falling limbs of detrended circadian rhythm that intersected the x axis. For regional comparison of the rhythms, 100 × 100 μm ROIs in the upper third (near the third ventricle) and in the bottom two-thirds (near the optic chiasma) were selected as the dorsal and ventral regions.
To quantify the rhythms at the SCN network, we used a custom-made program for the creation of acrophase maps as described previously (7, 30, 31). Briefly, fluorescence images were smoothed with the median filter (one pixel) and converted to eight-bit intensity. Background signals were selected from a region where no cells were found (referred to as “the background region”). The mean + 5 SDs of the signal intensity of the background region was set as the cutoff level of the signal and background. The time series of the images in each pixel [Yj (ti); ti = 1, 2, . . ., N (h)] was fitted to cosine curve yj(t) = yj (t; Mj, Aj, Cj, Tj) = Mj + Aj * cosine [2pi (t − Cj)/Tj] using a least-square regression method, where yj(t) is the signal intensity at time t (h), Mj is the mesor, Aj is the amplitude, Cj is the acrophase, and Tj is the period of the images. The goodness of fit was statistically evaluated by the percent of rhythm accounted for by the fitted cosine wave (Pearson product-moment correlation analysis) at a significance level of P < 0.001. In all figures, acrophase maps are shown by pseudocolor, and pixels with unfitted rhythms and background level signals are shown by white color. The mean acrophase of the entire SCN regions is separately normalized to zero for voltage and Ca2+ rhythms. To validate the rhythmicity in the ROIs, fluorescence signals in each ROI were fitted to cosine curves using a least-square regression method, and the goodness of fit was evaluated by cosine curve fitting and percent rhythm (P < 0.001).
Acknowledgments
We thank the Genetically Encoded Neuronal Indicator and Effector (GENIE) Project and the Janelia Farm Research Campus of the Howard Hughes Medical Institute for sharing jRGECO1 constructs; Dr. H. Gainer (NIH/National Institute of Neurological Disorders and Stroke) for providing anti-arginine vasopressin monoclonal antibody; Dr. T. Nagai (Osaka University) for supplying RGECO plasmid; and Dr. S. Kuroda (Hokkaido University) for providing the analysis program. This work was supported by Ministry of Education, Culture, Sports, Science and Technology (MEXT)/Japan Society for the Promotion of Science Research Grants 25860175, 25113701, and 15KT0072 (to R.E.), 24390055 and 15H04679 (to S.H.), 16K16645 (to Y.O.), and 16H05120 (to M.M.); the Precursory Research for Embryonic Science and Technology/Japan Science and Technology Agency; the Cooperative Research Project for Advanced Photonic Bioimaging; the Project for Developing Innovation Systems of MEXT; Akiyama Life Science Foundation (R.E.), the Japan Foundation for Neuroscience and Mental Health (R.E.), and the Narishige Neuroscience Research Foundation (R.E.).
Footnotes
The authors declare no conflict of interest.
This article is a PNAS Direct Submission.
This article contains supporting information online at www.pnas.org/lookup/suppl/doi:10.1073/pnas.1616815114/-/DCSupplemental.
References
- 1.Moore RY, Eichler VB. Loss of a circadian adrenal corticosterone rhythm following suprachiasmatic lesions in the rat. Brain Res. 1972;42(1):201–206. doi: 10.1016/0006-8993(72)90054-6. [DOI] [PubMed] [Google Scholar]
- 2.Mohawk JA, Green CB, Takahashi JS. Central and peripheral circadian clocks in mammals. Annu Rev Neurosci. 2012;35(1):445–462. doi: 10.1146/annurev-neuro-060909-153128. [DOI] [PMC free article] [PubMed] [Google Scholar]
- 3.Welsh DK, Takahashi JS, Kay SA. Suprachiasmatic nucleus: Cell autonomy and network properties. Annu Rev Physiol. 2010;72:551–577. doi: 10.1146/annurev-physiol-021909-135919. [DOI] [PMC free article] [PubMed] [Google Scholar]
- 4.Reppert SM, Weaver DR. Coordination of circadian timing in mammals. Nature. 2002;418(6901):935–941. doi: 10.1038/nature00965. [DOI] [PubMed] [Google Scholar]
- 5.Colwell CS. Linking neural activity and molecular oscillations in the SCN. Nat Rev Neurosci. 2011;12(10):553–569. doi: 10.1038/nrn3086. [DOI] [PMC free article] [PubMed] [Google Scholar]
- 6.Yamaguchi S, et al. Synchronization of cellular clocks in the suprachiasmatic nucleus. Science. 2003;302(5649):1408–1412. doi: 10.1126/science.1089287. [DOI] [PubMed] [Google Scholar]
- 7.Enoki R, et al. Topological specificity and hierarchical network of the circadian calcium rhythm in the suprachiasmatic nucleus. Proc Natl Acad Sci USA. 2012;109(52):21498–21503. doi: 10.1073/pnas.1214415110. [DOI] [PMC free article] [PubMed] [Google Scholar]
- 8.Schwartz WJ, Gross RA, Morton MT. The suprachiasmatic nuclei contain a tetrodotoxin-resistant circadian pacemaker. Proc Natl Acad Sci USA. 1987;84(6):1694–1698. doi: 10.1073/pnas.84.6.1694. [DOI] [PMC free article] [PubMed] [Google Scholar]
- 9.Brancaccio M, Maywood ES, Chesham JE, Loudon AS, Hastings MH. A Gq-Ca2+ axis controls circuit-level encoding of circadian time in the suprachiasmatic nucleus. Neuron. 2013;78(4):714–728. doi: 10.1016/j.neuron.2013.03.011. [DOI] [PMC free article] [PubMed] [Google Scholar]
- 10.Inagaki N, Honma S, Ono D, Tanahashi Y, Honma K. Separate oscillating cell groups in mouse suprachiasmatic nucleus couple photoperiodically to the onset and end of daily activity. Proc Natl Acad Sci USA. 2007;104(18):7664–7669. doi: 10.1073/pnas.0607713104. [DOI] [PMC free article] [PubMed] [Google Scholar]
- 11.Farajnia S, van Westering TLE, Meijer JH, Michel S. Seasonal induction of GABAergic excitation in the central mammalian clock. Proc Natl Acad Sci USA. 2014;111(26):9627–9632. doi: 10.1073/pnas.1319820111. [DOI] [PMC free article] [PubMed] [Google Scholar]
- 12.Mieda M, et al. Cellular clocks in AVP neurons of the SCN are critical for interneuronal coupling regulating circadian behavior rhythm. Neuron. 2015;85(5):1103–1116. doi: 10.1016/j.neuron.2015.02.005. [DOI] [PubMed] [Google Scholar]
- 13.Nagano M, et al. An abrupt shift in the day/night cycle causes desynchrony in the mammalian circadian center. J Neurosci. 2003;23(14):6141–6151. doi: 10.1523/JNEUROSCI.23-14-06141.2003. [DOI] [PMC free article] [PubMed] [Google Scholar]
- 14.Evans JA, Leise TL, Castanon-Cervantes O, Davidson AJ. Dynamic interactions mediated by nonredundant signaling mechanisms couple circadian clock neurons. Neuron. 2013;80(4):973–983. doi: 10.1016/j.neuron.2013.08.022. [DOI] [PMC free article] [PubMed] [Google Scholar]
- 15.Brancaccio M, et al. Network-mediated encoding of circadian time: The suprachiasmatic nucleus (SCN) from genes to neurons to circuits, and back. J Neurosci. 2014;34(46):15192–15199. doi: 10.1523/JNEUROSCI.3233-14.2014. [DOI] [PMC free article] [PubMed] [Google Scholar]
- 16.Schaap J, et al. Heterogeneity of rhythmic suprachiasmatic nucleus neurons: Implications for circadian waveform and photoperiodic encoding. Proc Natl Acad Sci USA. 2003;100(26):15994–15999. doi: 10.1073/pnas.2436298100. [DOI] [PMC free article] [PubMed] [Google Scholar]
- 17.Albus H, Vansteensel MJ, Michel S, Block GD, Meijer JH. A GABAergic mechanism is necessary for coupling dissociable ventral and dorsal regional oscillators within the circadian clock. Curr Biol. 2005;15(10):886–893. doi: 10.1016/j.cub.2005.03.051. [DOI] [PubMed] [Google Scholar]
- 18.Vansteensel MJ, et al. Dissociation between circadian Per1 and neuronal and behavioral rhythms following a shifted environmental cycle. Curr Biol. 2003;13(17):1538–1542. doi: 10.1016/s0960-9822(03)00560-8. [DOI] [PubMed] [Google Scholar]
- 19.VanderLeest HT, et al. Seasonal encoding by the circadian pacemaker of the SCN. Curr Biol. 2007;17(5):468–473. doi: 10.1016/j.cub.2007.01.048. [DOI] [PubMed] [Google Scholar]
- 20.Shirakawa T, Honma S, Katsuno Y, Oguchi H, Honma KI. Synchronization of circadian firing rhythms in cultured rat suprachiasmatic neurons. Eur J Neurosci. 2000;12(8):2833–2838. doi: 10.1046/j.1460-9568.2000.00170.x. [DOI] [PubMed] [Google Scholar]
- 21.Chen T-W, et al. Ultrasensitive fluorescent proteins for imaging neuronal activity. Nature. 2013;499(7458):295–300. doi: 10.1038/nature12354. [DOI] [PMC free article] [PubMed] [Google Scholar]
- 22.Buzsáki G, Draguhn A. Neuronal oscillations in cortical networks. Science. 2004;304(5679):1926–1929. doi: 10.1126/science.1099745. [DOI] [PubMed] [Google Scholar]
- 23.Marder E, Abbott LF, Turrigiano GG, Liu Z, Golowasch J. Memory from the dynamics of intrinsic membrane currents. Proc Natl Acad Sci USA. 1996;93(24):13481–13486. doi: 10.1073/pnas.93.24.13481. [DOI] [PMC free article] [PubMed] [Google Scholar]
- 24.Belle MDC, Diekman CO, Forger DB, Piggins HD. Daily electrical silencing in the mammalian circadian clock. Science. 2009;326(5950):281–284. doi: 10.1126/science.1169657. [DOI] [PubMed] [Google Scholar]
- 25.Ross WN, et al. Changes in absorption, fluorescence, dichroism, and Birefringence in stained giant axons: Optical measurement of membrane potential. J Membr Biol. 1977;33(1-2):141–183. doi: 10.1007/BF01869514. [DOI] [PubMed] [Google Scholar]
- 26.Nakajima R, Jung A, Yoon B-J, Baker BJ. Optogenetic monitoring of synaptic activity with genetically encoded voltage indicators. Front Synaptic Neurosci. 2016;8(August):22. doi: 10.3389/fnsyn.2016.00022. [DOI] [PMC free article] [PubMed] [Google Scholar]
- 27.Jin L, et al. Single action potentials and subthreshold electrical events imaged in neurons with a fluorescent protein voltage probe. Neuron. 2012;75(5):779–785. doi: 10.1016/j.neuron.2012.06.040. [DOI] [PMC free article] [PubMed] [Google Scholar]
- 28.Enoki R, Ono D, Hasan MT, Honma S, Honma K. Single-cell resolution fluorescence imaging of circadian rhythms detected with a Nipkow spinning disk confocal system. J Neurosci Methods. 2012;207(1):72–79. doi: 10.1016/j.jneumeth.2012.03.004. [DOI] [PubMed] [Google Scholar]
- 29.Zhao Y, et al. An expanded palette of genetically encoded Ca2+ indicators. Science. 2011;333(6051):1888–1891. doi: 10.1126/science.1208592. [DOI] [PMC free article] [PubMed] [Google Scholar]
- 30.Yoshikawa T, et al. Spatiotemporal profiles of arginine vasopressin transcription in cultured suprachiasmatic nucleus. Eur J Neurosci. 2015;42(9):2678–2689. doi: 10.1111/ejn.13061. [DOI] [PubMed] [Google Scholar]
- 31.Honma S, et al. Oscillator networks in the suprachiasmatic nucleus: Analysis of circadian parameters using time-laps images. In: Honma K, Honma S, editors. Biological Clocks. Hokkaido Univ Press; Sapporo, Japan: 2016. pp. 33–41. [Google Scholar]
- 32.Lundkvist GB, Kwak Y, Davis EK, Tei H, Block GD. A calcium flux is required for circadian rhythm generation in mammalian pacemaker neurons. J Neurosci. 2005;25(33):7682–7686. doi: 10.1523/JNEUROSCI.2211-05.2005. [DOI] [PMC free article] [PubMed] [Google Scholar]
- 33.Ikeda M, et al. Circadian dynamics of cytosolic and nuclear Ca2+ in single suprachiasmatic nucleus neurons. Neuron. 2003;38(2):253–263. doi: 10.1016/s0896-6273(03)00164-8. [DOI] [PubMed] [Google Scholar]
- 34.Irwin RP, Allen CN. Calcium response to retinohypothalamic tract synaptic transmission in suprachiasmatic nucleus neurons. J Neurosci. 2007;27(43):11748–11757. doi: 10.1523/JNEUROSCI.1840-07.2007. [DOI] [PMC free article] [PubMed] [Google Scholar]
- 35.Pennartz CM, de Jeu MT, Bos NP, Schaap J, Geurtsen AM. Diurnal modulation of pacemaker potentials and calcium current in the mammalian circadian clock. Nature. 2002;416(6878):286–290. doi: 10.1038/nature728. [DOI] [PubMed] [Google Scholar]
- 36.Diekman CO, et al. Causes and consequences of hyperexcitation in central clock neurons. PLOS Comput Biol. 2013;9(8):e1003196. doi: 10.1371/journal.pcbi.1003196. [DOI] [PMC free article] [PubMed] [Google Scholar]
- 37.Dana H, et al. Sensitive red protein calcium indicators for imaging neural activity. eLife. 2016;5:1–24. doi: 10.7554/eLife.12727. [DOI] [PMC free article] [PubMed] [Google Scholar]
- 38.Ono D, Honma S, Honma K. Cryptochromes are critical for the development of coherent circadian rhythms in the mouse suprachiasmatic nucleus. Nat Commun. 2013;4:1666. doi: 10.1038/ncomms2670. [DOI] [PubMed] [Google Scholar]
- 39.Enoki R, Ono D, Kuroda S, Honma S, Honma KI. Dual origins of the intracellular circadian calcium rhythm in the suprachiasmatic nucleus. Sci Rep. 2017;7:41733. doi: 10.1038/srep41733. [DOI] [PMC free article] [PubMed] [Google Scholar]
- 40.Ono D, Honma S, Honma K. Differential roles of AVP and VIP signaling in the postnatal changes of neural networks for coherent circadian rhythms in the SCN. Sci Adv. 2016;2(9):e1600960. doi: 10.1126/sciadv.1600960. [DOI] [PMC free article] [PubMed] [Google Scholar]
- 41.Enoki R, Namiki M, Kudo Y, Miyakawa H. Optical monitoring of synaptic summation along the dendrites of CA1 pyramidal neurons. Neuroscience. 2002;113(4):1003–1014. doi: 10.1016/s0306-4522(02)00169-0. [DOI] [PubMed] [Google Scholar]
- 42.Kasuga A, et al. Optical detection of dendritic spike initiation in hippocampal CA1 pyramidal neurons. Neuroscience. 2003;118(4):899–907. doi: 10.1016/s0306-4522(03)00061-7. [DOI] [PubMed] [Google Scholar]
- 43.Tokuda IT, et al. Coupling controls the synchrony of clock cells in development and knockouts. Biophys J. 2015;109(10):2159–2170. doi: 10.1016/j.bpj.2015.09.024. [DOI] [PMC free article] [PubMed] [Google Scholar]
- 44.Kent J, Meredith AL. BK channels regulate spontaneous action potential rhythmicity in the suprachiasmatic nucleus. PLoS One. 2008;3(12):e3884. doi: 10.1371/journal.pone.0003884. [DOI] [PMC free article] [PubMed] [Google Scholar]
- 45.Meredith AL, et al. BK calcium-activated potassium channels regulate circadian behavioral rhythms and pacemaker output. Nat Neurosci. 2006;9(8):1041–1049. doi: 10.1038/nn1740. [DOI] [PMC free article] [PubMed] [Google Scholar]
- 46.Block GD, McMahon DG. Cellular analysis of the Bulla ocular circadian pacemaker system. J Comp Physiol A Neuroethol Sens Neural Behav Physiol. 1984;155(3):387–395. [Google Scholar]
- 47.Jones JR, McMahon DG. The core clock gene Per1 phases molecular and electrical circadian rhythms in SCN neurons. PeerJ. 2016;4:e2297. doi: 10.7717/peerj.2297. [DOI] [PMC free article] [PubMed] [Google Scholar]
- 48.Zhong L, et al. Next generation of adeno-associated virus 2 vectors: Point mutations in tyrosines lead to high-efficiency transduction at lower doses. Proc Natl Acad Sci USA. 2008;105(22):7827–7832. doi: 10.1073/pnas.0802866105. [DOI] [PMC free article] [PubMed] [Google Scholar]
- 49.Hasegawa E, Yanagisawa M, Sakurai T, Mieda M. Orexin neurons suppress narcolepsy via 2 distinct efferent pathways. J Clin Invest. 2014;124(2):604–616. doi: 10.1172/JCI71017. [DOI] [PMC free article] [PubMed] [Google Scholar]


