

Abstract
Background
The incidence of Alzheimer’s disease (AD) strongly relates to advanced age and progressive deposition of cerebral amyloid-beta (Aβ), hyperphosphorylated tau, and iron. The purpose of this study was to investigate the relationship between cerebral dynamic functional connectivity and variability of long-term cognitive performance in healthy, elderly subjects, allowing for local pathology and genetic risk.
Methods
Thirty seven participants (mean (SD) age 74 (6.0) years, Mini-Mental State Examination 29.0 (1.2)) were dichotomized based on repeated neuropsychological test performance within 2 years. Cerebral Aβ was measured by 11C Pittsburgh Compound-B positron emission tomography, and iron by quantitative susceptibility mapping magnetic resonance imaging (MRI) at an ultra-high field strength of 7 Tesla (7T). Dynamic functional connectivity patterns were investigated by resting-state functional MRI at 7T and tested for interactive effects with genetic AD risk (apolipoprotein E (ApoE)-ε4 carrier status).
Results
A relationship between low episodic memory and a lower expression of anterior-posterior connectivity was seen (F(9,27) = 3.23, p < 0.008), moderated by ApoE-ε4 (F(9,27) = 2.22, p < 0.005). Inherent node-strength was related to local iron (F(5,30) = 13.2; p < 0.022).
Conclusion
Our data indicate that altered dynamic anterior-posterior brain connectivity is a characteristic of low memory performance in the subclinical range and genetic risk for AD in the elderly. As the observed altered brain network properties are associated with increased local iron, our findings may reflect secondary neuronal changes due to pathologic processes including oxidative stress.
Keywords: Alzheimer’s disease, Amyloid beta, Iron, Episodic memory, Oxidative stress, Dynamic functional connectivity
Background
Sporadic Alzheimer’s disease (AD) is the most frequent cause of dementia [1] and is characterized pathologically by deposition of amyloid-beta (Aβ), hyperphosphorylated tau, and progressive neuronal dysfunction [2, 3]. Pathological brain change in AD furthermore includes the increased accumulation of cerebral iron, which has been linked to several pathological processes associated with risk for AD and disease progression [4–9].
Clinically, AD develops gradually and presents with progressive decline in multiple cognitive domains, particularly affecting episodic memory, executive functioning, and perceptual speed [10–13]. While these alterations may also take place during normal aging, the concurrent incidence of subtle cognitive dysfunction and emerging AD brain pathology in the cognitively normal elderly is considered to reflect a preclinical stage of AD [14, 15]. Moreover, progression of AD is significantly affected by genetic predisposition and presence of the apolipoprotein E (ApoE) ε4 allele, which is the strongest known genetic risk factor for late-onset AD [16–20].
A variety of noninvasive neuroimaging techniques have been developed to assess AD pathology directly and AD-associated neurobiological changes. Positron emission tomography (PET) using the 11C-labeled tracer Pittsburgh Compound-B (PiB), is a validated method for measuring fibrillar Aβ [21, 22] and has been used to assess pathological burden in several clinical studies [23–25].
Cerebral iron can be measured in vivo by applying quantitative susceptibility mapping (QSM) magnetic resonance imaging (MRI) [26, 27], which has very high signal-to-noise ratios (SNRs) when acquired at ultra-high field strength [28, 29].
While the blood-oxygen-level dependent (BOLD) functional MRI (fMRI) contrast reflects in vivo neuronal activity [30, 31], an ultra-high field strength of 7 Tesla (7T) may provide enhanced SNR and enriched contrast [32–35]. Therefore, for the current study, a three-dimensional T2-weighted BOLD fMRI sequence was used (“T2-prep fMRI”), which was specifically designed for ultra-high magnetic field strength MRI acquisition [36]. Functional connectivity, as inferred from synchronous fluctuations in activity in spatially distant brain areas [37], is an established measure for investigating the integrity of functional brain networks and their potential impairment in AD [38–41]. Investigation of “dynamic functional connectivity” additionally provides information on the expression of brain networks over time and has been used to characterize changes in brain network connectivity in neuropsychiatric disorders earlier [42–45].
The primary aim of this study was to investigate whether dynamic expression of cognitive brain networks relates to interindividual variation of cognitive performance in healthy elderly subjects and their genetic predisposition for AD. Considering that “stationary” connectivity is significantly affected by local neurodegenerative brain change [46–50], the second aim of this study was to examine the relationship between dynamic network expression and neuropathology. 11C-PiB-PET and QSM-MRI were thus used for measuring neuropathological burden, as indicated by the accumulation of cerebral Aβ and iron. QSM-MRI and resting state T2-prep fMRI were performed at an ultra-high field strength of 7T. Interindividual variability of cognitive performance over time was assessed by performing two neuropsychological tests for each participant, 2 years apart.
Methods
Study population
The study sample included 37 (13 females and 24 males) cognitively normal Swiss-German elderly adults (mean age (SD) 73 (6.6) years, range 62–89 years, mean education (SD) 14 (3) years, range 8–20) living in the canton Zurich from an ongoing study [51], who received ultra-high field strength MRI at 7T and neuropsychological follow-up after 2 years (Table 1). Genotyping of the APOE gene (rs429358 and rs7412) revealed 13 carriers with at least one ApoE-ε4 allele (two subjects had the genotype ε4/ε4). All study procedures were carried out in concordance with regulations issued by the local ethics authority (Kantonale Ethikkommission Zürich, www.kek.zh.ch), as well as good clinical practice (GCP) guidelines and the declaration of Helsinki [52]. Written informed consent was obtained from all participants before inclusion in the study. Inclusion criteria were age between 55 and 80 years, no significant cognitive impairment as indicated by Mini-Mental State Examination (MMSE) <26, no acute medical or neurological comorbidities, and no present psychiatric disorder or current substance abuse. Exclusion criteria included evidence of infarction and focal or significant hemorrhagic lesions in the MRI, as indicated in detail previously for neuroimaging studies on nondemented elderly populations at our center [8, 41, 51, 53].
Table 1.
Mean scores of neuropsychological tests at inclusion of study and follow-up, as well as changes (%) in performance between sessions
| Test | Inclusion | Follow-up | p value* | Total sample (n = 37), % change per year | No decline, % change per year | No decline p value* | Decline, % change per year | Decline p value* |
|---|---|---|---|---|---|---|---|---|
| MMSE | 29.03 (1.17) | 29.03 (1.19) | 1.00 | 0.00 | 1.83% (n = 23) | <0.001 | –1.97% (n = 14) | <0.0001 |
| BNT | 14.32 (1) | 14.46 (0.84) | 0.53 | 0.01 | 1.45% (n = 33) | <0.01 | –5.53% (n = 4) | <0.015 |
| DSF | 6.81 (1.66) | 6.84 (1.55) | 0.94 | 0.02 | 10.32% (n = 24) | <0.01 | –14.09% (n = 13) | <0.001 |
| DSB | 6.08 (1.57) | 5.95 (1.73) | 0.73 | 0.00 | 10.32% (n = 20) | <0.001 | –11.69% (n = 17) | <0.0001 |
| TMT B/A | 2.83 (1.27) | 2.61 (1) | 0.41 | 0.00 | 17.51% (n = 19) | <0.002 | –18.84% (n = 18) | <0.001 |
| VLMT delayed recall | 8.49 (3.92) | 9.62 (4.21) | 0.23 | 0.19 | 46.22% (n = 19) | <0.001 | –9.31% (n = 18) | <0.01 |
Values are shown as mean (SD)
*Follow-up versus inclusion
BNT Boston Naming Test, DSB Digit Span Backward, DSF Digit Span Forward, MMSE Mini-Mental State Examination, TMT B/A Trail Making Test part B/part A, VLMT Verbal Learning and Memory Test
Cognitive assessment of participants
All subjects were evaluated by neuropsychological tests as described previously [51]. For the current study, neuropsychological follow-up was scheduled after 2 years and included German language versions of the MMSE as a general measure of cognitive performance [54], as well as domain-specific testing using the Digit Span Forward (DSF) and Digit Span Backward (DSB) for measuring working memory [55], the delayed recall Verbal Learning and Memory Test (VLMT) [56] for assessing episodic memory, the abbreviated CERAD Boston Naming Test (BNT) on confrontational word retrieval [57, 58], and the ratio between part B and A of the Trail Making Test (TMT) as a measure of executive function [59]. To characterize the performance of each measure over time, the percentage difference between follow-up value and baseline was used to obtain yearly variability ratios (relative change per 365 days) for each participant and each investigated cognitive domain. Subjects were allocated to the group “Decline” if the respective yearly variability ratios were negative and to the group “No Decline” if ratios were equal or better than at inclusion (Table 1).
Acquisition of MRI data
Participants underwent one session of scanning using a Philips 7-Tesla Achieva whole-body scanner (Philips Healthcare, Best, The Netherlands) equipped with a Nova Medical quadrature transmit head coil and 32-channel receive coil array, located at the Swiss Federal Institute of Technology (ETH) in Zurich, as reported previously [8, 41, 53]. For the current study, this scanner was used to acquire T1-weighted MP2RAGE image [60] data (TR/TE = 4.8 ms/2.1 ms, voxel size = 0.6 × 0.6 × 0.6 mm3, SENSE-factor = 2 × 1 × 2, scan duration = 7:50 min) for referencing and automated image segmentation. Resting-state fMRI data was acquired using a 3D T2-prep gradient recalled echo (GRE) sequence, optimized for ultra-high field strength acquisition [36] (TR = 2 s, TRGRE/TEGRE = 3.08 ms/1.6 ms, voxel size = 1.5 × 1.5 × 1.5 mm3, scan duration = 7:03 min). Iron load was measured by QSM-MRI at ultra-high field strength using a multi-echo three-dimensional gradient recalled echo (GRE) sequence with three echoes (TR/TE/ΔTE = 23/6/6 ms, flip angle = 10°, voxel size = 0.5 × 0.5 × 0.5 mm3, SENSE-factor = 2.5 × 1 × 2, flow-compensated, scan duration = 13:48 min) for acquiring anatomical MR measures of magnitude and phase for calculation of QSM images using a previously described pipeline [8, 29].
Acquisition of PET data
Cerebral Aβ was measured with 11C-PiB-PET [8, 41, 53]. Briefly, participants were administered a dose of 350 MBq of the 11C-labeled tracer intravenously and cerebral amyloid deposition was estimated based on late frame signals representing 50–70 min. Measures of individual brain Aβ load were derived from the ratio of standardized uptake values (SUV) of regional PiB referenced to cerebellar SUV after coregistration using the PMOD brain tool (PNEURO) software, Version 3.4 (PMOD Technologies Ltd., Zurich, Switzerland).
Processing of fMRI data
Structural and functional images were preprocessed with a standardized in-house-developed preprocessing pipeline [61] implemented in MATLAB scripts (MATLAB 2015b, Version 8.6; MathWorks Inc., Natick, MA, USA), which included functions from SPM8, SPM12 (http://www.fil.ion.ucl.ac.uk/spm/) and DPARSFA toolboxes [62]. Images were spatially realigned and smoothed (FWHM = 5 mm). Nuisance variables were regressed out from the regional time series (these included linear and quadratic trends, six head motion parameters, average cerebrospinal fluid signal from ventricular masks and white matter signal from white matter masks). All the functional data was postprocessed using the Artifact Detection Tool (ART; www.nitrc.org/projects/artifact_detect/), resulting in exclusion of three subjects from further analysis due to excess motion (>2 mm). The remaining 37 functional volumes were regionally parcellated using the automated anatomical labeling (AAL) atlas [63], resulting in the definition of 90 anatomical grey-matter regions of interest. Regional mean time series were then extracted by averaging the preprocessed BOLD signal over all voxels in each region and filtered with a band-pass filter cutoff (0.017–0.15 Hz), as performed previously for investigating dynamic functional networks at rest [45].
Assessment of dynamic functional connectivity
A whole brain dynamic functional connectivity (FC) matrix for each subject was calculated using a sliding time window approach (window size = 30 TRs = 60 s; step =1 TR = 2s) to calculate the time-varying correlations between BOLD fluctuations in distinct brain regions, as reported previously [45, 64]. Briefly, in order to account for spurious fluctuations while preserving meaningful fluctuations within the time windows, the window size was determined by calculating 1/smallest frequency in the data, represented by the high-pass filter cutoff [64]. The FC matrices obtained for all windows were then vectorized and temporally concatenated to obtain a dFC (connections × time) matrix, which was normalized by first removing the global mean and dividing for the global standard deviation and secondly applying a row-wise demeaning to focus on the exclusive contributions of dynamics. Finally, dFC data were concatenated into a (connections × time*subjects) matrix and principal component analysis (PCA) was used for reducing data dimensionality and to define subject specific eigenconnectivities, referring to distinct connectivity patterns [45] (i.e., building blocks of dFC, highlighting dominant patterns of FC increase/decrease that recur across time and in the population). For the current study, the following properties of dynamic network connectivity were investigated: 1) Time-contributed weights and percentage of positive weights were obtained for identified connectivity patterns as a measure of dynamic FC changes and compared between groups for inferring expression of connectivity patterns within the acquired fMRI data (“network expression”). Effects of cognitive decline and ApoE-ε4 status on changes in dynamic FC network expression were assessed using a multivariate Hotelling’s T2 test. Singular value decomposition with bootstrapping matched to a Procrustes transform [65] was conducted to test the reproducibility of the eigenconnectivity patterns [66]. Through this process, the stronger connections are attributed higher values and the weaker connections are gradually discarded. This eases interpretation without affecting group comparison tests and these data were therefore used for the visualization of the eigenconnectivity networks. 2.) Node strengths for significant connectivity patterns were calculated as a graph theoretical measure indicating involvement of a particular region in a network, as derived from the sum of all connection weights for all connections attached to a given node [67].
Statistical analysis
All data processing was performed in MATLAB (2015b, Version 8.6) and its Statistics and Machine Learning Toolbox (Version 10.0). A Hotelling’s T2 multivariate test in combination with sequentially rejective Holm-Bonferroni correction [68] for investigating variability indices pertaining to six neuropsychological tests was used to assess relationship with expression of dynamic connectivity patterns. To follow-up on significant associations, secondary analysis investigated: 1) interactive effects of test performance and ApoE-ε4 on network alterations using a multivariate Hotelling’s T2 test; and 2) relationships between node strength of significant connectivity patterns and local Aβ and iron load, respectively, by applying false discovery rate (FDR)-corrected permutation-based multivariate analysis of variance (MANOVA) [69]. Effect sizes of differences between the “Decline” and “No decline” groups were estimated using Cohen’s d [70].
Results
Stratification of the study sample by identification of participants with lower cognitive performance after 2 years
Participants were neuropsychologically tested at baseline and after 2 years (mean (SD) follow-up time between testing, 719 (277) days). All participants had normal levels of general cognitive performance both at inclusion (mean (SD) MMSE 29.03 (1.17)), as well as at follow-up (mean (SD) MMSE 29.03 (1.19), mean average change per year 0.39%) and for the entire population (n = 37) no significant difference between baseline and follow-up could be observed for the investigated neuropsychological tests. For stratifying the study population by cognitive performance over time, a subgroup of “decliners” was defined that included subjects with negative yearly variability ratios for each cognitive domain. Decliners thus included four subjects for the Boston Naming Test (average yearly change –5.53%), 13 subjects for the Digit Span Forward Test (average yearly change –14.09%), 17 subjects for the Digit Span Backward Test (average yearly change –11.69%), 18 subjects for Trail-Making Test ratio (average yearly change –18.84%), and 18 subjects for the VLMT delayed recall test (average yearly change –9.31%) (Table 1). By generating a Venn diagram, a small degree of overlap between decline in the respective domains could be visualized (Fig. 1), indicating no participant with concurrent decline in all five tests and only two subjects with declined performance in four out of five tests. Moreover, the null hypothesis that the performed tests for domain performance assessed one common factor was dismissed by means of a factor analysis (χ2(5) = 11.995, p < 0.04).
Fig. 1.
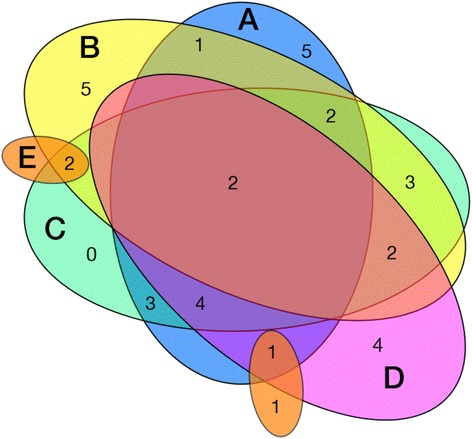
Venn diagram illustrating the relationship of “decliners” among the different strata. Each circle is labeled according to the neuropsychological test it represents: A, delayed recall Verbal Learning and Memory Test; B, Digit Span Backward test; C, Trail-Making Test; D, Digit Span Forward test; E, Boston Naming Test). The small circle without a label in the same color as E also illustrates decliners in the Boston Naming Test
Lower expression of an anterior-posterior network in subjects with declined episodic memory performance
Individuals characterized as having memory decline showed reduced expression of an anterior-posterior connectivity pattern, which remained significant (alpha = 5%) after applying Holm-Bonferroni correction for multiple testing (Roy’s maximum root F(9,27) = 3.23, p < 0.0078; factor loading –0.521; Fig. 2a and b). No significant effects (Roy’s maximum root test, indicated are uncorrected p values without adjustment for multiple testing) on dynamic FC were found for groups defined by the cognitive tests Boston Naming (F(9,27) = 0.53, p = 0.85), Digit Span Forward (F(9,27) = 1.33, p = 0.27), Digit Span Backward (F(9,27) = 0.97, p = 0.48) and Trail Making Test B/A (F(9,27) = 0.84, p = 0.6).
Fig. 2.
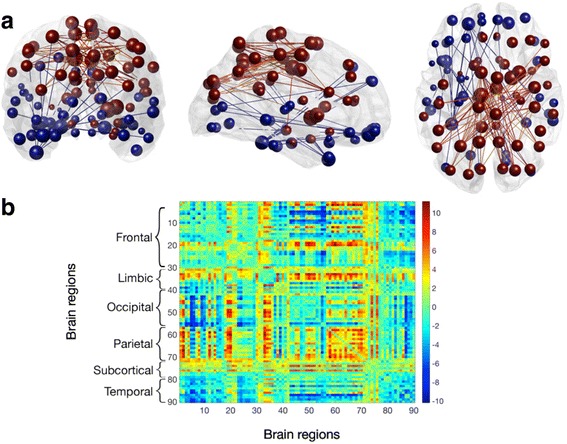
a Coronal, sagittal and axial views of the 2% strongest connections in brain space of the anterior-posterior network. Brain regions are shown as spheres where their size represents their degree and color represents the algebraic sign of relative node strength (red for positive, blue for negative). Connections follow the same color scheme. b Corresponding eigenconnectivity for anterior-posterior network. Plot follows an identical color scheme as the glass brains. Each number on the x and y axes represents a label on the AAL atlas
Node strength is associated with higher regional iron, but not amyloid-beta
The observed relationship between memory decline and anterior-posterior network expression was followed up for potential relationships between node strength of significant connectivity patterns and neuropathology, by permutation MANOVA. This approach yielded a set of five nodes where nodal contributions to the network were associated with significantly higher susceptibility, as an indicator of local iron, in subjects with lower memory performance at follow-up, compared to those with equal or better performance (F(1,35) = 13.1, p < 0.022, FDR-corrected; Fig. 3c). The most distinct increases for local iron were observable for the left Precuneus (Cohen’s d = 0.493), right Caudate (d = 0.410) and right anterior Cingulate (d = 0.160) (Fig. 4). While no significant relationship between regional network contribution and local Aβ load could be observed for any of the identified nodes (p = 0.128, uncorrected), the association between node strength in the anterior-posterior network and memory decline was not significant when correcting iron levels for Aβ (t(27) = 12.49, p = 0.1).
Fig. 3.
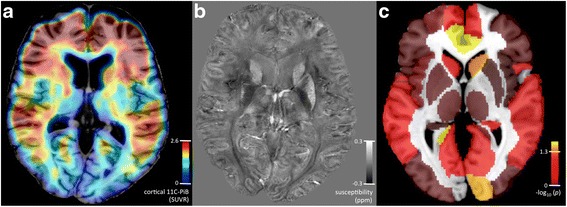
a Exemplary 11C-PiB-PET image, indicating regional distribution of standardized uptake value ratio (SUVR) as a measure of local Aβ deposition. b Exemplary QSM image at 7T, indicating regional distribution of susceptibility as used for inferring on local iron load. c Correlation between node strength of the anterior-posterior network and local iron load. Significance as indicated by alpha of 5% after correction for multiple testing (FDR) was reached at –log10(p) = 1.3
Fig. 4.
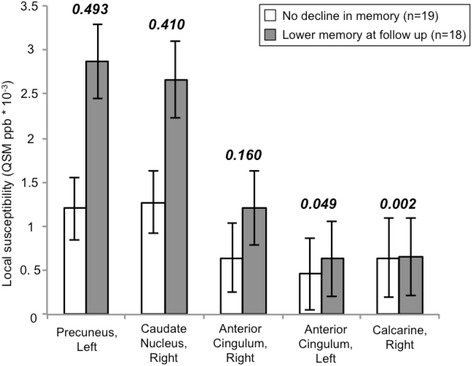
Group differences between subjects with lower memory performance after 2 years and subjects without decline at follow-up, as measured by VLMT delayed recall, in iron load of significant nodes in the anterior-posterior network (MANOVA, p < 0.05 after correction for multiple testing by FDR). Indicated is the susceptibility measure, as a quantitative susceptibility mapping (QSM)-derived inference on local iron content. Numbers refer to the effect size, as calculated by Cohen’s d
Combined effects of ApoE-ε4 and declined episodic memory performance on network expression
A multivariate Hotelling's T2 test was used to investigate whether the observed change of dynamic connectivity in a context of memory decline relates to the individual risk of developing AD. Participants with both ApoE-ε4, as well as declined memory over 2 years (n = 6), were tested against the rest of the sample (n = 31), resulting in significant differences in the percentage of positive weights between groups (Roy’s maximum root F(9,27) = 2.22, p < 0.005). Secondary testing of ApoE-ε4 carriers against noncarriers within the group of subjects with declined memory indicated a nominally significant difference in the percentage of positive weights between groups (Roy’s maximum root F(9,8) = 5.29, p < 0.03). Here, the factor loadings of each eigenconnectivity point to three connectivity patterns that drive this group difference: the global network expression (factor loading –0.5), a fronto-temporal network (factor loading –0.44), and a fronto-occipital network (factor loading –0.48). These findings indicate a significant difference in specific network expression associated with ApoE-ε4 carrier status and memory decline, concerning: 1) a pattern showing the alteration of global connectivity (first eigenconnectivity, positive pattern); 2) the alteration between anterior-posterior network connectivity (negative pattern) and interhemispheric fronto-temporal (positive pattern) connectivity (second eigenconnectivity); and 3) the alteration between parieto-temporal connections (negative pattern) and fronto-occipital connectivity (positive pattern) (Fig. 5). The negative sign of the factor loadings indicate that these networks show an increase in the negative patterns and decrease in the positive patterns.
Fig. 5.
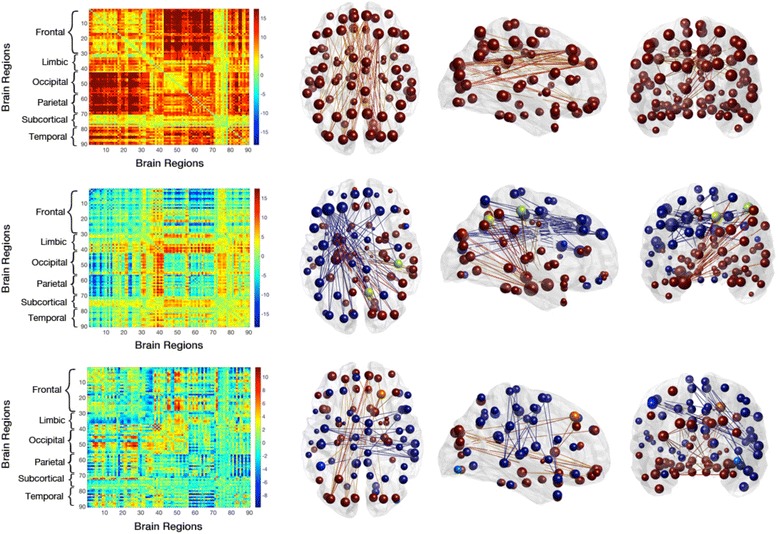
Axial, sagittal and coronal views of the 2% strongest connections in brain space of a global, fronto-temporal, and fronto-occipital network (rows 1–3, respectively), demonstrated to drive the group difference between subjects who display both APOE-e4 expression and memory decline versus the remaining sample. Brain regions are shown as nodes (spheres) where their size represents their degree and the color code matches the algebraic sign of relative node strength (red and yellow for positive, green, turquoise and blue for negative). Connections follow the same color scheme
Discussion
By implementing dynamic functional connectivity analysis on ultra-high field strength MRI at 7T, reduced expression of a dynamic anterior-posterior brain network could be identified as a correlate of low episodic memory performance over time in cognitively normal elderly subjects. While strength of nodes implicated in this network related to mean regional susceptibility as a measure of local iron accumulation, no significant association could be observed for local Aβ plaque density, as inferred by PiB standardized uptake value ratio (SUVR). As dynamic functional connectivity changes relates to both lower episodic memory and ApoE-ε4, our findings may reflect brain change taking place in subjects at increased risk for AD and preclinical stages of AD, respectively. To our knowledge, this is the first study that demonstrates a relationship between memory decline within the normal range and altered dynamic network connectivity as a potential correlate of increased risk for AD in the healthy elderly.
Assessment of pathological burden included estimation of Aβ plaque density by administering 11C-PiB-PET, as has been demonstrated to be valid for characterizing progression of AD pathology previously [21, 71–73]. Additionally, iron was measured by QSM-MRI [26, 27] which was performed at ultra-high field strength for maximizing signal quality [28]. While functional connectivity analysis of BOLD-fMRI data is a well-established measure of neural integrity in AD [38, 39, 74], for the current study, T2-prep fMRI was used to avoid signal contortion near air cavities, but which nevertheless benefits from high SNR at 7T [36]. Moreover, dynamic functional connectivity [42] was assessed for inferring on the temporal expression of connectivity patterns by integrating information on both the regional extent and temporal evolution of coherent BOLD activity [45, 64]. The studied population was cognitively assessed by performing tests and follow-up for language capacity, working memory, episodic memory, and executive function within 2 years. While neuropsychological assessment over time has been suggested previously to be a particularly reliable measure of cognitive performance in the elderly [75, 76], the investigated study population in our study remained relatively stable regarding test performance within the study period. However, by splitting the study population by algebraic sign of yearly variability ratios, two subgroups that significantly differed regarding their rate of decline in the investigated cognitive domains could be identified that only showed moderate overlap regarding cognitive domains affected by lower performance over time. Some participants in our study performed better at follow-up, which may be explained by practice effects as reported previously for longitudinal studies on cognitively normal elderly subjects [77].
Our finding of an association between memory performance and dynamic connectivity appears consistent with a concatenation of earlier reports on altered functional connectivity in AD [50, 78, 79] as well as associations between distinct cognitive impairment and increased AD risk [15, 80]. Central nodes of the dynamic anterior-posterior network found to be associated with episodic memory performance exhibited increased iron for the lower episodic memory group. The strongest effects were observable for the left precuneus, right caudate, and right anterior cingulate. This observation appears consistent with previous reports on subcortical regions being primarily affected by iron accumulation in neurodegenerative brain disorders [81, 82]. While no differences in local Aβ plaque density were measured as being associated with network dynamics, a distinct impact of ApoE-ε4 on network expression was observable, suggesting an association with an increased risk for AD. Moreover, cerebral iron accumulation may reflect pathological processes implicated in AD [81, 83–85], and local interactions of accumulated iron have been suggested previously to promote neuronal damage in the context of AD [6, 7, 85–88]. These earlier considerations on interactions between iron and AD pathology may be consistent with our lack of identifying significant associations between local iron and network-dynamics, when iron was corrected for Aβ.
While our data indicate memory decline within the normal range as a potential correlate of altered dynamic network connectivity and increased genetic risk for AD, our findings might furthermore support earlier considerations on the relevance of pathological processes reflected by local iron, such as oxidative stress, free radical activity, and mitochondrial dysfunction [83, 84]. These processes may be reflected by functional changes, primarily affecting brain regions with high metabolic activity and increased susceptibility to age-related damage [89]. Considering these pathological processes as secondary to the earlier manifestation of AD pathology, they nevertheless may substantially contribute to cognitive decline [4, 81, 90, 91] and may thus represent a correlate of the well-established phenomenon of functional disconnection in AD [39, 50, 89]. This interpretation may be consistent with previous considerations on a stronger association of functional impairment with secondary pathological processes than with Aβ plaque density itself [92, 93].
The following limitations have to be allowed for when appraising our reported findings. While neuropsychological performance was assessed based on measures within 2 years, neuroimaging was performed only once and thus only confers cross-sectional information. Additional longitudinal studies are necessary to investigate the temporal relationship of the different constituents of pathological burden, which included Aβ plaque density and iron load in the current study. As the number of study participants affected by cognitive decline, and thus power to identify functional correlates of low performance, varied between the domains investigated, negative findings for language capacity, working memory, and executive function need to be interpreted with caution. Moreover, while MRI at ultra-high field strength may provide advantages in SNR and thus facilitate detection of pathological change [28], reproducibility of findings may be difficult as it requires the implementation of sequences that were originally performed on 7T on more readily available clinical scanners with lower field strength.
Conclusions
While the association between memory decline in the elderly and emerging AD-related pathology is well established, our findings suggest that variation in the subclinical range of memory performance may be linked to alterations in functional network dynamics. Moreover, our data suggest that altered network dynamics reflect regional pathological burden, as characterized by increased iron accumulation, and also genetic risk, as conferred by ApoE-ε4. Additional studies are necessary to clarify whether the observed dynamic functional changes reflect impaired neural integrity and thus possibly a symptom-free stage of incipient cognitive disorder, or alternatively may represent adaptive mechanisms activated for maintenance of brain functionality during aging.
Acknowledgments
We thank all subjects for their participation in our study. We thank Linjing Mu, Ph.D. and Geoff Warnock, Ph.D., from the Division of Nuclear Medicine, University of Zürich, Switzerland, for their help in generation of 11C-labeled Pittsburgh Compound-B tracer for positron emission tomography (Linjing Mu) and calculation of the cortical PiB ratio scores (Geoff Warnock).
Funding
This work was funded by the Swiss National Science Foundation (Schweizerischer Nationalfonds, SNF), the Clinical Research Priority Program (CRPP) of the University of Zurich on Molecular Imaging (MINZ), a grant from the National Institutes of Health (NIBIB) P41 EB015909, the Mäxi Foundation, the Center for Biomedical Imaging (CIBM) in the Lemanic Region, and institutional support from the Division of Psychiatry Research and Psychogeriatric Medicine, University of Zürich, and Institute for Biomedical Engineering, University of Zürich and ETH Zürich, Switzerland.
Availability of data and materials
This article does not include data on nucleotide sequences, protein sequences, mass spectrometry, structures and assays, microarray data, computational modeling or plasmids, which would be available in a public repository.
Authors’ contributions
FCQ performed processing of the T2-Prep-BOLD and PET volumes, statistical analysis of the dynamic functional connectivity data, and drafted and revised the manuscript. JMBvB performed data processing of QSM and PET data as well as statistical analysis, and revised the manuscript. XL, JH, and PCMvZ established and optimized the QSM and T2-Prep-BOLD methodologies used, and revised the manuscript. SJS and SCS contacted all participants, and performed MRI scanning and neuropsychological workup of all subjects at the time of MRI acquisition. SEL performed the neuropsychological workup of all participants, and revised the manuscript. IBM and AMB screened the T2* data for the presence of microbleeds, reviewed neuropsychological data, and revised the manuscript. DVDV and MGP supervised the analysis of the dynamic functional connectivity data and were fundamental for the development of the fMRI analysis strategy, and revised the manuscript. MW and KPP provided support in implementing MR sequences (QSM) on the 7 Tesla scanner at ETH Zurich, as well as running the 7T instrument and quality control of obtained MR data. AFG and RM coordinated the study and genotyping of APOE, and had interaction with the ethics committee and acquisition of PiB-PET data. AB supervised the preparation of the 11C-PiB-tracer for measuring brain Aβ plaque density, quality control of PET-data and analysis, and revision of the manuscript. RMN and CH are the chairmen of the department and sponsors of the study, and provided critical revisions of the final manuscript. PGU designed the study and experimental setup, supervised the acquisition, processing, analysis and interpretation of neuroimaging as well as clinical data. PGU has drafted the manuscript and has performed the final revision. All authors read and approved the final manuscript.
Competing interests
PCMvZ is a paid lecturer for Philips Healthcare and is the inventor of technology that is licensed to Philips. XL’s salary is supported in part by a grant from Philips Healthcare. This arrangement has been approved by The Johns Hopkins University in accordance with its Conflict of Interest policies. The remaining authors declare that they have no competing interests.
Consent for publication
This is to confirm that consent to publish has been obtained from each participant and includes consent for reporting individual patient data as performed in the current study.
Ethics approval and consent to participate
Written informed consent was obtained from all participants before inclusion in the study. All study procedures were carried out in concordance with the good clinical practice (GCP) guidelines issued by the local ethics authority (Kantonale Ethikkommission Zürich, www.kek.zh.ch) and the declaration of Helsinki (World Medical Association 1991).
Abbreviations
- AAL
Automated anatomical labeling
- Aβ
Amyloid-beta
- AD
Alzheimer’s disease
- ApoE
Apolipoprotein E
- ART
Artifact Detection Tool
- BNT
Boston Naming Test
- BOLD
Blood-oxygen-level dependent
- DSB
Digit Span Backward
- DSF
Digit Span Forward
- ETH
Swiss Federal Institute of Technology
- FC
Functional connectivity
- FDR
False discovery rate
- fMRI
Functional magnetic resonance imaging
- MANOVA
Multivariate analysis of variance
- MMSE
Mini-Mental State Examination
- MRI
Magnetic resonance imaging
- PCA
Principal component analysis
- PET
Positron emission tomography
- PiB
Pittsburgh Compound-B
- QSM
Quantitative susceptibility mapping
- SD
Standard deviation
- SNR
Signal to noise ratio
- T
Tesla
- TE
Echo time
- TMT
Trail Making Test
- TR
Repetition time
- VLMT
Verbal Learning and Memory Test
Contributor Information
Frances C. Quevenco, Email: qfrances@student.ethz.ch
Maria G. Preti, Email: maria.preti@epfl.ch
Jiri M. G. van Bergen, Email: jiri.vanbergen@uzh.ch
Jun Hua, Email: jhua@mri.jhu.edu.
Michael Wyss, Email: wyss@biomed.ee.ethz.ch.
Xu Li, Email: xuli@mri.jhu.edu.
Simon J. Schreiner, Email: simon.j.schreiner@gmail.com
Stefanie C. Steininger, Email: st.steininger@gmx.at
Rafael Meyer, Email: rafael.meyer@bli.uzh.ch.
Irene B. Meier, Email: meierirene@hotmail.com
Adam M. Brickman, Email: amb2139@cumc.columbia.edu
Sandra E. Leh, Email: sandra.leh-seal@bli.uzh.ch
Anton F. Gietl, Email: anton.gietl@irem.uzh.ch
Alfred Buck, Email: Fred.Buck@usz.ch.
Roger M. Nitsch, Email: roger.nitsch@irem.uzh.ch
Klaas P. Pruessmann, Email: pruessmann@biomed.ee.ethz.ch
Peter C. M. van Zijl, Email: pvanzijl@mri.jhu.edu
Christoph Hock, Email: christoph.hock@irem.uzh.ch.
Dimitri Van De Ville, Email: dimitri.vandeville@epfl.ch.
Paul G. Unschuld, Phone: +41443891453, Email: paul.unschuld@uzh.ch
References
- 1.Prince M, Bryce R, Albanese E, Wimo A, Ribeiro W, Ferri CP. The global prevalence of dementia: a systematic review and meta-analysis. Alzheimers Dement. 2013;9(1):63–75. doi: 10.1016/j.jalz.2012.11.007. [DOI] [PubMed] [Google Scholar]
- 2.Alzheimer A. About a peculiar disease of the cortex. Gen J Psychiatry Psychiatr Leg Med. 1907;64(1-2):146–8.
- 3.Serrano-Pozo A, Frosch MP, Masliah E, Hyman BT. Neuropathological alterations in Alzheimer disease. Cold Spring Harb Perspect Med. 2011;1(1):a006189. doi: 10.1101/cshperspect.a006189. [DOI] [PMC free article] [PubMed] [Google Scholar]
- 4.Ayton S, Faux NG, Bush AI. Alzheimer’s Disease Neuroimaging I. Ferritin levels in the cerebrospinal fluid predict Alzheimer’s disease outcomes and are regulated by APOE. Nat Commun. 2015;6:6760. doi: 10.1038/ncomms7760. [DOI] [PMC free article] [PubMed] [Google Scholar]
- 5.Bartzokis G, Sultzer D, Mintz J, et al. In vivo evaluation of brain iron in Alzheimer’s disease and normal subjects using MRI. Biol Psychiatry. 1994;35(7):480–7. doi: 10.1016/0006-3223(94)90047-7. [DOI] [PubMed] [Google Scholar]
- 6.Liu B, Moloney A, Meehan S, et al. Iron promotes the toxicity of amyloid beta peptide by impeding its ordered aggregation. J Biol Chem. 2011;286(6):4248–56. doi: 10.1074/jbc.M110.158980. [DOI] [PMC free article] [PubMed] [Google Scholar]
- 7.Meadowcroft MD, Connor JR, Smith MB, Yang QX. MRI and histological analysis of beta-amyloid plaques in both human Alzheimer’s disease and APP/PS1 transgenic mice. J Magn Reson Imaging. 2009;29(5):997–1007. doi: 10.1002/jmri.21731. [DOI] [PMC free article] [PubMed] [Google Scholar]
- 8.van Bergen JM, Li X, Hua J, et al. Colocalization of cerebral iron with amyloid beta in mild cognitive impairment. Sci Rep. 2016;6:35514. doi: 10.1038/srep35514. [DOI] [PMC free article] [PubMed] [Google Scholar]
- 9.Wood H. Alzheimer disease: iron—the missing link between ApoE and Alzheimer disease? Nat Rev Neurol. 2015;11(7):369. doi: 10.1038/nrneurol.2015.96. [DOI] [PubMed] [Google Scholar]
- 10.Albert MS. Changes in cognition. Neurobiol Aging. 2011;32(Suppl 1):S58–63. doi: 10.1016/j.neurobiolaging.2011.09.010. [DOI] [PMC free article] [PubMed] [Google Scholar]
- 11.Elias MF, Beiser A, Wolf PA, Au R, White RF, D’Agostino RB. The preclinical phase of Alzheimer disease: a 22-year prospective study of the Framingham Cohort. Arch Neurol. 2000;57(6):808–13. doi: 10.1001/archneur.57.6.808. [DOI] [PubMed] [Google Scholar]
- 12.Fabrigoule C, Rouch I, Taberly A, et al. Cognitive process in preclinical phase of dementia. Brain. 1998;121(Pt 1):135–41. doi: 10.1093/brain/121.1.135. [DOI] [PubMed] [Google Scholar]
- 13.Small BJ, Herlitz A, Fratiglioni L, Almkvist O, Backman L. Cognitive predictors of incident Alzheimer’s disease: a prospective longitudinal study. Neuropsychology. 1997;11(3):413–20. doi: 10.1037/0894-4105.11.3.413. [DOI] [PubMed] [Google Scholar]
- 14.Sperling RA, Aisen PS, Beckett LA, et al. Toward defining the preclinical stages of Alzheimer’s disease: recommendations from the National Institute on Aging-Alzheimer’s Association workgroups on diagnostic guidelines for Alzheimer’s disease. Alzheimers Dement. 2011;7(3):280–92. doi: 10.1016/j.jalz.2011.03.003. [DOI] [PMC free article] [PubMed] [Google Scholar]
- 15.Dubois B, Hampel H, Feldman HH, et al. Preclinical Alzheimer’s disease: definition, natural history, and diagnostic criteria. Alzheimers Dement. 2016;12(3):292–323. doi: 10.1016/j.jalz.2016.02.002. [DOI] [PMC free article] [PubMed] [Google Scholar]
- 16.Bertram L, Lill CM, Tanzi RE. The genetics of Alzheimer disease: back to the future. Neuron. 2010;68(2):270–81. doi: 10.1016/j.neuron.2010.10.013. [DOI] [PubMed] [Google Scholar]
- 17.Corder EH, Saunders AM, Strittmatter WJ, et al. Gene dose of apolipoprotein E type 4 allele and the risk of Alzheimer’s disease in late onset families. Science. 1993;261(5123):921–3. doi: 10.1126/science.8346443. [DOI] [PubMed] [Google Scholar]
- 18.Huang XT, Qian ZM, He X, et al. Reducing iron in the brain: a novel pharmacologic mechanism of huperzine A in the treatment of Alzheimer’s disease. Neurobiol Aging. 2014;35(5):1045–54. doi: 10.1016/j.neurobiolaging.2013.11.004. [DOI] [PubMed] [Google Scholar]
- 19.Liu CC, Kanekiyo T, Xu H, Bu G. Apolipoprotein E and Alzheimer disease: risk, mechanisms and therapy. Nat Rev Neurol. 2013;9(2):106–18. doi: 10.1038/nrneurol.2012.263. [DOI] [PMC free article] [PubMed] [Google Scholar]
- 20.Ward A, Crean S, Mercaldi CJ, et al. Prevalence of apolipoprotein E4 genotype and homozygotes (APOE e4/4) among patients diagnosed with Alzheimer’s disease: a systematic review and meta-analysis. Neuroepidemiology. 2012;38(1):1–17. doi: 10.1159/000334607. [DOI] [PubMed] [Google Scholar]
- 21.Klunk WE, Engler H, Nordberg A, et al. Imaging brain amyloid in Alzheimer’s disease with Pittsburgh Compound-B. Ann Neurol. 2004;55(3):306–19. doi: 10.1002/ana.20009. [DOI] [PubMed] [Google Scholar]
- 22.Mathis CA, Wang Y, Holt DP, Huang GF, Debnath ML, Klunk WE. Synthesis and evaluation of 11C-labeled 6-substituted 2-arylbenzothiazoles as amyloid imaging agents. J Med Chem. 2003;46(13):2740–54. doi: 10.1021/jm030026b. [DOI] [PubMed] [Google Scholar]
- 23.Jagust WJ, Landau SM, Shaw LM, et al. Relationships between biomarkers in aging and dementia. Neurology. 2009;73(15):1193–9. doi: 10.1212/WNL.0b013e3181bc010c. [DOI] [PMC free article] [PubMed] [Google Scholar]
- 24.Ossenkoppele R, Jansen WJ, Rabinovici GD, et al. Prevalence of amyloid PET positivity in dementia syndromes: a meta-analysis. JAMA. 2015;313(19):1939–49. doi: 10.1001/jama.2015.4669. [DOI] [PMC free article] [PubMed] [Google Scholar]
- 25.Lorenzi M, Donohue M, Paternico D, et al. Enrichment through biomarkers in clinical trials of Alzheimer’s drugs in patients with mild cognitive impairment. Neurobiol Aging. 2010;31(8):1443–51. doi: 10.1016/j.neurobiolaging.2010.04.036. [DOI] [PubMed] [Google Scholar]
- 26.Deistung A, Schafer A, Schweser F, Biedermann U, Turner R, Reichenbach JR. Toward in vivo histology: a comparison of quantitative susceptibility mapping (QSM) with magnitude-, phase-, and R2*-imaging at ultra-high magnetic field strength. Neuroimage. 2013;65:299–314. doi: 10.1016/j.neuroimage.2012.09.055. [DOI] [PubMed] [Google Scholar]
- 27.Langkammer C, Schweser F, Krebs N, et al. Quantitative susceptibility mapping (QSM) as a means to measure brain iron? A post mortem validation study. Neuroimage. 2012;62(3):1593–9. doi: 10.1016/j.neuroimage.2012.05.049. [DOI] [PMC free article] [PubMed] [Google Scholar]
- 28.Li X, Vikram DS, Lim IA, Jones CK, Farrell JA, van Zijl PC. Mapping magnetic susceptibility anisotropies of white matter in vivo in the human brain at 7 T. Neuroimage. 2012;62(1):314–30. doi: 10.1016/j.neuroimage.2012.04.042. [DOI] [PMC free article] [PubMed] [Google Scholar]
- 29.van Bergen JMG, Hua J, Unschuld PG, et al. Quantitative susceptibility mapping suggests altered brain iron in premanifest Huntington’s disease. Am J Neuroradiol. 2015. In press. doi:10.3174/ajnr.A4617. [DOI] [PMC free article] [PubMed]
- 30.Ogawa S, Lee TM, Kay AR, Tank DW. Brain magnetic resonance imaging with contrast dependent on blood oxygenation. Proc Natl Acad Sci U S A. 1990;87(24):9868–72. doi: 10.1073/pnas.87.24.9868. [DOI] [PMC free article] [PubMed] [Google Scholar]
- 31.Worsley KJ, Poline JB, Vandal AC, Friston KJ. Tests for distributed, nonfocal brain activations. Neuroimage. 1995;2(3):183–94. doi: 10.1006/nimg.1995.1024. [DOI] [PubMed] [Google Scholar]
- 32.Donahue MJ, Hoogduin H, Smith SM, et al. Spontaneous blood oxygenation level-dependent fMRI signal is modulated by behavioral state and correlates with evoked response in sensorimotor cortex: a 7.0-T fMRI study. Hum Brain Mapp. 2011;33:511–22. [DOI] [PMC free article] [PubMed]
- 33.Donahue MJ, Hoogduin H, van Zijl P, Jezzard P, Luijten PR, Hendrikse J. Blood oxygenation level-dependent (BOLD) total and extravascular signal changes and dR2* in human visual cortex at 1.5, 3.0 and 7.0 T. NMR Biomed. 2010;23:1–11. doi: 10.1002/nbm.1497. [DOI] [PubMed] [Google Scholar]
- 34.Lenglet C, Abosch A, Yacoub E, De Martino F, Sapiro G, Harel N. Comprehensive in vivo mapping of the human basal ganglia and thalamic connectome in individuals using 7T MRI. PLoS One. 2012;7(1):e29153. doi: 10.1371/journal.pone.0029153. [DOI] [PMC free article] [PubMed] [Google Scholar]
- 35.Theysohn N, Qin S, Maderwald S, et al. Memory-related hippocampal activity can be measured robustly using FMRI at 7 tesla. J Neuroimaging. 2013;23(4):445–51. doi: 10.1111/jon.12036. [DOI] [PubMed] [Google Scholar]
- 36.Hua J, Qin Q, van Zijl PC, Pekar JJ, Jones CK. Whole-brain three-dimensional T2-weighted BOLD functional magnetic resonance imaging at 7 Tesla. Magn Reson Med. 2014;72(6):1530–40. doi: 10.1002/mrm.25055. [DOI] [PMC free article] [PubMed] [Google Scholar]
- 37.Friston KJ, Frith CD, Liddle PF, Frackowiak RS. Functional connectivity: the principal-component analysis of large (PET) data sets. J Cereb Blood Flow Metab. 1993;13(1):5–14. doi: 10.1038/jcbfm.1993.4. [DOI] [PubMed] [Google Scholar]
- 38.Buckner RL, Snyder AZ, Shannon BJ, et al. Molecular, structural, and functional characterization of Alzheimer’s disease: evidence for a relationship between default activity, amyloid, and memory. J Neurosci. 2005;25(34):7709–17. doi: 10.1523/JNEUROSCI.2177-05.2005. [DOI] [PMC free article] [PubMed] [Google Scholar]
- 39.Greicius MD, Srivastava G, Reiss AL, Menon V. Default-mode network activity distinguishes Alzheimer’s disease from healthy aging: evidence from functional MRI. Proc Natl Acad Sci U S A. 2004;101(13):4637–42. doi: 10.1073/pnas.0308627101. [DOI] [PMC free article] [PubMed] [Google Scholar]
- 40.Toussaint PJ, Maiz S, Coynel D, et al. Characteristics of the default mode functional connectivity in normal ageing and Alzheimer’s disease using resting state fMRI with a combined approach of entropy-based and graph theoretical measurements. Neuroimage. 2014;101:778–86. doi: 10.1016/j.neuroimage.2014.08.003. [DOI] [PubMed] [Google Scholar]
- 41.Schreiner SJ, Liu X, Gietl AF, et al. Regional fluid-attenuated inversion recovery (FLAIR) at 7 Tesla correlates with amyloid beta in hippocampus and brainstem of cognitively normal elderly subjects. Front Aging Neurosci. 2014;6:240. doi: 10.3389/fnagi.2014.00240. [DOI] [PMC free article] [PubMed] [Google Scholar]
- 42.Allen EA, Damaraju E, Plis SM, Erhardt EB, Eichele T, Calhoun VD. Tracking whole-brain connectivity dynamics in the resting state. Cereb Cortex. 2014;24(3):663–76. doi: 10.1093/cercor/bhs352. [DOI] [PMC free article] [PubMed] [Google Scholar]
- 43.Chang C, Glover GH. Time-frequency dynamics of resting-state brain connectivity measured with fMRI. Neuroimage. 2010;50(1):81–98. doi: 10.1016/j.neuroimage.2009.12.011. [DOI] [PMC free article] [PubMed] [Google Scholar]
- 44.Handwerker DA, Roopchansingh V, Gonzalez-Castillo J, Bandettini PA. Periodic changes in fMRI connectivity. Neuroimage. 2012;63(3):1712–9. doi: 10.1016/j.neuroimage.2012.06.078. [DOI] [PMC free article] [PubMed] [Google Scholar]
- 45.Leonardi N, Richiardi J, Gschwind M, et al. Principal components of functional connectivity: a new approach to study dynamic brain connectivity during rest. Neuroimage. 2013;83:937–50. doi: 10.1016/j.neuroimage.2013.07.019. [DOI] [PubMed] [Google Scholar]
- 46.Seeley WW, Crawford RK, Zhou J, Miller BL, Greicius MD. Neurodegenerative diseases target large-scale human brain networks. Neuron. 2009;62(1):42–52. doi: 10.1016/j.neuron.2009.03.024. [DOI] [PMC free article] [PubMed] [Google Scholar]
- 47.Sheline YI, Raichle ME, Snyder AZ, et al. Amyloid plaques disrupt resting state default mode network connectivity in cognitively normal elderly. Biol Psychiatry. 2010;67(6):584–7. doi: 10.1016/j.biopsych.2009.08.024. [DOI] [PMC free article] [PubMed] [Google Scholar]
- 48.Sperling RA, Laviolette PS, O’Keefe K, et al. Amyloid deposition is associated with impaired default network function in older persons without dementia. Neuron. 2009;63(2):178–88. doi: 10.1016/j.neuron.2009.07.003. [DOI] [PMC free article] [PubMed] [Google Scholar]
- 49.Buckner RL, Sepulcre J, Talukdar T, et al. Cortical hubs revealed by intrinsic functional connectivity: mapping, assessment of stability, and relation to Alzheimer’s disease. J Neurosci. 2009;29(6):1860–73. doi: 10.1523/JNEUROSCI.5062-08.2009. [DOI] [PMC free article] [PubMed] [Google Scholar]
- 50.Elman JA, Madison CM, Baker SL, et al. Effects of beta-amyloid on resting state functional connectivity within and between networks reflect known patterns of regional vulnerability. Cereb Cortex. 2016;26(2):695–707. doi: 10.1093/cercor/bhu259. [DOI] [PMC free article] [PubMed] [Google Scholar]
- 51.Gietl AF, Warnock G, Riese F, et al. Regional cerebral blood flow estimated by early PiB uptake is reduced in mild cognitive impairment and associated with age in an amyloid-dependent manner. Neurobiol Aging. 2015;36:1619–28 [DOI] [PubMed]
- 52.World_Medical_Association Declaration of Helsinki. Law Med Health Care. 1991;19(3–4):264–5. [PubMed] [Google Scholar]
- 53.Steininger SC, Liu X, Gietl A, et al. Cortical amyloid beta in cognitively normal elderly adults is associated with decreased network efficiency within the cerebro-cerebellar system. Front Aging Neurosci. 2014;6:52. doi: 10.3389/fnagi.2014.00052. [DOI] [PMC free article] [PubMed] [Google Scholar]
- 54.Folstein MF, Folstein SE, McHugh PR. “Mini-mental state”. A practical method for grading the cognitive state of patients for the clinician. J Psychiatr Res. 1975;12(3):189–98. doi: 10.1016/0022-3956(75)90026-6. [DOI] [PubMed] [Google Scholar]
- 55.Härting C, Markowitsch HJ, Neufeld H, Calabrese P, Diesinger K, Kessler J. Wechsler Memory Test—Revised version (WMS-R). Bern: Huber; 2000.
- 56.Helmstaedter C, Durwen HF. The Verbal Learning and Retention Test. A useful and differentiated tool in evaluating verbal memory performance. Schweiz Arch Neurol Psychiatr. 1990;141(1):21–30. [PubMed] [Google Scholar]
- 57.Nicholas LE, Brookshire RH, MacLennan DL, Schumacher JG, Porrazzo SA. The Boston Naming Test: revised administration and scoring procedures and normative information for non-brain-damaged adults. Clinical Aphasiology. 1988;18:103–15. [Google Scholar]
- 58.Thalmann B, Monsch AU, Bernasconi F, et al. CERAD—Consortium to Establish a Registry for Alzheimer’s Disease Assessment Battery—deutsche Fassung. Basel: Geriatrische Universitätsklinik; 1997. [Google Scholar]
- 59.Tombaugh TN. Trail Making Test A and B: normative data stratified by age and education. Arch Clin Neuropsychol. 2004;19(2):203–14. doi: 10.1016/S0887-6177(03)00039-8. [DOI] [PubMed] [Google Scholar]
- 60.Marques JP, Kober T, Krueger G, van der Zwaag W, Van de Moortele PF, Gruetter R. MP2RAGE, a self bias-field corrected sequence for improved segmentation and T1-mapping at high field. Neuroimage. 2010;49(2):1271–81. doi: 10.1016/j.neuroimage.2009.10.002. [DOI] [PubMed] [Google Scholar]
- 61.Richiardi J, Gschwind M, Simioni S, Annoni JM, Greco B, Hagmann P, Schluep M, Vuilleumier P, Van De Ville D. Classifying minimally disabled multiple sclerosis patients from resting state functional connectivity. NeuroImage. 2012;62:2021–2033. doi: 10.1016/j.neuroimage.2012.05.078. [DOI] [PubMed] [Google Scholar]
- 62.Chao-Gan Y, Yu-Feng Z. DPARSF: a MATLAB toolbox for “pipeline” data analysis of resting-state fMRI. Front Syst Neurosci. 2010;4:13. doi: 10.3389/fnsys.2010.00013. [DOI] [PMC free article] [PubMed] [Google Scholar]
- 63.Tzourio-Mazoyer N, Landeau B, Papathanassiou D, et al. Automated anatomical labeling of activations in SPM using a macroscopic anatomical parcellation of the MNI MRI single-subject brain. Neuroimage. 2002;15(1):273–89. doi: 10.1006/nimg.2001.0978. [DOI] [PubMed] [Google Scholar]
- 64.Leonardi N, Van De Ville D. On spurious and real fluctuations of dynamic functional connectivity during rest. Neuroimage. 2015;104:430–6. doi: 10.1016/j.neuroimage.2014.09.007. [DOI] [PubMed] [Google Scholar]
- 65.Krishnan A, Williams LJ, McIntosh AR, Abdi H. Partial least squares (PLS) methods for neuroimaging: a tutorial and review. Neuroimage. 2011;56(2):455–75. doi: 10.1016/j.neuroimage.2010.07.034. [DOI] [PubMed] [Google Scholar]
- 66.Schonemann PH. On two-sided orthogonal Procrustes problems. Psychometrika. 1968;33(1):19–33. doi: 10.1007/BF02289673. [DOI] [PubMed] [Google Scholar]
- 67.Sporns O. Networks of the brain. Cambridge: MIT Press; 2011. pp. 9–17. [Google Scholar]
- 68.Holm S. A simple sequentially rejective Bonferroni test procedure. Scand J Stat. 1979;6:65–70. [Google Scholar]
- 69.Storey JD. A direct approach to false discovery rates. J R Statist Soc B. 2002;64(3):479–98. doi: 10.1111/1467-9868.00346. [DOI] [Google Scholar]
- 70.Cohen J. Statistical power analysis for the behavioral sciences. 2. Mahwah: Lawrence Erlbaum Associates; 1988. [Google Scholar]
- 71.Mintun MA, Larossa GN, Sheline YI, et al. [11C]PIB in a nondemented population: potential antecedent marker of Alzheimer disease. Neurology. 2006;67(3):446–52. doi: 10.1212/01.wnl.0000228230.26044.a4. [DOI] [PubMed] [Google Scholar]
- 72.Jack CR, Jr, Lowe VJ, Senjem ML, et al. 11C PiB and structural MRI provide complementary information in imaging of Alzheimer’s disease and amnestic mild cognitive impairment. Brain. 2008;131(Pt 3):665–80. doi: 10.1093/brain/awm336. [DOI] [PMC free article] [PubMed] [Google Scholar]
- 73.Frisoni GB, Bocchetta M, Chetelat G, et al. Imaging markers for Alzheimer disease: which vs how. Neurology. 2013;81(5):487–500. doi: 10.1212/WNL.0b013e31829d86e8. [DOI] [PMC free article] [PubMed] [Google Scholar]
- 74.Sorg C, Riedl V, Muhlau M, et al. Selective changes of resting-state networks in individuals at risk for Alzheimer’s disease. Proc Natl Acad Sci U S A. 2007;104(47):18760–5. doi: 10.1073/pnas.0708803104. [DOI] [PMC free article] [PubMed] [Google Scholar]
- 75.Nyberg L, Lovden M, Riklund K, Lindenberger U, Backman L. Memory aging and brain maintenance. Trends Cogn Sci. 2012;16(5):292–305. doi: 10.1016/j.tics.2012.04.005. [DOI] [PubMed] [Google Scholar]
- 76.Schaie KW. When does age-related cognitive decline begin? Salthouse again reifies the cross-sectional fallacy. Neurobiol Aging. 2009;30(4):528–9. doi: 10.1016/j.neurobiolaging.2008.12.012. [DOI] [PMC free article] [PubMed] [Google Scholar]
- 77.Machulda MM, Pankratz VS, Christianson TJ, et al. Practice effects and longitudinal cognitive change in normal aging vs. incident mild cognitive impairment and dementia in the Mayo Clinic Study of Aging. Clin Neuropsychol. 2013;27(8):1247–64. doi: 10.1080/13854046.2013.836567. [DOI] [PMC free article] [PubMed] [Google Scholar]
- 78.Fox MD, Snyder AZ, Vincent JL, Corbetta M, Van Essen DC, Raichle ME. The human brain is intrinsically organized into dynamic, anticorrelated functional networks. Proc Natl Acad Sci U S A. 2005;102(27):9673–8. doi: 10.1073/pnas.0504136102. [DOI] [PMC free article] [PubMed] [Google Scholar]
- 79.Damoiseaux JS, Rombouts SA, Barkhof F, et al. Consistent resting-state networks across healthy subjects. Proc Natl Acad Sci U S A. 2006;103(37):13848–53. doi: 10.1073/pnas.0601417103. [DOI] [PMC free article] [PubMed] [Google Scholar]
- 80.Albert MS, DeKosky ST, Dickson D, et al. The diagnosis of mild cognitive impairment due to Alzheimer’s disease: recommendations from the National Institute on Aging-Alzheimer’s Association workgroups on diagnostic guidelines for Alzheimer’s disease. Alzheimers Dement. 2011;7(3):270–9. doi: 10.1016/j.jalz.2011.03.008. [DOI] [PMC free article] [PubMed] [Google Scholar]
- 81.Altamura S, Muckenthaler MU. Iron toxicity in diseases of aging: Alzheimer’s disease, Parkinson’s disease and atherosclerosis. J Alzheimers Dis. 2009;16(4):879–95. doi: 10.3233/JAD-2009-1010. [DOI] [PubMed] [Google Scholar]
- 82.De Reuck JL, Deramecourt V, Auger F, et al. Iron deposits in post-mortem brains of patients with neurodegenerative and cerebrovascular diseases: a semi-quantitative 7.0 T magnetic resonance imaging study. Eur J Neurol. 2014;21(7):1026–31. doi: 10.1111/ene.12432. [DOI] [PubMed] [Google Scholar]
- 83.Jellinger KA. The relevance of metals in the pathophysiology of neurodegeneration, pathological considerations. Int Rev Neurobiol. 2013;110:1–47. doi: 10.1016/B978-0-12-410502-7.00002-8. [DOI] [PubMed] [Google Scholar]
- 84.Kruer MC. The neuropathology of neurodegeneration with brain iron accumulation. Int Rev Neurobiol. 2013;110:165–94. doi: 10.1016/B978-0-12-410502-7.00009-0. [DOI] [PMC free article] [PubMed] [Google Scholar]
- 85.Nunez MT, Urrutia P, Mena N, Aguirre P, Tapia V, Salazar J. Iron toxicity in neurodegeneration. Biometals. 2012;25(4):761–76. doi: 10.1007/s10534-012-9523-0. [DOI] [PubMed] [Google Scholar]
- 86.Chuang JY, Lee CW, Shih YH, Yang T, Yu L, Kuo YM. Interactions between amyloid-beta and hemoglobin: implications for amyloid plaque formation in Alzheimer’s disease. PLoS One. 2012;7(3):e33120. doi: 10.1371/journal.pone.0033120. [DOI] [PMC free article] [PubMed] [Google Scholar]
- 87.Grundke-Iqbal I, Fleming J, Tung YC, Lassmann H, Iqbal K, Joshi JG. Ferritin is a component of the neuritic (senile) plaque in Alzheimer dementia. Acta Neuropathol. 1990;81(2):105–10. doi: 10.1007/BF00334497. [DOI] [PubMed] [Google Scholar]
- 88.Ill-Raga G, Ramos-Fernandez E, Guix FX, et al. Amyloid-beta peptide fibrils induce nitro-oxidative stress in neuronal cells. J Alzheimers Dis. 2010;22(2):641–52. doi: 10.3233/JAD-2010-100474. [DOI] [PubMed] [Google Scholar]
- 89.Jagust WJ, Mormino EC. Lifespan brain activity, beta-amyloid, and Alzheimer’s disease. Trends Cogn Sci. 2011;15(11):520–6. doi: 10.1016/j.tics.2011.09.004. [DOI] [PMC free article] [PubMed] [Google Scholar]
- 90.Becerril-Ortega J, Bordji K, Freret T, Rush T, Buisson A. Iron overload accelerates neuronal amyloid-beta production and cognitive impairment in transgenic mice model of Alzheimer’s disease. Neurobiol Aging. 2014;35(10):2288–301. doi: 10.1016/j.neurobiolaging.2014.04.019. [DOI] [PubMed] [Google Scholar]
- 91.Bush AI. The metal theory of Alzheimer’s disease. J Alzheimers Dis. 2013;33(Suppl 1):S277–81. doi: 10.3233/JAD-2012-129011. [DOI] [PubMed] [Google Scholar]
- 92.Villemagne VL, Pike KE, Chetelat G, et al. Longitudinal assessment of Abeta and cognition in aging and Alzheimer disease. Ann Neurol. 2011;69(1):181–92. doi: 10.1002/ana.22248. [DOI] [PMC free article] [PubMed] [Google Scholar]
- 93.Mormino EC, Betensky RA, Hedden T, et al. Synergistic effect of beta-amyloid and neurodegeneration on cognitive decline in clinically normal individuals. JAMA Neurol. 2014;71(11):1379–85. doi: 10.1001/jamaneurol.2014.2031. [DOI] [PMC free article] [PubMed] [Google Scholar]
Associated Data
This section collects any data citations, data availability statements, or supplementary materials included in this article.
Data Availability Statement
This article does not include data on nucleotide sequences, protein sequences, mass spectrometry, structures and assays, microarray data, computational modeling or plasmids, which would be available in a public repository.