ABSTRACT
Legionella pneumophila causes waterborne infections resulting in severe pneumonia. High-resolution genotyping of L. pneumophila isolates can be achieved by multiple-locus variable-number tandem-repeat analysis (MLVA). Recently, we found that different MLVA genotypes of L. pneumophila dominated different sites in a small drinking-water network, with a genotype-related temperature and abundance regime. The present study focuses on understanding the temperature-dependent growth kinetics of the genotypes that dominated the water network. Our aim was to model mathematically the influence of temperature on the growth kinetics of different environmental and clinical L. pneumophila genotypes and to compare it with the influence of their ecological niches. Environmental strains showed a distinct temperature preference, with significant differences among the growth kinetics of the three studied genotypes (Gt4, Gt6, and Gt15). Gt4 strains exhibited superior growth at lower temperatures (25 and 30°C), while Gt15 strains appeared to be best adapted to relatively higher temperatures (42 and 45°C). The temperature-dependent growth traits of the environmental genotypes were consistent with their distribution and temperature preferences in the water network. Clinical isolates exhibited significantly higher growth rates and reached higher maximal cell densities at 37°C and 42°C than the environmental strains. Further research on the growth preferences of L. pneumophila clinical and environmental genotypes will result in a better understanding of their ecological niches in drinking-water systems as well as in the human body.
IMPORTANCE Legionella pneumophila is a waterborne pathogen that threatens humans in developed countries. The bacteria inhabit natural and man-made freshwater environments. Here we demonstrate that different environmental L. pneumophila genotypes have different temperature-dependent growth kinetics. Moreover, Legionella strains that belong to the same species but were isolated from environmental and clinical sources possess adaptations for growth at different temperatures. These growth preferences may influence the bacterial colonization at specific ecological niches within the drinking-water network. Adaptations for growth at human body temperatures may facilitate the abilities of some L. pneumophila strains to infect and cause illness in humans. Our findings may be used as a tool to improve Legionella monitoring in drinking-water networks. Risk assessment models for predicting the risk of legionellosis should take into account not only Legionella concentrations but also the temperature-dependent growth kinetics of the isolates.
KEYWORDS: Legionella pneumophila, MLVA-8 genotyping, MLVA, genotype, temperature, growth curve, growth kinetics, mathematical models, lag phase, log phase, stationary phase
INTRODUCTION
Species of the genus Legionella are motile Gram-negative rod-shaped bacteria that can be found around the globe in a variety of natural and man-made freshwater environments (1). Legionella can be found in water environments as free-living bacteria, in a culturable or viable-but-nonculturable (VBNC) state, or in an intracellular form inside protozoa such as amoebae, where it can survive and proliferate (2). Legionella pneumophila is the causative agent of legionellosis and gives rise to two clinical syndromes in humans. These are Legionnaires' disease, a severe form of pneumonia, and Pontiac fever, a self-limited flu-like illness. Legionella infections in humans occur as a result of inhalation of aerosols containing bacteria (3). Currently, the genus Legionella comprises 59 species, of which half have been correlated with pathogenicity in humans (4). L. pneumophila has been reported as responsible for over 84% of reported legionellosis cases worldwide, with a fatality rate of 5 to 10% (5–7). Recent studies have shown that highly significant differences in disease incidence among Legionella species and even serogroups belonging to the same species may be due to their different virulence potentials for humans (8–10). Although there is a vast amount of data regarding Legionella pneumophila epidemiology genotyping and pathogenicity, studies on the ecology and growth conditions of these fastidious bacteria remain scarce.
Growth temperature is an environmental factor of particular relevance to pathogens such as legionellae, which can experience a wide range of temperatures in the environment (11, 12). L. pneumophila has been isolated from water with a temperature range between 5.7 and 63°C (13). It is considered to proliferate at temperatures between 25 and 45°C, with an optimal growth temperature of 35 ± 2°C (14). Several studies have reported that the virulence of L. pneumophila is temperature dependent. L. pneumophila's ability to cause illness has been shown to increase considerably when it is cultivated at temperatures between 37 and 42°C (15, 16). Since L. pneumophila enters human lungs directly from the environment, a thorough understanding of its ecology outside the human body, especially in drinking-water supply systems, is important for designing efficient prevention measures.
Multilocus variable-number tandem-repeat analysis (using 8 loci [MLVA-8]) genotyping is a method based on the variability found in some tandemly repeated DNA sequences which represent sources of genetic polymorphism (minisatellites) (17, 18). Genotyping is epidemiologically important for recognizing the sources of infections and is needed to track L. pneumophila strains from the environment to clinical material or isolates from specific patients or, more importantly, to identify outbreak strains (18). Recent work by our group (19) showed that to obtain insight into the ecological traits of L. pneumophila in drinking-water systems, the level of genotypes (analyzed by MLVA-8: see below) has to be addressed. In a yearly survey, we (19) demonstrated that different sites along a water network were dominated by different genotypes (for more details, see Fig. 7 in the study by Rodriguez-Martinez et al. [19] and Table 1 in the current article).
TABLE 1.
Legionella genotype occurrence and environmental parameters measured in a drinking-water system in northern Israela
| Sampling pointb | MLVA genotypec | Prevalence (%) | Temp (°C) | pH | Conductivity (mS/cm)d | Chlorine (mg/liter) |
|---|---|---|---|---|---|---|
| A | Gt15 | 86 | 45.1 ± 5.04 | 7.57 ± 0.14 | 1.05 ± 0.04 | 0.13 ± 0.12 |
| C | Gt4 | 100 | 19.23 ± 3.05 | 7.59 ± 0.07 | 1.02 ± 0.07 | 0.01 ± 0.003 |
| D | Gt4 | 88 | 20.85 ± 5.19 | 7.75 ± 0.21 | 0.97 ± 0.13 | 0.15 ± 0.04 |
| E | Gt6 | 100 | 35.59 ± 6.16 | 8.36 ± 0.28 | 0.97 ± 0.06 | 0.12 ± 0.02 |
| F | Gt6 | 100 | 23.83 ± 4.25 | 7.62 ± 0.32 | 1.03 ± 0.2 | 0.05 ± 0.01 |
| G | Gt6 | 100 | 21.58 ± 4.86 | 7.70 ± 0.29 | 1.02 ± 0.1 | 0.41 ± 0.18 |
Data are from reference 19.
The selected sampling points in the drinking-water system covered the water route in the sampled zone. Point A was the point closest to where the drinking water entered the sampling area, and points C to G followed the water course.
Strains belonging to these three genotypes were examined in the present study. Gt4 and Gt6 strains were classified as serogroup 1, while Gt15 strains were classified as serogroup 3.
Millisiemens per centimeter.
Analysis of environmental and microbiological parameters at the sites of Legionella isolation of the three dominant genotypes (Gt4, Gt6, and Gt15) (Table 1) demonstrated that they could be addressed as different ecotypes with very distinct temperature and abundance ranges at the sites of their occurrence (for more details, see Table 6 in reference 19). Sites with the lowest temperature range (∼21°C) harbored Gt4 and had Legionella counts of up to 1 or 2 orders of magnitude higher than Legionella counts at the other sites. Gt15 was dominant at sites with high temperatures (45°C) but with lower Legionella counts than at the other sites (19). This effect of temperature on the survival, growth, and prevalence of the different genotypes at the different drinking-water distribution sites (Table 1) deserves extensive investigation and was addressed in the present study.
Here we analyzed the influence of temperature on the growth kinetics of 20 L. pneumophila strains representative of the three dominant genotypes isolated from the water network by Rodríguez-Martínez et al. (19). Twelve clinical strains isolated from sputum samples from pneumonia patients were also included. All strains were genotyped using MLVA-8. The growth characteristics of the different genotypes from clinical and environmental sources were studied at six different temperatures from 25 to 48°C. Mathematical models were fitted to the results, allowing the calculation of each strain's lag-phase length, maximal specific growth rate, and maximal cell density at each studied temperature. Our findings may improve our understanding of the ecology, physiology, and pathogenicity potential of L. pneumophila strains in drinking water.
RESULTS
The total set of 32 studied L. pneumophila strains comprised 20 environmental and 12 clinical strains (see Table S1 in the supplemental material). The studied environmental strains represent a subset of the strains belonging to the three genotypes that dominated a water network in northern Israel and belonged to MLVA-8 genotypes (Gt) 4, 6, and 15 (19) (Table 1). The clinical strains were genotyped in the present study. Six of them were identified as belonging to Gt4 and Gt6, so they could be compared with the respective environmental strains. The remaining six clinical strains represented a diverse set of genotypes not retrieved previously from our sampled water network (Gt19, Gt20, Gt22, and Gt24). All strains except those of Gt15 were classified as serogroup 1. Gt15 strains were classified as serogroup 3.
Temperature-dependent growth characterization of the total set of strains.
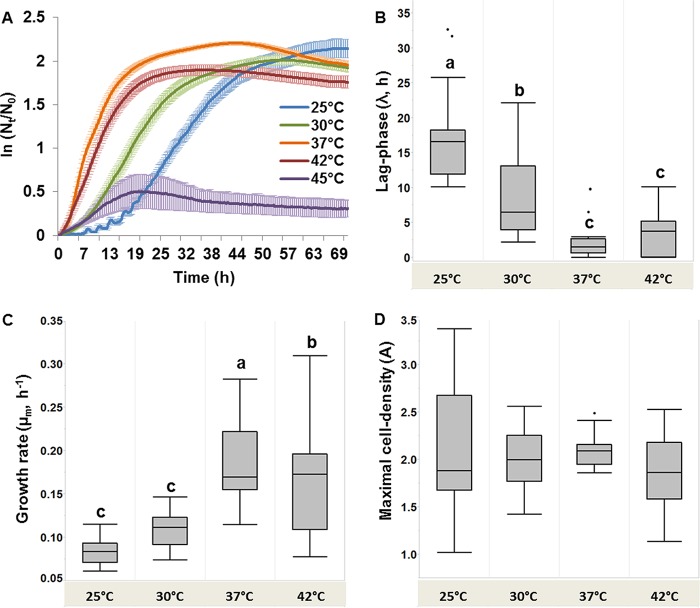
All studied strains (n = 32) proliferated at temperatures of 25 to 42°C (Fig. 1A). Only the Gt15 strains (n = 6) proliferated at 45°C, and no growth was observed at 48°C for any strain. Thus, the growth at 45 and 48°C could not be modeled. Maximal growth rates (μm), lengths of lag phase (λ), and maximal cell densities (A) were derived from the best-fitted model for each strain at each temperature (Table S2).
FIG 1.
(A) L. pneumophila growth curves representing the ln(Nt/N0) average ± standard error values for all analyzed strains (n = 32) at five different temperatures; (B) box plot representing the distributions of lag-phase lengths (λ, hours) at different temperatures (n = 32); (C) box plot representing the distributions of maximal specific growth rates (μm, hours−1) at different temperatures (n = 32); (D) box plot representing the distributions of maximal cell densities (A) (n = 32). Box plot values were derived from the fitted model for each of the L. pneumophila strains analyzed at each of the studied temperatures (see Table S2 in the supplemental material). Boxes with different letters at the top indicate significant differences by repeated-measures ANOVA tests and Tukey's HSD post hoc test with a confidence level of 95%.
Significant differences were found between the lag-phase lengths at different temperatures (analysis of variance [ANOVA]; n = 32, F3,127 = 70.4, P < 0.001). Post hoc tests (Tukey's honest significant difference test [HSD]) revealed that the lag phase was significantly shorter at 37°C and 42°C at 3.38 h and 2.12 h, respectively, compared with 25°C at 16.7 h on average (Fig. 1B). Maximal specific growth rates were also significantly higher at 37°C and 42°C than at 25°C and 30°C (n = 32, F3,127 = 45.2, P < 0.001). Growth rates were highest at 37°C (Fig. 1C). Maximal cell densities were not significantly different across temperatures, but variation among values was noticeably high at 25°C. The highest maximal cell density with the lowest variations was observed at 37°C (Fig. 1D). In sum, for the “average strain” of the total set of L. pneumophila strains, the optimal growth temperature was 37°C with a short lag phase, high growth rates, and high cell densities at the stationary phase.
Growth characteristics of the studied clinical versus environmental strains.
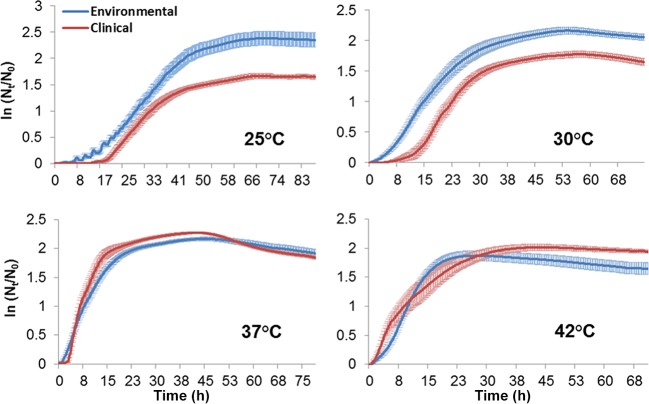
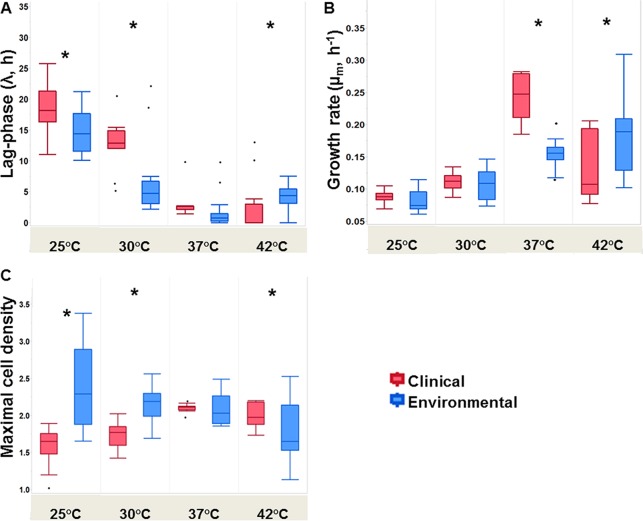
Environmental strains exhibited a superior capability for growth at the lower temperatures (25 and 30°C) than did clinical strains (Fig. 2). This trend seemed to change at 37°C, where the two curves overlapped and clinical strains reached higher relative values. The same phenomenon recurred at 42°C, where clinical strains seemed to have an advantage in growth capability over environmental strains. Student's t test revealed that clinical and environmental strains of L. pneumophila differed significantly in lag-phase length. It was significantly longer for the clinical isolates at lower temperatures (25 and 30°C, t30 = 2.22 and 3.74, respectively; P < 0.05), but at 42°C, lag phase of clinical isolates was significantly shorter than that of environmental isolates (t30 = 2.01, P < 0.05). Lag phases at 37°C showed no significant differences in length (Fig. 3A). Maximal specific growth rates were not significantly different at the lower temperatures (25 and 30°C). Clinical strains exhibited significantly higher growth rates at 37°C (Fig. 3B) (t30 = 8.89, P < 0.01). In contrast, growth rates of environmental strains were significantly higher at 42°C (t30 = 2.6, P < 0.05). Also, environmental strains reached significantly higher cell densities at the lower temperatures (25 and 30°C, t30 = 4.96 and 5.3, respectively; P < 0.01). The clinical strains reached significantly higher cell densities at 42°C (t30 = 2.71, P < 0.05). Maximal cell densities did not differ significantly at 37°C, although the environmental strains had a considerably larger measure of variation than the clinical strains (Fig. 3C). Principal-component analysis (PCA) conducted for all growth parameters at all studied temperatures (except 45 and 48°C) showed two main isolate clusters. Isolates of the same source (clinical or environmental) clustered together and formed two distinct homogeneous clusters with minimal overlap of distribution confidence intervals between them (Fig. 4). In addition, analysis of similarities (ANOSIM) revealed significant differences between L. pneumophila clinical and environmental isolates in total growth characteristics (R = 0.492, P < 0.001).
FIG 2.
Growth curves representing the ln(Nt/N0) average ± standard error values of environmental (n = 20, blue curves) and clinical (n = 12, red curves) L. pneumophila isolates at different temperatures (25, 30, 37, and 42°C).
FIG 3.
Box plots representing the growth characteristic values of clinical (n = 12) and environmental (n = 20) L. pneumophila strains at different temperatures. (A) Lag-phase lengths (λ, hours); (B) maximal specific growth rates (μm, hours−1); (C) maximal cell densities reached. Box plots values were derived from the fitted model for each of the L. pneumophila strains analyzed at each of the studied temperatures (Table S2). Asterisks indicate temperatures at which clinical and environmental strains displayed significantly different values according to Student's t test.
FIG 4.
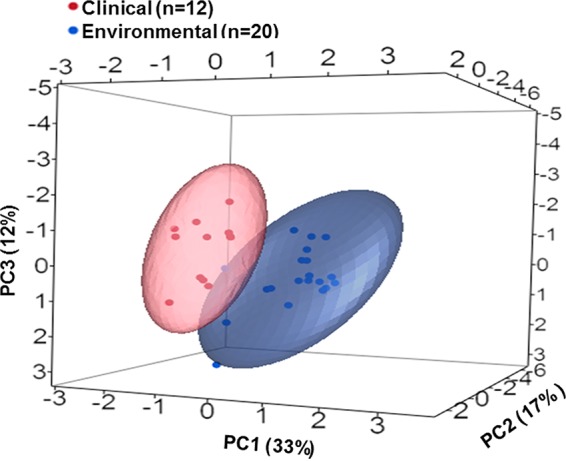
Principal-component analysis (PCA) comparison of growth characteristics of environmental versus clinical L. pneumophila isolates. PCA was conducted on covariance and included the following variables: maximal specific growth rates (μm), lag-phase length (λ), and maximal cell densities at five studied temperatures (25, 30, 37, 42, and 45°C). Ellipses represent the log normal distributions of principal-component values for the clinical (red) and environmental (blue) isolates.
Comparison of growth kinetics of different genotypes.
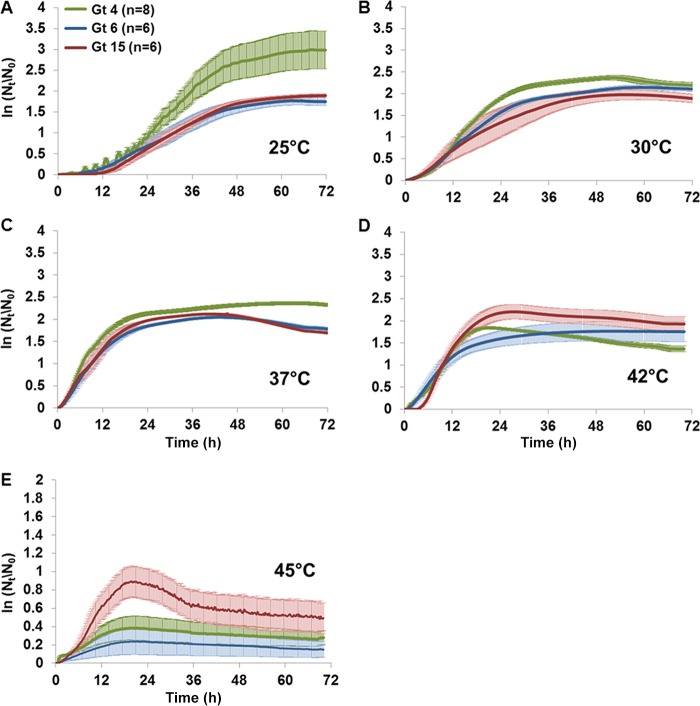
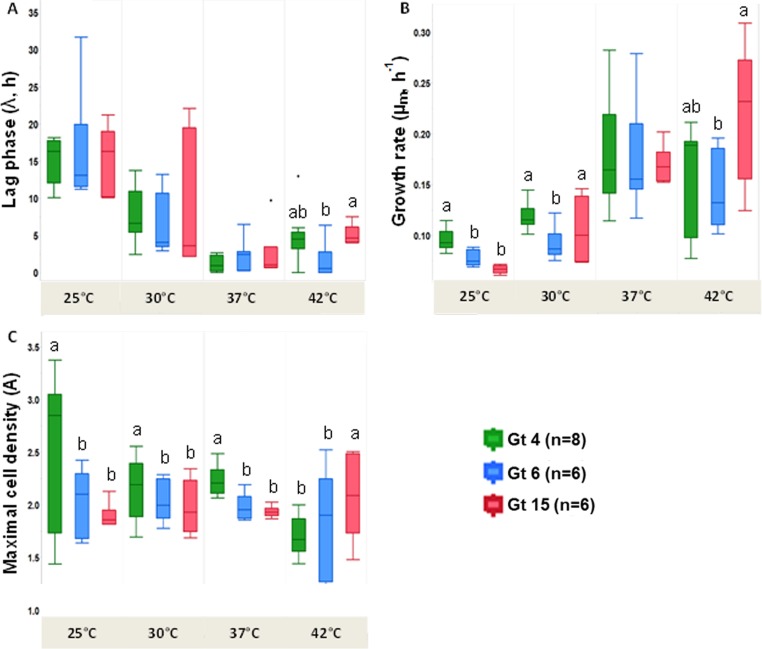
The different genotypes evinced no significant differences in length of lag phase at 25 to 37°C (Fig. 5 and 6A). Maximum specific growth rates of Gt4 strains were significantly higher at 25 and 30°C than those of the other genotypes (one-way ANOVA; F2,25 = 25.8 and 5.2, respectively, P < 0.01). In contrast, the growth rates of Gt15 strains were significantly higher at 42°C than those of Gt4 and Gt6 strains (Fig. 5D and 6B). The different genotypes showed no significant differences in growth rates at 37°C (Fig. 5C and 6B). Gt4 strains reached significantly higher maximal cell densities than did Gt6 and Gt15 strains at 25, 30, and 37°C (one-way ANOVA; F2,25 = 4.1, 5.8, and 16.1, respectively, P < 0.05) (Fig. 6C). In contrast, Gt15 strains reached significantly higher maximal cell densities at 42°C than did Gt4 and Gt6 strains (one-way ANOVA; F2,25 = 6.2, P < 0.05) (Fig. 6C). Only six Gt15 strains proliferated at 45°C (Fig. 5E). None of the studied strains displayed any growth at 48°C. After obtaining the results presented in Fig. 5 and 6, a PCA of the three environmental genotypes was conducted (Fig. 7). Each of the studied genotypes clustered separately, and ANOSIM revealed significant differences in their temperature-dependent growth characteristics (R = 0.373, P < 0.01).
FIG 5.
Growth curves representing the ln(Nt/N0) average ± standard error values of environmental L. pneumophila isolates of the different genotypes at the different temperatures (25, 30, 37, 42, and 45°C).
FIG 6.
Box plots representing the value distributions of the growth curve parameters of environmental L. pneumophila genotypes at different temperatures. (A) Lag phase lengths (λ, hours); (B) maximal specific growth rates (μm, hours−1); (C) maximal cell densities reached. Box plot values were derived from the fitted model for each of the L. pneumophila strains analyzed at each of the studied temperatures (Table S2). Boxes with different letters at the top indicate significant differences by one-way ANOVA tests and Tukey's HSD post hoc test with a confidence level of 95%.
FIG 7.
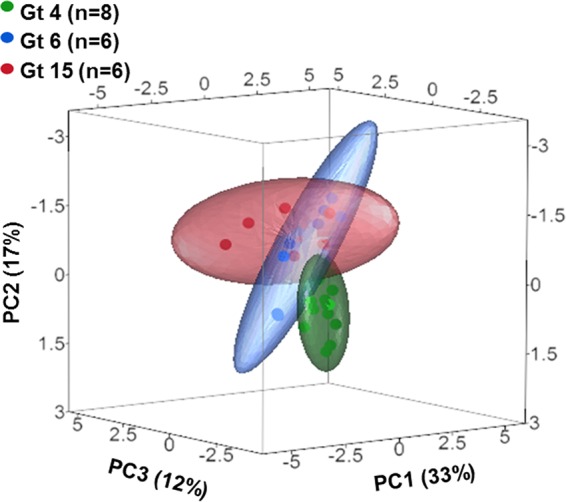
PCA comparison of growth characteristics of the environmental L. pneumophila strains representing three MLVA-8 genotypes. PCA was conducted on covariance and included the following variables: maximal specific growth rates (μm), lag-phase length (λ), and maximal cell densities at five studied temperatures (25, 30, 37, 42, and 45°C). Ellipses represent the log normal distribution of principal-component values for isolates of each of the three environmental genotypes (Gt4, Gt6, and Gt15). Sixty-three percent of the total variance was explained cumulatively by the first three extracted components in both PCAs. The percentage of variance explained by each component is shown in parentheses.
Clinical Gt4 strains versus environmental Gt4 strains.
In the present study, Gt4 was the most abundant genotype among the tested strains. Four clinical strains and eight environmental strains belonged to this genotype. Comparison of the growth parameters of the clinical and environmental Gt4 strains yielded no significant differences in their growth rates and lag-phase lengths at 25°C. In contrast, the environmental Gt4 strains reached significantly higher maximal cell densities at 25 and 30°C (t10 = 11.87 and 4.88, respectively, P < 0.001). In addition, the environmental strains presented significantly shorter lag phases at 30°C (t10 = 3.92, P < 0.01), while the clinical strains displayed significantly higher growth rates at 37°C (t10 = 5.99, P < 0.01). Gt4 clinical strains were also able to reach significantly higher maximal cell densities at 42°C (t10 = 3.68, P < 0.01).
DISCUSSION
Studies of the growth characteristics of bacterial species were once common in microbiological research but are nowadays conducted mainly in the food and biotechnology fields of research (20–23). Smith et al. (24) studied the postantibiotic effect on Legionella growth at 35°C. They used yeast extract broth (YEB) medium to study the growth of L. pneumophila strains and suggested the use of mathematically fitted curves for comparison of the differences in the growth characteristics. Forsbach-Birk et al. (25) demonstrated that reduced expression of the global regulator protein CsrA in L. pneumophila affected the bacterial virulence and growth in Acanthamoeba castellanii. Conza et al. (26) demonstrated that environmental samples with low L. pneumophila counts were enriched after coculturing with amoebae. Nevertheless, the growth characteristics of Legionella genotypes and of clinical and environmental strains have never been painstakingly compared until now.
Although L. pneumophila naturally inhabits freshwater environments, its replication under these conditions is slow and limited by its fastidious nutrient requirements (27–29). When bacterial growth is modeled, the assumption is that all the cells are viable (30); however, in drinking water, L. pneumophila may enter the VBNC state (2, 27). Thus, we used YEB medium, which enables L. pneumophila to replicate up to the stationary phase at a relatively fast pace (72 h), especially compared to its growth in drinking water (weeks or even months) (29, 31).
In the present study, optical density was used as a growth measurement because its feasibility and simplicity are comparable to those of the CFU counting method. The potential differences between optical density at 600 nm (OD600) data (determined in this study) and those from the CFU counting method may be due to the following: (i) the lag phase is longer for viable counts because cells grow in size before dividing into two separate cells and (ii) maximal densities are higher in viable counts than in optical density measurements because the cell size decreases during the stationary phase (30, 32). However, these differences between the two sampling methods are not supposed to have any effect on the comparison between the growth properties of the different analyzed genotypes.
The effect of temperature on L. pneumophila growth was previously discussed in several studies. It was shown that L. pneumophila is able to proliferate on solid medium at temperatures between 25 and 42°C with an optimal growth temperature of 35 ± 2°C (14). Our results concur with these findings and indeed demonstrate that at 37 and 42°C, L. pneumophila had significantly higher growth rates at the logarithmic phase and significantly shorter lag phases than it did at the lower temperatures (Fig. 1). The present study compares growth characteristics of different genotypes and of clinical and environmental L. pneumophila strains belonging to the same and different genotypes. Understanding the temperature-dependent growth characteristics at the genotype level will result in a better understanding of L. pneumophila ecology and the ecological niches specific for the different genotypes.
Clinical versus environmental strains.
The present study demonstrated that clinical and environmental L. pneumophila isolates differ considerably in growth behavior under the experimental conditions used in this study (Fig. 4). While clinical strains displayed maximum growth rate and maximum density at around 37°C, most environmental strains had their highest maximal cell densities at temperatures below 37°C (Fig. 2; see Table S1 in the supplemental material).
Environmental strains had genotype-typical temperature-dependent growth patterns, while the different clinical strains displayed rather similar patterns irrespective of their genotype (Fig. 5 to 7 for the environmental strains; data not shown for the clinical genotypes). Selection within the human body may possibly favor strains better adapted for colonization and proliferation in the human lung environment. This phenomenon can explain similarities in growth behavior of clinical strains, compared to environmental strains, which are exposed to different and changing temperatures in the environment.
In this study, we compared the strain growth characteristics under optimal conditions (YEB rich medium, as previously discussed) and not in drinking water or inside L. pneumophila natural hosts such as amoebae. Nevertheless, it can be hypothesized that environmental strains which possess adaptation for growth at relatively higher temperatures (i.e., are better adapted to temperatures in the range of 37 to 42°C) are the genotypes which more likely have a potential to become infective, and hence pathogenic, for humans. Larger-scale research comparing more isolates from different sources and different genotypes is required to establish a better understanding of the public health hazards posed by the presence of L. pneumophila strains which colonize drinking-water distribution systems.
Environmental genotypes.
Rodriguez-Martinez et al. (19) showed that environmental isolates from a drinking-water system belonged to five different genotypes. Among them, Gt4, Gt6, and Gt15 were dominant at different sampling sites. These sites varied in their environmental characteristics and their Legionella counts (Table 1). Gt4 strains always had the highest Legionella counts (2.5 × 10³ CFU/liter) and were isolated at the lowest environmental temperatures (average, 20.6°C). In contrast, Gt15 strains predominated at much higher temperatures (average, 45.1°C) but were always two magnitudes lower in Legionella counts. Gt6 strains were found at temperatures averaging 27.9°C and with an average abundance of 2.5 × 10² CFU/liter (19). Our laboratory growth curve results presented a similar picture: Gt4 and Gt15 strains grew better at 25°C and 42°C, respectively, than strains of the other genotypes (Fig. 5 and 6). At 45°C, only Gt15 strains showed growth, and indeed strains of this genotype alone were isolated at an average temperature of 45.1°C (19).
Gt4 clinical strains versus Gt4 environmental strains.
L. pneumophila Gt4 can be considered an important environmental and clinical genotype in northern Israel. It was the most abundant in the studied Israeli drinking-water network (19), comprising a 63% fraction of the isolates (39/62 strains); it was the most abundant genotype among the clinical isolates analyzed in the present study (4/12). In addition, Gt4 is of worldwide relevance as a clinical and environmental genotype and comprises many clinical strains, including the reference strain L. pneumophila Paris (19).
In the present study, four Gt4 clinical strains and eight Gt4 environmental strains (Tables S1 and S2) were compared. Growth rates and lag-phase lengths of clinical and environmental Gt4 strains presented no significant differences at 25°C. However, significant differences were detected at 37°C, where clinical Gt4 strains displayed significantly higher growth rates than did environmental Gt4 strains (t10 = 5.99, P < 0.01). Clinical strains were also able to reach significantly higher maximal cell densities at 42°C (t10 = 3.68, P < 0.01).
Most striking were the different temperature-dependent growth kinetics for clinical versus environmental strains with respect to temperature of maximum growth rate and maximum density. All clinical strains had the same temperature (37°C) for the two parameters, while for the environmental strains, the temperature for the maximum growth rate (42°C) exceeded that for the maximum density by 17°C (Table S1). Thus, the environmental strains had a very constant growth behavior characterizing Gt4. In contrast, the clinical strains had growth behavior comparable to that of the other clinical tested strains. The reason for this discrepancy between environmental and clinical strains of the same genotype remains to be elucidated. Comparative genome analyses of clinical and environmental strains are under way and will be investigated with respect to temperature adaptation mechanisms and their potential link to growth behavior and pathogenicity.
Conclusions.
Here we analyzed and modeled the temperature-dependent growth kinetics of a set of strains representing different MLVA-8 genotypes of environmental and clinical origin in Israel.
For the studied environmental genotypes dominating different areas of a water network, a genotype-related temperature-dependent growth behavior was shown under the experimental conditions used. This behavior evinced different degrees of variability in strains of the same genotype, ranging from a highly constant degree (Gt4) to a more variable degree (Gt6). The temperature-growth kinetics was consistent with niches of the genotype in the water network and thus could explain their occurrence and predominance at the different sites. The three MLVA genotypes thus can be regarded as different ecotypes. This genotype-ecotype comparability confirms the earlier statement that genotype level as defined by MLVA-8 is very helpful for the study of the ecology of L. pneumophila in man-made freshwater systems (17, 18, 33).
The growth behaviors of all clinical strains were quite similar, unlike the growth behaviors of the environmental strains, which varied in strains of different genotypes. Besides better adaptation to higher temperature, the most striking feature of the clinical strains was a coincidence of temperature for maximum growth and maximum density, which diverged for most environmental strains.
In sum, the studied strains showed high diversity with respect to the temperature of maximum density that was consistent with the observed environmental niches (Table 1; Fig. 5 and 6). Therefore, the temperature of maximum density may be used as an indicator of the temperature niche of the strain, i.e., the sites in the water network and the human body. Future studies, including pathogenic factors and comparative genome analysis, are needed to explore whether the temperature characteristics are related to pathogenic traits.
MATERIALS AND METHODS
L. pneumophila strains.
Twenty environmental strains were isolated as part of a previous study in northern Israel between coordinates 32°42′43.17″N, 35°6′28.66″E (19). Physiochemical water parameters at each isolation point, as well as prevalence of the different MLVA-8 genotypes, are summarized in Table 1. Twelve clinical strains were isolated from sputum samples of hospitalized pneumonia patients at Poriya and Rambam hospitals in northern Israel between April 2013 and September 2014.
L. pneumophila molecular typing.
Genotyping of the strains was achieved by multilocus variable-number tandem-repeat analysis using eight loci (MLVA-8) as described by Pourcel et al. (17, 18) and Kahlisch et al. (34). Briefly, 1 × 10⁻² ng of DNA template was used in 25-µl PCR mixtures containing 1× Multiplex PCR master mix (Qiagen, Hilden, Germany) and 1.25 pmol of each primer (VIC-, NED-, FAM-, and NET-labeled forward primers from Applied Biosystems, Foster City, CA). After amplification, PCR products were pooled and denatured, and the fragments were sequenced (Applied Biosystems). Each L. pneumophila minisatellite locus (Lpms) was identified by color and assigned a size by GeneMapper software, version 3.7 (Applied Biosystems), by using settings for microsatellite analysis. The final repeat profile was then compared with the MLVA-8 database for Legionella (http://bacterial-genotyping.igmors.u-psud.fr/Legionella2006/help.htm). Results for the environmental strains were reported in detail by Rodríguez-Martínez et al. (19). The 12 clinical isolates were genotyped in the present study accordingly.
Temperature-dependent growth assays.
Twenty environmental and 12 clinical L. pneumophila strains were inoculated in yeast extract broth (YEB) rich medium in cell culture-treated flat-bottom 96-well plates (Corning, USA). The formula per liter of the YEB medium was 10 g of ACES [N-(2-acetamido)-2-aminoethanesulfonic acid] (Sigma, USA), 10 g of yeast extract (Conda, Spain), 1 g of α-ketoglutaric acid (Sigma, USA), 0.4 g of l-cysteine hydrochloride monohydrate (Sigma, USA), 0.25 g of iron(III) pyrophosphate (Sigma, USA), and 1,000 ml of sterile distilled water. The medium was sterilized by filtration using a 0.22-μm-pore-size membrane (Corning, USA). After sterilization, the pH was adjusted to 6.9 ± 0.2. The medium was diluted 1:1 with sterile distilled water before use. All strains were added at a similar starting concentration and volume (0.1 OD600, 100 μl). This concentration (corresponding to approximately 107 cells/ml) ensures adequate densities for accurate optical density measurements, while it is low enough to demonstrate the lag phase of growth. Plates were incubated in a Synergy HT microplate reader (BioTek, USA) at different temperatures (25, 30, 37, 42, 45, and 48°C) for 72 h (or until all strains reached the stationary phase of growth). OD600 values were measured in each well every 15 min (after 15 s of linear shaking). Each strain was incubated in six wells at each of the studied temperatures. A six-well replicate with YEB medium (100 μl, without bacteria) was also added to each plate. These wells were used as both blank values and negative controls.
Temperature read verification.
Independent verification of temperatures reads was conducted with two different devices: a TM-305 single-input thermocouple thermometer (Yi Chun Electrics, China) and a TL1-R digital thermometer (ThermoProbe, USA). For quality control of temperature reads, a 96-well plate with YEB medium (100 μl, without bacteria) was used, and temperature reads were taken from nine wells across the plate. Temperatures were measured with both instruments and compared with the microplate reader temperature output at all studied temperatures and at different incubation times (15 min, 24 h, and 72 h). The average temperature deviation between devices was ±0.1°C.
Data analysis and model fitting.
Raw data analysis was performed as described by Zwietering et al. (35). Average values for blank wells (YEB medium only) were subtracted from values for each of the experimental wells (YEB medium plus Legionella), thus ensuring that OD600 reads expressed the bacterial densities alone (without background “noise” caused by the medium absorbance). Then the natural logarithm of the ratio Nt/N0 was calculated for each of the wells. Finally, average ln(Nt/N0) values were calculated per strain.
Model fitting for each of the bacterial growth curves was performed using four well-established bacterial growth models (35): the logistic, Gompertz, Gompertz exponential, and Richards models (Table 2). Models were fitted to curves using the Grofit package on R (36). Starting values were obtained from a local weighted regression fit (37). Afterwards, mathematical models were fitted to the curve for each isolate at each temperature by the use of nonlinear least-squares fitting of these models (38, 39). Model goodness of fit was tested by the Akaike information criterion (AIC) (40), according to Kahm et al. (36). Lengths of lag phase (λ), maximal specific growth rates (μm), and maximal cell densities (A) were derived from the best-fitted model for each strain at each temperature (Table 2; see Table S2 in the supplemental material).
TABLE 2.
Growth (y) as a function of time (t): model equations and parametersa
Statistical analysis.
All statistical analysis was performed using IBM SPSS 20 and R software. All tests were applied at a 95% level of confidence. Figures were constructed with JMP 11 and Microsoft Office Excel 2010. Repeated-measures ANOVA was applied to determine whether temperature has significant effects on maximal growth rates (μm), lag-phase duration (λ), and maximal densities (A). Student's t tests were used to compare clinical and environmental strains for each growth parameter at each temperature. One-way ANOVA with Tukey's HSD post hoc test were used to compare different genotypes for each growth parameter at each temperature.
PCA.
Principal-component analysis (PCA) provides a two-dimensional representation of a multidimensional data set that facilitates visual cluster identification (41). PCA was conducted on covariance and included the following variables: maximal growth rates (μm), lag-phase duration (λ), and maximal densities (A) at all studied temperatures except 45 to 48°C (i.e., 25, 30, 37, and 42°C). All three variables were normally distributed according to the Shapiro-Wilk test (P > 0.05). Ellipses represent the log normal distribution of principal-component values with a confidence level of 95%.
ANOSIM.
Analysis of similarities (ANOSIM) (42) was used to compare the growth characteristics of the clinical and environmental L. pneumophila isolates as well as different MLVA-8 genotypes. ANOSIM was applied to the following variables: maximal growth rates (μm), lag-phase duration (λ), and maximal densities (A) at 25, 30, 37, and 42°C.
Supplementary Material
ACKNOWLEDGMENTS
This study was supported by a grant from the German Research Foundation (Deutsche Forschungsgemeinschaft [DFG] grant GZ: HO 930/5-2).
We are grateful to Rotem Friedler for technical assistance and to Doron Ben-Gad for fruitful discussions and helpful advice.
We declare no conflicts of interest.
Footnotes
Supplemental material for this article may be found at https://doi.org/10.1128/AEM.03295-16.
REFERENCES
- 1.Abu Kwaik Y, Gao LY, Stone BJ, Venkataraman C, Harb OS. 1998. Invasion of protozoa by Legionella pneumophila and its role in bacterial ecology and pathogenesis. Appl Environ Microbiol 64:3127–3133. [DOI] [PMC free article] [PubMed] [Google Scholar]
- 2.Kirschner AKT. 2016. Determination of viable legionellae in engineered water systems: do we find what we are looking for? Water Res 93:276–288. doi: 10.1016/j.watres.2016.02.016. [DOI] [PMC free article] [PubMed] [Google Scholar]
- 3.Fraser DW, Tsai TR, Orenstein W, Parkin WE, Beecham HJ, Sharrar RG, Harris J, Mallison GF, Martin SM, McDade JE, Shepard CC, Brachman PS. 1977. Legionnaires' disease: description of an epidemic of pneumonia. N Engl J Med 297:1189–1197. doi: 10.1056/NEJM197712012972201. [DOI] [PubMed] [Google Scholar]
- 4.Mercante JW, Winchell JM. 2015. Current and emerging Legionella diagnostics for laboratory and outbreak investigations. Clin Microbiol Rev 28:95–133. doi: 10.1128/CMR.00029-14. [DOI] [PMC free article] [PubMed] [Google Scholar]
- 5.Yu VL, Plouffe JF, Pastoris MC, Stout JE, Schousboe M, Widmer A, Summersgill J, File T, Heath CM, Paterson DL, Chereshsky A. 2002. Distribution of Legionella species and serogroups isolated by culture in patients with sporadic community-acquired legionellosis: an international collaborative survey. J Infect Dis 186:127–128. doi: 10.1086/341087. [DOI] [PubMed] [Google Scholar]
- 6.Cao B, Yao F, Liu X, Feng L, Wang L. 2013. Development of a DNA microarray method for detection and identification of all 15 distinct O-antigen forms of Legionella pneumophila. Appl Environ Microbiol 79:6647–6654. doi: 10.1128/AEM.01957-13. [DOI] [PMC free article] [PubMed] [Google Scholar]
- 7.Marston BJ, Plouffe JF, File TM, Hackman BA, Salstrom S-J, Limpan HB, Kolxzak MS, Breiman RF. 1997. Incidence of community-acquired pneumonia requiring hospitalization. Results of a population-based active surveillance study in Ohio. Ann Intern Med 157:1709–1718. [PubMed] [Google Scholar]
- 8.Doleans A, Aurell H, Reyrolle M, Lina G, Freney J, Vandenesch F, Etienne J, Jarraud S. 2004. Clinical and environmental distributions of Legionella strains in France are different. J Clin Microbiol 42:458–460. doi: 10.1128/JCM.42.1.458-460.2004. [DOI] [PMC free article] [PubMed] [Google Scholar]
- 9.Gomez-Valero L, Rusniok C, Rolando M, Neou M, Dervins-Ravault D, Demirtas J, Rouy Z, Moore RJ, Chen H, Petty NK, Jarraud S, Etienne J, Steinert M, Heuner K, Gribaldo S, Médigue C, Glöckner G, Hartland EL, Buchrieser C. 2014. Comparative analyses of Legionella species identifies genetic features of strains causing Legionnaires' disease. Genome Biol 15:505. doi: 10.1186/s13059-014-0505-0. [DOI] [PMC free article] [PubMed] [Google Scholar]
- 10.Svarrer CW, Lück C, Elverdal PL, Uldum SA. 2012. Immunochromatic kits Xpect Legionella and BinaxNOW Legionella for detection of Legionella pneumophila urinary antigen have low sensitivities for the diagnosis of Legionnaires' disease. J Med Microbiol 61:213–217. doi: 10.1099/jmm.0.035014-0. [DOI] [PubMed] [Google Scholar]
- 11.Maurelli AT. 1989. Temperature regulation of virulence genes in pathogenic bacteria: a general strategy for human pathogens? Microb Pathog 7:1–10. doi: 10.1016/0882-4010(89)90106-X. [DOI] [PubMed] [Google Scholar]
- 12.Zwietering MH, De Koos JT, Hasenack BE, De Witt JC, Van't Riet K. 1991. Modeling of bacterial growth as a function of temperature. Appl Environ Microbiol 57:1094–1101. [DOI] [PMC free article] [PubMed] [Google Scholar]
- 13.Fliermans C. 1996. Ecology of Legionella: from data to knowledge with a little wisdom. Microb Ecol 32:203–228. [DOI] [PubMed] [Google Scholar]
- 14.Katz S, Hammel J. 1987. The effect of drying, heat, and pH on the survival of Legionella pneumophila. Ann Clin Lab Sci 17:150–156. [PubMed] [Google Scholar]
- 15.Edelstein PH, Beer KB, DeBoynton ED. 1987. Influence of growth temperature on virulence of Legionella pneumophila. Infect Immun 55:2701–2705. [DOI] [PMC free article] [PubMed] [Google Scholar]
- 16.Mauchline WS, James BW, Fitzgeorge RB, Dennis PJ, Keevil CW. 1994. Growth temperature reversibly modulates the virulence of Legionella pneumophila. Infect Immun 62:2995–2997. [DOI] [PMC free article] [PubMed] [Google Scholar]
- 17.Pourcel C, Vidgop Y, Ramisse F, Vergnaud G, Tram C. 2003. Characterization of a tandem repeat polymorphism in Legionella pneumophila and its use for genotyping. J Clin Microbiol 41:1819–1826. doi: 10.1128/JCM.41.5.1819-1826.2003. [DOI] [PMC free article] [PubMed] [Google Scholar]
- 18.Pourcel C, Visca P, Afshar B, D'Arezzo S, Vergnaud G, Fry NK. 2007. Identification of variable-number tandem-repeat (VNTR) sequences in Legionella pneumophila and development of an optimized multiple-locus VNTR analysis typing scheme. J Clin Microbiol 45:1190–1199. doi: 10.1128/JCM.02078-06. [DOI] [PMC free article] [PubMed] [Google Scholar]
- 19.Rodríguez-Martínez S, Sharaby Y, Pecellín M, Brettar I, Höfle M, Halpern M. 2015. Spatial distribution of Legionella pneumophila MLVA-genotypes in a drinking water system. Water Res 77:119–132. doi: 10.1016/j.watres.2015.03.010. [DOI] [PubMed] [Google Scholar]
- 20.Huang L. 2013. Optimization of a new mathematical model for bacterial growth. Food Control 32:283–288. doi: 10.1016/j.foodcont.2012.11.019. [DOI] [Google Scholar]
- 21.da Silva NB, Longhi DA, Martins WF, Falcão de Aragão MG, Carciofi BAM. 2017. Modeling the growth of Lactobacillus viridescens under non-isothermal conditions in vacuum-packed sliced ham. Int J Food Microbiol 240:97–101. doi: 10.1016/j.ijfoodmicro.2016.05.014. [DOI] [PubMed] [Google Scholar]
- 22.Zwietering MH, Dewit JC, Cuppers H, Vantriet K. 1994. Modeling of bacterial-growth with shifts in temperature. Appl Environ Microbiol 60:204–213. [DOI] [PMC free article] [PubMed] [Google Scholar]
- 23.Skinner GE, Larkin JW, Rhodehamel EJ. 1994. Mathematical modeling of microbial growth: a review. J Food Saf 14:175–217. doi: 10.1111/j.1745-4565.1994.tb00594.x. [DOI] [Google Scholar]
- 24.Smith RP, Baltch AL, Michelsen PB, Ritz WJ, Alteri R. 2003. Use of the microbial growth curve in postantibiotic effect studies of Legionella pneumophila. Antimicrob Agents Chemother 47:1081–1087. doi: 10.1128/AAC.47.3.1081-1087.2003. [DOI] [PMC free article] [PubMed] [Google Scholar]
- 25.Forsbach-Birk V, McNealy T, Shi C, Lynch D, Marre R. 2004. Reduced expression of the global regulator protein CsrA in Legionella pneumophila affects virulence-associated regulators and growth in Acanthamoeba castellanii. Int J Med Microbiol 294:15–25. doi: 10.1016/j.ijmm.2003.12.003. [DOI] [PubMed] [Google Scholar]
- 26.Conza L, Casati S, Gaia V. 2013. Detection limits of Legionella pneumophila in environmental samples after co-culture with Acanthamoeba polyphaga. BMC Microbiol 13:49. doi: 10.1186/1471-2180-13-49. [DOI] [PMC free article] [PubMed] [Google Scholar]
- 27.Morris GK, Patton CM, Feeley JC, Johnson SE, Gorman G, Martin WT, Skaliy P, Mallison GF, Politi BD, Mackel DC. 1979. Isolation of the Legionnaires' disease bacterium from environmental samples. Ann Intern Med 90:664–666. doi: 10.7326/0003-4819-90-4-664. [DOI] [PubMed] [Google Scholar]
- 28.Feeley JC, Gorman GW, Weaver RE, Mackel DC, Smith HW. 1978. Primary isolation media for Legionnaires disease bacterium. J Clin Microbiol 8:320–325. [DOI] [PMC free article] [PubMed] [Google Scholar]
- 29.Edelstein PH. 1981. Improved semiselective medium for isolation of Legionella pneumophila from contaminated clinical and environmental specimens. J Clin Microbiol 14:298–303. [DOI] [PMC free article] [PubMed] [Google Scholar]
- 30.Monod J. 1949. The growth of bacterial cultures. Annu Rev Microbiol 3:371–394. doi: 10.1146/annurev.mi.03.100149.002103. [DOI] [Google Scholar]
- 31.Ristroph JD, Hedlund KW, Allen RG. 1980. Liquid medium for growth of Legionella pneumophila. J Clin Microbiol 11:19–21. [DOI] [PMC free article] [PubMed] [Google Scholar]
- 32.Madigan MT, Martinko JM, Dunlap PV, Clark DP. 2008. Brock biology of microorganisms, 12th ed Pearson Benjamin Cummings, San Francisco, CA. [Google Scholar]
- 33.Coil DA, Vandersmissen L, Ginevra C, Jarraud S, Lammertyn E, Anné J. 2008. Intragenic tandem repeat variation between Legionella pneumophila strains. BMC Microbiol 8:218. doi: 10.1186/1471-2180-8-218. [DOI] [PMC free article] [PubMed] [Google Scholar]
- 34.Kahlisch L, Henne K, Draheim J, Brettar I, Höfle MG. 2010. High-resolution in situ genotyping of Legionella pneumophila populations in drinking water by multiple-locus variable-number tandem-repeat analysis using environmental DNA. Appl Environ Microbiol 76:6186–6195. doi: 10.1128/AEM.00416-10. [DOI] [PMC free article] [PubMed] [Google Scholar]
- 35.Zwietering MH, Jongenburger I, Rombouts FM, Van't Riet K. 1990. Modeling of the bacterial growth curve. Appl Environ Microbiol 56:1875–1881. [DOI] [PMC free article] [PubMed] [Google Scholar]
- 36.Kahm M, Hasenbrink G, Lichtenberg-Frate H, Ludwig J, Kschischo M. 2010. Grofit: fitting biological growth curves. J Stat Softw 33:1–21.20808728 [Google Scholar]
- 37.Cleveland WS. 1979. Robust locally weighted regression and smoothing scatterplots. J Am Stat Assoc 74:829–836. doi: 10.1080/01621459.1979.10481038. [DOI] [Google Scholar]
- 38.Bates DM, Watts DG. 1988. Nonlinear regression: iterative estimation and linear approximations, p 32–66. In Nonlinear regression analysis and its applications. John Wiley & Sons, Hoboken, NJ. [Google Scholar]
- 39.Bates DM, Chambers J. 1992. Nonlinear models. In Chambers JM, Hastie TJ (ed), Statistical models in S, chapter 10. Chapman and Hall, London, United Kingdom. [Google Scholar]
- 40.Akaike H. 1998. Information theory and an extension of the maximum likelihood principle, p 199–213. In Selected papers of Hirotugu Akaike. Springer, New York, NY. [Google Scholar]
- 41.Jolliffe IT. 2002. Principal component analysis. In Encyclopedia of statistics in behavioral science. John Wiley and Sons, Hoboken, NJ. [Google Scholar]
- 42.Clarke KR. 1993. Non-parametric multivariate analyses of changes in community structure. Aust J Ecol 18:117–143. doi: 10.1111/j.1442-9993.1993.tb00438.x. [DOI] [Google Scholar]
Associated Data
This section collects any data citations, data availability statements, or supplementary materials included in this article.


