Abstract
Nephrotoxicity is a major adverse effect of cisplatin-mediated chemotherapy in cancer patients. The pathogenesis of cisplatin-induced nephrotoxicity remains largely unclear, making it difficult to design effective renoprotective approaches. Here, we have examined the role of microRNAs (miRNAs) in cisplatin-induced nephrotoxicity. We show that cisplatin nephrotoxicity was not affected by overall depletion of both beneficial and detrimental miRNAs from kidney proximal tubular cells in mice in which the miRNA-generating enzyme Dicer had been conditionally knocked out. To identify miRNAs involved in cisplatin nephrotoxicity, we used microarray analysis to profile miRNA expression and identified 47 up-regulated microRNAs and 20 down-regulated microRNAs in kidney cortical tissues. One up-regulated miRNA was miR-375, whose expression was also induced in cisplatin-treated renal tubular cells. Interestingly, inhibition of miR-375 decreased cisplatin-induced apoptosis, suggesting that miR-375 is a cell-damaging or pro-apoptotic agent. Blockade of P53 or NF-κB attenuated cisplatin-induced miR-375 expression, supporting a role of P53 and NF-κB in miR-375 induction. We also identified hepatocyte nuclear factor 1 homeobox B (HNF-1β) as a key downstream target of miR-375. Of note, we further demonstrated that HNF-1β protected renal cells against cisplatin-induced apoptosis. Together, these results suggest that upon cisplatin exposure, P53 and NF-κB collaboratively induce miR-375 expression, which, in turn, represses HNF-1β activity, resulting in renal tubular cell apoptosis and nephrotoxicity.
Keywords: apoptosis, gene regulation, kidney, microRNA (miRNA), P53, cisplatin, kidney, NF-κB, nephrotoxicity
Introduction
Cisplatin is a potent chemotherapy drug widely used for cancer treatment (1, 2). However, cisplatin also induces undesired side effects in normal tissues or organs, especially in the kidney (3–8). Nephrotoxicity or acute kidney injury (AKI)4 occurs in over one quarter of the patients receiving cisplatin treatment and AKI has been reported to be related to the increased mortality in the long-term survivors of these patients (3–7). Years of research has led to the identification of the main signaling pathways that are activated by cisplatin in kidneys and contribute to AKI, such as mitogen-activated protein kinase (MAPK), P53 and related DNA damage response, NF-κB, and other signaling pathways. Activation of these pathways leads to oxidative stresses, inflammation, cell cycle arrest, and cell injury and death (4, 6, 7).
MicroRNAs are a class of endogenously produced, small RNA molecules of 19–25 nucleotides that play important roles in the regulation of gene expression (9–11). In mammalian cells, microRNAs generally bind to the partially complementary sequences at the 3′-untranslated region (3′-UTR) of their target genes to prevent translation and repress target gene expression. MicroRNAs contribute to the regulation of organ development, physiological cellular activities, and pathological processes of disease (9–11). In kidneys, a number of microRNAs have been identified to be essential for renal development and function. Moreover, specific microRNAs have been implicated in the pathogenesis of both acute and chronic kidney diseases (12–15).
In 2010, we (16) demonstrated the induction of miR-34a during cisplatin treatment of mice in vivo and cultured renal tubular cells in vitro, revealing the first evidence of microRNA regulation in cisplatin nephrotoxicity. More recently, Vaidya and colleagues (17) found heightened cisplatin nephrotoxicity in miR155-null mice, suggesting a protective role of this microRNA in this disease. In addition, a series of microRNAs have been identified in urinary samples of cisplatin-treated animals and human patients, which have the potential to become specific and sensitive biomarkers (18–20). Despite these studies, it remains largely unclear how microRNAs regulate cisplatin nephrotoxicity. Especially, the specific microRNAs playing critical roles in the toxicity remain to be discovered and how they mediate kidney cell injury and death is unknown. In this study, we initially showed that depletion of microRNAs by Dicer knock-out from kidney proximal tubular cells did not significantly affect cisplatin nephrotoxicity in mice. To identify the specific microRNAs with pathogenic roles, we then conducted microarray analysis to profile the expression changes of various microRNAs in kidneys during cisplatin nephrotoxicity. miR-375 was verified to be one of the key microRNAs that was induced via P53 and NF-κB. Upon induction, miR-375 targeted HNF-1β to mediate kidney injury during cisplatin nephrotoxicity.
Results
miR-375 Is Up-regulated in in Vivo and in Vitro Models of Cisplatin-induced Nephrotoxicity
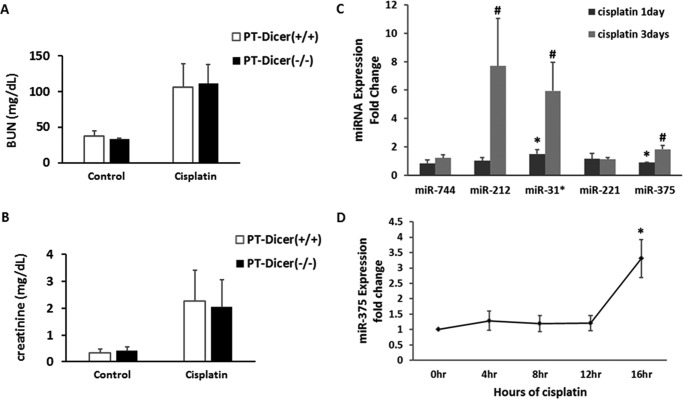
Our initial study tried to determine whether microRNAs as a whole contribute to cisplatin-induced nephrotoxicity. For this purpose, we tested the PT-Dicer−/− mouse model where Dicer (a key enzyme for microRNA biogenesis) was specifically ablated from kidney proximal tubule cells resulting in the depletion of the majority of microRNAs (21). Somewhat surprisingly, PT-Dicer−/− mice and PT-Dicer+/+ mice showed similar degrees of kidney injury following cisplatin treatment. As shown in Fig. 1A, blood urea nitrogen and serum creatinine rose to ∼110 and 2.0 mg/day, respectively, in PT-Dicer−/− mice at day 3 of cisplatin treatment, which was not different from the values of PT-Dicer+/+ mice.
FIGURE 1.
Changes in microRNA expression during cisplatin-induced nephrotoxicity. A and B, microRNA depletion in proximal tubular cells did not significantly affect cisplatin-induced kidney injury in mice. Wild-type and PT-Dicer−/− mice were treated with or without 30 mg/kg of cisplatin for 3 days. Serum samples were evaluated for blood urea nitrogen (BUN) and serum creatinine to indicate the decrease of renal function in cisplatin-treated mice. Data were expressed as mean ± S.D. (n = 3 for each control group; n = 6 for each cisplatin treatment group). C, real-time PCR analysis to verify the consistently increased microRNAs identified in microarray analysis. The fold-change of miR-744, miR-212, miR-31*, miR-221, and miR-375 from cisplatin-treated mouse kidneys were normalized by the value of control; the signal of snoRNA202 was used as internal control. Data were expressed as mean ± S.D. (n = 3); *, p < 0.05 versus control. D, real-time PCR analysis of miR-375 during cisplatin treatment of renal tubular cells. RPTC cells were treated with 20 μm cisplatin for the indicated time to extract total RNAs for quantitative real-time PCR. The significant up-regulation of miR-375 was detected at 16 h of cisplatin treatment. Data were expressed as mean ± S.D. (n = 3); *, p < 0.05 versus 0 h of cisplatin.
Although overall microRNA depletion in PT-Dicer+/+ mice did not affect cisplatin nephrotoxicity, specific microRNAs may still play regulatory roles. We hypothesized that Dicer knock-out did not affect cisplatin nephrotoxicity because both protective and injurious microRNAs were depleted. To identify the specific microRNAs that regulate cisplatin nephrotoxicity, we first analyzed the profile of microRNA expression by microarray analysis. About 330 microRNAs were detected in kidney cortical tissues, among which 67 microRNAs showed significant and consistent changes in expression following cisplatin treatment (Table 1): 47 were induced, whereas 20 decreased. In the induced microRNAs, 7 were transiently up-regulated at day 1 of cisplatin treatment, 8 were induced at day 3, and the others were induced at both time points. In the down-regulated microRNAs, 9 showed a consistent decrease at both days 1 and 3, whereas others showed decrease only at one time point. Among the significantly induced microRNAs, we confirmed the induction of miR-212, miR-31*, and mir-375 by TaqMan real-time PCR analysis (Fig. 1C and data not shown). In addition, we verified the induction of these microRNAs during cisplatin treatment of cultured rat proximal tubular cells (RPTC). The results showed that miR-375 was consistently up-regulated in both in vivo and in vitro cell culture models of cisplatin nephrotoxicity (Fig. 1D).
TABLE 1.
Microarray profiling of microRNA expression during cisplatin nephrotoxicity
Male C57 mice of 8–10 weeks were injected with 30 mg/kg body weight of cisplatin. Total RNA was extracted from kidney cortex and outer medulla for TaqMan microRNA microarray analysis. Log2 fold-changes over the sham operation group were determined for each microRNA in two microarray analyses. The table lists the microRNAs that showed an average fold-changes greater than 1.
| Up-regulated microRNAs |
Down-regulated microRNAs |
|||||||||||||||
|---|---|---|---|---|---|---|---|---|---|---|---|---|---|---|---|---|
| 1 day of cisplatin |
3 days of cisplatin |
Both 1 and 3 days of cisplatin |
1 day of cisplatin |
3 days of cisplatin |
Both 1 and 3 days of cisplatin |
|||||||||||
| miRNAs | Mean of fold | miRNAs | Mean of fold | miRNAs | Mean of fold | miRNAs | Mean of fold | miRNAs | Mean of fold | miRNAs | Mean of fold | miRNAs | Mean of fold | |||
| miR-708 | 3.07 | miR-706 | 4.84 | Day 1 | Day 3 | Day 1 | Day 3 | miR-342–3p | 0.48 | miR-455 | 0.35 | Day 1 | Day 3 | |||
| miR-700 | 2.90 | miR-326 | 4.09 | Let-7e | 1.52 | 1.89 | miR-375 | 1.62 | 3.47 | miR-210 | 0.48 | miR-32 | 0.54 | miR-142–5p | 0.57 | 0.19 |
| miR-127 | 2.22 | miR-223 | 2.36 | Let-7i | 1.64 | 1.60 | miR-34a | 1.52 | 2.29 | miR-672 | 0.49 | miR-700 | 0.38 | miR-192 | 0.82 | 0.72 |
| miR-130a | 2.19 | miR-672 | 3.20 | miR-130b | 3.90 | 1.51 | miR-23b | 1.33 | 1.50 | miR-223 | 0.58 | miR-135b | 0.35 | miR-200b | 0.89 | 0.77 |
| miR-1 | 2.77 | miR-674 | 2.57 | miR-143 | 2.17 | 1.29 | miR-465a-5p | 2.20 | 1.18 | miR-196c | 0.51 | miR-140–3p | 0.37 | miR-203 | 0.65 | 0.64 |
| miR-351 | 4.18 | miR-210 | 2.22 | miR-183 | 9.12 | 8.90 | miR-503 | 1.53 | 7.22 | miR-20b | 0.44 | 0.62 | ||||
| miR-140–3p | 2.27 | miR-214 | 2.47 | miR-21 | 1.38 | 1.96 | miR-532–3p | 1.17 | 1.28 | miR-301a | 0.80 | 0.80 | ||||
| miR-99b# | 2.74 | miR-19a | 1.39 | 1.36 | miR-547 | 13.10 | 3.55 | miR-339–3p | 0.29 | 0.65 | ||||||
| miR-744 | 1.27 | 2.75 | miR-212 | 2.41 | 6.57 | miR-186# | 0.55 | 0.71 | ||||||||
| miR-221 | 1.64 | 2.03 | miR-31# | 3.17 | 9.59 | miR-322 | 0.54 | 0.59 | ||||||||
| miR-27a | 2.40 | 1.76 | miR-190b | 3.85 | 2.39 | |||||||||||
| miR-467e | 3.53 | 4.55 | miR-28–3p | 1.20 | 2.84 | |||||||||||
| miR-143 | 8.29 | 1.29 | miR-744# | 3.30 | 2.06 | |||||||||||
| miR-183# | 5.48 | 4.18 | miR-743a | 3.87 | 11.36 | |||||||||||
Anti-miR-375 LNA Suppresses Cisplatin-induced Apoptosis in RPTC Cells
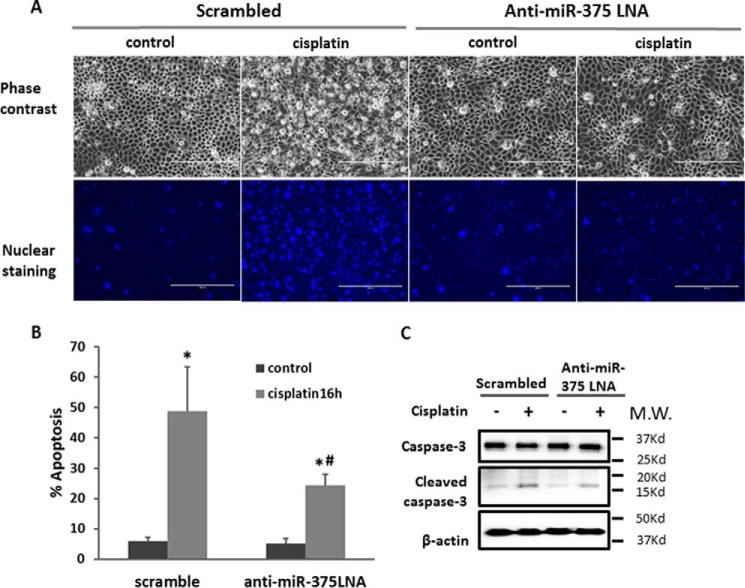
We next examined the role of miR-375 in cisplatin-induced injury of renal proximal tubular epithelial cells using the in vitro model of RPTC cells. Specifically, the effect of miR-375 sequence-based inhibitory locked nucleic acid (anti-miR-375 LNA) was tested. Cisplatin treatment (20 μm, 16 h) induced about 50% apoptosis in scrambled control LNA-transfected RPTC cells. As shown in Fig. 2A, these cells showed typical apoptotic morphology with a shrunken cell body and apoptotic blebbing in phase-contrast images, and condensed and fragmented nucleus as revealed by Hoechst 33342 staining. Notably, anti-miR-375 LNA significantly reduced the apoptosis, to about 25% (Fig. 2, A and B). The morphological observation was verified by immunoblotting analysis of caspase-3 processing or activation, which was obviously attenuated by anti-miR-375 LNA (Fig. 2C). Together, these results suggested that miR-375 may contribute to tubular cell injury and death during cisplatin nephrotoxicity.
FIGURE 2.
Anti-miR-375 LNA suppresses cisplatin-induced apoptosis in RPTC cells. RPTC cells were transfected with 200 nm anti-miR-375 LNA or scrambled sequence LNA, and then treated with or without 20 μm cisplatin for 16 h. A, representative phase-contrast images of cells (scale bar = 200 μm). B, percentage of apoptosis determined by cell counting. Data were expressed as mean ± S.D. (n = 4); *, p < 0.05 versus control; #, p < 0.05 versus cisplatin-treated cells with scramble transfection. C, immunoblot analysis of active/cleaved caspase-3 as a biochemical indication of apoptosis. Whole cell lysate was analyzed for intact and cleaved caspase-3 using β-actin as internal control.
P53 Contributes to miR-375 Induction in Cisplatin Nephrotoxicity
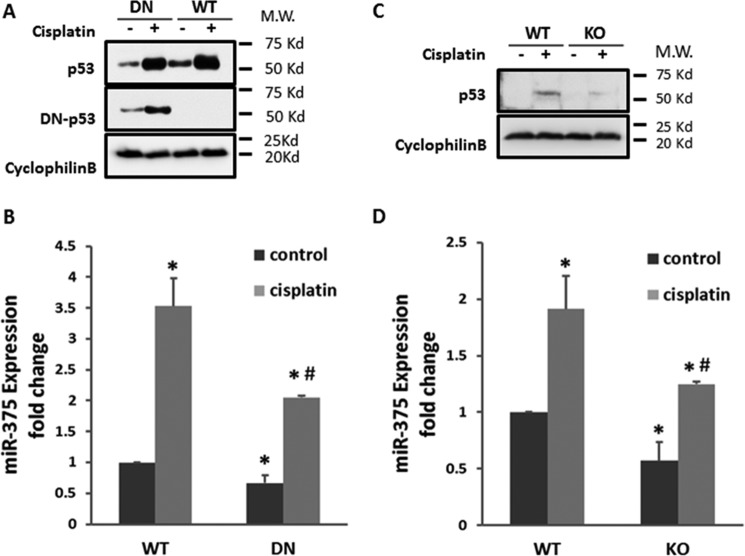
P53 plays a critical role in cisplatin nephrotoxicity mainly by inducing downstream gene expression (22). Our previous study indicates that P53 is significantly induced in cisplatin nephrotoxicity (23), which correlates well with the pattern of mir-375 induction. Thus, to understand the mechanism of miR-375 induction, we first determined the role of P53. To this end, we tested both in vitro and in vivo models of P53 blockade. In vitro, we compared dominant-negative P53 (DN-P53) expressing RPTC cells and wild-type (WT) cells for miR-375 induction. P53 and DN-P53 expression in these cells were first confirmed by immunoblotting (Fig. 3A). Cisplatin treatment led to a 3.5-fold increase of miR-375 expression in wild-type cells, which was reduced to ∼2-fold in DN-P53 cells. Furthermore, in vivo study was conducted using the conditional P53 knock-out mouse model in which P53 was specifically ablated from kidney proximal tubule cells (24). By immunoblotting analysis, we confirmed that P53 was induced by cisplatin in WT mice and the induction was attenuated in P53 knock-out (KO) mice (Fig. 3C). Importantly, cisplatin treatment led to a significant increase of miR-375 in WT mouse kidneys, which was inhibited in KO mouse tissues (Fig. 3D). These results support a role of P53 in miR-375 induction during cisplatin nephrotoxicity. However, our analysis of the gene promoter of miR-375 did not show the presence of a P53 binding site (not shown), suggesting that P53 may contribute to miR-375 induction indirectly.
FIGURE 3.
P53 contributes to miR-375 induction in cisplatin nephrotoxicity. A and B, the dominant-negative mutant P53 (DN) was stably transfected and overexpressed in RPTC cells. The DN or WT cells were treated with or without 20 μm cisplatin for 16 h. A, immunoblot analysis verifying the expression of P53 and DN-P53. Cyclophilin B was used as internal control. B, real-time PCR analysis of miR-375 in DN-53 and WT cells treated with cisplatin for 16 h. Data were expressed as mean ± S.D. (n = 3). *, p < 0.05 versus control; #, p < 0.05 versus WT with cisplatin treatment. C and D, mice with proximal tubule P53 KO or WT were treated with or without 30 mg/kg of cisplatin or comparable volume of saline. C, immunoblot of P53 to verify P53 ablation from KO mice kidneys. Cyclophilin B was used as internal control. D, real-time PCR analysis of miR-375. Total RNA samples were extracted from kidney cortex of WT or PT-P53-KO mice to compare the expression of miR-375 after cisplatin treatment. Data were expressed as mean ± S.D. (n = 3); *, p < 0.05 versus control; #, p < 0.05 versus WT with cisplatin treatment.
NF-κB Mediates miR-375 Induction during Cisplatin Nephrotoxicity
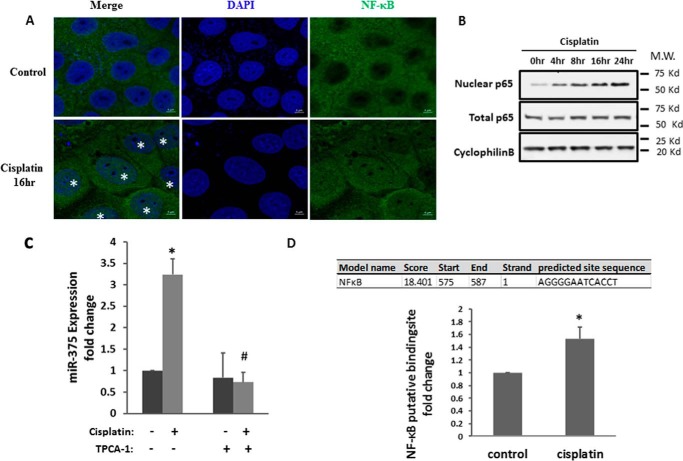
NF-κB is another transcription factor that is activated during cisplatin nephrotoxicity and may play a pathogenic role (25). In addition, NF-κB may regulate multiple microRNAs transcriptionally (26). To test its involvement in miR-375 induction, we first evaluated NF-κB activation during cisplatin treatment of RPTC cells by analyzing its nuclear accumulation. In immunofluorescence staining (Fig. 4A), NF-κB (p65) was localized in the cytosol of most control cells; however, upon cisplatin treatment, many cells showed NF-κB signal in the nucleus. In immunoblot analysis, the total NF-κB (p65) protein level did not change, but the nuclear NF-κB (p-p65) significantly increased after cisplatin treatment (Fig. 4B). We further examined whether the up-regulation of miR-375 depends on NF-κB by testing the effect of TPCA-1, a commonly used inhibitor of NFκB signaling. TPCA-1 is an IκB kinase inhibitor that blocks IκB phosphorylation and consequent degradation, resulting in the accumulation of IκB to inhibit NFκB (27). We first verified that 100 μm TPCA-1 could efficiently suppress IκB kinase phosphorylation and NF-κB (P65) phosphorylation or activation during cisplatin treatment (supplemental Fig. S1). We further showed that TPCA-1 completely blocked miR-375 induction by cisplatin in RPTC cells. Bioinformatics analysis showed the presence of an NF-κB binding site at the gene promoter of miR-375 (Fig. 4D). To verify the binding, we conducted a chromatin immunoprecipitation (ChIP) assay. As shown in Fig. 4D, the predicted NF-κB-binding site showed significantly more NF-κB binding activity in cisplatin-treated cells.
FIGURE 4.
NF-κB mediates the miR-375 induction in cisplatin-induced kidney injury. A, immunofluorescence analysis of nuclear translocation of NF-κB. RPTC cells were treated with or without 20 μm cisplatin for 16 h and then fixed for immunofluorescence staining of NF-κB. Images were collected by laser scanned confocal microscopy. The cell nuclei with NF-κB signal were labeled with asterisks. Scale bar, 5 μm. B, immunoblot of NF-κB. The cells were treated with cisplatin for the indicated time to collect whole cell lysate or nuclear fraction for immunoblot analysis of NF-κB. Cyclophilin B was used as internal control. C, real-time PCR analysis of miR-375 showing the inhibitory effect of TPCA-1. RPTC cells were treated with 100 μm TPCA-1 and then treated with cisplatin. Total RNA samples were extracted after 16 h of cisplatin treatment to quantify the expression of miR-375. Data were expressed as mean ± S.D. (n = 3); *, p < 0.05 versus control; #, p < 0.05 versus cisplatin treatment group. D, the binding of NF-κB to miR-375 promoter DNA with cisplatin treatment. PRTC cells were treated with or without cisplatin for 24 h to collect the chromatin for immunoprecipitation with a specific anti-NF-κB antibody. The immunoprecipated samples were subjected to real-time PCR analysis of miR-375 promoter sequence. Data were expressed as mean ± S.D. (n = 3); *, p < 0.05 versus control.
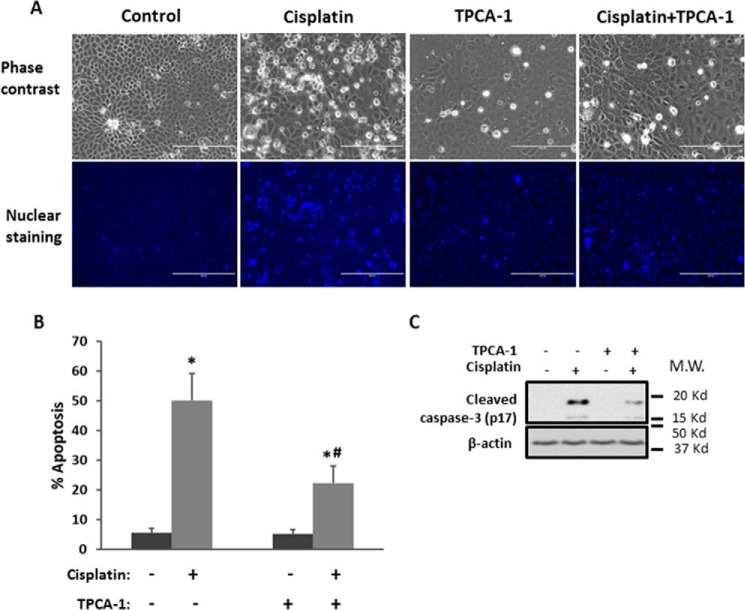
To reveal the functional role of NF-κB in cisplatin injury, we examined the effect of TPCA-1 on RPTC apoptosis. Cisplatin treatment for 16 h induced about 50% of apoptosis in RPTC cells. Notably, TPCA-1 treatment significantly reduced apoptosis as assessed by typical apoptotic morphology (Fig. 5, A and B). Also, as shown in Fig. 5C, TPCA-1 treatment significantly suppressed caspase-3 processing/activation.
FIGURE 5.
Inhibition of NF-κB reduces cisplatin-induced tubular cell apoptosis. RPTC cells were treated with or without 20 μm cisplatin for 16 h in the absence or presence of 100 μm TPCA-1. A, representative images of cellular and nuclear morphologies to show apoptosis. Scale bar, 200 μm. B, percentage of apoptosis by counting apoptotic cells. Data were expressed as mean ± S.D. (n = 6); *, p < 0.05 versus control; #, p < 0.05 versus cisplatin treatment group. C, immunoblot analysis showing the inhibition of caspase-3 cleavage by TPCA-1 during cisplatin treatment. β-Actin was used as internal control.
miR-375 Targets HNF-1β during Cisplatin Treatment
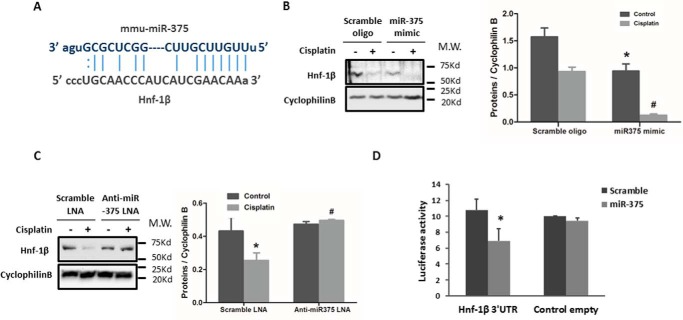
The above studies demonstrated the involvement of both P53 and NF-κB in miR-375 induction during cisplatin nephrotoxicity. We then investigated the downstream mediator(s) of the pro-apoptotic effect of miR-375. By using online databases (MiRanda and Target Scan), we identified a conserved putative miR-375 targeting site in the 3′-UTR of HNF-1β mRNA (Fig. 6A). To determine whether HNF-1β is indeed a target of miR-375, we first examined whether overexpression of miR-375 in RPTC cells would affect HNF-1β expression. As shown in Fig. 6B, the expression of HNF-1β was significantly repressed by the transfection of miR-375 mimics in both control and cisplatin-treated cells compared to the scramble sequence oligo groups. We further observed that inhibition of miR-375 by anti-miR-375 LNA preserved HNF-1β during cisplatin treatment of RPTC cells (Fig. 6C). In PT-Dicer−/− mouse kidneys, miR-375 was among the few microRNAs that were up-regulated (21). Interestingly, PT-Dicer−/− mouse kidneys showed a lower expression of HNF-1β as compared with wild-type kidney tissues (supplemental Fig. S2). To verify the direct targeting of miR-375 on HNF-1β 3′-UTR, we prepared a microRNA Luciferase reporter construct containing the putative miR-375 binding sequence of HNF-1β 3′-UTR. The HNF-1β-3′-UTR constructs or empty vectors were transfected into HEK cells along with miR-375 mimics or scrambled oligonucleotides. miR-375 mimics suppressed the luciferase activity in HNF-1β-miR-375-transfected cells, whereas the scrambled oligo did not (Fig. 6D). Together, these results suggest that HNF-1β is a direct target gene of miR-375.
FIGURE 6.
miR-375 targets HNF-1β during cisplatin treatment. A, the predicted, conserved miR-375 binding site in 3′-UTR of HNF-1β mRNA. B, immunoblot analysis showing the repressive effect of miR-375 on HNF-1β expression. RPTC cells were transfected with miR-375 mimic or scrambled RNA oligo for 24 h and then treated with or without 20 μm cisplatin to collect whole cell lysate for immunoblot analysis of HNF-1β. Cyclophilin B was used as internal control. C, immunoblot analysis showing that anti-miR-375 LNA preserved HNF-1β expression during cisplatin treatment. RPTC cells were transfected with anti-miR-375 LNA or scrambled LNA for 24 h and then treated with or without 20 μm cisplatin. Whole cell lysates were collected for immunoblot analysis of HNF-1β and Cyclophilin B was used as internal control. The blots were quantified by densitometry. D, microRNA target reporter assay of HNF-1β 3′-UTR. The putative miR-375 binding sequence of the HNF-1β 3′-UTR was cloned into the pMIR-REPORT plasmid to analyze luciferase activity after miR-375 mimic transfection, compared to the scramble control. β-gal was co-transfected for normalization. miR-375 mimics transfection only reduced luciferase expression in pMIR-REPORT HNF-1β 3′-UTR sequence. Data were expressed as mean ± S.D. (n = 3); *, p < 0.05 versus empty vector control with scramble transfection.
HNF-1β Is a Cytoprotective Gene in Cisplatin-induced Renal Cell Apoptosis
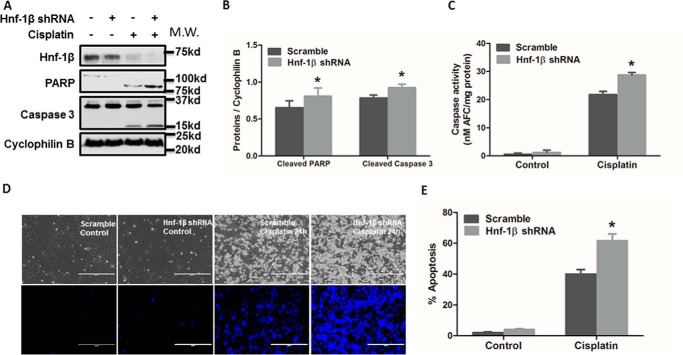
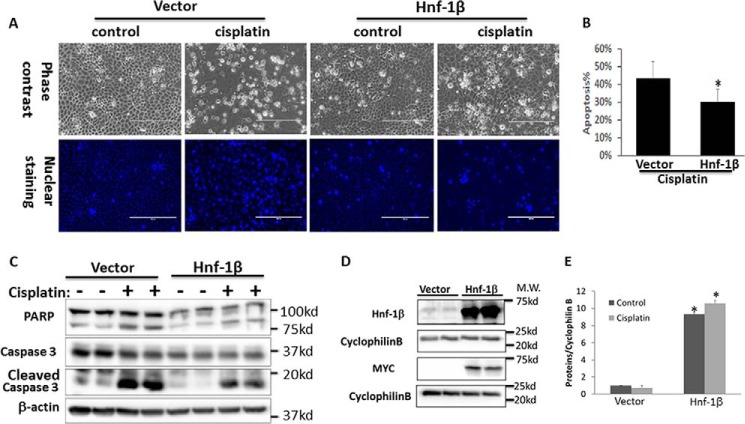
Finally, we examined the possible involvement of HNF-1β in cisplatin-induced apoptosis. HNF-1β shRNAs or scrambled sequence shRNAs were stably transfected and expressed in RPTC cells to generate cell lines for comparison. Immunoblot analysis confirmed the significant decrease of HNF-1β in HNF-1β-shRNA-transfected cells (Fig. 7A). The same samples also showed a higher level of cleavage of PARP and Caspase 3 (biochemical hallmark of apoptosis) during cisplatin treatment in HNF-1β-shRNA-transfected cells than scrambled sequence-transfected cells (Fig. 7, A and B). Consistently, HNF-1β-shRNA-transfected cells also showed higher caspase activity during cisplatin treatment (Fig. 7C). In morphological analysis, cisplatin also induced a higher level of apoptosis in HNF-1β-shRNA cells (Fig. 7D). By cell counting, cisplatin induced 62% apoptosis in HNF-1β-knockdown cells, but only 40% in scrambled sequence-transfected cells (Fig. 7E). Of note, these effects of HNF-1β-knockdown were shown by two targeting shRNAs with different sequences. Collectively, these results show that knockdown of HNF-1β increases the cellular sensitivity to cisplatin-induced apoptosis, suggesting a cytoprotective role of HNF-1β. We further confirmed the cytoprotective role of HNF-1β by overexpression. RPTC cells were transiently transfected with full-length HNF-1β expression plasmids or empty vectors. The transfection efficacy was over 70% (not shown). HNF-1β overexpression significantly reduced cisplatin-induced apoptosis as compared with the empty vector-transfected group (Fig. 8, A and B). The inhibition of apoptosis was also confirmed by immunoblot analysis of PARP1 cleavage and caspase 3 processing (Fig. 8C). We also verified HNF-1β overexpression in transfected cells by immunoblot analysis of HNF-1β and its Myc tag (Fig. 8D). In quantification, HNF-1β expression in HNF-1β-transfected cells was ∼10-fold over that of empty vector-transfected cells (Fig. 8E).
FIGURE 7.
Knockdown of HNF-1β sensitizes cells to cisplatin-induced apoptosis. A, HNF1β, immunoblot analysis of HNF1β, PARP, and Caspase 3. RPTC cells were transfected with an HNF1β shRNA plasmid or Scrambled sequence plasmid containing a hygromycin-resistance cassette. After hygromycin selection, resistant colonies were identified and expanded. The selected cells were incubated with or without cisplatin to collect whole cell lysate for immunoblot analysis of HNF1β, PARP, Caspase 3, and cyclophilin B (internal control). B, quantification of cleaved PARP and cleaved Caspase 3 by densitometry. Data were expressed as mean ± S.D. (n = 3); *, p < 0.05 versus Scramble with cisplatin treatment. C, caspase activity measured by enzymatic assay. Data were expressed as mean ± S.D. (n = 3). *, p < 0.05 versus Scramble with cisplatin treatment. D and E, higher apoptosis induced by cisplatin in HNF1β-knockdown cells. Scramble or HNF1β-shRNA cells were incubated with or without 20 μm cisplatin. The cells were then fixed with 4% paraformaldehyde and stained with Hoechst 33342. D, representative images of cell morphology and nuclear staining of the same fields of cells. Scale bar, 200 μm. E, percentage of cells with typical apoptotic morphology. Data were expressed as mean ± S.D. (n = 3); *, p < 0.05 versus scramble cells treated with cisplatin.
FIGURE 8.
HNF-1β overexpression protects renal tubular cells from cisplatin injury. RPTC cells were transfected with Myc-HNF-1β or empty vector. The cells were then treated with 20 μm cisplatin for 16 h. A, representative images of cell morphology (phase-contrast) and nuclear staining to show apoptosis. B, percentage of apoptosis induced by cisplatin in HNF-1β or empty vector-transfected cells. *, statistically significant different from vector group (p < 0.05, n = 3). C, immunoblot analysis of PARP and caspase 3 cleavage during cisplatin treatment of HNF-1β or empty vector-transfected cells. D, immunoblot analysis of HNF-1β and Myc tag in Myc-HNF-1β or empty vector transfected cells. Cyclophilin B was used as internal loading control. E, densitometry quantification of HNF-1β expression after normalization with cyclophilin B (n = 3, *, p < 0.05 versus empty vector-transfected cells).
Discussion
This study has investigated the regulation of cisplatin-induced nephrotoxicity by microRNAs systematically. We first showed that cisplatin induced similar kidney injury and renal functional loss in PT-Dicer knock-out mice and wild-type mice, suggesting that overall depletion of microRNAs from proximal tubules does not have significant effects on cisplatin nephrotoxicity. To identify the specific microRNAs that regulate cisplatin nephrotoxicity, we then profiled the changes in microRNA expression in kidney tissues by microarray analysis, resulting in the discovery of 47 up-regulated microRNAs and 20 down-regulated microRNAs in cisplatin nephrotoxicity. Among these microRNAs, we selected miR-375 for further investigation in this study because this microRNA showed consistent induction by cisplatin in kidneys and cultured renal tubular cells. Our results show that P53 and NF-κB contribute to miR-375 induction in cisplatin nephrotoxicity. At the downstream, miR-375 can directly target or repress HNF-1β. Functionally, anti-miR-375 LNA protected renal tubular cells against cisplatin-induced apoptosis, suggesting that miR-375 is an injurious microRNA. We further showed evidence that HNF-1β is cytoprotective during cisplatin treatment of RPTC cells. Altogether, these observations support the following scenario: in cisplatin nephrotoxicity, P53 and NF-κB collaboratively induce miR-375, which then represses the cytoprotective gene HNF-1β contributing to renal tubular cell injury and death (Fig. 9).
FIGURE 9.
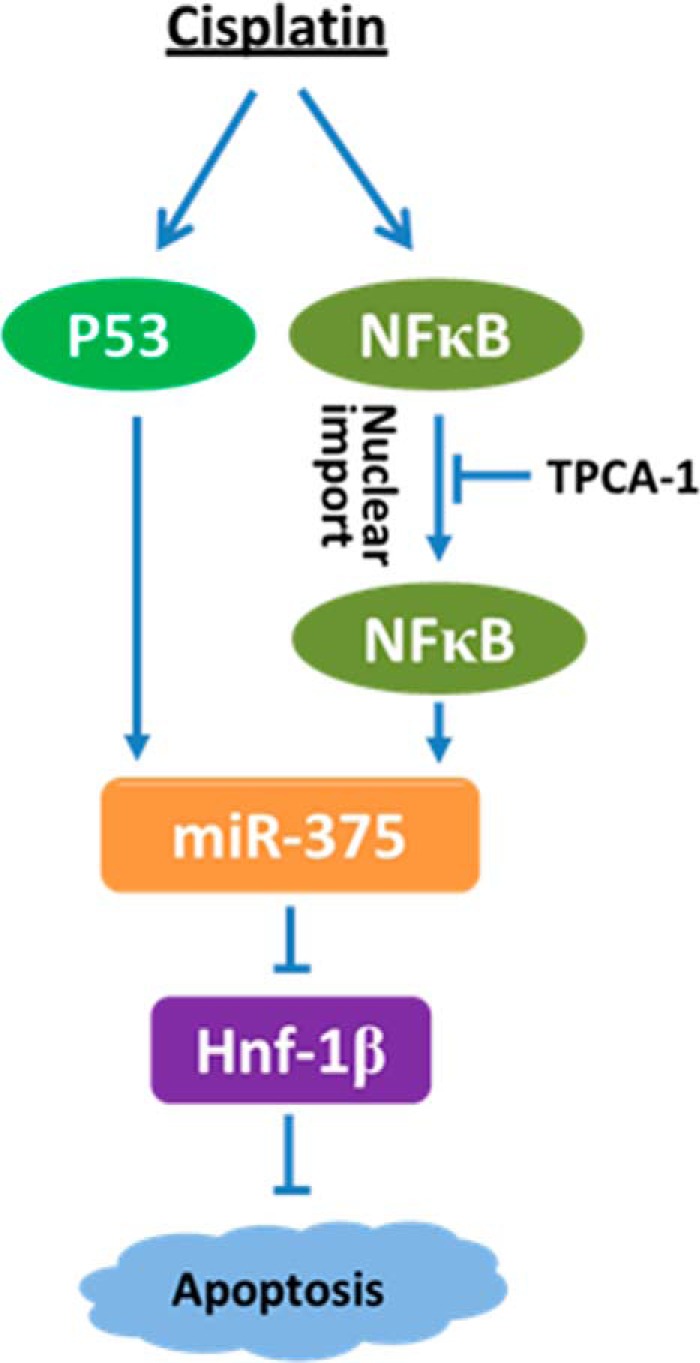
P53/NF-κB/miR-375/HNF-1β pathway in cisplatin-induced apoptosis. Cisplatin treatment induces the activation of P53 and NF-κB, which further induce the expression of miR-375. miR-375 then represses the anti-apoptotic gene HNF-1β to induce apoptosis.
Recent research has implicated microRNAs as a class of new pathogenic factors in cisplatin nephrotoxicity, a major side effect that limits the use and efficacy of chemotherapy in cancer patients. In 2010, we demonstrated the induction of miR-34a via P53 during cisplatin treatment of mice and renal tubular cells, and interestingly, miR-34a was shown to play a cytoprotective role under these conditions (16). More recently, Vaidya and colleagues (17) reported that cisplatin induced more severe AKI in miR-155-deficient mice, suggesting an important role of miR-155 in renoprotection. In addition, multiple microRNAs have been identified to correlate with the development of cisplatin nephrotoxicity and thus have the potential to be diagnostic biomarkers (18, 19). Our current study initially examined the effect of overall depletion of microRNA by using the PT-Dicer KO mouse model (Fig. 1). This experiment provides the first evidence that overall microRNA depletion does not affect cisplatin nephrotoxicity. The observation, however, is at discrepancy with our previous results from the model of ischemic kidney injury where PT-Dicer KO mice showed a remarkable resistance (21). Thus, ischemic and nephrotoxic AKI may be significantly different in terms of the involvement of microRNAs in their pathogenesis. The lack of effect in global microRNA depletion mice does not refute the involvement of specific microRNAs in cisplatin nephrotoxicity; instead, it suggests that some microRNAs may be mediators of kidney injury, whereas others may be protective. Indeed, our microarray analysis revealed changes in the expression of multiple microRNAs in kidney tissues following cisplatin treatment (Fig. 1).
We chose to focus on miR-375 for further mechanistic study, because its induction was verified in both cisplatin-treated mice and cultured proximal tubular cells (Fig. 1). In addition, previous work has suggested a pro-cell death role of this microRNA. For example, Yang and colleagues (28) showed very recently that miR-375 could enhance the anti-tumor effect of cisplatin by inhibiting cell proliferation and inducing apoptosis and cell cycle arrest in hepatocellular carcinoma. However, the role of miR-375 in other tissues or cells was unknown. Our results now demonstrate that anti-miR-375 LNA is cytoprotective during cisplatin treatment of RPTC cells (Fig. 2), suggesting that miR-375 is pro-death not only in cancers but also in normal tissues and cells.
To understand the mechanism of miR-375 induction, we initially focused on P53, a main contributor in cisplatin nephrotoxicity (22, 24). We showed previously that following cisplatin treatment, P53 may trigger apoptotic events in renal tubular cells via the regulation of pro-apoptotic genes, such as PUMA-α (29). Recent research has further suggested that P53 may also regulate a number of non-coding genes, including microRNAs and long noncoding RNAs (30, 31). Several P53-microRNA signaling axis have also been described (32–34) and, in experimental models of cisplatin nephrotoxicity, we demonstrated activation of the P53-miR-34a axis for renal cell survival (16). In the present study, blockade of P53 led to a significant decrease in miR-375 expression during cisplatin treatment of renal tubular cells and kidneys (Fig. 3), supporting the involvement of P53 in cisplatin nephrotoxicity. However, analysis of the miR-375 gene promoter did not reveal the P53-binding sequence or sites, suggesting that regulation of miR-375 by P53 is likely indirect.
What is the transcription factor directly responsible for miR-375 induction in cisplatin nephrotoxicity? Our present study has provided evidence for a direct role of NF-κB. NF-κB is an important transcription factor that mediates inflammation, cell death, survival, proliferation, and differentiation under various conditions (35, 36). NF-κB signaling has also been implicated in cisplatin nephrotoxicity via its inflammatory and apoptosis-regulatory functions (25). In the present study, we demonstrated NF-κB activation during cisplatin treatment of RPTC cells by showing its phosphorylation and accumulation in cell nucleus. Notably, miR-375 induction by cisplatin was diminished by TPCA-1, a pharmacological inhibitor of the NF-κB signaling pathway (Fig. 4). ChIP assay further verified that NF-κB may bind to the promoter sequence of miR-375 gene. In addition, TPCA-1 showed a protective effect against cisplatin-induced apoptosis in RPTC cells (Fig. 5), an observation that is in line with the pro-apoptotic role of NF-κB/miR-375.
Although both P53 and NF-κB contribute to miR-375 induction in cisplatin nephrotoxicity, our results support a direct role of NF-κB and an indirect, regulatory role of P53. It remains unclear how P53 regulates miR-375. Nonetheless, it has been reported that there is a cross-talk between P53 and NF-κB signaling pathways. For example, P53 deficiency may increase chemoresistance and tumorigenesis by activating NF-κB, whereas activation of NF-κB may restore P53 in renal cell carcinomas (37). Future research should delineate the possible cross-talk between P53 and NF-κB signaling in terms of miR-375 regulation and cisplatin nephrotoxicity.
In the present study, we have identified HNF-1β as a direct target of miR-375 (Fig. 6). HNF-1β is a key member of hepatocyte nuclear factors (HNFs) that is mainly expressed in biliary epithelial cells for cell survival and regeneration (38). In kidneys, HNF-1β drives the expression of multiple tubular segment-specific genes for renal development and the maturation and function of renal epithelial cells (39, 40). Mutation or defects in HNF-1β lead to various renal diseases including cystic kidneys (41). HNF-1β has also been reported to associate with renal epithelial cell survival that may drive recovery and repair of kidney from ischemic injury (42). Our current study has demonstrated the first evidence for a protective role of HNF-1β in cisplatin nephrotoxicity. As such, knockdown of HNF-1β increased apoptosis during cisplatin treatment of RPTC cells, whereas overexpression of HNF-1β significantly reduced cell death (Figs. 7 and 8).
In conclusion, this study has demonstrated miR-375 induction in cisplatin nephrotoxicity. The induction is mediated by P53 and NF-κB and, upon induction, miR-375 may repress HNF-1β to increase tubular cell apoptosis. Delineation of the P53/NF-κB/miR-375/HNF-1β pathway may provide novel therapeutic targets for kidney protection during cisplatin chemotherapy in cancer patients.
Experimental Procedures
Animals and Cisplatin Treatment
All mice in this study were housed and used for experiments following an animal use protocol approved by the Institutional Animal Care and Use Committee (IACUC) of Charlie Norwood Veterans Affairs (VA) Medical Center, Augusta, GA. The kidney proximal tubule-specific Dicer knock-out mouse line was generated by crossing Dicer-floxed mice with PEPCK-CRE mice as described in our previous work (21). The proximal tubule-specific P53 knock-out mouse line was established by crossing P53-floxed mice with PEPCK-CRE mice as described in our recent work (24, 43). The genotypes of male mice were confirmed for the experiment as Dicerflox/floxXcreY or P53flox/floxXcreY for knock-out, and Dicerflox/floxXY or P53flox/floxXY for wild-type. For cisplatin treatment, male mice of 8 weeks were intraperitoneally injected with 30 mg/kg of cisplatin as described previously (24).
Cell Lines and Cisplatin Treatment
The RPTC line was originally obtained from Dr. U. Hopfer (Case Western Reserve University) (44). Stable dominant-negative P53 expressing RPTC cells were prepared previously (45). To establish HNF-1β knockdown stable RPTC cells, HNF-1β-shRNAs were purchased from Qiagen (Redwood, CA) and transfected into RPTC cells by using Lipofectamine LTX (Invitrogen). The cells were then cultured in the presence of hygromycin for 2 weeks to select stably transfected clones. The knockdown effect was confirmed by immunoblotting using anti-HNF-1β antibody (Santa Cruz Biotechnology, Santa Cruz, TX). Of note, two HNF-1β shRNAs (targeting sequences: TACAGCCAACCGGGAAACAAT and GTGTAACAGGGCAGAATGTTT) were, respectively, transfected into RPTC cells and showed similar effects. For cisplatin treatment, the cells were washed with phosphate-buffered saline (PBS) and then incubated with fresh medium containing 20 μm cisplatin. The cells were morphologically evaluated for apoptosis and lysed to collect samples for biochemical analysis.
MicroRNA Microarray Analysis
MicroRNA microarray was conducted as previously (21). Briefly, total RNAs were extracted from the kidney cortex of mice with or without cisplatin treatment. The RNA samples were reverse transcribed using the TaqMan® MicroRNA Reverse Transcription Kit (Applied Biosystems, Foster City, CA). The product from each reverse transcription reaction was pre-amplified and then the microRNA expression was profiled with TaqMan® Rodent MicroRNA array card A version 2.0, following the manufacturer's recommended protocol. The global normalization process included the subtraction of the mean CT value of the reference set from the CT value of each microRNA of the same sample. Quantification of each sample was shown as 2−ΔΔCt values.
TaqMan Real-time RT-PCR
Total RNAs were isolated from cells or kidney tissues following the protocol of the mirVana kit (Ambion, Austin, TX). The 40 ng of RNA sample was reverse-transcribed into cDNA using the microRNA Reverse Transcription kit (Applied Biosystems). Real-time quantitative PCR was performed using the TaqMan microRNA assay kit (Applied Biosystems). Quantification of each sample was shown as 2−ΔΔCt values.
Bioinformatics Analysis of Target and Regulatory Element of MicroRNA
We used two databases to predict the targets of miR-375 bioinformatically, including miRanda 2010 database and Targetscan 7.0. To predict the regulatory element of miR-375, Ensembl and JASPAR CORE 2016 were used to analyze the miR-375 host gene promoter region to identify the putative NF-κB-binding site.
Luciferase MicroRNA Target Reporter Assay
Luciferase reporter constructs were prepared according to the protocol of the pMIR-REPORT System (Applied Biosystems) as previously described (46). Briefly, the forward and reverse sequences containing the binding sites of miR-375 in HNF-1β 3′-UTR were designed, synthesized by IDT (Coralville, IA), annealed, and ligated into the pMIR-REPORT luciferase Reporter Vector. The constructs with or without the insert were co-transfected with pMIR-REPROT β-galactosidase (β-gal) control plasmid (Life Technologies) and 200 nm miR-375 mimic or scrambled oligo (Life Technologies) into HEK293 cells. Cell lysate was collected to measure the luciferase activity by using the Luciferase Assay System (Promega, Madison, WI).
ChIP Assay of NF-κB Binding to miR-375 Promoter
ChIP assay was conducted to analyze the binding of NF-κB to the miR-375 promoter region as described in our recent work (46). Briefly, cells were fixed with 1% formaldehyde to collect cell lysate and chromatin was sheared by sonication for immunoprecipitation with anti-p65 antibody. The resultant immunoprecipitation and input DNA was subjected to real-time PCR for amplification of the putative NF-κB binding sequence using specifically designed primers: forward, 5′-GTCTCCAGAATGCAGACTCTTT-3′; reverse, 5′-CTGCTCAGTCAAGTGAAGAATAGA-3′. The value of real-time PCR was normalized with input DNA for comparison.
Morphological Evaluation of Apoptosis
Cells were stained with 10 μg/ml of Hoechst 33342 for 2–3 min to examine the typical apoptosis morphology by phase-contrast and fluorescence microscopy, including shrunken configuration, apoptotic body formation, and nuclei condensation and fragmentation. Three fields with ∼200 cells per field were evaluated to determine the percentage of apoptosis, and each result was from triplicate experiments.
Caspase Activity Assay
Caspase activity was measured by an enzymatic assay using the fluorogenic DEVD-AFC substrate of caspase-3, -6, and -7. Briefly, cells were lysed with 1% Triton X-100 buffer containing 10 mm Tris-HCl, 10 mm NaH2PO4/NaHPO4 (pH 7.5), and 130 mm NaCl. The protein concentration was measured by bicinchoninic acid (BCA) reagent (Pierce Chemical). 25 μg of protein was added to the enzymatic reaction mixture containing 50 μm DEVD-AFC for 1 h of incubation at 37 °C. Fluorescence intensity was measured at excitation 360 nm/emission 530 nm. The fluorescence reading from each enzymatic reaction was calculated into the nanomolar amount of liberated AFC to indicate caspase activity, based on a standard curve constructed with free AFC.
Immunoblot Analysis
Whole cell or tissue lysate was collected in 2% SDS buffer. Protein concentration was measured by BCA reagent (Pierce Chemical). The 30 μg cell lysate or 100 μg tissue lysate of protein samples were resolved by SDS-PAGE gel, which was then electroblotted onto the PVDF membrane. The membrane was incubated for 1 h with 5% nonfat milk for blocking and then incubated with primary antibodies overnight at 4 °C. Subsequently, the horseradish peroxidase-conjugated secondary antibody was used to detect antigens on the blot by reacting with the enhanced chemiluminescence (ECL) kit. The antibodies were purchased from the following sources: anti-p65, anti-phospho-p65 (Ser-276) from Abcam; anti-HNF-1β from Santa Cruz Biotechnology; anti-P53 and anti-caspase-3 from Cell Signaling Technology; anti-β-actin and cyclophilin B from Sigma. The quantification of each band was performed using ImageJ software.
Nucleic Acid Transfection
All DNA plasmids, microRNA mimics, and LNA inhibitors were transfected into cells with Lipofectamine 2000 (Life Technologies) following the manufacturer's instruction. MicroRNA mimics were purchased from Life Technologies. LNAs were purchased from Exiqon. hnf-1β shRNAs and scrambled control shRNA were purchased from Origene. hnf-1β expression plasmid (FR_HNF1B) was from Addgene (plasmid number 31101), which expresses full-length HNF-1β with Myc tag (47).
Statistical Analysis
Quantitative data were expressed as mean ± S.D. (n ≥ 3). Statistical differences were determined with one-way analysis of variance using GraphPad Prism 6 software. p < 0.05 was considered to be statistically significant.
Author Contributions
J. H. prepared the study design, conducted experiments, data analysis, figure preparation, and manuscript preparation; Q. L. conducted the experiments, data analysis, and figure preparation; Q. W. prepared the study design, conducted experiments, data analysis, and figure preparation; S. M. conducted experiments, data analysis, and figure preparation; L. L. conducted experiments, data analysis, and figure preparation; G. W. and Q. M. prepared the study design, data analysis, and manuscript preparation; C. M. prepared the study design, data analysis, and manuscript preparation; Z. D. prepared the study design, data analysis, and manuscript preparation.
Supplementary Material
Note Added in Proof
Dr. Guangyu Wu was inadvertently omitted as an author on the version of this article that was published as a Paper in Press on January 24, 2017. This error has now been corrected.
This work was supported in part by National Natural Science Foundation of China Grants 81430017 and 31371172, Major Fundamental Research Program of Shanghai Committee of Science and Technology Grant 12DJ1400300, the Key Projects in the National Science & Technology Pillar Program in the Twelfth Five-year Plan Period Grant 2011BAl10B07, American Heart Association Grant 12SDG8270002, National Institutes of Health Grants 5R01DK058831 and 2R01DK087843, and Department of Veterans Administration Grant 5I01BX000319. The authors declare that they have no conflicts of interest with the contents of this article. The content is solely the responsibility of the authors and does not necessarily represent the official views of the National Institutes of Health.

This article contains supplemental Figs. S1 and S2.
- AKI
- acute kidney injury
- HNF-1β
- hepatocyte nuclear factor 1
- RPTC
- rat proximal tubular cell
- LNA
- locked nucleic acid
- DN
- dominant-negative
- TPCA-1
- 2-[(aminocarbonyl)amino]-5-(4-fluorophenyl)-3-thiophenecarboxamide
- PARP
- poly(ADP-ribose) polymerase
- HNF
- hepatocyte nuclear factor
- PEPCK
- phosphoenolpyruvate carboxykinase.
References
- 1. Wang D., and Lippard S. J. (2005) Cellular processing of platinum anticancer drugs. Nat. Rev. Drug Discov. 4, 307–320 [DOI] [PubMed] [Google Scholar]
- 2. Cepeda V., Fuertes M. A., Castilla J., Alonso C., Quevedo C., and Pérez J. M. (2007) Biochemical mechanisms of cisplatin cytotoxicity. Anticancer Agents Med. Chem. 7, 3–18 [DOI] [PubMed] [Google Scholar]
- 3. Launay-Vacher V., Rey J. B., Isnard-Bagnis C., Deray G., Daouphars M., and European Society of Clinical Pharmacy Special Interest Group on Cancer, C. (2008) Prevention of cisplatin nephrotoxicity: state of the art and recommendations from the European Society of Clinical Pharmacy Special Interest Group on Cancer Care. Cancer Chemother. Pharmacol. 61, 903–909 [DOI] [PubMed] [Google Scholar]
- 4. Pabla N., and Dong Z. (2008) Cisplatin nephrotoxicity: mechanisms and renoprotective strategies. Kidney Int. 73, 994–1007 [DOI] [PubMed] [Google Scholar]
- 5. Finkel M., Goldstein A., Steinberg Y., Granowetter L., and Trachtman H. (2014) Cisplatinum nephrotoxicity in oncology therapeutics: retrospective review of patients treated between 2005 and 2012. Pediatr. Nephrol. 29, 2421–2424 [DOI] [PubMed] [Google Scholar]
- 6. dos Santos N. A., Carvalho Rodrigues M. A., Martins N. M., and dos Santos A. C. (2012) Cisplatin-induced nephrotoxicity and targets of nephroprotection: an update. Arch. Toxicol. 86, 1233–1250 [DOI] [PubMed] [Google Scholar]
- 7. Miller R. P., Tadagavadi R. K., Ramesh G., and Reeves W. B. (2010) Mechanisms of cisplatin nephrotoxicity. Toxins 2, 2490–2518 [DOI] [PMC free article] [PubMed] [Google Scholar]
- 8. Ozkok A., and Edelstein C. L. (2014) Pathophysiology of cisplatin-induced acute kidney injury. BioMed Res. Int. 2014, 967826. [DOI] [PMC free article] [PubMed] [Google Scholar]
- 9. Mendell J. T., and Olson E. N. (2012) MicroRNAs in stress signaling and human disease. Cell 148, 1172–1187 [DOI] [PMC free article] [PubMed] [Google Scholar]
- 10. Lorenzen J. M., Haller H., and Thum T. (2011) MicroRNAs as mediators and therapeutic targets in chronic kidney disease. Nat. Rev. Nephrol 7, 286–294 [DOI] [PubMed] [Google Scholar]
- 11. Bhatt K., Mi Q. S., and Dong Z. (2011) microRNAs in kidneys: biogenesis, regulation, and pathophysiological roles. Am. J. Physiol. Renal Physiol. 300, F602–610 [DOI] [PMC free article] [PubMed] [Google Scholar]
- 12. Bhatt K., Kato M., and Natarajan R. (2016) Mini-review: emerging roles of microRNAs in the pathophysiology of renal diseases. Am. J. Physiol. Renal Physiol. 310, F109–118 [DOI] [PMC free article] [PubMed] [Google Scholar]
- 13. Chung A. C., Yu X., and Lan H. Y. (2013) MicroRNA and nephropathy: emerging concepts. Int. J. Nephrol. Renovasc. Dis. 6, 169–179 [DOI] [PMC free article] [PubMed] [Google Scholar]
- 14. Badal S. S., and Danesh F. R. (2015) MicroRNAs and their applications in kidney diseases. Pediatr. Nephrol. 30, 727–740 [DOI] [PMC free article] [PubMed] [Google Scholar]
- 15. Wei Q., Mi Q. S., and Dong Z. (2013) The regulation and function of microRNAs in kidney diseases. IUBMB Life 65, 602–614 [DOI] [PMC free article] [PubMed] [Google Scholar]
- 16. Bhatt K., Zhou L., Mi Q. S., Huang S., She J. X., and Dong Z. (2010) MicroRNA-34a is induced via p53 during cisplatin nephrotoxicity and contributes to cell survival. Mol. Med. 16, 409–416 [DOI] [PMC free article] [PubMed] [Google Scholar]
- 17. Pellegrini K. L., Han T., Bijol V., Saikumar J., Craciun F. L., Chen W. W., Fuscoe J. C., and Vaidya V. S. (2014) MicroRNA-155 deficient mice experience heightened kidney toxicity when dosed with cisplatin. Toxicol. Sci. 141, 484–492 [DOI] [PMC free article] [PubMed] [Google Scholar]
- 18. Pavkovic M., Riefke B., and Ellinger-Ziegelbauer H. (2014) Urinary microRNA profiling for identification of biomarkers after cisplatin-induced kidney injury. Toxicology 324, 147–157 [DOI] [PubMed] [Google Scholar]
- 19. Kanki M., Moriguchi A., Sasaki D., Mitori H., Yamada A., Unami A., and Miyamae Y. (2014) Identification of urinary miRNA biomarkers for detecting cisplatin-induced proximal tubular injury in rats. Toxicology 324, 158–168 [DOI] [PubMed] [Google Scholar]
- 20. Pavkovic M., Robinson-Cohen C., Chua A. S., Nicoara O., Cárdenas-González M., Bijol V., Ramachandran K., Hampson L., Pirmohamed M., Antoine D. J., Frendl G., Himmelfarb J., Waikar S. S., and Vaidya V. S. (2016) Detection of drug-induced acute kidney injury in humans using urinary KIM-1, miR-21, -200c, and -423. Toxicol. Sci. 152, 205–213 [DOI] [PMC free article] [PubMed] [Google Scholar]
- 21. Wei Q., Bhatt K., He H. Z., Mi Q. S., Haase V. H., and Dong Z. (2010) Targeted deletion of Dicer from proximal tubules protects against renal ischemia-reperfusion injury. J. Am. Soc. Nephrol. 21, 756–761 [DOI] [PMC free article] [PubMed] [Google Scholar]
- 22. Jiang M., and Dong Z. (2008) Regulation and pathological role of p53 in cisplatin nephrotoxicity. J. Pharmacol. Exp. Ther. 327, 300–307 [DOI] [PubMed] [Google Scholar]
- 23. Wei Q., Dong G., Yang T., Megyesi J., Price P. M., and Dong Z. (2007) Activation and involvement of p53 in cisplatin-induced nephrotoxicity. Am. J. Physiol. Renal Physiol. 293, F1282–1291 [DOI] [PMC free article] [PubMed] [Google Scholar]
- 24. Zhang D., Liu Y., Wei Q., Huo Y., Liu K., Liu F., and Dong Z. (2014) Tubular p53 regulates multiple genes to mediate AKI. J. Am. Soc. Nephrol. 25, 2278–2289 [DOI] [PMC free article] [PubMed] [Google Scholar]
- 25. Ozkok A., Ravichandran K., Wang Q., Ljubanovic D., and Edelstein C. L. (2016) NF-κB transcriptional inhibition ameliorates cisplatin-induced acute kidney injury (AKI). Toxicol. Lett. 240, 105–113 [DOI] [PubMed] [Google Scholar]
- 26. Yuan Y., Tong L., and Wu S. (2015) MicroRNA and NF-κB. Adv. Exp. Med. Biol. 887, 157–170 [DOI] [PubMed] [Google Scholar]
- 27. Podolin P. L., Callahan J. F., Bolognese B. J., Li Y. H., Carlson K., Davis T. G., Mellor G. W., Evans C., and Roshak A. K. (2005) Attenuation of murine collagen-induced arthritis by a novel, potent, selective small molecule inhibitor of IκB kinase 2, TPCA-1 (2-[(aminocarbonyl)amino]-5-(4-fluorophenyl)-3-thiophenecarboxamide), occurs via reduction of proinflammatory cytokines and antigen-induced T cell Proliferation. J. Pharmacol. Exp. Ther. 312, 373–381 [DOI] [PubMed] [Google Scholar]
- 28. Yang T., Zhao P., Rong Z., Li B., Xue H., You J., He C., Li W., He X., Lee R. J., Ma X., and Xiang G. (2016) Anti-tumor efficiency of lipid-coated cisplatin nanoparticles co-loaded with microRNA-375. Theranostics 6, 142–154 [DOI] [PMC free article] [PubMed] [Google Scholar]
- 29. Jiang M., Wei Q., Wang J., Du Q., Yu J., Zhang L., and Dong Z. (2006) Regulation of PUMA-α by p53 in cisplatin-induced renal cell apoptosis. Oncogene 25, 4056–4066 [DOI] [PubMed] [Google Scholar]
- 30. Gong Z., Yang Q., Zeng Z., Zhang W., Li X., Zu X., Deng H., Chen P., Liao Q., Xiang B., Zhou M., Li X., Li Y., Xiong W., and Li G. (2016) An integrative transcriptomic analysis reveals p53 regulated miRNA, mRNA, and lncRNA networks in nasopharyngeal carcinoma. Tumour Biol. 37, 3683–3695 [DOI] [PubMed] [Google Scholar]
- 31. Deng Q., Becker L., Ma X., Zhong X., Young K., Ramos K., and Li Y. (2014) The dichotomy of p53 regulation by noncoding RNAs. J. Mol. Cell Biol. 6, 198–205 [DOI] [PMC free article] [PubMed] [Google Scholar]
- 32. Shang Y., Feng B., Zhou L., Ren G., Zhang Z., Fan X., Sun Y., Luo G., Liang J., Wu K., Nie Y., and Fan D. (2016) The miR27b-CCNG1-P53-miR-508–5p axis regulates multidrug resistance of gastric cancer. Oncotarget 7, 538–549 [DOI] [PMC free article] [PubMed] [Google Scholar]
- 33. Li J., Aung L. H., Long B., Qin D., An S., and Li P. (2015) miR-23a binds to p53 and enhances its association with miR-128 promoter. Sci. Rep. 5, 16422. [DOI] [PMC free article] [PubMed] [Google Scholar]
- 34. Chen J., and Zhao K. N. (2015) HPV-p53-miR-34a axis in HPV-associated cancers. Ann. Transl. Med. 3, 331. [DOI] [PMC free article] [PubMed] [Google Scholar]
- 35. Perkins N. D. (2007) Integrating cell-signalling pathways with NF-κB and IKK function. Nat. Rev. Mol. Cell Biol. 8, 49–62 [DOI] [PubMed] [Google Scholar]
- 36. Karin M. (2006) Nuclear factor-κB in cancer development and progression. Nature 441, 431–436 [DOI] [PubMed] [Google Scholar]
- 37. Gurova K. V., Hill J. E., Guo C., Prokvolit A., Burdelya L. G., Samoylova E., Khodyakova A. V., Ganapathi R., Ganapathi M., Tararova N. D., Bosykh D., Lvovskiy D., Webb T. R., Stark G. R., and Gudkov A. V. (2005) Small molecules that reactivate p53 in renal cell carcinoma reveal a NF-κB-dependent mechanism of p53 suppression in tumors. Proc. Natl. Acad. Sci. U.S.A. 102, 17448–17453 [DOI] [PMC free article] [PubMed] [Google Scholar]
- 38. Limaye P. B., Alarcón G., Walls A. L., Nalesnik M. A., Michalopoulos G. K., Demetris A. J., and Ochoa E. R. (2008) Expression of specific hepatocyte and cholangiocyte transcription factors in human liver disease and embryonic development. Lab. Investig. 88, 865–872 [DOI] [PMC free article] [PubMed] [Google Scholar]
- 39. Naylor R. W., and Davidson A. J. (2014) HNF1β and nephron segmentation. Pediat. Nephrol. 29, 659–664 [DOI] [PMC free article] [PubMed] [Google Scholar]
- 40. Igarashi P., Shao X., McNally B. T., and Hiesberger T. (2005) Roles of HNF-1β in kidney development and congenital cystic diseases. Kidney Int. 68, 1944–1947 [DOI] [PubMed] [Google Scholar]
- 41. Clissold R. L., Hamilton A. J., Hattersley A. T., Ellard S., and Bingham C. (2015) HNF1B-associated renal and extra-renal disease: an expanding clinical spectrum. Nat. Rev. Nephrol. 11, 102–112 [DOI] [PubMed] [Google Scholar]
- 42. Faguer S., Mayeur N., Casemayou A., Pageaud A. L., Courtellemont C., Cartery C., Fournie G. J., Schanstra J. P., Tack I., Bascands J. L., and Chauveau D. (2013) HNF-1β transcription factor is an early hif-1α-independent marker of epithelial hypoxia and controls renal repair. PloS One 8, e63585. [DOI] [PMC free article] [PubMed] [Google Scholar]
- 43. Bhatt K., Wei Q., Pabla N., Dong G., Mi Q. S., Liang M., Mei C., and Dong Z. (2015) MicroRNA-687 induced by hypoxia-inducible factor-1 targets phosphatase and tensin homolog in renal ischemia-reperfusion injury. J. Am. Soc. Nephrol. 26, 1588–1596 [DOI] [PMC free article] [PubMed] [Google Scholar]
- 44. Woost P. G., Orosz D. E., Jin W., Frisa P. S., Jacobberger J. W., Douglas J. G., and Hopfer U. (1996) Immortalization and characterization of proximal tubule cells derived from kidneys of spontaneously hypertensive and normotensive rats. Kidney Int. 50, 125–134 [DOI] [PubMed] [Google Scholar]
- 45. Jiang M., Yi X., Hsu S., Wang C. Y., and Dong Z. (2004) Role of p53 in cisplatin-induced tubular cell apoptosis: dependence on p53 transcriptional activity. Am. J. Physiol. Renal Physiol. 287, F1140–1147 [DOI] [PubMed] [Google Scholar]
- 46. Wei Q., Liu Y., Liu P., Hao J., Liang M., Mi Q. S., Chen J. K., and Dong Z. (2016) MicroRNA-489 induction by hypoxia-inducible factor-1 protects against ischemic kidney injury. J. Am. Soc. Nephrol. 27, 2784–2796 [DOI] [PMC free article] [PubMed] [Google Scholar]
- 47. Thomas H., Senkel S., Erdmann S., Arndt T., Turan G., Klein-Hitpass L., and Ryffel G. U. (2004) Pattern of genes influenced by conditional expression of the transcription factors HNF6, HNF4α and HNF1β in a pancreatic β-cell line. Nucleic Acids Res. 32, e150. [DOI] [PMC free article] [PubMed] [Google Scholar]
Associated Data
This section collects any data citations, data availability statements, or supplementary materials included in this article.


