

Abstract
The immunity-related GTPases (IRGs) are a family of proteins that are induced by interferon (IFN)-γ and play pivotal roles in immune and inflammatory responses. IRGs ostensibly function as dynamin-like proteins that bind to intracellular membranes and promote remodeling and trafficking of those membranes. Prior studies have shown that loss of Irgm1 in mice leads to increased lethality to bacterial infections as well as enhanced inflammation to non-infectious stimuli; however, the mechanisms underlying these phenotypes are unclear. In the studies reported here, we found that uninfected Irgm1-deficient mice displayed high levels of serum cytokines typifying profound autoinflammation. Similar increases in cytokine production were also seen in cultured, IFN-γ-primed macrophages that lacked Irgm1. A series of metabolic studies indicated that the enhanced cytokine production was associated with marked metabolic changes in the Irgm1-deficient macrophages, including increased glycolysis and an accumulation of long chain acylcarnitines. Cells were exposed to the glycolytic inhibitor, 2-deoxyglucose, or fatty acid synthase inhibitors to perturb the metabolic alterations, which resulted in dampening of the excessive cytokine production. These results suggest that Irgm1 deficiency drives metabolic dysfunction in macrophages in a manner that is cell-autonomous and independent of infectious triggers. This may be a significant contributor to excessive inflammation seen in Irgm1-deficient mice in different contexts.
Keywords: cytokine induction, fatty acid metabolism, glycolysis, macrophage, respiration, immunity-related GTPase, interferon gamma, Irgm1
Introduction
The immunity-related GTPases (IRGs)2 are a family of proteins that mediate diverse immune responses in professional immune and non-immune cells following induction of their expression by interferon (IFN)-γ and/or lipopolysaccharide. Similar to the related guanylate-binding protein and Mx gene families, they encode large GTP-binding proteins that function as dynamin-like proteins in mediating membrane remodeling and trafficking processes in cells (1–4). In the absence of certain IRG proteins, alterations in membrane remodeling events have been observed, including the processing of pathogen-containing vacuoles (5–8), vesicle formation and transport (4, 8–12), cell motility (13, 14), autophagy (15–20), and mitochondrial fission (20, 21). How these alterations relate to the dysfunctional immune responses displayed in IRG-deficient cells and mice in response to a variety of pathogens remains unclear.
Targeting of the Irgm1 gene in mice has a particularly profound impact on immunity to bacterial pathogens, leading to elevated bacterial loads and increased lethality following infection with Salmonella typhimurium (13), Listeria monocytogenes (23), and Mycobacteria sp. (5, 15, 24). Previous work has attributed the bacterial susceptibility in Irgm1-deficient mice to defective processing of bacteria-containing phagosomes in macrophages and other cells (5, 15, 25–27). That reduced capacity to manifest IFN-γ-induced killing of S. typhimurium and Mycobacterium tuberculosis has been further linked to altered autophagic function in Irgm1-deficient macrophages (15, 20, 21, 27–30). Impaired autophagy ostensibly leads to a reduced capacity to restrict bacterial growth, increased inflammation, and ultimately death of the host, although these linkages have not been formally established.
In the studies described here, we address an alternative hypothesis, that a major contributor to increased inflammation and lethality in Irgm1-deficient mice is increased inflammatory cytokine production that directly results from cell intrinsic alterations in Irgm1-deficient macrophages and other cells. Activation of macrophages leading to production of inflammatory cytokines is a well studied process. Classical activation of macrophages results from their priming with IFN-γ, predominantly derived from NK and Th1 cells, followed by their activation with exposure to bacterial products, such as lipopolysaccharide (LPS) (31–34). Whereas IFN-γ-priming increases expression of some cytokines, full activation of macrophages with LPS is needed to trigger robust production of the array of inflammatory cytokines characteristically secreted by classically activated macrophages (35–37). Recent work has established that LPS-induced activation of macrophages is predicated on metabolic changes in those cells, specifically a shift from oxidative phosphorylation and β-oxidation to aerobic glycolysis (34, 38). Along those lines, when perturbations occur in processes linked to energy metabolism, including autophagy, production of inflammatory cytokines is markedly affected (38, 39).
To address the hypothesis, we first examined whether inflammatory cytokine production is increased in mice and cells lacking Irgm1. Finding marked increases in inflammatory cytokine production in the absence of Irgm1, we performed further studies to explore the underlying mechanism. We demonstrate that Irgm1 deficiency drives a set of metabolic alterations that instigate inflammatory cytokine production.
Results
Enhanced Proinflammatory Cytokine Production in Irgm1-deficient Mice and Cells
We used a multiplex approach to measure production of an array of proinflammatory cytokines in the serum of Irgm1-deficient mice. Of the 23 cytokines that were assessed, 21 were elevated at least 2-fold in Irgm1-deficient mice as compared with levels in infected WT mice (Fig. 1). The majority of those cytokines were elevated at least as much in naive Irgm1-deficient mice as they were in those mice following infection with S. typhimurium (supplemental Table S1). These results indicate that there is a robust autoinflammation in Irgm1-deficient mice in the absence of infection.
FIGURE 1.

Irgm1 deficiency leads to enhanced cytokine production in uninfected mice. Sera collected from three WT and three Irgm1-deficient mice were used for cytokine measurements using a multiplex assay. Shown are average levels of the indicated cytokines in Irgm1-deficient mice relative to levels in WT mice. Error bars, S.E. *, p < 0.05.
Because several of the cytokines that were found elevated systemically in the Irgm1-deficient mice are produced by macrophages, we next examined primary bone marrow-derived macrophages (BMM) to determine whether Irgm1 deficiency would cause increases in the cytokine levels in a cell-autonomous manner. It is important to note that the serum cytokine data indicated that IFN-γ levels were elevated systemically in Irgm1-deficient mice (which is in agreement with a previous analysis of Irgm1-deficient mice (40)). Consequently, it is likely that macrophages in those mice are already primed with IFN-γ, and thus we chose to examine the responses of cultured macrophages primed with IFN-γ. Using a dot blot cytokine array, we found several cytokines elevated in conditioned media from IFN-γ-primed, Irgm1-deficient macrophages, including RANTES/CCL5, MCP-1/CCL2, and TNF-α (Fig. 2A), which was consistent with the serum cytokine data. The increases in RANTES and MCP-1 were replicated using ELISA (Fig. 2, B and C). In subsequent studies described below, we examined the underlying mechanism that may drive increased proinflammatory cytokine production in Irgm1-deficient cells, focusing on RANTES and MCP-1 as representative, IFN-γ-induced cytokines.
FIGURE 2.

IFN-γ-primed macrophages show enhanced secretion of inflammatory cytokines in the absence of Irgm1. A, BMM from WT and Irgm1-deficient mice were primed with IFN-γ for 24 h. Cytokine levels were measured in conditioned media using a cytokine array dot blot. B and C, BMM from WT and Irgm1-deficient mice were primed with IFN-γ or were maintained under control conditions for 24 h. Levels of RANTES (B) and MCP-1 (C) were measured in conditioned media using ELISA. Shown are average relative levels measured in triplicate samples for the indicated cytokines. Error bars, S.E. *, p < 0.05. **, p < 0.001.
Altered Metabolism in Irgm1-deficient Macrophages
Emerging lines of research show that metabolic changes are critical for immune cell function. Classical activation to the pro-inflammatory state of M1 macrophages with exposure to LPS, alone or in combination with IFN-γ, involves a shift from metabolism primarily driven by oxidative phosphorylation and lipid oxidation to one primarily driven by glycolysis (34, 41, 42). We reasoned that given the aforementioned changes in autophagy and mitochondrial dynamics that had been described in Irgm1-deficient cells, there may be metabolic changes in Irgm1-deficient macrophages that might contribute to the enhanced proinflammatory cytokine profile seen in those cells. Consequently, we undertook bio-energetic analyses of Irgm1-deficient macrophages.
Glycolytic activity as measured by the extracellular acidification rate (ECAR) was markedly elevated in IFN-γ-stimulated Irgm1-deficient BMM compared with IFN-γ-stimulated WT BMM (Fig. 3, A and B). There was also a small increase in ECAR in unstimulated Irgm1-deficient BMM compared with unstimulated WT cells. This may be due to the absence of the small levels of Irgm1 that is expressed in WT macrophages in the absence of IFN-γ stimulation.3 We note that no change in ECAR in WT BMM was observed between control and IFN-γ-primed conditions, because LPS stimulation is required to instigate the metabolic shift to glycolysis seen in classical M1 activation (43, 44). The increase in ECAR in IFN-γ-primed Irgm1-deficient BMM was corroborated by lactate measurements taken in the course of metabolomic studies (see below), showing that lactate concentrations were 36% higher in IFN-γ-primed Irgm1-deficient BMM compared with IFN-γ-stimulated WT cells (Fig. 3C), whereas this difference was not present in BMM stimulated with IFN-γ and LPS (supplemental Table S2).
FIGURE 3.

Irgm1-deficient macrophages show an increase in glycolytic activity. BMM from WT and Irgm1-deficient mice were primed with IFN-γ or were maintained under control conditions for 24 h. The cells were then subjected to a glycolytic stress test and measurement of the ECAR as a proxy for glycolysis. The experiment was repeated four times, using cells isolated from different mice each time. Shown are representative ECAR measurements from a stress test (A) and a representative ECAR measurement (B). The cells were also used for metabolomic measurement of lactate levels (C), analyzing cells isolated from three separate mice per genotype. Cells were subjected to a mitochondrial stress test and measurement of the OCR as a proxy for oxidative phosphorylation. The experiment was repeated four times, using cells isolated from different mice each time. D, average OCR from a representative experiment. E, average ECAR/OCR ratios over four experiments. In other experiments, BMM from WT and Irgm1-deficient mice were maintained under control conditions, were primed with IFN-γ, or were activated with IFN-γ for 24 h and LPS for the final 16 h. Protein lysates were isolated and used for immunoblotting with an antibody mixture of electron transport chain (ETC) components. Shown are a representative blot (F) and sum intensities of the bands normalized to actin and averaged over three experiments (G). Error bars, S.E. *, p < 0.05.
To determine whether the increased glycolytic activity in Irgm1-deficient macrophages corresponded with decreased oxidative phosphorylation, we subsequently measured the oxygen consumption rate (OCR) in macrophages to gain insight into the capacity for mitochondrial oxidative phosphorylation (OXPHOS). In IFN-γ-stimulated Irgm1-deficient BMM, relative to IFN-γ-stimulated WT BMM, we observed a trend toward decreased maximal respiration rates as well as substantial increases in the ECAR/OCR ratio (Fig. 3, D and E), indicating that IFN-γ-primed Irgm1-deficient BMM are relatively more reliant on glycolysis to meet the energy demands of the cell. We also observed a significant decrease in several essential electron transport chain proteins in our IFN-γ-primed Irgm1-deficient macrophages, reflecting the decrease in OXPHOS activity (Fig. 3, F and G). Taken together, these results suggest that IFN-γ-primed, Irgm1-deficient BMM demonstrate a marked shift toward a glycolytic phenotype. Such a shift toward glycolysis is generally seen in WT macrophages after full activation with LPS but not IFN-γ alone (38, 45, 46).
We further explored metabolic changes in Irgm1-deficient BMM by measuring levels of key metabolites using a mass spectrometry-based metabolic profiling approach (supplemental Table S2). These analyses revealed a striking increase in most long chain acylcarnitines (LC-AC) in IFN-γ-stimulated Irgm1-deficient BMM relative to IFN-γ-stimulated WT BMM, with levels being increased by as much as 15.7-fold (Fig. 4 and supplemental Table S2). In contrast, short chain acylcarnitines were relatively decreased in IFN-γ-stimulated Irgm1-deficient BMM. Because LC-AC have pro-inflammatory properties (47–51), these data reinforce the finding that in IFN-γ-primed Irgm1-deficient macrophages, metabolic changes occur that are proinflammatory and typically only seen in macrophages following activation with LPS.
FIGURE 4.
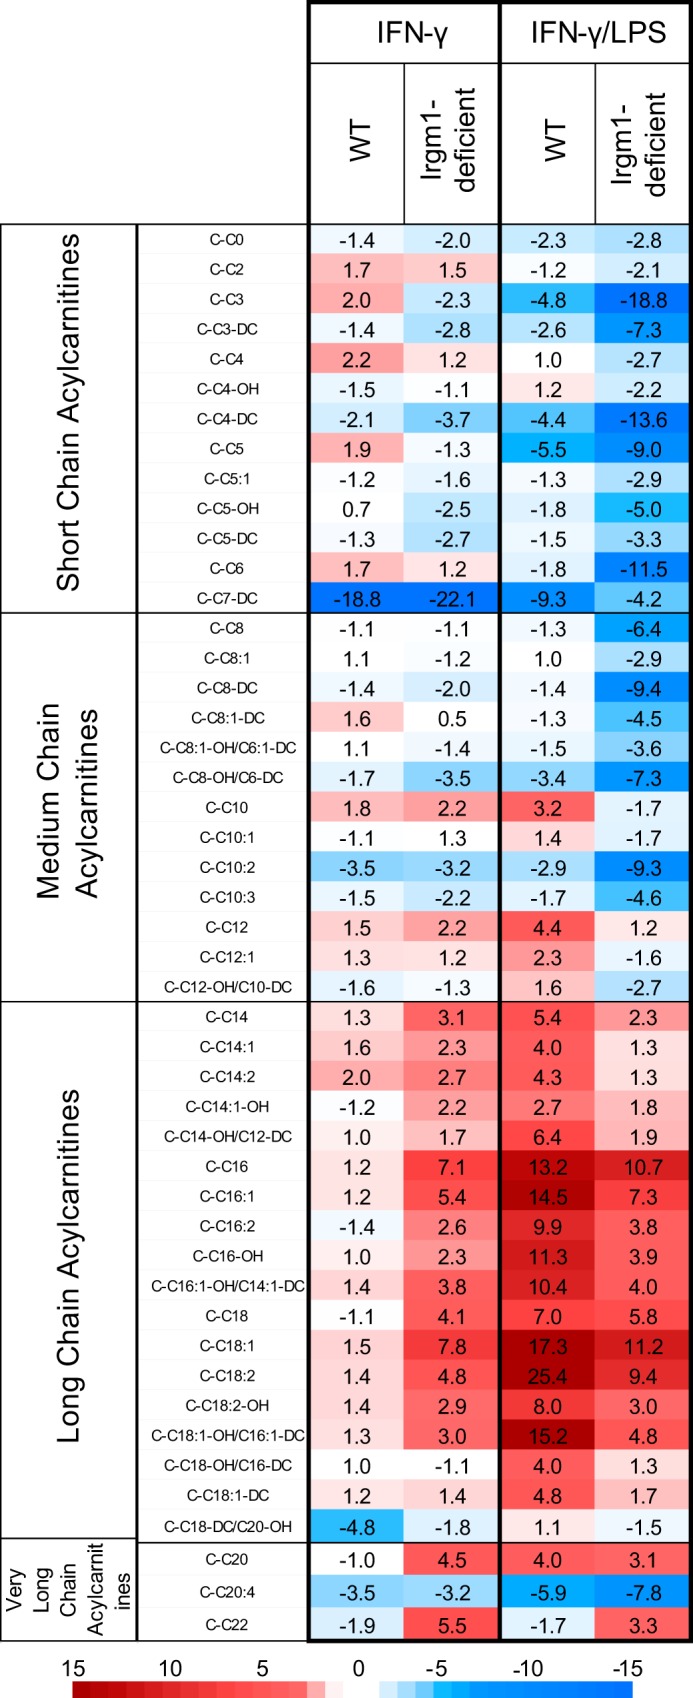
Increased levels of long chain acylcarnitines in IFN-γ-primed macrophages lacking Irgm1. Groups of three WT and three Irgm1-deficient BMM isolated from separate mice were maintained under control conditions, primed with IFN-γ for 24 h, or activated with IFN-γ for 24 h and LPS for the final 16 h. Lysates were prepared from the cells and were used for measurement of acylcarnitine levels using LC-MS. Shown is a heat map of the relative -fold changes in acylcarnitine concentration in IFN-γ-primed and IFN-γ/LPS-activated BMM, relative to concentrations in BMM of that genotype under control conditions. Raw acylcarnitine levels can be seen in supplemental Table S2.
We also exposed the cells to LPS and IFN-γ to examine how the metabolic changes in IFN-γ-primed, Irgm1-deficient cells might compare with those in fully activated macrophages. In macrophages exposed to both LPS and IFN-γ, the levels of LC-AC were increased in both WT and Irgm1-deficient cells relative to control conditions, but they were, in fact, not elevated in Irgm1-deficient cells relative to WT cells (supplemental Table S2).
Potential Roles for Impaired Autophagy and/or Mitochondrial Dysfunction in Promoting Proinflammatory Cytokine Production in Irgm1-deficient Macrophages
As alluded to above, Irgm1 deficiency has been linked to inhibition of autophagic flux in macrophages (2, 15, 19, 21, 27, 52), fibroblasts (21), and enterocytes (53). Thus, it is plausible that this impairment in autophagy may be involved in the metabolic changes in Irgm1-deficient macrophages and that it may drive changes in cytokine expression. To explore this possibility, we examined BMM from Atg7f/fLysM-Cre mice that have a block in autophagy. However, when autophagy was blocked via the Atg7 deletion, RANTES production following IFN-γ priming was not affected (Fig. 5A). These results suggest that an autophagy-independent mechanism drives increased production of a subset of cytokines elevated in Irgm1-deficient cells, including RANTES. It remains possible that impaired autophagy may be involved in the increases in other cytokines seen in Irgm1-deficient macrophages. This is particularly true in the case of cytokines whose expression requires LPS stimulation alone or in addition to IFN-γ. In support of this, we also measured the production of one such cytokine, IL-1β, in macrophages, finding it to be substantially elevated in both Irgm1-deficient and Atg7-deficient BMM once activated with LPS (Fig. 5B) (54).
FIGURE 5.

Inhibition of autophagy does not affect RANTES production in IFN-γ-primed macrophages. BMM of the indicated genotypes were plated and maintained under control conditions or primed with IFN-γ for 24 h. Conditioned media were collected and used for ELISA to measure RANTES (A) or IL-1β (B). Shown are averages of at least three experiments. Error bars, S.E. *, p < 0.05.
Mitochondrial dynamics have previously been shown to be altered in Irgm1-deficient cells. Although the underlying mechanism remains unclear, it has been suggested that Irgm1 directly regulates mitochondrial fission, and thus it is conceivable that control of mitochondrial dynamics by Irgm1 would impact metabolic function. Because our studies performed previously in fibroblasts showed that Irgm1 deficiency leads to a more fused mitochondrial network than that seen in WT cells (21), we first addressed in the current studies whether Irgm1 deficiency affects mitochondrial dynamics in macrophages in a similar manner. Although Irgm1 deficiency did, in fact, alter mitochondrial morphology in macrophages, the effect was surprisingly opposite of that seen in fibroblasts, with Irgm1-deficient BMM primed with IFN-γ displaying a much more punctate mitochondrial morphology than that seen in WT BMM (Fig. 6A). This change in mitochondrial morphology was probably independent of any modulation of autophagy in Irgm1-deficient BMM, because Atg7-deficient BMM displayed a mitochondrial morphology similar to that of WT BMM (Fig. 6B). It is known that activation of wild-type macrophages with LPS increases mitochondrial fragmentation (27, 55, 56), with the fragmentation resulting in part from the high production of reactive oxygen species that occurs with activation (56–59). We thus reasoned that the fragmented mitochondrial morphology in Irgm1-deficient macrophages may be a result of the metabolic changes in those cells in the context of high ROS levels. To test these possibilities, we examined the mitochondrial morphology of cells exposed to the fatty acid synthase inhibitors, cerulenin and C75. Both fatty acid synthase inhibitors markedly decreased the punctate character of the mitochondria in IFN-γ-primed, Irgm1-deficient BMM (Fig. 6C). Further, Irgm1-deficient cells treated with the ROS quencher, N-acetyl cysteine (NAC), also displayed reduced mitochondrial fragmentation (Fig. 6D). As a corollary to these experiments, we also tested whether increasing ROS in Irgm1-deficient fibroblasts would reverse the mitochondrial phenotype in those cells. This proved to be the case, as Irgm1-deficient fibroblasts exposed to H2O2 displayed a reversion of the mitochondrial phenotype in those cells (i.e. they no longer showed a more fused mitochondrial phenotype compared with WT fibroblasts but rather a relatively more punctate phenotype (data not shown)). In macrophages, ROS levels were measured, and they were not statistically different in WT and Irgm1-deficient macrophages when the cells were primed with IFN-γ only (Fig. 6E). Nevertheless, quenching of the ROS greatly suppressed the elevated levels of MCP-1 and RANTES in IFN-γ-primed, Irgm1-deficient BMM (Fig. 6, F and G). These results implied that Irgm1-deficient BMM primed with IFN-γ were not responding to increased ROS levels but were hyperresponsive to similar concentrations of ROS. Taken together, these studies suggest that mitochondrial fragmentation in Irgm1-deficient macrophages is, in fact, not a primary consequence of Irgm1 deficiency in those cells but rather a downstream result driven by diverse metabolic changes in these cells. In addition, the results raise the possibility that high ROS levels may be necessary for the effect of LC-AC on mitochondrial morphology and the enhanced cytokine production seen in Irgm1-deficient cells.
FIGURE 6.

The punctate mitochondrial morphology is increased in IFN-γ-primed macrophages lacking Irgm1 and is dependent on fatty acid synthesis and reactive oxygen species. A–D, BMM of the indicated genotype were plated on coverslips. Following various treatments, the cells were immunostained with antibodies to the mitochondrial marker TOM20. The mitochondrial morphology of cells was assessed in a blinded fashion in 50 cells/genotype/experiment. Shown is the average percentage of cells with an overall punctate mitochondrial morphology. In A, the cells were maintained under control conditions, were primed with IFN-γ for 24 h, or were activated with IFN-γ and LPS for 16 h. In B, the cells were maintained under control conditions or were primed with IFN-γ for 24 h. In C, the cells were maintained under control conditions or were primed with IFN-γ for 24 h with or without the fatty acid synthesis inhibitors, cerulenin or C75. In D, the cells were maintained under control conditions or primed with IFN-γ for 24 h with or without the reactive oxygen species quencher NAC. E, BMM of the indicated genotypes were maintained under control conditions, were primed with IFN-γ for 24 h, or were activated with IFN-γ and LPS for 16 h with or without the reactive oxygen species quencher, NAC. ROS levels were measured with the fluorescent probe 2′,7′-dichlorofluorescindiacetate (DCFDA). F and G, BMM of the indicated genotypes were maintained under control conditions or primed with IFN-γ for 24 h with or without the reactive oxygen species quencher NAC. MCP-1 or RANTES was measured in conditioned media from the cells using ELISA. For each figure, shown are average values from experiments performed at least three times. Error bars, S.E. *, p < 0.05; ***, p < 0.001.
Effect of Metabolic Changes on Proinflammatory Cytokine Production in Irgm1-deficient Macrophages
Because the metabolic changes seemed to be a primary consequence of Irgm1 deficiency in IFN-γ-primed macrophages, we addressed whether the changes in glycolytic activity and accumulation of LC-AC in Irgm1-deficient macrophages were necessary for the marked increases in inflammatory cytokine production. To examine the impact of increased glycolysis, cells were treated with the glycolytic inhibitor 2-DG. As hypothesized, this muted the increase in both RANTES and MCP-1 (Fig. 7, A and B). In parallel, the buildup of LC-AC was prevented by treating the cells with cerulenin or C75. Treatment with either fatty acid synthase inhibitor muted the increased RANTES and MCP-1 secretion in Irgm1-deficient, IFN-γ-primed BMM to near WT levels (Fig. 7, C and D). These results indicate that the striking metabolic changes displayed in Irgm1-deficient macrophages following exposure to IFN-γ are key drivers of the pro-inflammatory phenotype of those cells.
FIGURE 7.

Blocking glycolysis or fatty acid synthesis mitigates the increased pro-inflammatory cytokine secretion in IFN-γ-primed macrophages lacking Irgm1. BMM of the indicated genotypes were plated in triplicate and maintained under control conditions, primed with IFN-γ, primed with IFN-γ, and simultaneously exposed to glycolytic inhibitor 2-DG (A and B) or primed with IFN-γ and simultaneously exposed to the fatty acid synthase inhibitors the fatty acid synthase inhibitor C75 or cerulenin (C and D) for 24 h. Conditioned media were isolated and used to perform ELISA to measure either RANTES (A and C) or MCP-1(B and D). Shown are average values over at least three separate experiments using BMM cultures from separate mice. Error bars, S.E. *, p < 0.05; ***, p < 0.001.
Discussion
Specific metabolic changes are required for the effector functions of many immune cells. Up-regulation of aerobic glycolysis often provides a source of biosynthetic materials in inflammatory and/or rapidly proliferating immune cells, whereas non-inflammatory immune cells that typically have longer life spans commonly rely on fatty acid oxidation and oxidative metabolism for energy production (39). This is true of macrophages in which activation to the M1 inflammatory state following exposure to LPS (alone or in combination with IFN-γ) is driven by a shift from energy metabolism dominated by oxidative phosphorylation and β-oxidation to one dominated by aerobic glycolysis (60). As we demonstrate here, despite the substantial transcriptional and epigenetically driven changes in gene expression that are known to be induced by IFN-γ in macrophages (35, 45, 61–64), IFN-γ-primed WT macrophages do not display the dramatic shifts in energy metabolism or the accumulation of long chain fatty acids seen in LPS-activated macrophages. This is in keeping with previously published data showing that IFN-γ induces translational modifications that, in fact, up-regulate pathways associated with oxidative phosphorylation and mitochondrial function while suppressing translational efficiency in pathways associated with biosynthetic activity (45, 64). Given this context, it is striking that we find that Irgm1 deficiency induces increased glycolysis and LC-AC accumulation in macrophages that have only been primed with IFN-γ, which, in effect, partially mimics the metabolic shifts occurring in WT cells fully activated with LPS. As we demonstrate, these aberrant metabolic changes in Irgm1-deficient macrophages drive inappropriate increases in expression of at least a subset of inflammatory cytokines, including the chemokines RANTES/CCL5 and MCP-1/CCL2. Our data do not differentiate whether the primary change driven by Irgm1 deficiency is the accumulation of LC-AC, promotion of glycolysis, or even sensitivity to ROS-driven changes in metabolism. Nevertheless, the identified metabolic alterations probably contribute to the autoinflammation that we show in uninfected, Irgm1-deficient mice and may also contribute to enhanced inflammatory responses that we have seen in Irgm1-deficient mice in the intestine (53) and following bacterial infections (13, 65, 66).
The underlying impetus for the metabolic changes seen in Irgm1-deficient macrophages could be the alterations in autophagy that we and others have documented as occurring with Irgm1-deficiency. That work has suggested an impairment in autophagic flux in Irgm1-deficient macrophages (15, 27, 52), fibroblasts (21), and intestinal enterocytes (53). Broadly speaking, autophagy is known to promote oxidative respiration, and conversely, its inhibition leads to increased glycolysis (38, 39). Nevertheless, our results demonstrate that inhibiting autophagy through genetic elimination of the essential autophagy protein, Atg7, does not lead to altered RANTES production in IFN-γ-primed macrophages. Additionally, lack of Atg7 did not affect mitochondrial morphology, in contrast to the strong promotion of mitochondrial fission that we saw in Irgm1-deficient macrophages. Although it remains possible that inhibition of autophagy drives excessive production of some cytokines in Irgm1-deficient cells (perhaps IL-1β and/or TNF-α in cells activated with LPS), our data strongly support the existence of an autophagy-independent mechanism that causes production of a subset of the inflammatory cytokines produced in IFN-γ-primed, Irgm1-deficient macrophages. It remains possible that signaling upstream of autophagy may still drive these changes (e.g. perturbation of mTOR and altered activation of mTOR-regulated pathways that are distinct from autophagy) (67). Although we currently have no evidence for this, IFN-γ priming of macrophages has been reported to inhibit mTOR activity (45, 68), whereas in contrast, activation with LPS exposure activates mTOR (67, 69). Indeed, activation of mTOR is a key mechanism through which M1 inflammatory macrophages meet the high biosynthetic activity required for a sustained inflammatory response (45, 67, 70). This and other pathways should be tested in future studies.
A second process that may potentially drive the metabolic changes in Irgm1-deficient macrophages is the increase in mitochondrial fission in those cells that we demonstrate here. Mitochondrial dynamics have generally been associated with different metabolic states; cells relying on fatty acid oxidation or oxidative phosphorylation often display fused networks of mitochondria, whereas those relying on glycolysis tend to have more punctate mitochondria (71–75). Further, promoting mitochondrial fission and/or blocking fusion can stimulate pro-inflammatory cytokine production (55, 59, 76, 77). Nevertheless, our results suggest that the punctate mitochondrial morphology seen in Irgm1-deficient cells is secondary to accumulation of LC-AC in those cells, because treatment of the cells with fatty acid synthase inhibitors to reduce fatty acid concentrations not only blunted RANTES production in IFN-γ-primed, Irgm1-deficient macrophages, it also eliminated the punctate mitochondrial phenotype. This notion is contrary to previous studies that have suggested a direct role for Irgm1 in both associating with the mitochondria and controlling their dynamics (20, 21, 25, 27, 78).
Our ROS-quenching experiments using NAC suggest that ROS are probably required for the effect of Irgm1 deficiency on mitochondrial morphology and production of RANTES and MCP-1 in IFN-γ-primed Irgm1-deficient macrophages. We currently do not know the underlying mechanism. Our results are consistent with a previously published study showing that the effect of LC-AC in increasing inflammatory cytokine production is dependent on the ROS tone of the cells (79). They are also consistent with many studies showing that ROS drive chemokine expression, including that in IFN-γ-stimulated cells (80). However, interpretation of our results is tempered by the fact that we did not find an elevation of ROS levels in IFN-γ-primed Irgm1-deficient BMM compared with primed WT BMM. The NAC that was used in our studies is a commonly used direct ROS scavenger that also acts indirectly to quench ROS by inducing expression of glutathione (81–83). Nevertheless, some studies have found that NAC can cause effects in cells not related to ROS quenching, as a consequence of its reductive capacity and direct interaction with target proteins to modify their activities (84). Future studies should clarify the role of ROS in enhanced cytokine production in Irgm1-deficient macrophages.
Our data strongly point to the accumulation of LC-AC as being pivotal for key aspects of the phenotype of Irgm1-deficient macrophages, including the increased production of pro-inflammatory cytokines and the altered mitochondrial dynamics. The underlying basis for the LC-AC accumulation is not clear. Although our data do not differentiate between increased synthesis of fatty acids and decreased flux through β-oxidation, it seems likely that a decrease in β-oxidation is involved. The pronounced reduction in citrate levels that we found in IFN-γ-primed, Irgm1-deficient macrophages is consistent with a decrease in β-oxidation that would otherwise replenish citrate levels for flux through the tricarboxylic acid cycle (38, 85, 86). The reduced citrate availability would probably have the effect of decreasing fatty acid synthesis as well as promoting glycolysis by reducing the inhibitory effect of citrate on phosphofructokinase (85). It is plausible that Irgm1 could play a direct role in lipid homeostasis, because it is a dynamin-like GTPase that associates with specific intracellular membrane compartments, including the Golgi, where it may alter membrane trafficking (11, 12, 21, 25, 52, 78, 87). Additionally, IRGM proteins have been reported to play roles in lipid droplet maintenance (27, 78, 88). The novel role for Irgm1, and perhaps other IRG proteins, in modulating fatty acid accumulation and metabolism establishes a new direction for research to unravel the roles of IRG proteins in the regulation of inflammation.
Experimental Procedures
Mice and Cell Culture
Irgm1-deficient tk;1(23) and Atg7f/fLysM-Cre mice have been described previously (90). All mice were housed and maintained under procedures approved by the institutional animal care and use committees at the Duke University and Durham Veterans Affairs Medical Centers.
Primary murine BMM were isolated from the tibia and femurs of 2–4-month-old mice and cultured according to standard procedures described previously (13). The bone marrow was flushed from the bones using a 27-gauge needle fitted to a syringe filled with DMEM (Life Technologies, Inc.); the marrow was dispersed by drawing through the needle 3–4 times; and red cells were lysed with ACK lysing buffer (Life Technologies). Adherent cells were cultured for 6 days in BMM medium (DMEM supplemented with 10% (v/v) FBS (Hyclone) and 30% (v/v) L929 cell-conditioned medium). The cells were cultured on Petri dishes that were not cell culture-treated, resulting in cultures that were loosely adherent and easily removed from the plates with cell dissociation buffer (13150-016, Gibco/Thermo Fisher Scientific). Twenty-four hours before all experiments, the cells were placed in medium lacking L929-conditioned media (DMEM (11995, Gibco/Thermo Fisher Scientific), supplemented with 10% (v/v) FBS and 100 units/ml penicillin plus 100 μg/ml streptomycin (15140, Gibco/Thermo Fisher Scientific)) on coverslips or cell culture plates. All primary cells and cell lines were grown and maintained in a humidified atmosphere of 5% CO2 at 37 °C. Where appropriate, 0.2 μg/ml IFN-γ (IF005, EMD Millipore) and/or 100 ng/ml LPS (L2387, Sigma) was included in the growth medium.
Primary mouse embryonic fibroblasts were isolated and cultured according to standard procedures (91, 92) in media containing DMEM supplemented with 10% (v/v) FBS. The cells were used for experiments between passages 2 and 5.
Bacterial Infections
S. typhimurium SL1344 (93) was cultured overnight at 37 ºC in Luria-Bertani (LB) broth without shaking. Mice were injected i.v. with 6 × 10⁵ bacteria in a volume of 0.1 ml of PBS as described previously (13).
Serum Cytokine Array
Sera were isolated, immediately frozen, and stored at −80 °C. Serum cytokine levels were determined using a BioPlex Mouse Cytokine 23-plex Assay (Bio-Rad). All bead assay samples were quantified on the BioPlex protein array reader (Bio-Rad) in the Laboratory Immunology Unit (Duke Human Vaccine Institute, Durham, NC).
Immunocytochemistry and Mitochondrial Morphology Assay
Cells were fixed on coverslips with 4% paraformaldehyde (w/v) in PBS for 15 min and permeabilized with 0.2% (w/v) saponin in PBS for 10 min. The cells were then stained for 60 min with anti-TOM20 rabbit polyclonal antibody (FL-145, Santa Cruz Biotechnology, Inc.) at a 1:500 dilution, followed by Alexa Fluor-conjugated secondary antibody (Molecular Probes/Invitrogen) at a 1:750 dilution for an additional 60 min. Cells were imaged on an Olympus IX70 inverted fluorescence microscope equipped with a Hamamatsu C8484-03G01 digital camera and ASI MS2000 XY Piezo Z stage. Cells were magnified ×1000. Fifty wide-field fluorescence images were collected per coverslip using Metamorph. All images in an experiment were pooled and randomized in a blinded fashion before being classified as having a tubular, punctate, or mixed mitochondrial phenotype. The images were decoded, and mitochondrial morphologies were expressed as percentage of cells/mitochondrial phenotype.
Western Blotting
Western blotting analyses were performed according to standard protocols (52). Electron transport chain proteins were probed using the Total OXPHOS Rodent WB antibody mixture (Abcam, ab110413) at a 1:250 dilution, anti-actin mouse monoclonal antibody (MAB1501, Millipore) at 1:1500, and goat anti-mouse (HL) HRP-conjugated IgG (AP308P, Millipore) at 1:1000. The blots were imaged on a Kodak Image Station 4000R using Carestream molecular imaging software. The sum intensities of the dot blots were calculated using the Carestream software and normalized to protein content.
Measurements of Cytokines and Chemokines
A Proteome Profiler mouse cytokine array kit, panel A (ARY006, R&D Systems) was used to compare levels of a small array of cytokines. Cells were plated at 3 × 10⁵ cells/well in 6-well plates and primed with IFN-γ for 24 h. The conditioned media from triplicate wells were collected and pooled and then used to carry out the assay according to the manufacturer's instructions. The dot blots were imaged on a 4000R Kodak Image Station using Carestream molecular imaging software. The sum intensities of the dot blots were calculated using the Carestream software and were normalized to protein content.
ELISA kits were used to measure levels of individual cytokines (mouse RANTES/CCL5, DY478, R&D Systems; mouse MCP-1/CCL2, DY479, R&D Systems). Cells were plated in triplicate at 1 × 10⁵ cells/well in 24-well plates; 24 h later, the media were changed, and the cells were incubated for an additional 24 h in 0.5 ml of media containing the following as appropriate: 0.2 μg/ml IFN-γ (IF005, EMD Millipore), 20 μm cerulenin (C2389, Sigma), 10 μm C75 (C5490, Sigma), 1 mm 2-deoxy-d-glucose (D6134, Sigma), and/or 15 mm N-acetyl-l-cysteine (A7250, Sigma). Conditional media were collected from each well and used undiluted for the MCP-1 ELISA or at a 1:4 dilution for the RANTES ELISA according to the manufacturer's instructions. The absorbance was read using Gen5 software on a BioTek Synergy 2 plate reader.
Metabolic Assays
The OCR and ECAR were measured with a XF24 extracellular flux analyzer (Seahorse Bioscience) using kits and protocols provided by the manufacturer. 1 × 10⁵ cells/well were plated in the Seahorse 24-well plate and incubated with 0.2 μg/ml IFN-γ for 24 h. Cells were washed and incubated in 600 μl of Seahorse media in a CO2-free incubator for 30 min before the assay. The OCR was then measured over time, following injection of 1 μm oligomycin, 3 μm carbonyl cyanide p-trifluoromethoxyphenylhydrazone, and 100 nm rotenone/antimycin A, as described in the Seahorse mitochondrial stress test kit (103015-100, Seahorse XF). The OCR was measured without glutamine or glucose added to the media. The ECAR was measured following injection of 10 mm d-glucose, 1 μm oligomycin, and 20 mm 2-DG as described in the Seahorse glycolytic stress test kit (103020-100, Seahorse XF). The ECAR was also measured without glucose or glutamine added to the media. ECAR and OCR measurements were normalized to protein content.
Metabolite Measurements
Primary murine BMM or fibroblasts were cultured in triplicate on 100-mm cell culture plates at a density of 3.4 × 10⁶ cells/plate. The medium (DMEM supplemented with 10% (v/v) FBS) was supplemented with 0.5 mm l-carnitine and a 100 μm concentration of a 1:1 oleate/palmitate stock complexed to 0.14% (w/v) BSA. The cells were maintained under those conditions or additionally exposed to 0.2 μg/ml IFN-γ and/or 100 ng/ml LPS for 16 h. The cells were then scraped and collected in 0.3 ml of 0.6% (v/v) formic acid. An equal volume of acetonitrile was then added to the lysates, which were then stored at −80º C. Targeted mass spectrometry-based metabolic profiling was performed at the Duke Sarah W. Stedman Nutrition and Metabolism Center Mass Spectrometry Laboratory as described previously (22, 89, 94). Free carnitine, acylcarnitine, and amino acid levels from macrophage samples were measured by direct injection electrospray tandem mass spectrometry (MS/MS) using a Micromass Quattro Micro LC-MS system (Waters-Micromass, Milford, MA) equipped with a model HTS-PAL 2777 autosampler (Leap Technologies, Carrboro, NC), a model 1525 HPLC solvent delivery system (Agilent Technologies, Palo Alto, CA), and a data system running MassLynx version 4.0 software (Waters, Milford, MA) (89, 94). Organic acids were quantified using methods described previously (22) employing Trace Ultra GC coupled to a Trace DSQ mass spectrometer operating under Excalibur version 1.4 (Thermo Fisher Scientific, Austin, TX). Metabolite data were normalized to the total protein content in each sample as determined by the Pierce BCA protein assay kit (23225, Pierce Thermo Fisher Scientific).
Statistical Analysis
As indicated for the particular figure, the Z test or Student's t test, as calculated by Excel, was used to assess statistical significance. The significance threshold was set a priori to be p < 0.05.
Author Contributions
E. A. S. conducted or contributed to all of the experiments, analyzed the results, and wrote the paper. B. E. F. assisted with cell culture and Western blotting. S. C. H. infected mice with S. typhimurium and collected serum. A. G. N. provided technical assistance with the Seahorse analyses. M. L. S., J. C. R., N. J. M., and J. C. provided technical assistance with experimental design and interpretation. O. R. I. and T. R. K. performed metabolic analysis of macrophage lysates. G. A. T. conceived and coordinated the studies, analyzed data, and wrote the paper. All authors reviewed the results and approved the final version of the manuscript.
Supplementary Material
Acknowledgments
We thank Drs. Tso-Pang Yao, Patrick Seed, and David Pickup for many helpful conversations regarding this work. Cytokine profiling was performed under the management of Dr. Heather E. Lynch and the direction of Dr. Gregory D. Sempowski in the Immunology Unit of the Duke Regional Biocontainment Laboratory, which received partial support for construction from NIAID, National Institutes of Health, Grant UC6-AI058607.
This work was supported by Veterans Affairs Merit Review Grant VA I01 BX002369 and National Institutes of Health Grant R01 AI57831. The authors declare that they have no conflicts of interest with the contents of this article. The content is solely the responsibility of the authors and does not necessarily represent the official views of the National Institutes of Health.

This article contains supplemental Tables S1 and S2.
E. A. Schmidt, B. E. Fee, S. C. Henry, A. G. Nichols, M. L. Shinohara, J. C. Rathmell, N. J. MacIver, J. Coers, O. R. Ilkayeva, T. R. Koves, and G. A. Taylor, unpublished data.
- IRG
- immunity-related GTPase
- BMM
- bone marrow-derived macrophage(s)
- RANTES
- regulated on activation normal T cell expressed and secreted
- LC-AC
- long chain acylcarnitine(s)
- 2-DG
- 2-deoxy-d-glucose
- ECAR
- extracellular acidification rate
- OCR
- oxygen consumption rate
- OXPHOS
- oxidative phosphorylation
- ROS
- reactive oxygen species
- NAC
- N-acetyl cysteine.
References
- 1. Uthaiah R. C., Praefcke G. J., Howard J. C., and Herrmann C. (2003) IIGP1, an interferon-γ-inducible 47-kDa GTPase of the mouse, showing cooperative enzymatic activity and GTP-dependent multimerization. J. Biol. Chem. 278, 29336–29343 [DOI] [PubMed] [Google Scholar]
- 2. Pilla-Moffett D., Barber M. F., Taylor G. A., and Coers J. (2016) Interferon-inducible GTPases in host resistance, inflammation and disease. J. Mol. Biol. 428, 3495–3513 [DOI] [PMC free article] [PubMed] [Google Scholar]
- 3. MacMicking J. D. (2012) Interferon-inducible effector mechanisms in cell-autonomous immunity. Nat. Rev. Immunol. 12, 367–382 [DOI] [PMC free article] [PubMed] [Google Scholar]
- 4. Kim B. H., Shenoy A. R., Kumar P., Bradfield C. J., and MacMicking J. D. (2012) IFN-inducible GTPases in host cell defense. Cell Host Microbe 12, 432–444 [DOI] [PMC free article] [PubMed] [Google Scholar]
- 5. Tiwari S., Choi H. P., Matsuzawa T., Pypaert M., and MacMicking J. D. (2009) Targeting of the GTPase Irgm1 to the phagosomal membrane via PtdIns(3,4)P(2) and PtdIns(3,4,5)P(3) promotes immunity to mycobacteria. Nat. Immunol. 10, 907–917 [DOI] [PMC free article] [PubMed] [Google Scholar]
- 6. Randow F., MacMicking J. D., and James L. C. (2013) Cellular self-defense: how cell-autonomous immunity protects against pathogens. Science 340, 701–706 [DOI] [PMC free article] [PubMed] [Google Scholar]
- 7. Hunn J. P., Koenen-Waisman S., Papic N., Schroeder N., Pawlowski N., Lange R., Kaiser F., Zerrahn J., Martens S., and Howard J. C. (2008) Regulatory interactions between IRG resistance GTPases in the cellular response to Toxoplasma gondii. EMBO J. 27, 2495–2509 [DOI] [PMC free article] [PubMed] [Google Scholar]
- 8. Zhao Y. O., Khaminets A., Hunn J. P., and Howard J. C. (2009) Disruption of the Toxoplasma gondii parasitophorous vacuole by IFNγ-inducible immunity-related GTPases (IRG proteins) triggers necrotic cell death. PLoS Pathog. 5, e1000288. [DOI] [PMC free article] [PubMed] [Google Scholar]
- 9. Taylor G. A., Stauber R., Rulong S., Hudson E., Pei V., Pavlakis G. N., Resau J. H., and Vande Woude G. F. (1997) The inducibly expressed GTPase localizes to the endoplasmic reticulum, independently of GTP binding. J. Biol. Chem. 272, 10639–10645 [DOI] [PubMed] [Google Scholar]
- 10. Praefcke G. J., and McMahon H. T. (2004) The dynamin superfamily: universal membrane tubulation and fission molecules? Nat. Rev. Mol. Cell Biol. 5, 133–147 [DOI] [PubMed] [Google Scholar]
- 11. Butcher B. A., Greene R. I., Henry S. C., Annecharico K. L., Weinberg J. B., Denkers E. Y., Sher A., and Taylor G. A. (2005) p47 GTPases regulate Toxoplasma gondii survival in activated macrophages. Infect. Immun. 73, 3278–3286 [DOI] [PMC free article] [PubMed] [Google Scholar]
- 12. Martens S., Sabel K., Lange R., Uthaiah R., Wolf E., and Howard J. C. (2004) Mechanisms regulating the positioning of mouse p47 resistance GTPases LRG-47 and IIGP1 on cellular membranes: retargeting to plasma membrane induced by phagocytosis. J. Immunol. 173, 2594–2606 [DOI] [PubMed] [Google Scholar]
- 13. Henry S. C., Daniell X., Indaram M., Whitesides J. F., Sempowski G. D., Howell D., Oliver T., and Taylor G. A. (2007) Impaired macrophage function underscores susceptibility to Salmonella in mice lacking Irgm1 (LRG-47). J. Immunol. 179, 6963–6972 [DOI] [PubMed] [Google Scholar]
- 14. Henry S. C., Traver M., Daniell X., Indaram M., Oliver T., and Taylor G. A. (2010) Regulation of macrophage motility by Irgm1. J. Leukoc. Biol. 87, 333–343 [DOI] [PMC free article] [PubMed] [Google Scholar]
- 15. Singh S. B., Davis A. S., Taylor G. A., and Deretic V. (2006) Human IRGM induces autophagy to eliminate intracellular mycobacteria. Science 313, 1438–1441 [DOI] [PubMed] [Google Scholar]
- 16. Chauhan S., Mandell M. A., and Deretic V. (2015) IRGM governs the core autophagy machinery to conduct antimicrobial defense. Mol. Cell 58, 507–521 [DOI] [PMC free article] [PubMed] [Google Scholar]
- 17. Intemann C. D., Thye T., Niemann S., Browne E. N., Amanua Chinbuah M., Enimil A., Gyapong J., Osei I., Owusu-Dabo E., Helm S., Rüsch-Gerdes S., Horstmann R. D., and Meyer C. G. (2009) Autophagy gene variant IRGM −261T contributes to protection from tuberculosis caused by Mycobacterium tuberculosis but not by M. africanum strains. PLoS Pathog. 5, e1000577. [DOI] [PMC free article] [PubMed] [Google Scholar]
- 18. Kimura T., Watanabe E., Sakamoto T., Takasu O., Ikeda T., Ikeda K., Kotani J., Kitamura N., Sadahiro T., Tateishi Y., Shinozaki K., and Oda S. (2014) Autophagy-related IRGM polymorphism is associated with mortality of patients with severe sepsis. PLoS One 9, e91522. [DOI] [PMC free article] [PubMed] [Google Scholar]
- 19. Petkova D. S., Viret C., and Faure M. (2012) IRGM in autophagy and viral infections. Front. Immunol. 3, 426. [DOI] [PMC free article] [PubMed] [Google Scholar]
- 20. Singh S. B., Ornatowski W., Vergne I., Naylor J., Delgado M., Roberts E., Ponpuak M., Master S., Pilli M., White E., Komatsu M., and Deretic V. (2010) Human IRGM regulates autophagy and cell-autonomous immunity functions through mitochondria. Nat. Cell Biol. 12, 1154–1165 [DOI] [PMC free article] [PubMed] [Google Scholar]
- 21. Henry S. C., Schmidt E. A., Fessler M. B., and Taylor G. A. (2014) Palmitoylation of the immunity-related GTPase, Irgm1: impact on membrane localization and ability to promote mitochondrial fission. PLoS One 9, e95021. [DOI] [PMC free article] [PubMed] [Google Scholar]
- 22. Jensen M. V., Joseph J. W., Ilkayeva O., Burgess S., Lu D., Ronnebaum S. M., Odegaard M., Becker T. C., Sherry A. D., and Newgard C. B. (2006) Compensatory responses to pyruvate carboxylase suppression in islet β-cells: preservation of glucose-stimulated insulin secretion. J. Biol. Chem. 281, 22342–22351 [DOI] [PubMed] [Google Scholar]
- 23. Collazo C. M., Yap G. S., Sempowski G. D., Lusby K. C., Tessarollo L., Vande Woude G. F., Sher A., and Taylor G. A. (2001) Inactivation of LRG-47 and IRG-47 reveals a family of interferon γ-inducible genes with essential, pathogen-specific roles in resistance to infection. J. Exp. Med. 194, 181–188 [DOI] [PMC free article] [PubMed] [Google Scholar]
- 24. Saiga H., Shimada Y., and Takeda K. (2011) Innate immune effectors in mycobacterial infection. Clin. Dev. Immunol. 2011, 347594. [DOI] [PMC free article] [PubMed] [Google Scholar]
- 25. Springer H. M., Schramm M., Taylor G. A., and Howard J. C. (2013) Irgm1 (LRG-47), a regulator of cell-autonomous immunity, does not localize to mycobacterial or listerial phagosomes in IFN-γ-induced mouse cells. J. Immunol. 191, 1765–1774 [DOI] [PMC free article] [PubMed] [Google Scholar]
- 26. Howard J. (2008) The IRG proteins: a function in search of a mechanism. Immunobiology 213, 367–375 [DOI] [PubMed] [Google Scholar]
- 27. Maric-Biresev J., Hunn J. P., Krut O., Helms J. B., Martens S., and Howard J. C. (2016) Loss of the interferon-γ-inducible regulatory immunity-related GTPase (IRG), Irgm1, causes activation of effector IRG proteins on lysosomes, damaging lysosomal function and predicting the dramatic susceptibility of Irgm1-deficient mice to infection. BMC Biol. 14, 33. [DOI] [PMC free article] [PubMed] [Google Scholar]
- 28. Delgado M., Singh S., De Haro S., Master S., Ponpuak M., Dinkins C., Ornatowski W., Vergne I., and Deretic V. (2009) Autophagy and pattern recognition receptors in innate immunity. Immunol. Rev. 227, 189–202 [DOI] [PMC free article] [PubMed] [Google Scholar]
- 29. Deretic V. (2011) Autophagy in immunity and cell-autonomous defense against intracellular microbes. Immunol. Rev. 240, 92–104 [DOI] [PMC free article] [PubMed] [Google Scholar]
- 30. Grégoire I. P., Richetta C., Meyniel-Schicklin L., Borel S., Pradezynski F., Diaz O., Deloire A., Azocar O., Baguet J., Le Breton M., Mangeot P. E., Navratil V., Joubert P. E., Flacher M., Vidalain P. O., et al. (2011) IRGM is a common target of RNA viruses that subvert the autophagy network. PLoS Pathog. 7, e1002422. [DOI] [PMC free article] [PubMed] [Google Scholar]
- 31. Juhas U., Ryba-Stanislawowska M., Szargiej P., and Mysliwska J. (2015) Different pathways of macrophage activation and polarization. Postepy Hig. Med. Dosw. 69, 496–502 [DOI] [PubMed] [Google Scholar]
- 32. Galván-Peña S., and O'Neill L. A. (2014) Metabolic reprograming in macrophage polarization. Front. Immunol. 5, 420. [DOI] [PMC free article] [PubMed] [Google Scholar]
- 33. Martinez F. O., and Gordon S. (2014) The M1 and M2 paradigm of macrophage activation: time for reassessment. F1000Prime Rep. 6, 13. [DOI] [PMC free article] [PubMed] [Google Scholar]
- 34. O'Neill L. A., Kishton R. J., and Rathmell J. (2016) A guide to immunometabolism for immunologists. Nat. Rev. Immunol. 16, 553–565 [DOI] [PMC free article] [PubMed] [Google Scholar]
- 35. Hu X., and Ivashkiv L. B. (2009) Cross-regulation of signaling pathways by interferon-γ: implications for immune responses and autoimmune diseases. Immunity 31, 539–550 [DOI] [PMC free article] [PubMed] [Google Scholar]
- 36. Ivashkiv L. B. (2013) Epigenetic regulation of macrophage polarization and function. Trends Immunol. 34, 216–223 [DOI] [PMC free article] [PubMed] [Google Scholar]
- 37. Schwartz Y., and Svistelnik A. V. (2012) Functional phenotypes of macrophages and the M1-M2 polarization concept. Part I. Proinflammatory phenotype. Biochemistry 77, 246–260 [DOI] [PubMed] [Google Scholar]
- 38. O'Neill L. A., and Pearce E. J. (2016) Immunometabolism governs dendritic cell and macrophage function. J. Exp. Med. 213, 15–23 [DOI] [PMC free article] [PubMed] [Google Scholar]
- 39. Rathmell J. C. (2012) Metabolism and autophagy in the immune system: immunometabolism comes of age. Immunol. Rev. 249, 5–13 [DOI] [PMC free article] [PubMed] [Google Scholar]
- 40. King K. Y., Baldridge M. T., Weksberg D. C., Chambers S. M., Lukov G. L., Wu S., Boles N. C., Jung S. Y., Qin J., Liu D., Songyang Z., Eissa N. T., Taylor G. A., and Goodell M. A. (2011) Irgm1 protects hematopoietic stem cells by negative regulation of IFN signaling. Blood 118, 1525–1533 [DOI] [PMC free article] [PubMed] [Google Scholar]
- 41. Artyomov M. N., Sergushichev A., and Schilling J. D. (2016) Integrating immunometabolism and macrophage diversity. Semin. Immunol. 28, 417–424 [DOI] [PMC free article] [PubMed] [Google Scholar]
- 42. Schertzer J. D., and Steinberg G. R. (2014) Immunometabolism: the interface of immune and metabolic responses in disease. Immunol. Cell Biol. 92, 303. [DOI] [PubMed] [Google Scholar]
- 43. Kelly B., and O'Neill L. A. (2015) Metabolic reprogramming in macrophages and dendritic cells in innate immunity. Cell Res. 25, 771–784 [DOI] [PMC free article] [PubMed] [Google Scholar]
- 44. Martinez F. O., Gordon S., Locati M., and Mantovani A. (2006) Transcriptional profiling of the human monocyte-to-macrophage differentiation and polarization: new molecules and patterns of gene expression. J. Immunol. 177, 7303–7311 [DOI] [PubMed] [Google Scholar]
- 45. Su X., Yu Y., Zhong Y., Giannopoulou E. G., Hu X., Liu H., Cross J. R., Rätsch G., Rice C. M., and Ivashkiv L. B. (2015) Interferon-γ regulates cellular metabolism and mRNA translation to potentiate macrophage activation. Nat. Immunol. 16, 838–849 [DOI] [PMC free article] [PubMed] [Google Scholar]
- 46. Van den Bossche J., Baardman J., and de Winther M. P. (2015) Metabolic characterization of polarized M1 and M2 bone marrow-derived macrophages using real-time extracellular flux analysis. J. Vis. Exp. 10.3791/53424 [DOI] [PMC free article] [PubMed] [Google Scholar]
- 47. Moon J. S., Lee S., Park M. A., Siempos I. I., Haslip M., Lee P. J., Yun M., Kim C. K., Howrylak J., Ryter S. W., Nakahira K., and Choi A. M. (2015) UCP2-induced fatty acid synthase promotes NLRP3 inflammasome activation during sepsis. J. Clin. Invest. 125, 665–680 [DOI] [PMC free article] [PubMed] [Google Scholar] [Retracted]
- 48. Ecker J., Liebisch G., Englmaier M., Grandl M., Robenek H., and Schmitz G. (2010) Induction of fatty acid synthesis is a key requirement for phagocytic differentiation of human monocytes. Proc. Natl. Acad. Sci. U.S.A. 107, 7817–7822 [DOI] [PMC free article] [PubMed] [Google Scholar]
- 49. Steinberg G. R., and Schertzer J. D. (2014) AMPK promotes macrophage fatty acid oxidative metabolism to mitigate inflammation: implications for diabetes and cardiovascular disease. Immunol. Cell Biol. 92, 340–345 [DOI] [PubMed] [Google Scholar]
- 50. Rutkowsky J. M., Knotts T. A., Ono-Moore K. D., McCoin C. S., Huang S., Schneider D., Singh S., Adams S. H., and Hwang D. H. (2014) Acylcarnitines activate proinflammatory signaling pathways. Am. J. Physiol. Endocrinol. Metab. 306, E1378–E1387 [DOI] [PMC free article] [PubMed] [Google Scholar]
- 51. McCoin C. S., Knotts T. A., and Adams S. H. (2015) Acylcarnitines: old actors auditioning for new roles in metabolic physiology. Nat. Rev. Endocrinol. 11, 617–625 [DOI] [PMC free article] [PubMed] [Google Scholar]
- 52. Traver M. K., Henry S. C., Cantillana V., Oliver T., Hunn J. P., Howard J. C., Beer S., Pfeffer K., Coers J., and Taylor G. A. (2011) Immunity-related GTPase M (IRGM) proteins influence the localization of guanylate-binding protein 2 (GBP2) by modulating macroautophagy. J. Biol. Chem. 286, 30471–30480 [DOI] [PMC free article] [PubMed] [Google Scholar]
- 53. Liu B., Gulati A. S., Cantillana V., Henry S. C., Schmidt E. A., Daniell X., Grossniklaus E., Schoenborn A. A., Sartor R. B., and Taylor G. A. (2013) Irgm1-deficient mice exhibit Paneth cell abnormalities and increased susceptibility to acute intestinal inflammation. Am. J. Physiol. Gastrointest. Liver Physiol. 305, G573–G584 [DOI] [PMC free article] [PubMed] [Google Scholar]
- 54. Saitoh T., Fujita N., Jang M. H., Uematsu S., Yang B. G., Satoh T., Omori H., Noda T., Yamamoto N., Komatsu M., Tanaka K., Kawai T., Tsujimura T., Takeuchi O., Yoshimori T., and Akira S. (2008) Loss of the autophagy protein Atg16L1 enhances endotoxin-induced IL-1β production. Nature 456, 264–268 [DOI] [PubMed] [Google Scholar]
- 55. Park J., Choi H., Min J. S., Park S. J., Kim J. H., Park H. J., Kim B., Chae J. I., Yim M., and Lee D. S. (2013) Mitochondrial dynamics modulate the expression of pro-inflammatory mediators in microglial cells. J. Neurochem. 127, 221–232 [DOI] [PubMed] [Google Scholar]
- 56. Park S., Won J. H., Hwang I., Hong S., Lee H. K., and Yu J. W. (2015) Defective mitochondrial fission augments NLRP3 inflammasome activation. Sci. Rep. 5, 15489. [DOI] [PMC free article] [PubMed] [Google Scholar]
- 57. Wang Y., and Tabas I. (2014) Emerging roles of mitochondria ROS in atherosclerotic lesions: causation or association? J. Atheroscler. Thromb. 21, 381–390 [DOI] [PMC free article] [PubMed] [Google Scholar]
- 58. Dan Dunn J., Alvarez L. A., Zhang X., and Soldati T. (2015) Reactive oxygen species and mitochondria: a nexus of cellular homeostasis. Redox Biol. 6, 472–485 [DOI] [PMC free article] [PubMed] [Google Scholar]
- 59. Wang Y. (2014) Roles of Macrophage Mitochondrial Oxidative Stress and Mitochondrial Fission in Atherosclerosis, Ph.D. dissertation, Columbia University, New York [Google Scholar]
- 60. Freitag J., Berod L., Kamradt T., and Sparwasser T. (2016) Immunometabolism and autoimmunity. Immunol. Cell Biol. 94, 925–934 [DOI] [PubMed] [Google Scholar]
- 61. Glass C. K., and Natoli G. (2016) Molecular control of activation and priming in macrophages. Nat. Immunol. 17, 26–33 [DOI] [PMC free article] [PubMed] [Google Scholar]
- 62. Perkins D. J., Patel M. C., Blanco J. C., and Vogel S. N. (2016) Epigenetic mechanisms governing innate inflammatory responses. J. Interferon Cytokine Res. 36, 454–461 [DOI] [PMC free article] [PubMed] [Google Scholar]
- 63. Qiao Y., Giannopoulou E. G., Chan C. H., Park S. H., Gong S., Chen J., Hu X., Elemento O., and Ivashkiv L. B. (2013) Synergistic activation of inflammatory cytokine genes by interferon-γ-induced chromatin remodeling and toll-like receptor signaling. Immunity 39, 454–469 [DOI] [PMC free article] [PubMed] [Google Scholar]
- 64. Li P., Zhao Y., Wu X., Xia M., Fang M., Iwasaki Y., Sha J., Chen Q., Xu Y., and Shen A. (2012) Interferon γ (IFN-γ) disrupts energy expenditure and metabolic homeostasis by suppressing SIRT1 transcription. Nucleic Acids Res. 40, 1609–1620 [DOI] [PMC free article] [PubMed] [Google Scholar]
- 65. Feng C. G., Zheng L., Jankovic D., Báfica A., Cannons J. L., Watford W. T., Chaussabel D., Hieny S., Caspar P., Schwartzberg P. L., Lenardo M. J., and Sher A. (2008) The immunity-related GTPase Irgm1 promotes the expansion of activated CD4+ T cell populations by preventing interferon-γ-induced cell death. Nat. Immunol. 9, 1279–1287 [DOI] [PMC free article] [PubMed] [Google Scholar]
- 66. Bafica A., Feng C. G., Santiago H. C., Aliberti J., Cheever A., Thomas K. E., Taylor G. A., Vogel S. N., and Sher A. (2007) The IFN-inducible GTPase LRG47 (Irgm1) negatively regulates TLR4-triggered proinflammatory cytokine production and prevents endotoxemia. J. Immunol. 179, 5514–5522 [DOI] [PubMed] [Google Scholar]
- 67. Byles V., Covarrubias A. J., Ben-Sahra I., Lamming D. W., Sabatini D. M., Manning B. D., and Horng T. (2013) The TSC-mTOR pathway regulates macrophage polarization. Nat. Commun. 4, 2834. [DOI] [PMC free article] [PubMed] [Google Scholar]
- 68. Wei W. C., Liu C. P., Yang W. C., Shyur L. F., Sheu J. H., Chen S. S., and Yang N. S. (2015) Mammalian target of rapamycin complex 2 (mTORC2) regulates LPS-induced expression of IL-12 and IL-23 in human dendritic cells. J. Leukoc. Biol. 97, 1071–1080 [DOI] [PubMed] [Google Scholar]
- 69. Weichhart T., Hengstschläger M., and Linke M. (2015) Regulation of innate immune cell function by mTOR. Nat. Rev. Immunol. 15, 599–614 [DOI] [PMC free article] [PubMed] [Google Scholar]
- 70. Tannahill G. M., Curtis A. M., Adamik J., Palsson-McDermott E. M., McGettrick A. F., Goel G., Frezza C., Bernard N. J., Kelly B., Foley N. H., Zheng L., Gardet A., Tong Z., Jany S. S., Corr S. C., et al. (2013) Succinate is an inflammatory signal that induces IL-1β through HIF-1α. Nature 496, 238–242 [DOI] [PMC free article] [PubMed] [Google Scholar]
- 71. Buck M. D., O'Sullivan D., Klein Geltink R. I., Curtis J. D., Chang C. H., Sanin D. E., Qiu J., Kretz O., Braas D., van der Windt G. J., Chen Q., Huang S. C., O'Neill C. M., Edelson B. T., Pearce E. J., et al. (2016) Mitochondrial dynamics controls T cell fate through metabolic programming. Cell 166, 63–76 [DOI] [PMC free article] [PubMed] [Google Scholar]
- 72. Yu T., Robotham J. L., and Yoon Y. (2006) Increased production of reactive oxygen species in hyperglycemic conditions requires dynamic change of mitochondrial morphology. Proc. Natl. Acad. Sci. U.S.A. 103, 2653–2658 [DOI] [PMC free article] [PubMed] [Google Scholar]
- 73. Ayanga B. A., Badal S. S., Wang Y., Galvan D. L., Chang B. H., Schumacker P. T., and Danesh F. R. (2016) Dynamin-related protein 1 deficiency improves mitochondrial fitness and protects against progression of diabetic nephropathy. J. Am. Soc. Nephrol. 27, 2733–2747 [DOI] [PMC free article] [PubMed] [Google Scholar]
- 74. Mishra P., and Chan D. C. (2016) Metabolic regulation of mitochondrial dynamics. J. Cell Biol. 212, 379–387 [DOI] [PMC free article] [PubMed] [Google Scholar]
- 75. Wai T., and Langer T. (2016) Mitochondrial dynamics and metabolic regulation. Trends Endocrinol. Metab. 27, 105–117 [DOI] [PubMed] [Google Scholar]
- 76. Hahn W. S., Kuzmicic J., Burrill J. S., Donoghue M. A., Foncea R., Jensen M. D., Lavandero S., Arriaga E. A., and Bernlohr D. A. (2014) Proinflammatory cytokines differentially regulate adipocyte mitochondrial metabolism, oxidative stress, and dynamics. Am. J. Physiol. Endocrinol. Metab. 306, E1033–E1045 [DOI] [PMC free article] [PubMed] [Google Scholar]
- 77. Namgaladze D., Lips S., Leiker T. J., Murphy R. C., Ekroos K., Ferreiros N., Geisslinger G., and Brüne B. (2014) Inhibition of macrophage fatty acid β-oxidation exacerbates palmitate-induced inflammatory and endoplasmic reticulum stress responses. Diabetologia 57, 1067–1077 [DOI] [PubMed] [Google Scholar]
- 78. Haldar A. K., Saka H. A., Piro A. S., Dunn J. D., Henry S. C., Taylor G. A., Frickel E. M., Valdivia R. H., and Coers J. (2013) IRG and GBP host resistance factors target aberrant, “non-self” vacuoles characterized by the missing of “self” IRGM proteins. PLoS Pathog. 9, e1003414. [DOI] [PMC free article] [PubMed] [Google Scholar]
- 79. Huang S., Rutkowsky J. M., Snodgrass R. G., Ono-Moore K. D., Schneider D. A., Newman J. W., Adams S. H., and Hwang D. H. (2012) Saturated fatty acids activate TLR-mediated proinflammatory signaling pathways. J. Lipid Res. 53, 2002–2013 [DOI] [PMC free article] [PubMed] [Google Scholar]
- 80. Qi X. F., Teng Y. C., Yoon Y. S., Kim D. H., Cai D. Q., and Lee K. J. (2011) Reactive oxygen species are involved in the IFN-γ-stimulated production of Th2 chemokines in HaCaT keratinocytes. J. Cell. Physiol. 226, 58–65 [DOI] [PubMed] [Google Scholar]
- 81. Haschemi A., Kosma P., Gille L., Evans C. R., Burant C. F., Starkl P., Knapp B., Haas R., Schmid J. A., Jandl C., Amir S., Lubec G., Park J., Esterbauer H., Bilban M., et al. (2012) The sedoheptulose kinase CARKL directs macrophage polarization through control of glucose metabolism. Cell Metab. 15, 813–826 [DOI] [PMC free article] [PubMed] [Google Scholar]
- 82. Guerra C., Morris D., Sipin A., Kung S., Franklin M., Gray D., Tanzil M., Guilford F., Khasawneh F. T., and Venketaraman V. (2011) Glutathione and adaptive immune responses against Mycobacterium tuberculosis infection in healthy and HIV infected individuals. PLoS One 6, e28378. [DOI] [PMC free article] [PubMed] [Google Scholar]
- 83. Brown L. A., Ping X. D., Harris F. L., and Gauthier T. W. (2007) Glutathione availability modulates alveolar macrophage function in the chronic ethanol-fed rat. Am. J. Physiol. Lung Cell Mol. Physiol. 292, L824–L832 [DOI] [PubMed] [Google Scholar]
- 84. Sun S. Y. (2010) N-Acetylcysteine, reactive oxygen species and beyond. Cancer Biol. Ther. 9, 109–110 [DOI] [PMC free article] [PubMed] [Google Scholar]
- 85. Infantino V., Iacobazzi V., Menga A., Avantaggiati M. L., and Palmieri F. (2014) A key role of the mitochondrial citrate carrier (SLC25A1) in TNFα- and IFNγ-triggered inflammation. Biochim. Biophys. Acta 1839, 1217–1225 [DOI] [PMC free article] [PubMed] [Google Scholar]
- 86. Meiser J., Krämer L., Sapcariu S. C., Battello N., Ghelfi J., D'Herouel A. F., Skupin A., and Hiller K. (2016) Pro-inflammatory macrophages sustain pyruvate oxidation through pyruvate dehydrogenase for the synthesis of itaconate and to enable cytokine expression. J. Biol. Chem. 291, 3932–3946 [DOI] [PMC free article] [PubMed] [Google Scholar]
- 87. Xia F., Li R., Wang C., Yang S., Tian L., Dong H., Pei C., He S., Jiang P., Cheng H., Fang S., Li H., and Xu H. (2013) IRGM1 regulates oxidized LDL uptake by macrophage via actin-dependent receptor internalization during atherosclerosis. Sci. Rep. 3, 1867. [DOI] [PMC free article] [PubMed] [Google Scholar]
- 88. Lin Y. C., Chang P. F., Lin H. F., Liu K., Chang M. H., and Ni Y. H. (2016) Variants in the autophagy-related gene IRGM confer susceptibility to non-alcoholic fatty liver disease by modulating lipophagy. J. Hepatol. 65, 1209–1216 [DOI] [PubMed] [Google Scholar]
- 89. Wu J. Y., Kao H. J., Li S. C., Stevens R., Hillman S., Millington D., and Chen Y. T. (2004) ENU mutagenesis identifies mice with mitochondrial branched-chain aminotransferase deficiency resembling human maple syrup urine disease. J. Clin. Invest. 113, 434–440 [DOI] [PMC free article] [PubMed] [Google Scholar]
- 90. Jia W., Pua H. H., Li Q. J., and He Y. W. (2011) Autophagy regulates endoplasmic reticulum homeostasis and calcium mobilization in T lymphocytes. J. Immunol. 186, 1564–1574 [DOI] [PMC free article] [PubMed] [Google Scholar]
- 91. Xu J. (2005) Preparation, culture, and immortalization of mouse embryonic fibroblasts. Curr. Protoc. Mol. Biol. 10.1002/0471142727.mb2801s70 [DOI] [PubMed] [Google Scholar]
- 92. Todaro G. J., and Green H. (1963) Quantitative studies of the growth of mouse embryo cells in culture and their development into established lines. J. Cell Biol. 17, 299–313 [DOI] [PMC free article] [PubMed] [Google Scholar]
- 93. Dougan G., Chatfield S., Pickard D., Bester J., O'Callaghan D., and Maskell D. (1988) Construction and characterization of vaccine strains of Salmonella harboring mutations in two different aro genes. J. Infect. Dis. 158, 1329–1335 [DOI] [PubMed] [Google Scholar]
- 94. An J., Muoio D. M., Shiota M., Fujimoto Y., Cline G. W., Shulman G. I., Koves T. R., Stevens R., Millington D., and Newgard C. B. (2004) Hepatic expression of malonyl-CoA decarboxylase reverses muscle, liver and whole-animal insulin resistance. Nat. Med. 10, 268–274 [DOI] [PubMed] [Google Scholar]
Associated Data
This section collects any data citations, data availability statements, or supplementary materials included in this article.