

Abstract
Reversible tyrosine phosphorylation is a widespread post-translational modification mechanism underlying cell physiology. Thus, understanding the mechanisms responsible for substrate selection by kinases and phosphatases is central to our ability to model signal transduction at a system level. Classical protein-tyrosine phosphatases can exhibit substrate specificity in vivo by combining intrinsic enzymatic specificity with the network of protein-protein interactions, which positions the enzymes in close proximity to their substrates. Here we use a high throughput approach, based on high density phosphopeptide chips, to determine the in vitro substrate preference of 16 members of the protein-tyrosine phosphatase family. This approach helped identify one residue in the substrate binding pocket of the phosphatase domain that confers specificity for phosphopeptides in a specific sequence context. We also present a Bayesian model that combines intrinsic enzymatic specificity and interaction information in the context of the human protein interaction network to infer new phosphatase substrates at the proteome level.
Keywords: peptide array, protein-protein interaction, substrate specificity, systems biology, tyrosine-protein phosphatase (tyrosine phosphatase), Bayesian integration, recognition specificity, trapping mutants
Introduction
Reversible tyrosine phosphorylation is one of the prime post-translational modification mechanisms, modulating a variety of cell processes (1–3). Given this importance in regulating essential activities, cells have evolved mechanisms to control their phosphorylation homeostasis. This is achieved via an intricate network that links phosphorylated proteins to the activity of two enzyme families, protein-tyrosine kinases and protein-tyrosine phosphatases (PTPs),3 which respectively add and remove phosphate groups from tyrosine residues (4). Although it is by now clear that in vivo the members of both enzyme families display remarkable specificity, our understanding of the rules underlying substrate selection is far from satisfactory (5, 6). This limits our ability to draw a functional, three-layered graph linking kinases and phosphatases via their substrates. However, whereas for most kinases we know a sufficient number of substrates that help to identify sequence motifs in peptides that are preferentially phosphorylated, we do not have a comparable number of validated phosphatase substrates (7).
The human genome encodes 108 protein-tyrosine phosphatase domains, of which 37 are tyrosine-specific and are sometimes referred to as “classical tyrosine phosphatases” (8–10). Tyrosine-specific phosphatases are further subdivided into receptor and non-transmembrane subgroups (8, 11, 12). The catalytic domain (PTP domain) involved in substrate recognition and catalysis has a conserved structural fold (5). Key features of the catalytic domain are the PTP signature motif (I/V)HCXAGXXXR(S/T), the mobile WPD loop, characterized by a conserved aspartate residue, and the phosphotyrosine recognition loop containing the KNRY motif (13).
Despite extensive biochemical and structural studies, the molecular features by which protein-tyrosine phosphatases recognize their phospho-substrates and display their substrate preferences remain poorly defined. PTPs exhibit evident substrate specificity in vivo, which is conferred by both the catalytic domains and other accessory and regulatory domains (5, 11). Subcellular localizations, post-translational modification events, or specific tissue distributions also contribute to specificity.
The identification of physiological phosphatase substrates is hampered by the transient nature of the interaction between the catalytic domains and their substrates. The development of catalytically inactive substrate “trapping” mutants, and the demonstration that these maintain the ability to bind the physiological substrates without carrying the enzymatic reaction to the end offered a new tool to study phosphatase specificity (14). Trapping mutants maintain high affinity for phosphotyrosines in their natural substrates and remain stably associated with their substrates because they are unable to dissociate (15–17). Substrate trapping mutants have been used for isolation and identification of potential PTP targets by co-immunoprecipitation and pulldown assays (18, 19), screening of combinatorial peptide libraries (20), phage display (21), or SPOT synthesis (22).
Peptide-based microarrays have recently been introduced as a new platform to interrogate the enzymatic activity of different classes of phosphatases against a variety of immobilized phosphopeptide substrates (23–26). More recently Zhao et al. (27) used high density phosphotyrosine peptide microarrays to characterize the preferred substrates of 10 dual specificity phosphatases, a class of enzymes that can dephosphorylate both Tyr(P) and Ser(P)/Thr peptides.
Herein, we aim at a complete characterization of classical PTP recognition specificity. We defined the substrate specificity of 16 PTP domains of classical phosphatases, including 5 receptors and 11 non-transmembrane PTPs. By this approach we confirmed, on a larger scale, that the catalytic domains of tyrosine phosphatases display, to various degrees, intrinsic preference for specific phosphotyrosine sequence contexts. We also show that this preference can be rationally manipulated by changing the chemical properties of the PTP substrate-binding pocket. Substrate preference, as determined by the in vitro phosphopeptide approach, is encoded using position-specific scoring matrices (PSSM) that efficiently predict enzymatic specificity in vitro.
In vivo, enzymatic specificity may be achieved by increasing the ratio of the catalytic activity of the enzyme toward physiological substrates over the “background” catalytic activity for similar non-physiological substrates. Alternatively, physiological substrates may be favored by increasing their relative local concentration. Kcat and local relative concentrations are difficult to measure, especially on a large scale. Here we propose to use peptide preference, as determined by measuring the binding of trapping mutants to phosphopeptide arrays and encoded in a PSSM as a proxy of catalytic preference, and enzyme-substrate distance in the protein interaction network, which takes into account the different strategies used by phosphatases to physically approach their substrates, as a proxy of substrate concentration. We called this latter feature weighted interaction distance (WID). PSSM and WID matrices were combined in a Bayesian framework to obtain a predictive model that infers physiological substrates.
Results
PTP Specificity
To obtain a proteome-wide view of classical tyrosine phosphatase specificity, we made use of phosphopeptide chip arrays covering a large number of the tyrosine-phosphorylated sequences identified in the human proteome (28). The chip contains three identical replicas of ∼6,000 human phosphorylated peptides (supplemental Fig. S1). Microarrays were incubated with the substrate-trapping mutants of PTP domains, fused to the GST tag. The interactions between phosphopeptides and phosphatases were revealed by an anti-GST antibody conjugated to a fluorophore). To identify phosphopeptides that would bind non-specifically either GST or anti-GST antibodies, we probed one of the chips with GST alone. Our collection of trapping mutant expression vectors included 33 catalytic domains. For 22 of them we were able to express soluble protein in quantities suitable for the binding assay. With six, however, either the yielded results were affected by high background or no signal could be detected over background. Eventually, we could satisfactorily profile the specificity of a total of 16 phosphatases (Fig. 1A and supplemental Spreadsheet S1). We computed for each peptide the median of the three replica spot intensities. Peptides with an intensity higher than the chip median intensity plus one standard deviation were considered “binders” (positive data set), whereas the peptides with a fluorescence signal lower than the median signal formed the negative data set. The peptide sequences were aligned on their phosphotyrosine residues and used as input for the Two Sample Logo software (29) to generate a logo sequence representing the amino acid enrichment at each position of the aligned sequences (Fig. 1B). The phosphorylated tyrosine, shared by both interacting and non-interacting peptides, is shown in the central position. The upper part of the logo shows the over-represented amino acids in the positive data set, whereas the lower section displays the under-represented residues in the positive data set, as compared with the negative data set.
FIGURE 1.

Sequence logo of PTP substrates. A, PTP sequence similarity tree. B, specificity tree of the 16 tyrosine phosphatases profiled with peptide microarrays. We used the PSSM as input for the EPCLUST software, to group tyrosine phosphatases on their substrate recognition profile. The 16 PTPs are grouped into 7 specificity groups, according to the similarity in the distribution of the residues in the positions flanking the central phosphorylated tyrosine. Each specificity group was highlighted with a different color. C, the specificity groups were mapped onto the sequence similarity tree by outlining with different colors phosphatases that belong to the same group. D, sequence logos representing the phosphopeptide sequences that are preferentially bound by phosphatase trapping mutants. The logos were generated by the Two Sample Logo software, which calculates and represents the differences in amino acid sequences in a positive and a negative peptide data set. The upper and lower parts of the logo represent the amino acids that are respectively over- and under-represented in the interacting peptides. The logos of phosphatases belonging to different specificity classes are framed in different colors.
As an unbiased approach to phosphatase classification according to specificity, we encoded the sequence information in the positive and negative data sets in 16 PSSMs (see “Experimental Procedures”). Each PSSM is a 10 × 20 matrix representing the amino acid preference in the five positions before and after the phosphorylated tyrosine in the aligned peptides that either did or did not bind the phosphatase trapping mutants. The PSSM of each PTP was arrayed in a single column of 200 rows, and the file containing the 16 PSSMs was used as input for a Pearson centered clustering analysis. The output of this approach can be pictured as a tree that groups phosphatases according to their substrate recognition profiles (Fig. 1, B and C). By cutting the tree at an arbitrary distance from the root, we define seven specificity groups.
The first specificity group includes the MEG-2, rPTP-α, and LAR phosphatases. They are characterized by a preference for aliphatic amino acids in the positions flanking the phosphotyrosine. Leucine and tyrosine are preferred at position 6, whereas leucine, glycine, and arginine are enriched at position +1 and proline at position +3. By contrast, non-interacting peptides are generally rich in negatively charged residues.
The logo of SHP-1 defines a second specificity group characterized by substrates frequently displaying a positively charged arginine at position +1 and serine at position +3, whereas aspartic acids are over-represented at positions −3, −2 and +2.
A third class displays a preference for peptide substrates containing negatively charged side chains at positions −2 and +1, whereas leucine and tyrosine are over-represented at position −1. Conversely, methionine and valine are under-represented at positions +1 and +3. The four domains assigned to this class are the non-receptor phosphatases LYP, MEG-1, PEST, and PTP-H1.
The substrate preference of SHP-2 defines the fourth specificity class. SHP-2 is peculiar among the phosphatase domains that we have characterized in that it displays preferential binding for peptides with negatively charged residues on either side of the phosphotyrosine. In fact, glutamic and aspartic acids are over-represented in positions −5 to −2 and at positions +1, +2, and +4. Arginine is instead frequent at positions −3, −1, and +2 of the non-interacting peptides.
The fifth cluster contains the related phosphatases PTP1B and TC-PTP, whose trapping mutants tend to bind peptides that have methionine and glutamine at position +1. Acidic residues are under-represented at the same position. Glutamic acid is frequent at positions −4 and −2, and leucine, phenylalanine, tyrosine, and threonine are enriched at position −1 of the logo, whereas basic amino acids are under-represented in the positions at the amino side of the phosphotyrosine.
The sixth group includes PTP-BAS, PTP-β, SAP-1, and DEP-1, which preferentially bind phosphopeptides containing glutamic acid at position −2, leucine and tyrosine at position −1, and glycine at position +1. Positively charged amino acids are under-represented at positions −3 and −1, whereas methionine is under-represented at positions +1 and +3.
Finally, the seventh specificity group is characterized by the non-transmembrane, catalytically inert phosphatase HD-PTP. This PTP binds peptides having negatively charged amino acids at positions +1, +2, and +3. In addition, HD-PTP preferentially recognizes peptides that are enriched in glutamic acid and asparagine at position +2.
The Residue at Position 59 Is a Specificity Determinant
To identify the molecular determinants of peptide recognition specificity, we next investigated whether specific side chains forming the catalytic pocket could be used as a diagnostic for class membership. To identify such residues, the classification of PTPs of Fig. 1B was used as input in the multi-Harmony server (30). This server combines the Sequence Harmony (31) and multi-Relief (32) methods for the detection of the most probable subgroup specificity determinant residues. Both methods do not consider groups formed by a single phosphatase (SHP-1, SHP-2, and HD-PTP). To include SHP-1 and SHP-2 in the analysis, these phosphatases were merged into a larger group including specificity group III with LyPTP, PEST, MEG-1, and PTP-H1. HD-PTP was not considered in the analysis. As anticipated from the visual inspection of the sequence alignment (see supplemental materials for residue numbering), no single residue or small group of residues could explain in a simple way the classification in Fig. 2.
FIGURE 2.

The residue at position 59 is a determinant of PTP substrate specificity. A, structure of the substrate binding pocket of PTP-1B in complex with two substrate peptides (39, 46). The aspartic acid at position 59 of PTP1B, which has been changed to asparagine in the experiment, is shown as a transparent section in the surface representation. B, comparison of the substrate preference of class V and class VI phosphatase domains. Class V members have an aspartate at position 59, whereas those in class VI contain an asparagine. The sequence logos were generated as in Fig. 1, by the Two Sample Logo software. C, logos describing the substrate specificity of the PTP-1B D/N and TC-PTP D/N mutants. D, graph representing the catalytic activity of GST, GST-PTP-1B, GST-DEP1, and GST-PTB-1B_D/N. Purified enzyme (1 μg/ml) was incubated with one of 10 phosphopeptides (100 μm) for 30 min. The release of phosphate was monitored every 5 min by incubating with Malachite Green. Phosphatase activity was obtained by determining the slope of the curve representing the development of the green color after subtracting the optical density (620 nm) of the sample containing GST. The error bars represent the standard error in the determination of the slope. Phosphatase activity is expressed as the amount of phosphate (nm) released in these experimental conditions per minute, as determined by comparison with a standard curve. The asterisks represent p values <0.01 of the null hypothesis that the activities of the phosphatase PTP1B and its D/N mutant do not differ when tested on the same peptide. See “Experimental Procedures” for statistical details.
The output was filtered to retain positions with a weight score >0.7 for the multi-Relief analysis, and a z score ≤ −2.5 for Sequence Harmony. The hits mapping close to the substrate binding pocket are listed in supplemental Table S1). We focused on position 59 of the multiple-PTP alignment (supplemental materials and Fig. 2A), which immediately follows the conserved KNRY motif forming the phosphotyrosine recognition loop in the catalytic pocket. Classical phosphatases have either asparagine or aspartic acid at that position. PTP-1B and its close relative TC-PTP, both classified in specificity group V, have an aspartic acid, whereas the members of class VI all have an asparagine. In the two experimental structures of the PTP-1B domain complexed with a substrate peptide, Asp-59 forms a hydrogen bond with the phosphotyrosine amino group (Fig. 2A). The sequence logos of these two classes differ in several respects, most notably at position +1, with Met and Gln preferred by class V domains, whereas class VI domains bind preferentially peptides containing a Gly at that position and tolerate negative charges but cannot accommodate Met, similarly to all domains having a Gln at position 59. In addition, class V phosphatase are more tolerant to a variety of residues at position +3, whereas class VI members disfavor long hydrophobic residues such as Met or Val while often preferring Pro (Fig. 2B). The role of residue 59 as specificity determinant was investigated by replacing the aspartic acid in PTP-1B and TC-PTP trapping mutants with an asparagine. Phosphopeptide chips were probed with PTP-1B, TC-PTP, and their D59N trapping mutants, and the corresponding two-sample logos were generated. Fig. 2 illustrates the logo representing the PTP-1B and TC-PTP substrate recognition profile (Fig. 2B) and compares it with that of the D/N mutants (Fig. 2C). Interestingly by changing the Asp to a Gln at position 59, the class V mutants acquire the ability to bind peptides that have two of the features of the class VI logo, namely the preference for Gly and Pro at position +1 and +3, respectively, and an aversion for Met at these same positions. To validate these conclusions using a different phosphatase assay, we engineered by site-directed mutagenesis a PTB-1B phosphatase domain carrying the D59N substitution in a wild type sequence background. The phosphatase activity of the purified protein was measured in solution by incubating the phosphatases with 10 phosphopeptides and by monitoring the release of free phosphate with Malachite Green. The phosphopeptide sequences were chosen to test the change in specificity at positions +1 and +3. Indeed by this approach, which directly tests catalytic activity in solution, we were able to confirm that the PTP-1B D59N mutant has a significantly increased substrate preference for peptides with a Gly at position +1 and/or a Pro at position +3 (Fig. 2D and supplemental Fig. S2). The only exception is peptide DSTAETyGKIVHY that, despite having a Gly at position +1, is a better substrate for wild type PTP-1B, possibly because the branched hydrophobic side chain of Ile at +3 does not make it a good substrate for the mutant having an Asn at position 59. In conclusion, these results show that the identity of the side chain at position 59 affects the binding specificity of phosphatase trapping mutants and the substrate preference of wild type phosphatases in a tangible way that is, at least in part, predictable.
PSSM-based Predictive Model to Infer PTP Peptide Targets
In a sequence logo, the sum of the sequence conservations at each position, the total entropy, measures the information content of the Logo and describes its selectivity (33). When compared with the family of SH2 domains tested in the same experimental set-up (34), the average information content of the Logos representing phosphatase specificity is significantly lower (p = 0.004; Fig. 3A). This suggests that a simple sequence-based phosphatase predictor is likely to grossly overpredict and should therefore rather be combined with predictors based on independent features. With the aim to develop a general strategy to infer physiological PTP substrates, we first trained a predictive algorithm to assess the “propensity” of a peptide to be a substrate of classical phosphatases in the in vitro trapping mutant test. We used the PSSM information, whose scores take into account the residue enrichment in both positive and negative peptides data sets generated from interaction data. The potential of the PSSM-based predictive algorithm was first assessed by estimating its ability to reproduce the results of our chip experiments, by measuring the area under the receiver operating characteristic curve (AUC) (35). The bar graph in Fig. 3B reports the AUC for the 16 phosphatases whose specificity was determined by the microarray probed with the PTP trapping domain. The AUC, ranging from 0.62 (for SHP-2) to 0.93 (for DEP-1), estimates the performance of the PSSM predictors in inferring peptides that bind the phosphatase trapping mutants in the in vitro assay used to generate the PSSM.
FIGURE 3.
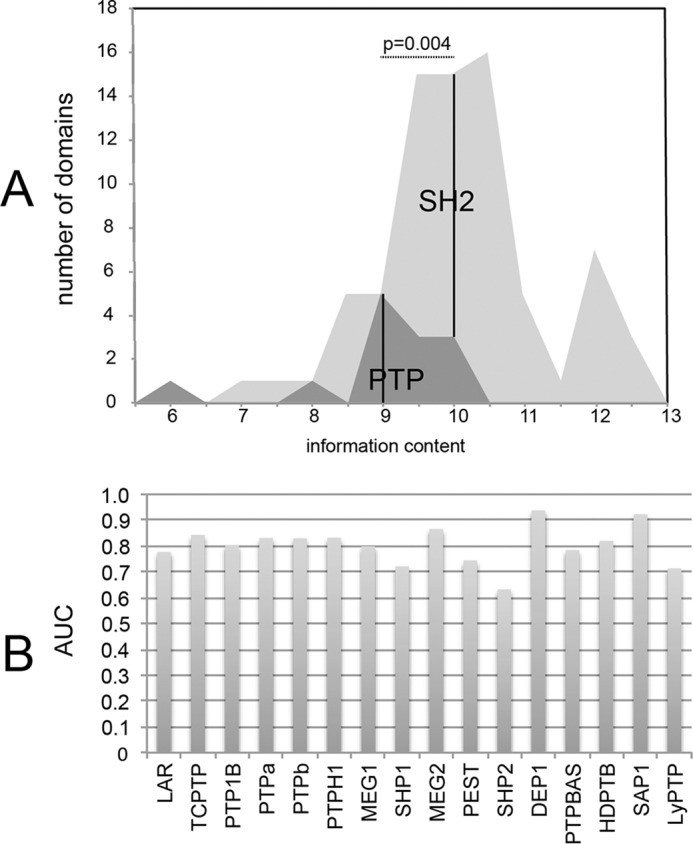
A, distribution of logo information content in SH2 and PTP domains. B, PSSM-based predictions of microarray substrates. We assessed the potential of our PSSM-based predictive algorithm to reproduce chip results by measuring the AUC (receiver operating characteristic). The ROC curves represent the true positive rate (sensitivity) versus the false positive rate (specificity) to classify the interacting and the non-interacting peptides of each experiment. For each phosphatase we assembled a positive and a negative data set. All the phosphopeptides with a signal higher than the median plus one standard deviation were included in the positive data set, whereas the negative data sets included peptides with a signal lower than the median. The AUC values validate the ability of the PSSM to differentiate between the two data sets.
We next assessed the performance of the PSSM-based algorithm to infer in vivo physiological substrates. Each phosphatase was associated with a list of substrates dubbed “positive gold standard” and to a list of non-substrates dubbed “negative gold standard.” Given the intrinsic difficulty to define with certainty the non-substrates of a tyrosine phosphatase, the negative gold standard was assembled by random samplings of the human phosphotyrosine proteome, under the hypothesis that the majority of protein peptides are not PTPs substrates. PTP-1B, TC-PTP, DEP-1, SHP-1, and SHP-2 phosphatases were considered for the PSSM-based prediction, because only for these PTPs was it possible to retrieve a sufficient number of validated substrates to assemble a sufficiently large positive gold standard (12). The performance in ranking the positive and negative partners is reported in Fig. 4 as ROC curves (PSSM curve, in blue). The AUC values, ranging from 0.69 to 0.78, attest to the ability of the PSSM-based algorithm to differentiate the positive from the negative in vivo gold standards, albeit less efficiently than observed when tested on the in vitro chip data. These results confirm that PTP substrate specificity is not sufficiently selective to allow the inference of phosphatases substrates in physiological conditions, but additional features should be considered.
FIGURE 4.

ROC curves representing the performance of the predictors based on the PSSM, WID, and Bayesian integration of PSSM + WID. We used the PSSM-based algorithm to assess the ability of the substrate specificity information, extracted from microarray experiments, to classify the literature-reported substrates (blue curve). The red curve is the WID curve representing the performance of the substrates prediction based on the weight distances between the phosphatases and their potential substrates in the human interactome. WID and PSSM algorithms are combined (green curve) to build a Bayesian model aimed at the prediction of PTP physiological substrates.
With the aim to improve the performance of the PSSM-based prediction, we considered the importance of the protein interaction network in physically guiding the PTPs to their functional substrates via a web of protein contacts in the cell. The interaction information was extracted from four major protein-protein interaction databases (MINT, DIP, IntAct, and BIOGRID as integrated in the mentha database (37)) to compile a “weighted protein network,” where each interaction is associated to a reliability score (from 0 to 1) that takes into account all supporting experimental evidence (37, 38). We considered protein pairs connected with highly reliable edges as “closer” than proteins connected by edges with little experimental support, and the weight scores (w) were converted into distances (d = 1 − w).
We next calculated the WID between a phosphatase and any protein of the weighted network. Finally we evaluated whether this feature could classify human proteins for PTP substrates and non-substrates. The AUCs (Fig. 4, red curves) range from 0.71 (DEP1) to 0.94 (PTP1B). Given the good classification achieved by using the WID parameter, we next developed a Naïve Bayes approach that integrates the WID conditional probability with the peptide preference encoded in the PSSM (23). This combined model (Fig. 4, green curves) produced an even better classification, characterized by AUC values ranging from 0.81 (DEP-1) to 0.95 (SHP-2). The TC-PTP, DEP-1, SHP-1, and SHP-2 combined models outperformed the models based on one feature at a time. The only exception was PTP-1B, which showed a marginally better substrate classification with the WID-based algorithm than with the combined Bayesian model.
Discussion
The members of the protein-tyrosine phosphatase family play an important, albeit incompletely understood role in the propagation of cellular signals. A complete characterization of the physiological phosphatase substrates is essential to understand the molecular mechanisms modulated by this enzyme class in regulating many biological processes. Over the past decades several studies have contributed to shed light on the molecular mechanisms underlying substrate selection. The detection of a stable interaction between phosphorylated tyrosine-containing proteins and protein-tyrosine phosphatases trapping mutants is an accepted criterion for the identification of phosphatase substrates (5) and has been used over the past decades to identify potential PTP targets in combination with other methods (22, 40).
On the other hand, miniaturized array-based techniques are more popular for studying protein-protein interactions and in large scale analyses across the whole proteome (41). In addition, the screening of peptide microarrays is a fast and efficient strategy to determine enzyme specificity, such as, for instance, in the characterization of kinase substrate specificity (42, 43) or domain binding (34, 44). In this work we combined the versatility of the substrate trapping mutants approach with the high throughput potential of phosphopeptide microarrays to define the intrinsic substrate specificity of 16 PTP domains belonging to the classical tyrosine phosphatase family.
The results of several studies aimed at the characterization of PTP substrate specificity have already been reported (22–26, 45–52). In addition Knapp and co-workers (11) profiled a large number of tyrosine phosphatase domains by measuring their ability to dephosphorylate tyrosines in a panel of phosphotyrosine peptides. Finally, Zhao and co-workers (27) monitored the enzymatic activity of 10 dual specificity phosphatases on ∼6,000 phosphotyrosine peptides arrayed on glass slides. Our work represents the largest screening of human PTP domains to date, using a large library of phosphorylated peptides covering most of the human phosphoproteome. Furthermore, we describe for the first time the peptide binding specificity of HD-PTP, PTP-BAS, MEG-1, MEG-2, LAR, PTP-H1, and PEST.
However, the enzymatic selectivity that can be measured in vitro cannot account completely for the substrate specificity observed in physiological conditions, where additional mechanisms play a role. Contextual information, such as the protein subcellular compartmentalization, the co-localization via anchoring proteins and scaffolds, or the temporal and cell specific co-expression may play important, even dominant roles in substrate targeting in vivo (53). These considerations are even more important when applied to enzymes such as phosphatases, whose substrate sequence selectivity is less pronounced than the one observed for kinases.
Our microarray-based approach boosted the current amount of peptides that are known to be in vitro targets of classical phosphatases and exceeded by ∼24-fold the number of literature-reported substrates in a rapid and economic fashion. To extend our knowledge about phosphorylation-mediated signaling by inferring physiological phosphatase substrates, we combined the information on peptide specificities extracted from the microarray data with information about enzyme and substrate network context. We extended and improved the Naïve Bayes approach that we first used to infer new PTP-1B substrates involved in the RAS pathway (23).
Protein-Tyrosine Phosphatase Specificity
Although PTPs are considered promiscuous enzymes with little specificity for residues flanking the phosphorylated tyrosine, several approaches have identified sequence motifs that characterize aligned substrate sequences. The number of peptides potentially recognized by PTP domains is very high, consistent with the plasticity of the conserved catalytic domains of tyrosine phosphatases, as first identified in the active site of PTP-1B (46). However, our microarray-based approach highlighted that most PTPs show some preference for specific amino acids flanking the phosphorylated tyrosine. The logos characterizing the 16 classical phosphatases differ for the residues on the carboxyl-terminal side of the phosphotyrosine. Positive and negative data sets containing the peptides that bound or did not bind the PTP trapping domains were used to build a PSSM, which encodes the positional residue frequencies in both positive and negative data sets. PSSM information was used to cluster phosphatases into seven different specificity groups, according to their residue preferences.
Our experimental system can reveal both strong and weak interactions, and its sensitivity is such that it may be used to reveal any subtle shift in peptide recognition caused by modifications of the chemical environment of the substrate recognition pocket. By searching for residues whose identities are conserved within a specificity group but poorly conserved in the whole PTP family, we identified the residue at position 59, which is always an Asp in class V phosphatases, whereas it is an Asn in class VI members. Microarray binding assays revealed that this D/N mutation at position 59 in PTP-1B and TC-PTP catalytic domains (class V) is sufficient to induce a shift in specificity such that the logos of class V 59 D/N mutants become similar to the logo of class VI domains. Importantly we show that the change in specificity is observed not only in the trapping mutants but also in enzymatic assays in solution. Attempts to rationalize, on a structural basis, the observed specificity changes by modeling domain mutants and substrate peptide complexes have failed to reveal simple solid sequence-based rules. Interestingly the phosphatases of the KIM domain family have a Thr at position 59 that was suggested to have an inhibitory role on phosphotyrosine peptide binding (54). Consistently we were not able to identify any peptide motif in our array experiments for these phosphatases.
Bayesian Integration of Orthogonal Features
Despite advances in high throughput assays, our understanding of the phosphorylation signaling network is still fragmentary, because of the difficulty of translating new insights generated in vitro to the cellular context. The in vitro PTP substrate specificity, determined by microarray experiments and encoded in the PSSM, only captures the preference of the enzymatic pocket for specific sequence motifs, and it may turn out to be insufficient for the discovery of new substrates of potential physiological relevance (23). As an example, the small family of the KIM domain-containing proteins, including HePTP, STEP, and PCPTP1 requires the interaction of a docking domain in the substrate protein and the KIM domain in the phosphatase for substrate selection (54). These specificity determinants cannot be discovered by our array approach that uses short linear peptides as substrates. As a consequence, training of our PSSM-based algorithm for the prediction of literature-reported substrates was not sufficiently discriminating, exposing the limits of the chip binding assays that do not also consider contextual information such as docking domains, adaptors, protein localization, and expression. Therefore, we decided to combine, in a Bayesian framework, the microarray data with protein interaction network information. This approach was first developed to infer new PTP-1B substrates involved in the RAS pathway (23). We tested and improved this strategy to build an efficient predictive algorithm for most classical phosphatases. PTP network information was extracted from different protein interaction databases and integrated in a single weighted human interactome (10). The protein distance scores were encoded in a WID matrix, and we showed by ROC analysis that the WID feature can be used to efficiently discriminate literature-reported substrates from non-substrates. Although we took the precaution to remove from the interactome data set the evidence based on enzymatic assays or pulldowns mediated by trapping mutants to avoid overestimating the WID feature, it is still possible that the performance of WID in substrate prediction could be boosted by a “social” bias affecting well characterized proteins such as those considered here. Once a substrate of functional significance is reported, researchers are motivated to characterize the local interaction network to link the enzyme to its substrate. Given the incomplete coverage of the human protein interaction network, it is unlikely that the WID of less characterized proteins would show a comparable performance at the present interactome coverage. This analysis is confirmed by the observation that WID of the most studied tyrosine phosphatase PTP1B has the highest predictive performance.
Experimental Procedures
DNA Constructs
The pGEX-4TK expression plasmids were constructed as described previously (55). All PTP domains are substrate trapping mutants that carry the D/A mutation in the WPD loop, with the exception of HD-PTP, which carries the E/A mutation. The catalytic domain of five different PTPs (SHP1, SHP2, HD-PTP, PTP-1B, and TC-PTP) was further mutated by using a commercially available site-directed mutagenesis kit (Stratagene).
Microarray Design and Binding Assays
Microarrays were co-developed with Jerini Peptide Technology within a project supported by the Interaction Proteome European Union integrated project. The peptides were synthesized and arrayed according to their proprietary technology, as previously described (34). Microarrays were incubated in dishes containing 5% bovine serum albumin in PBS, pH 7.4 (blocking buffer) for 3 h at 4 °C. After blocking, phosphopeptide arrays were incubated with 1 μg/ml of GST-PTP in blocking buffer, pH 7.4, for 1 h at room temperature. Microarrays were washed in PBS (pH 7.4) three times for 10 min and then incubated with anti-GST Cy-5-conjugated antibody (Amersham Biosciences), diluted 1:1000 in blocking buffer, for 1 h at room temperature avoiding light exposure. The chips were extensively washed four times in PBS for 10 min and then dried. The fluorescence intensity was revealed with the ScanArray Gx Plus (PerkinElmer Life Sciences). The net signal intensity of a spot is the logarithm of the ratio of foreground to background intensity (log(FG/BG)). Data filtering was as described in Ref. 34.
Two Sample Logo Visualization
Peptide recognition specificity was represented by using the Two Sample Logo web tool (29). This software requires as input a positive and a negative set of aligned amino acids sequences to calculate and visualize the differences between them. The positive data set includes all peptides with a binding intensity higher than the median signal plus one standard deviation, whereas the peptides with a fluorescence signal lower than the chip median signal constitute the negative data set. Binomial test and p values of <0.05 were applied. The same phosphopeptide arrays used to profile the PTPs specificity were also employed in a recent screening carried out in our laboratory to characterize the interaction network mediated by a representative set of human SH2 domains (34). We exploited the results of this larger screening to reduce the risk of including, in the negative data set, peptides that did not give a signal because of technical reasons (e.g. poor synthesis or low phosphorylation). To this aim we considered only the peptides that have been bound by at least one of the SH2 and PTP domains tested or by the anti-phosphotyrosine antibody (α-4G10; Upstate) (28). The resulting filtered data set has been deposited in the KinomeXplorer resource (56).
PTP Clustering and PSSM
To cluster each PTP according to peptide specificity, we assembled three amino acid frequency matrices based on the positive, negative and total data set. The positive matrix (PM) was composed of 20 rows i, comprising the 20 naturally occurring amino acids, and 10 columns j, comprising 5 positions before and 5 positions after the phosphorylated tyrosine. In this matrix the value at row i and column j is the frequency of the amino acid i at the jth position in the alignment of the positive data set. An analogous negative matrix (NM) was obtained from the alignment of negative data set; finally, the total matrix (TM) (47) was compiled by determining the amino acid frequency at each position in the complete list of all peptides arrayed on the chip. The score assigned in the PSSM was calculated by adding up over all the positions of the positive, negative, and total matrices according to,
| (Eq. 1) |
where PMij, NMij, and TMij are the values for amino acids i in positions j, respectively, in the positive, negative, and total matrix. The PSSM of each PTP was arrayed in a single column of 200 rows, and the file containing the 16 PSSMs was used as input for a Pearson centered clustering analysis (57).
Phosphatase Substrate Curation
The PubMed database was queried with the PTP strings and with the names of the 16 PTPs of interest retrieved from the PIR (58) and the ProThesaurus (36) resources. The results were combined and downloaded in XML format. We made use of a Python script to automatically parse the title and abstract fields of the XML formatted PubMed entries to select the papers containing keywords related to the PTP domains, such as “dephosphorylation reaction” or “trapping mutant.” We collected thousands of PubMed entries that were reviewed by expert curators. 270 of them were considered relevant for the project. We defined as PTP substrate every protein or phosphopeptide of the human proteome that was linked to a phosphatase by one of the following relationships: de-phosphorylation reaction, indirect de-phosphorylation, phosphatase trapping, and indirect phosphatase trapping. Both in vitro and in vivo experimental systems were considered. 13-residue-long substrate peptides containing the target phosphotyrosine at position 7 were annotated for the enzymatic specificity and network context analysis.
Malachite Green-based Phosphatase Activity Assay
Lyophilized phosphotyrosine-containing peptides (in 96-well microtiter plates; JPT Peptide Technologies GmbH Berlin Germany) were diluted under gentle agitation in assay buffer (10 mm Tris-HCl, pH 8.0, 100 mm NaCl, 1 mm EDTA) for 1 h at room temperature. Reaction solution was prepared containing phosphatase (PTP1B, PTP1Bdn, and DEP1), as well as a GST control. 50 μl of phosphatase solution were transferred into each well using a matrix multi-pipette resulting in final concentrations of 1 μg/ml enzyme and 100 μm substrate peptide in a final volume of 100 μl. Additionally, buffer control and phosphatase negative control (buffer only and phosphatase without substrate, respectively) were performed. Microtiter plates were sealed and incubated for 2 h at 37 °C in a humidity chamber. Subsequently, the microtiter plate was adjusted to room temperature for 15 min. 50 μl of BIOMOL Green solution (Enzo Life sciences) were added to each well.
UV-visible absorbance was read using a SpectroStar Nano (BMG Labtech) microtiter plate reader at 620 nm. For detection of color development different time points were recorded starting immediately after putting plate into the reader, as well as after 5, 10, 15, 20, 25, and 30 min. Phosphatase activity is determined by applying linear regression analysis to estimate the slopes of the kinetic curves by a least square method. For the analysis of the significance of the differences observed in the slopes of the linear regression of the kinetic data, we used the F test, which is often utilized to compare statistical models that have been fitted to a data set. To this end we have used the procedure implemented in the jmp statistical software package. The results are presented as p values of the null hypothesis that the slopes are the same in the kinetic experiments that are compared.
Author Contributions
G. C. and L. C. conceived of the study; G. C., M. S., and J. H. developed the methodology; R. H. v. H. gathered resources; A. P., S. P., E. S., B. W. B., A. M., and M. T. conducted the investigation; G. C. wrote the original draft; J. H., R. H. v. H., B. W. B., and M. T. reviewed and edited the manuscript; G. C., L. C., and M. S. supervised the investigation; and G. C. acquired funding.
Supplementary Material
This work was supported by the DEPTH project of the European Research Council under Grant Agreement 322749, by Italian Association for Cancer Research Grant IG 2013 N.14135, and by Telethon Grant GGP09243 (to G. C.). The authors declare that they have no conflicts of interest with the contents of this article.

This article contains supplemental data, Table S1, and Figs. S1 and S2.
- PTP
- protein-tyrosine phosphatase
- PSSM
- position-specific scoring matrix
- WID
- weighted interactome distance
- AUC
- area under the curve
- ROC
- receiver operating characteristic.
References
- 1. Pao L. I., Badour K., Siminovitch K. A., and Neel B. G. (2007) Nonreceptor protein-tyrosine phosphatases in immune cell signaling. Annu. Rev. Immunol. 25, 473–523 [DOI] [PubMed] [Google Scholar]
- 2. Tonks N. K. (2005) Redox redux: revisiting PTPs and the control of cell signaling. Cell 121, 667–670 [DOI] [PubMed] [Google Scholar]
- 3. Hunter T. (1998) The Croonian Lecture 1997: the phosphorylation of proteins on tyrosine: its role in cell growth and disease. Philos. Trans. R. Soc. Lond. B Biol. Sci. 353, 583–605 [DOI] [PMC free article] [PubMed] [Google Scholar]
- 4. Hunter T. (1995) Protein kinases and phosphatases: the yin and yang of protein phosphorylation and signaling. Cell 80, 225–236 [DOI] [PubMed] [Google Scholar]
- 5. Tiganis T., and Bennett A. M. (2007) Protein tyrosine phosphatase function: the substrate perspective. Biochem. J. 402, 1–15 [DOI] [PMC free article] [PubMed] [Google Scholar]
- 6. Tonks N. K., and Neel B. G. (2001) Combinatorial control of the specificity of protein tyrosine phosphatases. Curr. Opin. Cell Biol. 13, 182–195 [DOI] [PubMed] [Google Scholar]
- 7. Miller M. L., Jensen L. J., Diella F., Jørgensen C., Tinti M., Li L., Hsiung M., Parker S. A., Bordeaux J., Sicheritz-Ponten T., Olhovsky M., Pasculescu A., Alexander J., Knapp S., Blom N., et al. (2008) Linear motif atlas for phosphorylation-dependent signaling. Sci. Signal. 1, ra2. [DOI] [PMC free article] [PubMed] [Google Scholar]
- 8. Alonso A., Sasin J., Bottini N., Friedberg I., Osterman A., Godzik A., Hunter T., Dixon J., and Mustelin T. (2004) Protein tyrosine phosphatases in the human genome. Cell 117, 699–711 [DOI] [PubMed] [Google Scholar]
- 9. Andersen J. N., Jansen P. G., Echwald S. M., Mortensen O. H., Fukada T., Del Vecchio R., Tonks N. K., and Møller N. P. (2004) A genomic perspective on protein tyrosine phosphatases: gene structure, pseudogenes, and genetic disease linkage. FASEB J. 18, 8–30 [DOI] [PubMed] [Google Scholar]
- 10. Sacco F., Perfetto L., Castagnoli L., and Cesareni G. (2012) The human phosphatase interactome: an intricate family portrait. FEBS Lett. 586, 2732–2739 [DOI] [PMC free article] [PubMed] [Google Scholar]
- 11. Barr A. J., Ugochukwu E., Lee W. H., King O. N., Filippakopoulos P., Alfano I., Savitsky P., Burgess-Brown N. A., Müller S., and Knapp S. (2009) Large-scale structural analysis of the classical human protein tyrosine phosphatome. Cell 136, 352–363 [DOI] [PMC free article] [PubMed] [Google Scholar]
- 12. Liberti S., Sacco F., Calderone A., Perfetto L., Iannuccelli M., Panni S., Santonico E., Palma A., Nardozza A. P., Castagnoli L., and Cesareni G. (2013) HuPho: the human phosphatase portal. FEBS J. 280, 379–387 [DOI] [PubMed] [Google Scholar]
- 13. Barford D., Das A. K., and Egloff M. P. (1998) The structure and mechanism of protein phosphatases: insights into catalysis and regulation. Annu. Rev. Biophys. Biomol. Struct. 27, 133–164 [DOI] [PubMed] [Google Scholar]
- 14. Flint A. J., Tiganis T., Barford D., and Tonks N. K. (1997) Development of “substrate-trapping” mutants to identify physiological substrates of protein tyrosine phosphatases. Proc. Natl. Acad. Sci. U.S.A. 94, 1680–1685 [DOI] [PMC free article] [PubMed] [Google Scholar]
- 15. Garton A. J., Burnham M. R., Bouton A. H., and Tonks N. K. (1997) Association of PTP-PEST with the SH3 domain of p130cas; a novel mechanism of protein tyrosine phosphatase substrate recognition. Oncogene 15, 877–885 [DOI] [PubMed] [Google Scholar]
- 16. Taddei M. L., Chiarugi P., Cirri P., Talini D., Camici G., Manao G., Raugei G., and Ramponi G. (2000) LMW-PTP exerts a differential regulation on PDGF- and insulin-mediated signaling. Biochem. Biophys. Res. Commun. 270, 564–569 [DOI] [PubMed] [Google Scholar]
- 17. Xie L., Zhang Y. L., and Zhang Z. Y. (2002) Design and characterization of an improved protein tyrosine phosphatase substrate-trapping mutant. Biochemistry 41, 4032–4039 [DOI] [PubMed] [Google Scholar]
- 18. Blanchetot C., Chagnon M., Dubé N., Hallé M., and Tremblay M. L. (2005) Substrate-trapping techniques in the identification of cellular PTP targets. Methods 35, 44–53 [DOI] [PubMed] [Google Scholar]
- 19. Côté J. F., Charest A., Wagner J., and Tremblay M. L. (1998) Combination of gene targeting and substrate trapping to identify substrates of protein tyrosine phosphatases using PTP-PEST as a model. Biochemistry 37, 13128–13137 [DOI] [PubMed] [Google Scholar]
- 20. Wavreille A. S., Garaud M., Zhang Y., and Pei D. (2007) Defining SH2 domain and PTP specificity by screening combinatorial peptide libraries. Methods 42, 207–219 [DOI] [PMC free article] [PubMed] [Google Scholar]
- 21. Wälchli S., Espanel X., Harrenga A., Rossi M., Cesareni G., and Hooft van Huijsduijnen R. (2004) Probing protein-tyrosine phosphatase substrate specificity using a phosphotyrosine-containing phage library. J. Biol. Chem. 279, 311–318 [DOI] [PubMed] [Google Scholar]
- 22. Espanel X., Huguenin-Reggiani M., and Hooft van Huijsduijnen R. (2002) The SPOT technique as a tool for studying protein tyrosine phosphatase substrate specificities. Protein Sci. 11, 2326–2334 [DOI] [PMC free article] [PubMed] [Google Scholar]
- 23. Ferrari E., Tinti M., Costa S., Corallino S., Nardozza A. P., Chatraryamontri A., Ceol A., Cesareni G., and Castagnoli L. (2011) Identification of new substrates of the protein-tyrosine phosphatase PTP1B by Bayesian integration of proteome evidence. J. Biol. Chem. 286, 4173–4185 [DOI] [PMC free article] [PubMed] [Google Scholar]
- 24. Köhn M., Gutierrez-Rodriguez M., Jonkheijm P., Wetzel S., Wacker R., Schroeder H., Prinz H., Niemeyer C. M., Breinbauer R., Szedlacsek S. E., and Waldmann H. (2007) A microarray strategy for mapping the substrate specificity of protein tyrosine phosphatase. Angew. Chem. Int. Ed. Engl. 46, 7700–7703 [DOI] [PubMed] [Google Scholar]
- 25. Sacco F., Tinti M., Palma A., Ferrari E., Nardozza A. P., Hooft van Huijsduijnen R., Takahashi T., Castagnoli L., and Cesareni G. (2009) Tumor suppressor density-enhanced phosphatase-1 (DEP-1) inhibits the RAS pathway by direct dephosphorylation of ERK1/2 kinases. J. Biol. Chem. 284, 22048–22058 [DOI] [PMC free article] [PubMed] [Google Scholar]
- 26. Sun H., Tan L. P., Gao L., and Yao S. Q. (2009) High-throughput screening of catalytically inactive mutants of protein tyrosine phosphatases (PTPs) in a phosphopeptide microarray. Chem. Commun. (Camb.) 14, 677–679 [DOI] [PubMed] [Google Scholar]
- 27. Zhao B. M., Keasey S. L., Tropea J. E., Lountos G. T., Dyas B. K., Cherry S., Raran-Kurussi S., Waugh D. S., and Ulrich R. G. (2015) Phosphotyrosine substrate sequence motifs for dual specificity phosphatases. PLoS One 10, e0134984–19 [DOI] [PMC free article] [PubMed] [Google Scholar]
- 28. Tinti M., Nardozza A. P., Ferrari E., Sacco F., Corallino S., Castagnoli L., and Cesareni G. (2012) The 4G10, pY20 and p-TYR-100 antibody specificity: profiling by peptide microarrays. N. Biotechnol. 29, 571–577 [DOI] [PubMed] [Google Scholar]
- 29. Vacic V., Iakoucheva L. M., and Radivojac P. (2006) Two Sample Logo: a graphical representation of the differences between two sets of sequence alignments. Bioinformatics 22, 1536–1537 [DOI] [PubMed] [Google Scholar]
- 30. Brandt B. W., Feenstra K. A., and Heringa J. (2010) Multi-Harmony: detecting functional specificity from sequence alignment. Nucleic Acids Res. 38, W35–W40 [DOI] [PMC free article] [PubMed] [Google Scholar]
- 31. Feenstra K. A., Pirovano W., Krab K., and Heringa J. (2007) Sequence harmony: detecting functional specificity from alignments. Nucleic Acids Res. 35, W495–W498 [DOI] [PMC free article] [PubMed] [Google Scholar]
- 32. Ye K., Feenstra K. A., Heringa J., Ijzerman A. P., and Marchiori E. (2008) Multi-RELIEF: a method to recognize specificity determining residues from multiple sequence alignments using a Machine-Learning approach for feature weighting. Bioinformatics 24, 18–25 [DOI] [PubMed] [Google Scholar]
- 33. Crooks G. E., Hon G., Chandonia J.-M., and Brenner S. E. (2004) WebLogo: a sequence logo generator. Genome Res. 14, 1188–1190 [DOI] [PMC free article] [PubMed] [Google Scholar]
- 34. Tinti M., Kiemer L., Costa S., Miller M. L., Sacco F., Olsen J. V., Carducci M., Paoluzi S., Langone F., Workman C. T., Blom N., Machida K., Thompson C. M., Schutkowski M., Brunak S., et al. (2013) The SH2 Domain Interaction Landscape. Cell Reports 3, 1293–1305 [DOI] [PMC free article] [PubMed] [Google Scholar]
- 35. Sonego P., Kocsor A., and Pongor S. (2008) ROC analysis: applications to the classification of biological sequences and 3D structures. Brief Bioinform. 9, 198–209 [DOI] [PubMed] [Google Scholar]
- 36. Fundel K., and Zimmer R. (2006) Gene and protein nomenclature in public databases. BMC Bioinformatics 7, 372. [DOI] [PMC free article] [PubMed] [Google Scholar]
- 37. Calderone A., Castagnoli L., and Cesareni G. (2013) mentha: a resource for browsing integrated protein-interaction networks. Nat. Methods 10, 690–691 [DOI] [PubMed] [Google Scholar]
- 38. Ceol A., Chatr Aryamontri A., Licata L., Peluso D., Briganti L., Perfetto L., Castagnoli L., and Cesareni G. (2010) MINT, the molecular interaction database: 2009 update. Nucleic Acids Res. 38, D532–D539 [DOI] [PMC free article] [PubMed] [Google Scholar]
- 39. Jia Z., Barford D., Flint A. J., and Tonks N. K. (1995) Structural basis for phosphotyrosine peptide recognition by protein tyrosine phosphatase 1B. Science 268, 1754–1758 [DOI] [PubMed] [Google Scholar]
- 40. Gross S., Blanchetot C., Schepens J., Albet S., Lammers R., den Hertog J., and Hendriks W. (2002) Multimerization of the protein-tyrosine phosphatase (PTP)-like insulin-dependent diabetes mellitus autoantigens IA-2 and IA-2β with receptor PTPs (RPTPs). Inhibition of RPTPα enzymatic activity. J. Biol. Chem. 277, 48139–48145 [DOI] [PubMed] [Google Scholar]
- 41. Tomizaki K. Y., Usui K., and Mihara H. (2010) Protein-protein interactions and selection: array-based techniques for screening disease-associated biomarkers in predictive/early diagnosis. FEBS J. 277, 1996–2005 [DOI] [PubMed] [Google Scholar]
- 42. Lizcano J. M., Deak M., Morrice N., Kieloch A., Hastie C. J., Dong L., Schutkowski M., Reimer U., and Alessi D. R. (2002) Molecular basis for the substrate specificity of NIMA-related kinase-6 (NEK6). Evidence that NEK6 does not phosphorylate the hydrophobic motif of ribosomal S6 protein kinase and serum- and glucocorticoid-induced protein kinase in vivo. J. Biol. Chem. 277, 27839–27849 [DOI] [PubMed] [Google Scholar]
- 43. Thiele A., Zerweck J., and Schutkowski M. (2009) Peptide arrays for enzyme profiling. Methods Mol. Biol. 570, 19–65 [DOI] [PubMed] [Google Scholar]
- 44. Carducci M., Perfetto L., Briganti L., Paoluzi S., Costa S., Zerweck J., Schutkowski M., Castagnoli L., and Cesareni G. (2012) The protein interaction network mediated by human SH3 domains. Biotechnol. Adv. 30, 4–15 [DOI] [PubMed] [Google Scholar]
- 45. Garaud M., and Pei D. (2007) Substrate profiling of protein tyrosine phosphatase PTP1B by screening a combinatorial peptide library. J. Am. Chem. Soc. 129, 5366–5367 [DOI] [PubMed] [Google Scholar]
- 46. Sarmiento M., Puius Y. A., Vetter S. W., Keng Y. F., Wu L., Zhao Y., Lawrence D. S., Almo S. C., and Zhang Z. Y. (2000) Structural basis of plasticity in protein tyrosine phosphatase 1B substrate recognition. Biochemistry 39, 8171–8179 [DOI] [PubMed] [Google Scholar]
- 47. Kovalenko M., Denner K., Sandström J., Persson C., Gross S., Jandt E., Vilella R., Böhmer F., and Ostman A. (2000) Site-selective dephosphorylation of the platelet-derived growth factor β-receptor by the receptor-like protein-tyrosine phosphatase DEP-1. J. Biol. Chem. 275, 16219–16226 [DOI] [PubMed] [Google Scholar]
- 48. Ruzzene M., Donella-Deana A., Marin O., Perich J. W., Ruzza P., Borin G., Calderan A., and Pinna L. A. (1993) Specificity of T-cell protein tyrosine phosphatase toward phosphorylated synthetic peptides. Eur. J. Biochem. 211, 289–295 [DOI] [PubMed] [Google Scholar]
- 49. Vacaresse N., Møller B., Danielsen E. M., Okada M., and Sap J. (2008) Activation of c-Src and Fyn kinases by protein-tyrosine phosphatase RPTPα is substrate-specific and compatible with lipid raft localization. J. Biol. Chem. 283, 35815–35824 [DOI] [PMC free article] [PubMed] [Google Scholar]
- 50. Ren L., Chen X., Luechapanichkul R., Selner N. G., Meyer T. M., Wavreille A.-S., Chan R., Iorio C., Zhou X., Neel B. G., and Pei D. (2011) Substrate specificity of protein tyrosine phosphatases 1B, RPTPα, SHP-1, and SHP-2. Biochemistry 50, 2339–2356 [DOI] [PMC free article] [PubMed] [Google Scholar]
- 51. Yang J., Cheng Z., Niu T., Liang X., Zhao Z. J., and Zhou G. W. (2000) Structural basis for substrate specificity of protein-tyrosine phosphatase SHP-1. J. Biol. Chem. 275, 4066–4071 [DOI] [PubMed] [Google Scholar]
- 52. He Z., Zhu H. H., Bauler T. J., Wang J., Ciaraldi T., Alderson N., Li S., Raquil M.-A., Ji K., Wang S., Shao J., Henry R. R., King P. D., and Feng G.-S. (2013) Nonreceptor tyrosine phosphatase Shp2 promotes adipogenesis through inhibition of p38 MAP kinase. Proc. Natl. Acad. Sci. U.S.A. 110, E79–E88 [DOI] [PMC free article] [PubMed] [Google Scholar]
- 53. Linding R., Jensen L. J., Ostheimer G. J., van Vugt M. A., Jørgensen C., Miron I. M., Diella F., Colwill K., Taylor L., Elder K., Metalnikov P., Nguyen V., Pasculescu A., Jin J., Park J. G., et al. (2007) Systematic discovery of in vivo phosphorylation networks. Cell 129, 1415–1426 [DOI] [PMC free article] [PubMed] [Google Scholar]
- 54. Critton D. A., Tortajada A., Stetson G., Peti W., and Page R. (2008) Structural basis of substrate recognition by hematopoietic tyrosine phosphatase. Biochemistry 47, 13336–13345 [DOI] [PMC free article] [PubMed] [Google Scholar]
- 55. Wälchli S., Curchod M. L., Gobert R. P., Arkinstall S., and Hooft van Huijsduijnen R. (2000) Identification of tyrosine phosphatases that dephosphorylate the insulin receptor: a brute force approach based on “substrate-trapping” mutants. J. Biol. Chem. 275, 9792–9796 [DOI] [PubMed] [Google Scholar]
- 56. Horn H., Schoof E. M., Kim J., Robin X., Miller M. L., Diella F., Palma A., Cesareni G., Jensen L. J., and Linding R. (2014) KinomeXplorer: an integrated platform for kinome biology studies. Nat. Methods 11, 603–604 [DOI] [PubMed] [Google Scholar]
- 57. de Hoon M. J., Imoto S., Nolan J., and Miyano S. (2004) Open source clustering software. Bioinformatics 20, 1453–1454 [DOI] [PubMed] [Google Scholar]
- 58. Barker W. C., Garavelli J. S., Hou Z., Huang H., Ledley R. S., McGarvey P. B., Mewes H. W., Orcutt B. C., Pfeiffer F., Tsugita A., Vinayaka C. R., Xiao C., Yeh L. S., and Wu C. (2001) Protein Information Resource: a community resource for expert annotation of protein data. Nucleic Acids Res. 29, 29–32 [DOI] [PMC free article] [PubMed] [Google Scholar]
Associated Data
This section collects any data citations, data availability statements, or supplementary materials included in this article.