Abstract
Social media are transforming global communication and coordination and provide unprecedented opportunities for studying socio-technical domains. Here we study global dynamical patterns of communication on Twitter across many scales. Underlying the observed patterns is both the diurnal rotation of the Earth, day and night, and the synchrony required for contingency of actions between individuals. We find that urban areas show a cyclic contraction and expansion that resembles heartbeats linked to social rather than natural cycles. Different urban areas have characteristic signatures of daily collective activities. We show that the differences detected are consistent with a new emergent global synchrony that couples behaviour in distant regions across the world. Although local synchrony is the major force that shapes the collective behaviour in cities, a larger-scale synchronization is beginning to occur.
Keywords: complex systems, computational social science, synchronization, human behaviour
1. Introduction
The functioning of complex systems, like human societies or living organisms, depends not only upon the individual functionalities of their parts but also upon the coordination of their actions. Self-sustaining activities, such as economic transactions and associated communications, occur through interactions among people, creating dependencies among their actions. A central challenge for both sociology and economics is our ability to characterize the collective actions of individuals that together become the aggregate activity that constitutes our society [1]. Recent studies have shown that these processes can be observed by looking at communication patterns among individuals in social groups [2]. Here we analyse Twitter data to describe the underlying dynamics of social systems. In particular, we study collective activities across geographical scales, from areas smaller than 1 km2 up to the global scale.
The recent explosion of social media is radically changing the way information is shared among people and therefore the properties of our society. These new mechanisms allow people to easily interact with each other and to affordably exchange and propagate pieces of information at multiple scales. As a consequence, people may be able to engage in types of complex tasks previously dominated by organizations structured for a particular purpose [3]. By looking for patterns in the aggregate data, we can retrieve structural and dynamical information about the social system [4]. This represents an unprecedented opportunity to study social systems across many scales. Traditional surveys of small samples, which are typically limited to a few questions, do not have the scale and frequency to capture such population dynamics [4].
As highly concentrated social systems, cities are manifestly complex systems with emergent properties [5]. They are self-organized entities made up of multiple complex agents that engage in larger-scale, complex tasks. Moreover, cities have multiscale structures individually through fractal growth and collectively through size distributions. Their structural patterns have been modelled by scaling laws [1], archetypes of streets layouts [6,7] and land use [8]. Human-generated data have been used to understand the dynamical behaviour of inhabitants and their impact on the functioning of a city. Patterns of human activity and mobility reveal the spatial structure of collective interactions [9,10] and the dynamical properties of urban functional areas [11,12]. Many of these studies use mobile phone data, which are available only for a small set of cities.
In this work, we analyse over 500 million geolocated tweets, posted between 1 August 2013 and 30 April 2014, to explore patterns of social dynamics in urban areas around the world. We collected these data using the Twitter streaming application programming interface (API) [13], which provides over 90% of the publicly available geolocated tweets [14] in real time. Twitter is an online social network whose users share ‘micro-blog’ posts from smartphones and other personal computers. Its population trends younger, wealthier and urban [15,16], which makes it a good probe of the dynamics of young workers in cities. Geolocated tweets provide a precise location of the individuals that post messages, and represent around 3% of the overall Twitter stream [17]. Twitter activity has been analysed to understand human sentiments [18], news sharing networks [19] and influence dynamics [20], as well as global patterns of human mobility [21], activity [22] and languages [23].
2. Urban activity
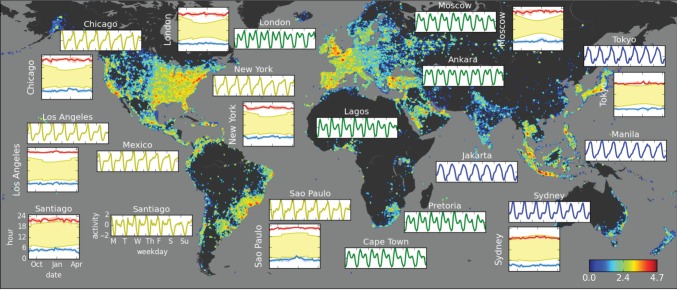
In figure 1, we show the hourly number of tweets during an average week for a few major metropolitan areas (rectangular insets) on top of a map representing the global density of tweets during an average day (52 metropolitan areas across the world are in the electronic supplementary material).
Figure 1.
Global Twitter activity. Background map: Twitter activity in each 0.25° × 0.25° geographical area (base-10 log scale at lower right). Rectangular insets: Average week of Twitter activity of selected cities in Universal Time (UTC) after subtracting the mean and normalizing by the standard deviation. Square insets: low (blue) and high (red) points of Twitter activity of several urban areas compared with daily sunlight periods (yellow) during the nine-month observation period (scales on lower left shown for Santiago are the same for all cities). An animated visualization of the global Twitter activity is shown in the electronic supplementary material, video S1.
To construct the average week, we count the number of tweets in each hour in the urban area i during the observation period (N weeks), si,t. Time can be written in terms of the hour of the week t = t′ mod W, where t ε {1, …,W}, W = 168, is the number of hours per week and t′ is the number of hours since the start of the observation period. We then average the corresponding hours of each week (with the same value of t) after normalizing by the standard deviation for that day:
 |
where we use a 24 h daily index σ ε {0, … , D −1}, D = 24, to define the daily average and standard deviation. ⌊x⌋ is the integer part of x. We further define an average day as the average over corresponding hours of the days of the average week:
 |
2.2 |
where σ ∈ {0, … , D −1} and Ω = 7.
Overall, cities present similar patterns of collective behaviour, cycling between peaks and valleys of activity. Such patterns are also found in phone calls [24], electricity consumption [25] and emails [26]. Peaks occur during daytime or evening, indicating that people are awake and active, simultaneously tweeting from work, recreational or residential areas, whereas valleys occur during night and sleeping hours, indicating that people are inactive.
The time series' regular behaviour indicates that people synchronize their activities throughout the day. This synchrony is not solely due to external factors like light and dark or due to biological factors like circadian rhythms [27]. The second set of insets show low (blue) and high (red) points of the activity along with the time of sunrise and sunset over the year (yellow shadowed area). The wide range of light and dark times does not cause a comparable shift in activity times. We calculated the time difference between the series' morning valleys and sunrise times, as well as the time difference between the series' afternoon peaks and sunset times. We grouped these time differences into 10 day intervals, calculated their distributions and compared with a null hypothesis that the distributions do not change. We found that the average largest and shortest time differences over the observation period are significantly different (p < 0.01 for equatorial cities and p < 0.001 otherwise), indicating that variations in the sunset or sunrise times do not determine the times of peaks or valleys of activity.
Our economic system is based upon transactions, communications and coordination involving the activities of multiple workers. The completion of tasks within a given time frame depends upon the joint availability of workers either simultaneously or in the correct sequence [28]. Synchrony has its costs, as commuting traffic jams illustrate, but many activities are less effective or impossible to do without it. Synchrony enables couples in relationships to share waking and sleeping schedules. Broad categories of coordinated behaviours like work, leisure and sleep make up the temporal superstructure which organizes all other tasks within the daily time line of a city. For workers on a 09.00 to 17.00 h schedule, working at the same time every day enables them to meet to conduct business activities together, whether in person or by telephone. Others who work outside of regular business hours are able to provide services like entertainment and shopping opportunities to those who work during the primary shift. The coordination of social activities during these off hours is possible because of the synchrony of standard work and rest hours. Biological circadian rhythms are important for the synchronization of sleeping hours [27] and the interactions of couples contribute to the synchronization of activities.
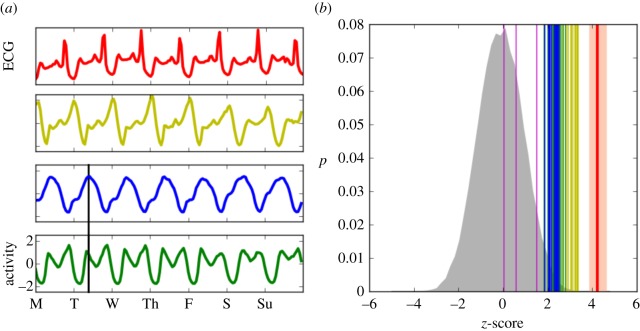
Similar patterns arise in the biological activity of living organisms, like heartbeats or respiration, or in their collective activity, like in termite colonies [29] or ecosystems like forests [30]. Heartbeats, in particular, have properties that appear in some ways similar to urban dynamics. For comparison, we show in figure 2a the electrocardiogram (ECG) of a 43-year-old man [31,32] together with the Twitter activity from São Paulo (yellow), Jakarta (blue) and London (green). The similarity between heartbeats and Twitter activity is remarkable and quantified in figure 2b by correlating ECG signals of individual heartbeats with urban Twitter activity (also see the electronic supplementary material, B). The signature of a regular heartbeat is obtained by segmenting the ECG into equal average heartbeat intervals that are further divided into 24 segments (similar to the 24 h in a day). This signature is correlated with the ECG and Twitter activity. The correlation is done by placing the minimum value in each period for both signals at the centre of the correlation window. The heartbeats are highly correlated with the Twitter activity in urban areas, just less than the correlation of heartbeats with each other. The correlations with the time series are compared with those of 50 000 random time series, as well as with those of periodic series, in figure 2b. While the high level of correspondence is not essential to our discussion, the reasons for it can be understood. Both regular heart activity and human urban activity have three primary periods. The heart experiences a strong (ventricular) contraction, a secondary (atrial) contraction and a period in which both are relaxing. Human urban collective activity has a primary work shift, a secondary work and recreation shift, and a sleep shift.
Figure 2.
Correlation of the temporal dynamics of cities and heart beats. (a) An example of heart beat ECG signal at approximately 80 beats per minute (red) and the average week of Twitter activity for three cities: São Paulo (yellow), Jakarta (blue) and London (green). Vertical black lines show the time of synchronization (see text). (b) Correlation of the heartbeat with 50 000 random series (grey curve), other heartbeats (red line), periodic signals (magenta lines, from left to right: sawtooth, squared and sinusoid), and all urban areas coloured by group determined by clustering analysis (see §3 and the electronic supplementary material).
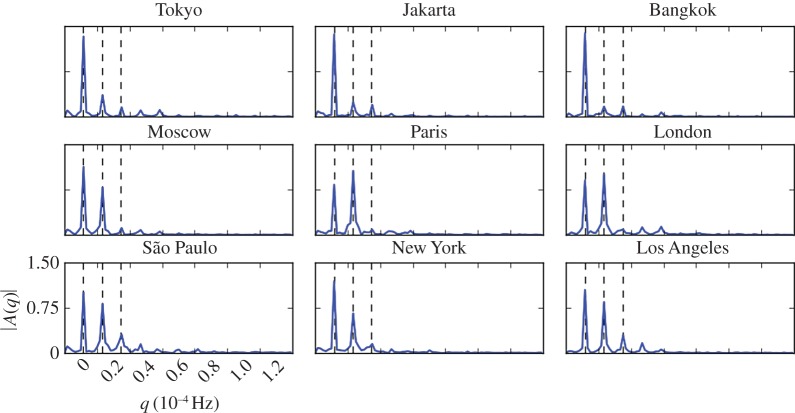
The threefold cyclical Twitter behaviour was further analysed by spectral decomposition (Fourier transform). The spectral behaviour of the Twitter activity series from six major cities is shown in figure 3 and the remaining cities are shown in the electronic supplementary material. All frequency spectra have three significant components at 24, 12 and 8 h (dashed lines). The first is due to variations associated with the daily cycle, the second to variations during 12 h periods, night and day, the third corresponds to periodic variations within work, recreation and sleep ‘shifts’.
Figure 3.
Spectral analysis of Twitter activity (amplitude of the Fourier transform) of major urban areas (more cities in the electronic supplementary material). The dashed lines indicate (from left to right) the frequencies (q) corresponding to the periods of 24, 12 and 8 h respectively.
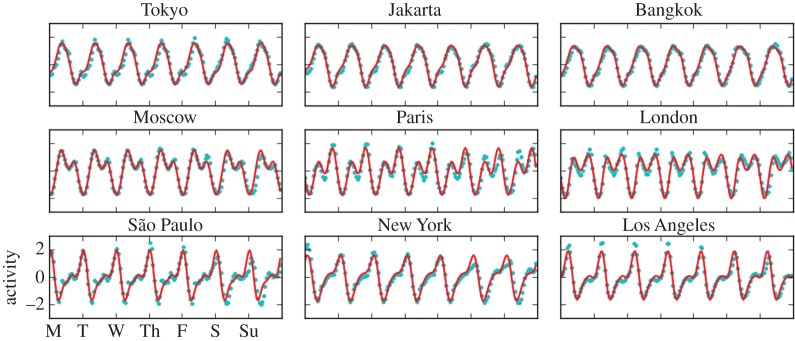
Based on the frequency decomposition, we can model the kinetics by adding three sinusoid signals of 24, 12 and 8 h periods, respectively. In the model, the activity s(t) is defined as:
 |
2.3 |
where t is time in hourly resolution, θ represents the respective signal phase and a is the signal amplitude in the range [0, 1]. We fit the parameters θ and a for each time series by minimizing the quadratic error. The model fits well the observed data (p < 0.001), as shown in figure 4; electronic supplementary material, F.
Figure 4.
Modelling the Twitter activity of major urban areas by spectral decomposition (more cities in the electronic supplementary material). Hourly number of tweets during an average week (blue dots) are compared with model results from equation (2.3) (red curves).
3. Spatial patterns
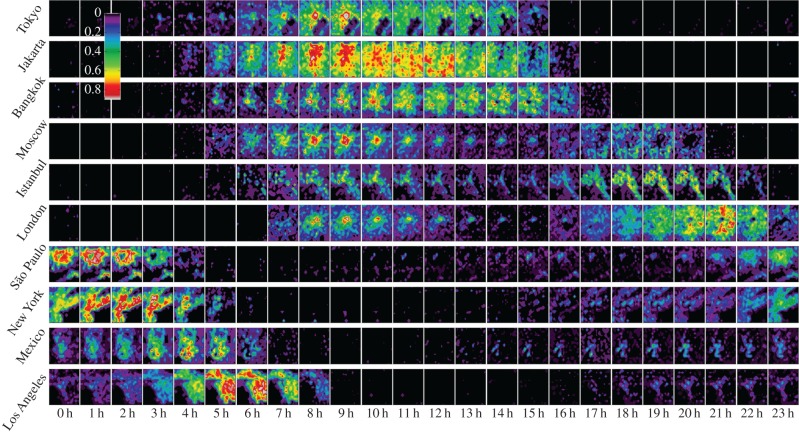
While there are social behaviours that differ among individuals and cultures, there are also those that are common and universal such as the very existence of cities and urban areas. In cities, many people concentrate in a few but dense business or commercial areas during work hours, whereas they disperse to typically sparse residential areas at rest hours. We expose this behaviour by looking at both spatial variation of Twitter activity and individual mobility patterns. We first disaggregated the average day of Twitter activity into a lattice of 20 × 20 patches in each urban area. In figure 5, we show patches of local activity for 10 major metropolitan areas after subtracting the average, normalizing by the standard deviation and colouring the activity above average values (see equation (2.2) where i represents each patch). The average and standard deviation are for each patch, rather than the whole city (see electronic supplementary material, C).
Figure 5.
Spatio-temporal dynamics of Twitter activity in urban areas. Each row shows activity during an average day according to UTC time for the specified city. Colours indicate the normalized excess of activity from the average value at that location (scale shown in figure). Animated visualizations of Twitter activity in urban areas are shown in the electronic supplementary material, videos S2–S4.
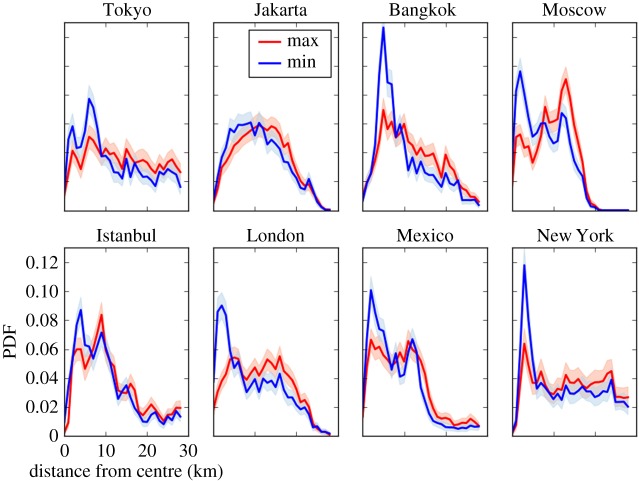
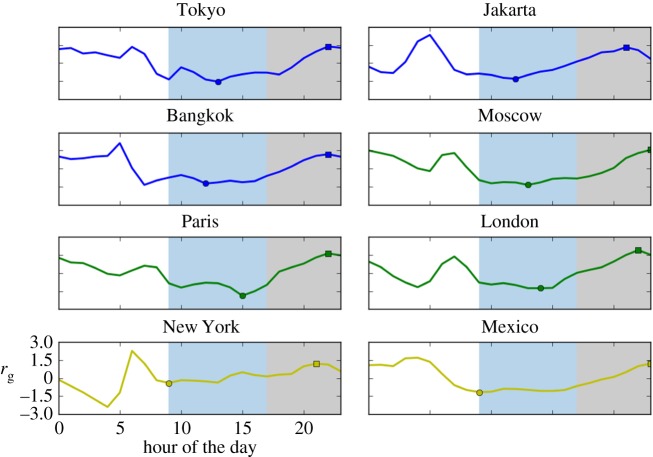
In all cities, there are peaks of intense activity occurring near central areas which expand towards more peripheral areas over time. In figure 6, we show the distribution of tweets as a function of the distance to the city centre, during the most contracted (blue) and expanded (red) times between 09.00 and 00.00 h. The city centre is calculated as the centre of gravity of the spatial activity. For each city, we compared these two distributions, with a null hypothesis that they are similar to each other. After applying bootstrapping, we found that the average distance of tweets to the city centre differs significantly during the most contracted and expanded times (p < 0.001). This effect is also manifest in the hourly variation of the radius of gyration (rg) in figure 7. We calculate the hourly radius of gyration by performing bootstrapping at each hour of the day across the whole observation period and averaging across the same hour of all days. The radius of gyration of each city shows a daily cycle of contraction and expansion during work (blue shaded region in figure 7) and rest hours (grey shadowed regions in figure 7), respectively. Table 1 shows the maximum and minimum values of the radius of gyration between 09.00 and 00.00 h. In all urban areas, the radius of gyration varies significantly (p < 0.001).
Figure 6.
Distribution of tweets as a function of the distance to the city centre (calculated as the centre of gravity of the spatial activity of each city) during the most contracted (blue) and expanded (red) periods between 09.00 and 00.00 h in major urban areas. PDF, probability density function.
Figure 7.
Radius of gyration (rg) of tweets during an average day in major metropolitan areas. Series are shown in local time and have been rescaled by subtracting the average and normalizing by the standard deviation. Blue shading indicates standard work hours (09.00 to 17.00 h) and grey shading indicates standard recreation and rest hours before midnight. Colours indicate the results of the clustering algorithm (see §3).
Table 1.
Maximum and minimum radius of gyration (rg) of tweets during an average day for eight major metropolitan areas in kilometres. The difference of their magnitudes is significant (p<0.001). Other cities are in the electronic supplementary material, C.
| city | max. rg | min. rg | city | max. rg | min. rg |
|---|---|---|---|---|---|
| Tokyo | 23.855 ± 0.552 | 21.413 ± 0.612 | Jakarta | 13.671 ± 0.265 | 12.826 ± 0.270 |
| Bangkok | 15.047 ± 0.382 | 13.251 ± 0.401 | Moscow | 11.157 ± 0.183 | 9.516 ± 0.219 |
| Paris | 4.066 ± 0.053 | 3.690 ± 0.061 | London | 13.545 ± 0.255 | 11.892 ± 0.320 |
| New York City | 38.150 ± 1.119 | 35.572 ± 1.158 | Mexico | 12.977 ± 0.368 | 11.135 ± 0.359 |
We apply bootstrapping in the following way. For each hour of the day h, we take N = 500 sample sets ϕh,i of M = 500 tweets j and calculate the tweets' distance to the city centre dj. Then we calculate the average distance  for each sample set, as well as the average distance across all sample sets
  , standard deviation
  and standard error
  . We determine
  and
and  as the times where
  is either the maximum or minimum between 09.00 and 00.00 h. We determine the p-value that
  and
and  are part of the same distribution. As
  and
and  are selected from 24 values for extremality, we used extreme value theory [33]. Using Monte Carlo sampling, the p-value that
  is within the
  distribution and vice versa is p < 0.001 in all cases shown and in over 90% of the cities included in the electronic supplementary material. Analogous procedures are performed with the radius of gyration obtaining similar results.
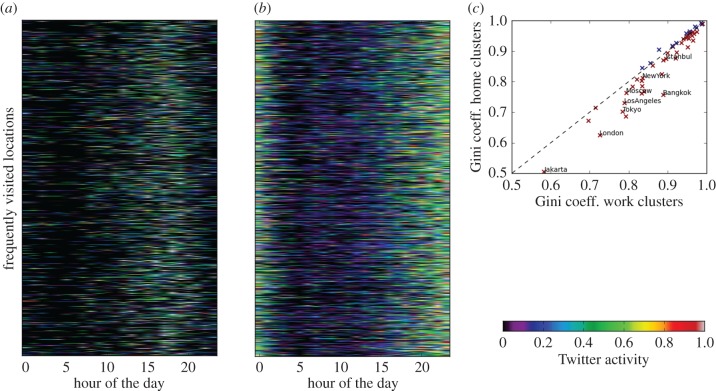
Second, we analysed the most frequently visited locations of each user. By applying a clustering algorithm [34], two clusters of frequently visited locations were identified (figure 8). In one cluster, most tweets are sent during work hours (after 09.00 and before 17.00), while in the other cluster most tweets are sent during rest hours (after 20.00 and before 02.00). This technique has been used to identify work and home locations from mobile phone data [35]. In general, work locations are less homogeneously distributed than residential locations. We counted the number of work and residential locations in each patch of the 20 × 20 grids, respectively. We found that work locations are more spatially clustered, which results in a higher spatial heterogeneity (similar to Gini) coefficient (figure 8c). Moreover, the average distance between residential locations with respect to the city centre is significantly larger than that of work locations (p < 0.001 for half of the analysed cities), indicating that home locations are more widespread.
Figure 8.
Clusters of frequently visited locations according to the time of the day of individual activity. Dominant location clusters have primary activity during either conventional work (09.00 to 17.00 h) or rest hours according to local time. (a) Total activity in all cities at clusters whose primary activity is during conventional work hours. (b) As in (a) but for clusters whose primary activity is not during work hours (scale is shown in the figure). (c) Geographical heterogeneity (similar to Gini) coefficient of conventional work and rest hours locations.
Despite overall similarities, cities have distinct signatures in the number and shape of peaks of activity in both time (figures 1 and 2) and space (figure 5). By applying a clustering algorithm [34] to the time-series vectors, starting from the minimum of activity, we found an optimal partition [36] of three clusters of cities with remarkable cultural and regional affinity. These clusters have been coloured accordingly in figures 1 and 2, as well as in the dimensionally reduced space [37] shown in figure 9. One class of cities, including Jakarta and other Asian and Oceanian cities (blue series in figure 1 and blue symbols in figure 9), has a single large peak of activity during the day. Another class, including São Paulo and multiple North and South American cities (yellow series in figure 1 and yellow symbols in figure 9), has two small peaks of activity in the morning and a large peak in the evening. Finally, a third class, including London and multiple Middle Eastern, European and African cities (green series in figure 1 and green symbols in figure 9), has two equally sized peaks of activity, respectively, at morning and afternoon. Differences are also manifest spatially (figure 5). Asian cities (top three rows) gradually increase their activity (coloured patches), showing spatial peaks, and then rapidly decrease it (black patches). European cities (middle three rows) have a strong spatial peak of activity in the morning near the centre of the city and other dispersed peaks in the afternoon at peripheral areas. Finally, North and South American cities (bottom four rows) have several smaller peaks of activity around multiple centres and one large peak at the end of the day throughout the city. Interestingly, the morning peaks of the European cities coincide in time with the large afternoon peaks of Asian cities (see columns 8 h–10 h), which is an indication of synchrony. This synchrony is manifested as simultaneous peaks of activity in the time series (vertical black lines in figure 2; electronic supplementary material, A). It turns out that some of these differences can be traced to global patterns of behaviour.
Figure 9.
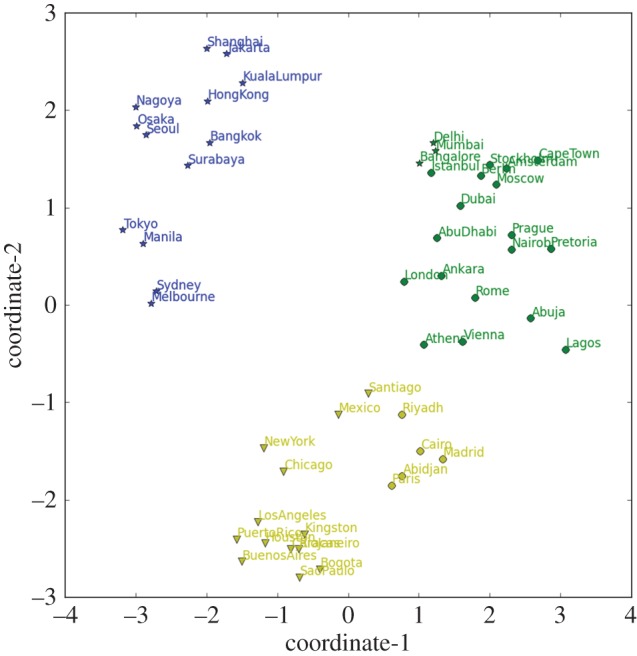
Multidimensional scaling and clustering of city activity according to their time series vectors in local time. Colours indicate the results of the clustering algorithm (see text). Star symbols represent Asian and Oceanian cities. Circular symbols represent Middle Eastern, European and African cities. Triangular symbols represent South and North American cities. Axes correspond to reduced dimensions obtained from multidimensional scaling.
4. Global synchrony
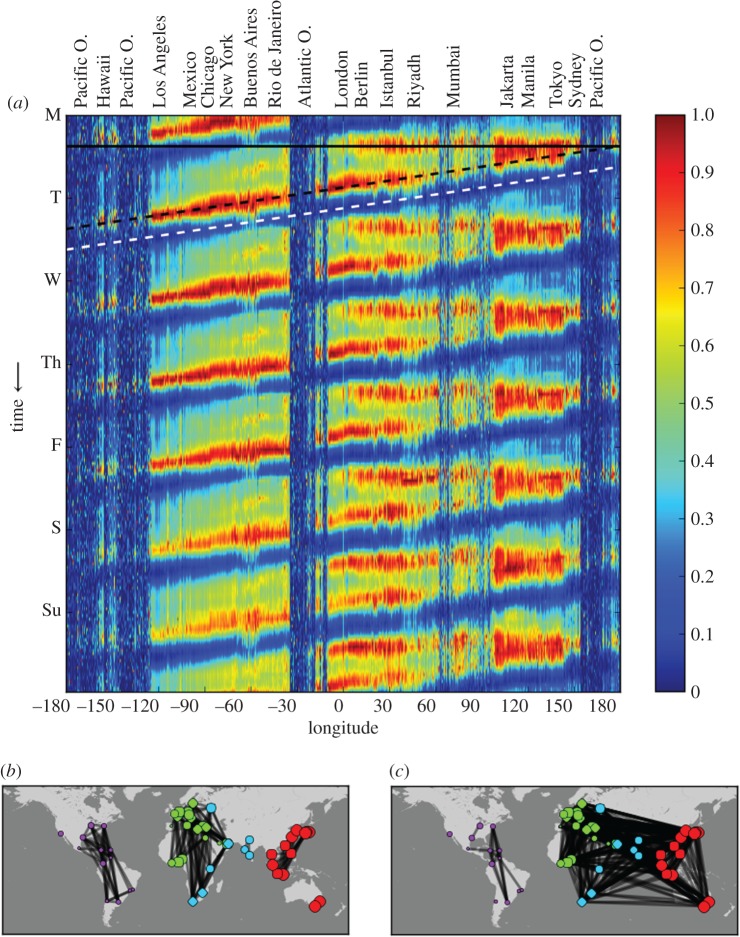
In figure 10a, we show patterns of collective behaviour at a global scale after aggregating tweets by longitude. Each longitude has cycles of activity similar to those of individual cities (figures 1, 2 and 5). Minima (white dashed line) and maxima (black dashed line) shift from east to west due to diurnal synchronization of sleep and wake cycles and the Earth's rotation. The ubiquity of this pattern manifests homogenization in habits and customs among globally differentiated cultures and social contexts. Furthermore, there is a specific synchronization in figure 5 that is actually a global phenomenon. Distinct from the other behaviours that track the daily period and therefore are diagonal, between longitudes 0° and 180°, a horizontal line (black) shows a simultaneous peak of activity that occurs daily across the European, Asian, African and Oceanian continents. This horizontal peak reflects large-scale dependencies across half of the world.
Figure 10.
(a) Temporal dynamics of an average week of Twitter activity by longitude. The vertical axis represents time (increasing from top to bottom) and the horizontal axis represents longitude. Significant cities are indicated at the top. Diagonal dashed lines show peaks of activity (black) and inactivity (white) tracking the time of day. Horizontal line (solid black) indicates synchronous linked activity across Europe, Asia, Africa and Oceania (scale on right). (b) Urban correlation network across a time window from 15.00 to 03.00 UTC. (c) As in (b) but across a time window from 01.00 to 13.00 UTC. Colours indicate the results of a clustering algorithm [38], after aggregating the networks over time. An animated visualization of the urban correlation network is shown in the electronic supplementary material, video S5.
The synchronization of activity is manifest in a dynamic correlation network between nodes representing cities, whose edges appear when the urban time series are correlated above a given threshold (r > 0.9). Correlations are calculated by using overlapping time windows of 12 h across the cities' average day time series. Highly synchronized cities have stronger connections with each other than with the rest of the network. In figure 10b,c, we show two snapshots of the correlation network at different times. Cities are generally linked within times zones, because it is natural for cities to be synchronized to those in similar longitudes (figure 10b). However, at the time of global synchronization (figure 10c) cities across Eurasia and Africa are strongly coupled, manifesting their synchronous activity. Such global synchronization can be expected to arise in the context of increasing global interactions consistent with synchronization in many complex systems [39].
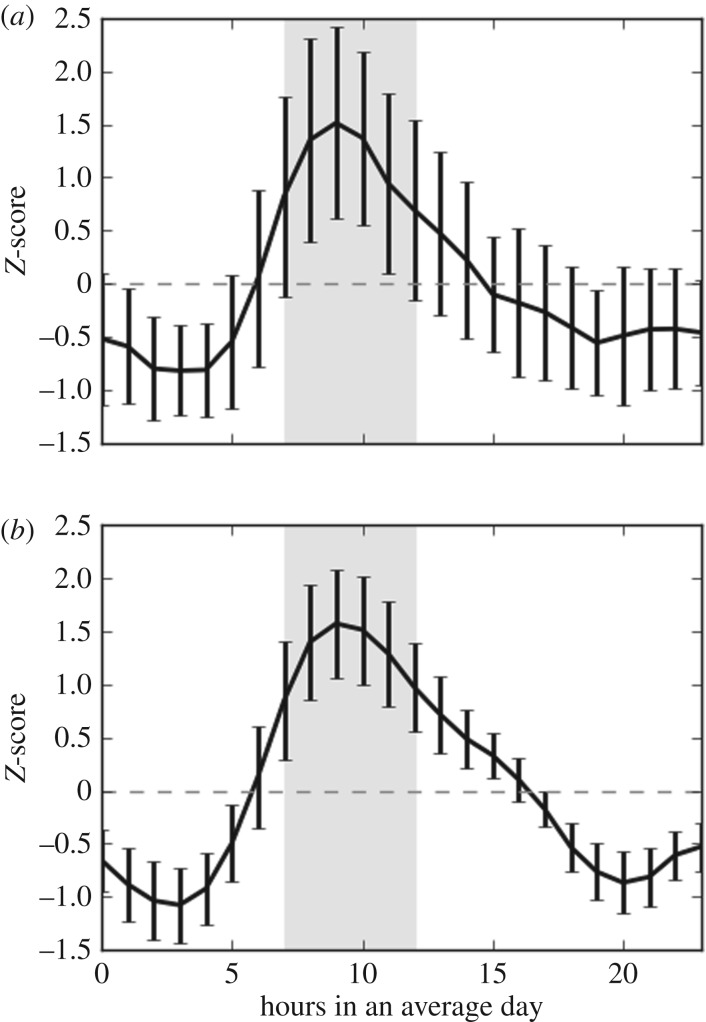
For additional evidence that synchronization arises from social interactions, we studied directed messages in the content of tweets (mentions) and topic identifiers (hashtags) between the European and Asian longitude ranges (figure 11). We found that the number of interurban directed messages and common hashtags simultaneously peak during the synchronized time. At this time a significantly larger number of directed messages are sent between these regions and more hashtags are shared in their messages with respect to other times of the day (p < 0.001). These results indicate that people tend to share more information about increasingly similar topics as they synchronize their activities.
Figure 11.
Deviation from the average number of directed mentions (a) and shared hashtags (b) between the European and Asian longitude ranges during an average day in units of standard deviations (Z-score). Grey shadowed regions represent the synchronized times.
We model the global synchronization process with an iterative dynamical model based on the tendency of tweets to trigger other tweets. The full model includes the tendency of people to tweet before going to bed and absence of tweets at night. The model is defined by the iterative map in the changing daily dynamics of a city:
| 4.1 |
where si represents the temporal activity of city i, σ ∈ [0, 23] indicates time of the day, τ represents day-to-day changes, which is our iterative variable (we ignore weekend differences for this purpose), and σb indicates the location-dependent time of evening activity. Parameters α ∈ [0, 1] and β ∈ [0, 1] indicate the weights of intercity influence at multiple longitudes and evening activity, respectively. Activity is set to zero between times 0 < σ < 8. We normalize si(σ,τ) at each iteration so that  . At τ = 0, si(σ) is set to random values.
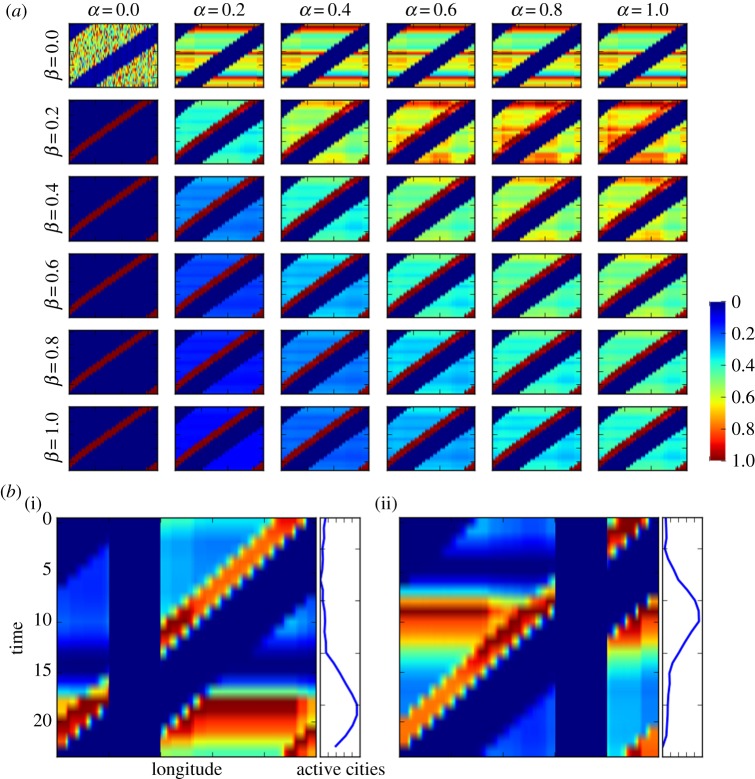
In figure 12a, we present the outcomes of the model for multiple values of intercity influence (α) and evening activity (β). The initial conditions vary among cities but do not change for different α and β configurations. The blue diagonals indicate local sleeping times. If α = β = 0, the model results in an independent random distribution of activities among cities. For positive values of α, cities are able to influence each other and horizontal stripes emerge, indicating the synchronization of activities in cities at multiple longitudes. The horizontal stripes emerge at the times where the sum of initial conditions is slightly higher and therefore symmetry breaks. Similarly, higher values of β result in peaks of activities before sleeping time (red diagonals). Both behaviours are simultaneously found for intermediate values of these parameters (i.e. α = 0.4 and β = 0.2).
Figure 12.
(a) Model outcomes for multiple values of intercity influence at multiple longitudes (α) and night activity (β) with the same initial conditions. Longitudes are represented in the x-axis and universal time is represented in the y-axis (see (b)(i) for scale). Colours indicate the level of activity (scale shown in figure). We normalize the cities' activities by their maximum value. (b) Average model outcomes after introducing the effects of large inactive areas—oceans. Panels (b)(i) and (b)(ii) show inactive areas at different locations. Parameters α = 0.4 and β = 0.2. The blue series indicates the number of active cities (x-axis) at each time of the day (y-axis). Colour scale is similar to top panels.
We add an inactive ocean to the model in figure 12b and average over 100 realizations of two specific parameter values. The inactive areas affect the number of active cities at each time of the day. As a result, the synchronized peaks of activity (red horizontal stripes in squared panels) emerge at the times where most of cities are active (blue curve in rectangular panels) and consequently the sum of initial conditions is consistently higher. These results show that synchronous peaks of activity emerge from reinforcement and interaction mechanisms.
5. Conclusion
The patterns we identified manifest how social activities lead to dependencies among the communication between individuals, especially their synchronization. Synchronization may arise because of explicit coordination, but more generally occurs due to availability of individuals to perform actions when others trigger responses from them. Urban synchrony is manifest in each urban area. We have found that global synchrony appears to be arising in the context of increasing global communication. Through synchronization, the timing of human communication and activities becomes constrained to the norms and conventions of the social environment. As people create and maintain temporally sensitive relationships, the complexity of the larger scale behaviour of the social system increases. These collective behaviours may be linked to collective capabilities that provide products, services and information that cannot be obtained by an individual alone.
Supplementary Material
Acknowledgements
We thank Richard J. Cohen for helpful comments and discussions.
Authors' contributions
All authors contributed in making the figures and writing the manuscript.
Competing interests
We declare we have no competing interests.
Funding
This study was funded by NECSI internal funds.
References
- 1.Bettencourt LM. 2013. The origins of scaling in cities. Science 340, 1438–1441. ( 10.1126/science.1235823) [DOI] [PubMed] [Google Scholar]
- 2.Pentland A. 2014. Social physics: how good ideas spread—the lessons from a new science. New York, NY: Penguin Press. [Google Scholar]
- 3.Libert B, Wind Y, Fenley M. 2014 What Airbnb, Uber, and Alibaba have in common. Harvard Business Review. See https://hbr.org/2014/11/what-airbnb-uber-and-alibaba-have-in-common .
- 4.Lazer D, et al. 2009. Computational social science. Science 323, 721–723. ( 10.1126/science.1167742) [DOI] [PMC free article] [PubMed] [Google Scholar]
- 5.Batty M. 2008. The size, scale, and shape of cities. Science 319, 769–771. ( 10.1126/science.1151419) [DOI] [PubMed] [Google Scholar]
- 6.Buhl J, Gautrais J, Reeves N, Solé R, Valverde S, Kuntz P, Theraulaz G. 2006. Topological patterns in street networks of self-organized urban settlements. Eur. Phys. J. B Condens. Matter Complex Syst. 49, 513–522. ( 10.1140/epjb/e2006-00085-1) [DOI] [Google Scholar]
- 7.Louf R, Barthelemy M. 2014. A typology of street patterns. J. R. Soc. Interface 11, 20140924 ( 10.1098/rsif.2014.0924) [DOI] [PMC free article] [PubMed] [Google Scholar]
- 8.Decraene J, Monterola C, Lee GK, Hung TG, Batty M. 2013. The emergence of urban land use patterns driven by dispersion and aggregation mechanisms. PLoS ONE 8, e80309 ( 10.1371/journal.pone.0080309) [DOI] [PMC free article] [PubMed] [Google Scholar]
- 9.Ratti C, Williams S, Frenchman D, Pulselli RM. 2006. Mobile landscapes: using location data from cell phones for urban analysis. Environ. Plann. B Plann. Des. 33, 727–748. ( 10.1068/b32047) [DOI] [Google Scholar]
- 10.Louail T, Lenormand M, Ros OGC, Picornell M, Herranz R, Frias-Martinez E, Ramasco JJ, Barthelemy M. 2014. From mobile phone data to the spatial structure of cities. Sci. Rep. 4, 5276 ( 10.1038/srep05276) [DOI] [PMC free article] [PubMed] [Google Scholar]
- 11.Toole JL, Ulm M, González MC, Bauer D. 2012. Inferring land use from mobile phone activity. In Proc. 18th ACM SIGKDD Int. Conf. on Knowledge Discovery and Data Mining, Beijing, China, 12–16 August 2012, pp. 1–8. New York, NY: ACM Press.
- 12.Frias-Martinez V, Soto V, Hohwald H, Frias-Martinez E. 2012 doi: 10.1109/SocialCom-PASSAT.2012.19. Characterizing urban landscapes using geolocated tweets. In Proc. 2012 Int. Conf. on Privacy, Security, Risk and Trust and 2012 Int. Conf. on Social Computing, Amsterdam, The Netherlands, 3--5 September 2012 , pp. 239–248. New York, NY: IEEE. ( ) [DOI]
- 13.Twitter. 2015. Twitter streaming application programming interface. (Online; posted 2015.)
- 14.Morstatter F, Pfeffer J, Liu H, Carley KM. 2013. Is the sample good enough? Comparing data from Twitter's streaming API with Twitter's firehose. In Proc. of the 7th Int. AAAI Conf. on Weblogs and Social Media, Cambridge, MA, 8–11 July 2013. Palo Alto, CA: The AAAI Press.
- 15.Duggan M, Brenner J. 2013. The demographics of social media users. Technical report. Pew Research, Washington, DC.
- 16.Mislove A, Lehmann S, Ahn Y-Y, Onnela J-P, Rosenquist JN. 2011. Understanding the demographics of twitter users. In Proc. of the 5th Int. AAAI Conf. on Weblogs and Social Media, Barcelona, Spain, 17–21 July 2011, pp. 554–557. Palo Alto, CA: The AAAI Press.
- 17.Leetaru K, Wang S, Cao G, Padmanabhan A, Shook E. 2013. Mapping the global Twitter heartbeat: the geography of Twitter. First Monday 18 ( 10.5210/fm.v18i5.4366) [DOI] [Google Scholar]
- 18.Golder WM, Macy MW. 2011. Diurnal and seasonal mood vary with work, sleep, and daylength across diverse cultures. Science 333, 1878–1881. ( 10.1126/science.1202775) [DOI] [PubMed] [Google Scholar]
- 19.Herdagdelen A, Zuo W, Gard-Murray A, Bar-Yam Y. 2013. An exploration of social identity: the geography and politics of news-sharing communities in Twitter. Complexity 19, 10–20. ( 10.1002/cplx.21457) [DOI] [Google Scholar]
- 20.Morales A, Borondo J, Losada JC, Benito RM. 2014. Efficiency of human activity on information spreading on Twitter. Soc. Netw. 39, 1–11. ( 10.1016/j.socnet.2014.03.007) [DOI] [Google Scholar]
- 21.Lenormand M, Tugores A, Colet P, Ramasco JJ. 2014. Tweets on the road. PLoS ONE 9, e105407 ( 10.1371/journal.pone.0105407) [DOI] [PMC free article] [PubMed] [Google Scholar]
- 22.Lenormand M, Gonçalves B, Tugores A, Ramasco JJ. 2015. Human diffusion and city influence. J. R. Soc. Interface 12, 20150473 ( 10.1098/rsif.2015.0473) [DOI] [PMC free article] [PubMed] [Google Scholar]
- 23.Mocanu D, Baronchelli A, Perra N, Gonçalves B, Zhang Q, Vespignani A. 2013. The Twitter of Babel: mapping world languages through microblogging platforms. PLoS ONE 8, e61981 ( 10.1371/journal.pone.0061981) [DOI] [PMC free article] [PubMed] [Google Scholar]
- 24.Candia J, González MC, Wang P, Schoenharl T, Madey G, Barabási A-L. 2008. Uncovering individual and collective human dynamics from mobile phone records. J. Phys. A 41, 224015 ( 10.1088/1751-8113/41/22/224015) [DOI] [Google Scholar]
- 25.Pielow A, Sioshansi R, Roberts MC. 2012. Modeling short-run electricity demand with long-term growth rates and consumer price elasticity in commercial and industrial sectors. Energy 46, 533–540. ( 10.1016/j.energy.2012.07.059) [DOI] [Google Scholar]
- 26.Wang D, Wen Z, Tong H, Lin C-Y, Song C, Barabási A-L. 2011. Information spreading in context. In Proc. of the 20th Int. Conf. on World Wide Web, Hyderabad, India, 28 March–1 April 2011, pp. 735–744. New York, NY: ACM.
- 27.Strogatz SH. 2003. Sync: the emerging science of spontaneous order. New York, NY: Hyperion Theia. [Google Scholar]
- 28.Van Der Aalst W, Van Hee KM. 2004. Workflow management: models, methods, and systems. Cambridge, MA: MIT Press. [Google Scholar]
- 29.Jamali H, Livesley SJ, Dawes TZ, Cook GD, Hutley LB, Arndt SK. 2011. Diurnal and seasonal variations in CH4 flux from termite mounds in tropical savannas of the Northern Territory, Australia. Agric. For. Meteorol. 151, 1471–1479. ( 10.1016/j.agrformet.2010.06.009) [DOI] [Google Scholar]
- 30.Grace J, et al. 1995. Carbon dioxide uptake by an undisturbed tropical rain forest in southwest Amazonia, 1992 to 1993. Science 270, 778–780. ( 10.1126/science.270.5237.778) [DOI] [Google Scholar]
- 31.Greenwald S. 1986. The development and analysis of a ventricular fibrillation detector. Master's thesis, MIT, Cambridge, MA, USA.
- 32.Goldberger A, et al. 2000. Physiobank, physiotoolkit, and physionet: components of a new research resource for complex physiologic signals. Circulation 101, 215–220. ( 10.1161/01.CIR.101.23.e215) [DOI] [PubMed] [Google Scholar]
- 33.Haan LD, Ferreira A. 2006. Extreme value theory: an introduction. Springer Series in Operations Research and Financial Engineering New York, NY: Springer. [Google Scholar]
- 34.MacQueen J. 1967. Some methods for classification and analysis of multivariate observations. In Proc. of the Fifth Berkeley Symp. on Mathematical Statistics and Probability, Volume 1: Statistics (eds L Lecam, J Neyman), pp. 281–297. Berkeley, CA: University of California Press.
- 35.Becker R, et al. 2013. Human mobility characterization from cellular network data. Commun. ACM 56, 74–82. ( 10.1145/2398356.2398375) [DOI] [Google Scholar]
- 36.Rousseeuw PJ. 1987. Silhouettes: a graphical aid to the interpretation and validation of cluster analysis. J. Comput. Appl. Math. 20, 53–65. ( 10.1016/0377-0427(87)90125-7) [DOI] [Google Scholar]
- 37.Borg I, Groenen PJ. 2005. Modern multidimensional scaling: theory and applications. New York, NY: Springer Science & Business Media. [Google Scholar]
- 38.Blondel VD, Guillaume J-L, Lambiotte R, Lefebvre E. 2008. Fast unfolding of communities in large networks. J. Stat. Mech. Theory Exp. 2008, P10008 ( 10.1088/1742-5468/2008/10/P10008) [DOI] [Google Scholar]
- 39.Boccaletti S, Kurths J, Osipov G, Valladares D, Zhou C. 2002. The synchronization of chaotic systems. Phys. Rep. 366, 1–101. ( 10.1016/S0370-1573(02)00137-0) [DOI] [Google Scholar]
Associated Data
This section collects any data citations, data availability statements, or supplementary materials included in this article.


