

Abstract
Background
Drug-drug interactions with insulin secretagogues are associated with increased risk of serious hypoglycemia in patients with type 2 diabetes. We aimed to systematically screen for drugs that interact with the five most commonly used secretagogues―glipizide, glyburide, glimepiride, repaglinide, and nateglinide―to cause serious hypoglycemia.
Methods
We screened 400 drugs frequently co-prescribed with the secretagogues as candidate interacting precipitants. We first predicted the drug–drug interaction potential based on the pharmacokinetics of each secretagogue–precipitant pair. We then performed pharmacoepidemiologic screening for each secretagogue of interest, and for metformin as a negative control, using an administrative claims database and the self-controlled case series design. The overall rate ratios (RRs) and those for four predefined risk periods were estimated using Poisson regression. The RRs were adjusted for multiple estimation using semi-Bayes method, and then adjusted for metformin results to distinguish native effects of the precipitant from a drug–drug interaction.
Results
We predicted 34 pharmacokinetic drug–drug interactions with the secretagogues, nine moderate and 25 weak. There were 140 and 61 secretagogue–precipitant pairs associated with increased rates of serious hypoglycemia before and after the metformin adjustment, respectively. The results from pharmacokinetic prediction correlated poorly with those from pharmacoepidemiologic screening.
Conclusions
The self-controlled case series design has the potential to be widely applicable to screening for drug–drug interactions that lead to adverse outcomes identifiable in healthcare databases. Coupling pharmacokinetic prediction with pharmacoepidemiologic screening did not notably improve the ability to identify drug–drug interactions in this case.
Keywords: sulfonylurea, meglitinide, glyburide, glipizide, glimepiride, metformin, repaglinide, nateglinide, hypoglycemia, screening, pharmacokinetics, pharmacoepidemiology, self-controlled case series
INTRODUCTION
Insulin secretagogues—including glipizide, glyburide and glimepiride as sulfonylureas, and repaglinide and nateglinide as meglitinides—are among the most widely used oral antidiabetic agents in the US.1 A common and potentially life-threatening adverse drug event associated with the use of secretagogues is hypoglycemia. Secretagogue-induced hypoglycemia can result in coma or seizure2 and can increase the risk of myocardial ischemic injury, dementia, and death.3,4 Sulfonylureas are associated with a substantial rate of serious hypoglycemia (i.e. leading to hospitalization or emergency department visit), with an estimated incidence rate of ~1–3 per 100 person-years.5–7 Meglitinides may have a modestly lower risk of hypoglycemia than sulfonylureas.8 In the national action plan for prevention of adverse drug events issued by the US Department of Health & Human Services, hypoglycemia associated with antidiabetics is one of the three high-priority adverse drug event targets that need more research to identify current knowledge gaps for prevention of such events.9 One such knowledge gap is drug–drug interactions with secretagogues that potentially have a large clinical and public health impact, but have been investigated only in few studies.
One mechanism whereby drug–drug interactions can contribute to secretagogue-induced hypoglycemia is by inhibiting the metabolism of secretagogues and thus intensifying their hypoglycemic effects. For example, certain anti-infective agents that are inhibitors of the metabolism of sulfonylureas have been found to be associated with increased risk of hypoglycemia among sulfonylurea users.10 Inhibition of drug metabolism, and that mediated by cytochrome P450 enzymes in particular, is the most common mechanism underlying known, clinically important drug–drug interactions.11 In a drug–drug interactions occurring via this mechanism, the object drug (e.g. sulfonylureas) is the drug whose metabolism is inhibited, and the precipitant (e.g. anti-infectives) is the drug that inhibits the metabolism of the object drug.
A variety of methods have been used to identify drug–drug interactions .12 In vitro and in vivo pharmacokinetic studies are now conducted routinely during drug development to examine the potential for interactions.13 However, these designs are often applied in a small scale involving only few drug pairs, and are limited in the ability to predict the impact of a drug–drug interactions on health outcomes in the settings of complex physiology of actual patients. Because of ethical and sample size considerations, nonexperimental pharmacoepidemiologic studies are a natural choice when examining the associations between drug–drug interactions and adverse health effects. Signal detection algorithms have been developed to screen for putative interactions using spontaneous adverse drug event reports or longitudinal databases. Such studies in general have limited ability to provide insight for biological mechanisms underlying drug–drug interactions. Interaction screening studies14,15 using spontaneous adverse drug event reports often suffer from well-recognized limitations of such databases such as reporting bias.16 Screening studies using longitudinal databases may offer more promise in identifying interactions, but can face the challenge of simultaneous confounding adjustment across a large number of drug pairs.17 The self-controlled case series design has been shown to have reasonable performance in screening for drug–adverse event associations using longitudinal databases.18 This design appears to be promising in alleviating the issue of confounding for time-invariant factors when screening for drug–drug interactions because each subject implicitly serves as her/his own control.
The various methods that can be used to identify drug–drug interactions are almost always applied separately, leading to a siloed approach to knowledge generation.12 We therefore sought to develop a translational and systematic approach that hopefully can improve signal detection of drug–drug interactions. This approach consists two parallel components – a pharmacoepidemiologic component that uses healthcare data to screen for drug–drug interactions with adverse health effects, and a pharmacokinetic component that utilizes existing pharmacological knowledge as a theoretical basis for predicting high-probability interactions. Any drug pairs identified independently by both methods would be expected to be more likely to have both clinical effects and mechanistic background, such that they could be more readily examined in subsequent hypothesis-driven etiologic studies. We explored the application of this approach in screening for drug–drug interactions with five most commonly used secretagogues associated with increased risk of serious hypoglycemia.
METHODS
Data sources
Clinformatics Data Mart Database9 (OptumInsight, Eden Prairie, MN) (CDM) is a de-identified database of administrative health claims for members of a large national US commercial insurance plan that included both commercially-insured and Medicare Advantage enrollees. It includes approximately 14 million members at any one time and about 52 million unique members over the study period (2000–2012). CDM contains demographic (including self-reported race) and enrollment data, pharmacy claims, and medical claims that provide data on services, procedures, and their accompanying diagnoses. This study was approved by the Institution Review Board of the University of Pennsylvania.
Identification of candidate precipitants
From CDM, we identified all oral drugs concomitantly used with any study secretagogue and calculated the cumulative number of concomitant days for each drug. We selected 400 drugs that had the largest numbers of cumulative concomitant days, which collectively accounted for 99% of concomitant exposure to the study secretagogues. These drugs were the precipitants of interest in the subsequent analyses.
Design of pharmacoepidemiologic screening studies
The self-controlled case series design in this study examined the rate of serious hypoglycemia for a patient receiving a secretagogue of interest after initiating vs. not receiving a precipitant. This design is readily applicable for screening purpose in that 1) it is highly computationally efficient since it includes only cases; and 2) it inherently controls for confounding by factors that remain constant within an individual over the observation period, such as variables relating to sex, genetics, individual frailty, and severity of underlying diseases19. A screening study using metformin as the negative control object drug was also conducted. A negative control object is a drug that is used for similar indications as the object drug under study, but is not believed to interact pharmacologically with the precipitant.20 Metformin has two properties that made it attractive as a negative control. One is that it is one of the most commonly used antidiabetic agents with a low risk of hypoglycemia.21 Also, metformin is eliminated unchanged in urine and therefore is not subject to pharmacokinetic interactions with the precipitants through inhibition of CYP isoforms.22
Identification of cases
Cases were apparent new users of a study secretagogue or metformin (referred to as an object hereinafter) who were hospitalized or treated in an emergency department for hypoglycemia (referred to as serious hypoglycemia hereinafter). An apparent new user was defined as an individual having a baseline period of at least six months of continuous eligibility prior to initiation of a therapy. Cases were identified using one of the following International Classification of Diseases 9th Revision Clinical Modification (ICD-9-CM) discharge diagnosis codes in any position on an emergency department claim or the principal position on an inpatient claim: a) 251.0 (hypoglycemic coma); b) 251.1 (other specific hypoglycemia); c) 251.2 (hypoglycemia, unspecified); or d) 250.8× (diabetes with other specified manifestations), as long as not co-occurring with ≥1 exclusionary diagnosis suggesting manifestations other than hypoglycemia (eTable 1). This algorithm, which we have used previously23–25, has a positive predictive value of 89%26 and 78%27 for the emergency department and inpatient component, respectively.
Defining observation time
The observation time of an object drug consisted of days during which cases were exposed to the drug, beginning on the dispensing date of a prescription for the drug and ending with the first occurrence of the following: a) cessation of use of the drug, plus 7 days for incomplete adherence; b) disenrollment; c) the end of the database; or d) a dispensed prescription for another secretagogue, including those not of interest in this study. We did not censor upon death because CDM does not record death. Observation time from cases who were less than 18 years of age was excluded. For each object–precipitant pair, the observation time was categorized as exposed or unexposed with regard to the exposure to the precipitant. Exposed observation time included person–days during which the case took both the object and the precipitant drug, whereas unexposed observation time included those when the case took the object drug only. Studies have shown that the risk of an adverse event due to a pharmacokinetic drug–drug interaction often peaks shortly after initiating concomitant therapy and declines substantially thereafter.10,27,28 To examine the duration–response relationship of an object–precipitant pair, the exposed observation time was further divided into four risk periods following the initiation of concomitance: 0–10 days, 11–60 days, 61 – 120 days, and > 120 days.
Statistical analysis
In the primary analysis, we examined the overall risk of serious hypoglycemia over the entire exposed vs. unexposed observation time. In the secondary analysis, we examined the risk during the four risk periods. The model specification is described in detail in eAppendix. Rate ratios (RRs) were estimated using Poisson regression conditioned on individual with a modified version of a SAS macro29. To avoid statistically unstable estimates, we did not estimate RRs when there were fewer than five events.
We used a semi-Bayes method to adjust for multiple estimation. The idea behind semi-Bayes adjustment is that the observed variation of the estimated RRs around their geometric mean is larger than the variation of the true but unknown RRs. The semi-Bayes method specifies an a priori value for the variation of the true RRs, which is used to adjust RR estimates. The adjustment shrinks outlying RR estimates toward their geometric mean. This method adjusts for multiple estimation by providing attenuated point estimates and narrower confidence intervals (CIs) than the original, unadjusted estimates.30,31 Pearson’s correlation coefficients were calculated to examine the correlation between area under concentration-time curve ratio and semi-Bayes adjusted RRs (RRSB).
In the adjustment using metformin results, we divided the RRSB for each secretagogue-precipitant pair by the RRSB for the corresponding metformin–precipitant pair, and calculated 95% CIs using the delta method32. This adjustment was only applicable to precipitants for which RRSB were estimated with both a secretagogue and metformin. Since the strength of semi-Bayes adjustment varies with the number of precipitants, we therefore performed a separate semi-Bayes adjustment for the subset of precipitants involved in the adjustment using metformin results. All statistical analyses were conducted using SAS v9.4 (SAS Institute Inc.: Cary, NC) and the R statistical package, version 3.1.0 (R Development Core Team). Programming code can be found in the eAppendix.
Pharmacokinetic prediction
An area under concentration-time curve predicts the ratio of the systemic exposure to an object drug in the presence vs. absence of a precipitant. We used the following equation33,34 to predict the AUCR of a secretagogue–precipitant pair,
where fe represents the fraction of the secretagogue excreted unchanged renally, [I]unbound is the unbound plasma concentration of the precipitant, Ki,j is the dissociation constant of the precipitant for the jth inhibited cytochrome P450 pathway, and fm,CYPj is the fraction of the secretagogue’s hepatic metabolism through the jth inhibited P450 pathway. [I]unbound and Ki,j of the precipitants were ascertained from DrugBank35 and the published literature. The pharmacokinetic parameters of the secretagogues are shown in eTable 2. As the model for AUCR prediction is sensitive to the input value of fm, we performed sensitivity analyses using fm values obtained from different sources.
Consistent with the US FDA guidelines for assessing clinical drug–drug interactions13, secretagogue–precipitant pairs that had AUCRs <1.25 were considered negligible, those that had 1.25 ≤ AUCR < 2 were considered as weak interactions, those that had 2 ≤ AUCR < 5 were considered as moderate interactions, and those that had AUCR ≥5 were considered strong interactions.
RESULTS
Pharmacoepidemiologic screening
Characteristics of the cases in pharmacoepidemiologic screening studies are summarized in Table 1. As meglitinides (i.e. repaglinide and nateglinide) were used less frequently than sulfonylureas and metformin, there were substantially smaller numbers of cases, observed person–days and serious hypoglycemia events for meglitinides. The cases were in general of advanced age. There were more females than males among sulfonylurea and metformin cases, but the opposite was found for meglitinides. These findings were consistent with previous results that females and older adults are at a higher risk of sulfonylurea-induced hypoglycemia.6,36 The majority of the cases did not receive any prescription for antidiabetics other than the study secretagogues in the 30 days prior to events, indicating that concomitant antidiabetic therapy was not materially associated with serious hypoglycemia events.
Table 1.
Pharmacoepidemiologic screening: summary of case characteristics and results
| Glimepiride | Glipizide | Glyburide | Nateglinide | Repaglinide | Metformin | |
|---|---|---|---|---|---|---|
| Cases | ||||||
| Number | 1,270 | 1,755 | 1,698 | 77 | 118 | 1,885 |
| Female (%) | 57.3 | 57.7 | 55.8 | 42.9 | 42.4 | 54 |
| Median age (years) | 72.6 | 72.8 | 72.9 | 73.8 | 73.4 | 68.8 |
| Observed person-days | 266,196 | 392,760 | 347,411 | 7,415 | 11,800 | 302,616 |
| Number of events | 2,244 | 2,832 | 2,903 | 106 | 183 | 2,707 |
| Cases (%) receiving prescription(s) for antidiabetics other than the secretagogues in the 30 days prior to events | ||||||
| Nonea | 56.4 | 53 | 47.3 | 54.7 | 44.8 | 14.9 |
| Metformin only | 14.5 | 17.5 | 28.9 | 8.5 | 17.5 | 46.4 |
| Insulin only | 9.5 | 12.3 | 6.2 | 16 | 17.5 | 3.9 |
| Other antidiabeticsb | 9.8 | 7.1 | 6.5 | 4.7 | 6.5 | 0.4 |
| Insulin + metformin | 2.8 | 3.5 | 3.4 | 1 | 4.4 | 20.8 |
| Metformin + other antidiabetics | 5.3 | 4.1 | 5.3 | 2.8 | 4.4 | 8.2 |
| Insulin + other antidiabetics | 1.2 | 1.7 | 0.8 | 11.3 | 2.7 | 0.3 |
| Insulin + metformin + other antidiabetics | 0.5 | 0.8 | 1.6 | 1 | 2.2 | 5.1 |
| RRSB estimates | ||||||
| Number of precipitants examined | 218 | 222 | 228 | 39 | 69 | 220 |
| Geometric mean ± SD | 1.27 ± 1.54 | 1.28 ± 1.50 | 1.26 ± 1.53 | 1.11 ± 1.37 | 1.39 ± 1.72 | 1.16 ± 1.37 |
| Range | 0.42 – 4.74 | 0.31 – 5.03 | 0.40 – 5.61 | 0.44 – 1.77 | 0.38 – 3.74 | 0.50 – 2.61 |
| Number of statistically significant RRSB >1 | 47 | 41 | 43 | 0 | 9 | 30 |
| Metformin adjusted RRSB estimates | ||||||
| Number of precipitants examined | 181 | 187 | 191 | 38 | 67 | N/A |
| Geometric mean ± SD | 1.07 ± 1.83 | 1.06 ± 1.86 | 1.03 ± 1.87 | 1.09 ± 1.87 | 1.41 ± 2.33 | |
| Range | 0.2 – 5.53 | 0.15 – 6.75 | 0.22 – 5.57 | 0.28 – 3.39 | 0.24 – 15.62 | |
| Number of statistically significant RRSB >1 | 16 | 18 | 17 | 0 | 10 | |
Include patients who filled prescriptions for the study secretagogues or metformin earlier than 30 days prior to events and had active prescription during the 30 days according to day’s supply.
Other antidiabetics included thiazolidinediones, sulfonylureas other than glyburide, glipizide and glimepiride, glucagon-like peptide-1 agonists, dipeptidyl peptidase-4 inhibitor, alpha-glucosidase inhibitors, sodium/glucose cotransporter 2 inhibitors, and amylin analogs.
In the primary analysis that examined the overall rate of serious hypoglycemia during the entire observation time, we identified 140 secretagogue–precipitant pairs associated with increase rates of serious hypoglycemia when used concomitantly. The secondary analysis examined whether the rate of serious hypoglycemia peaked shortly after initiating concomitant therapy and declined thereafter, as one would expect from a pharmacokinetic drug–drug interaction. RRSB and 95% CIs specific to the four predefined risk periods were estimated. The results of these analyses are shown in eFigure 1 and eTable 3.
An increased RRSB could be due to true a drug–drug interaction between the secretagogue and the precipitant, to an inherent effect of the precipitant, or to the clinical indication for the precipitant (i.e., the condition for which the precipitant was prescribed). Metformin is rarely expected to interact pharmacokinetically with the precipitants. Even when it does, the drug–drug interaction is not expected to increase the risk of serious hypoglycemia since metformin is rarely associated with serious hypoglycemia. We therefore used the results of metformin to explicitly adjust for the results of the secretagogue for the same precipitant. After the adjustment, 61 secretagogue–precipitant pairs remained to be associated with increased overall rates of serious hypoglycemia (Figure, eTable 4).
Figure.
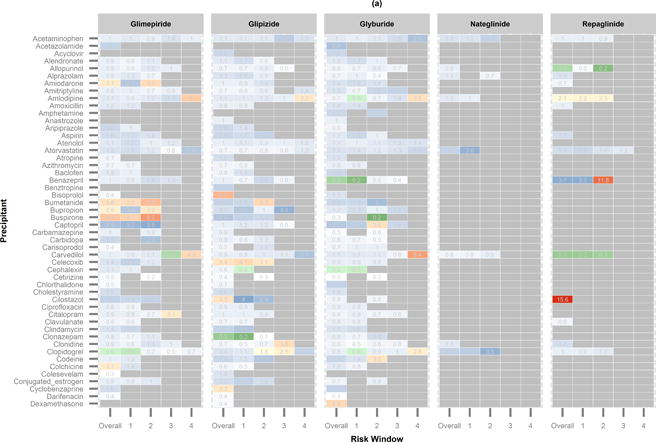
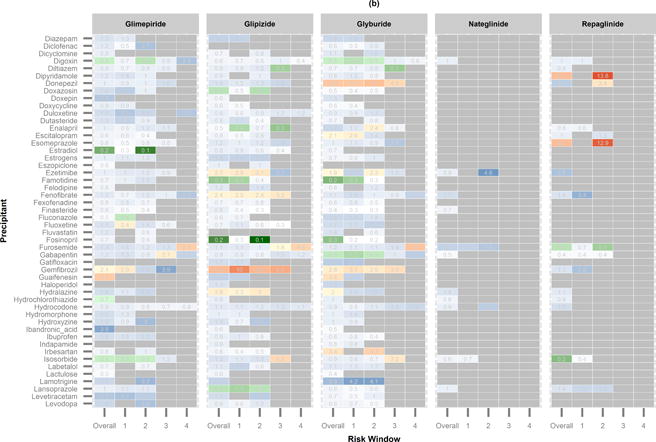

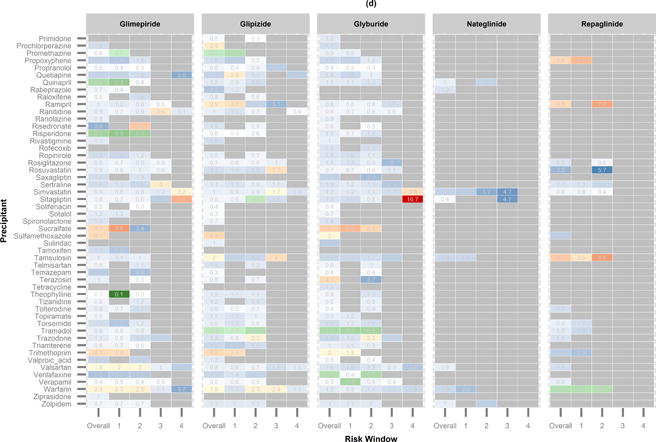
Heatmap showing semi-Bayes and metformin adjusted rate ratios (RRSBM). Precipitants are shown alphabetically. (a) RRSBM of precipitants from acetaminophen to dexamethasone. (b) RRSBM of precipitants from diazepam to levodopa. (c) RRSBM of precipitants from levofloxacin to pregabalin. (d) RRSBM of precipitants from primidone to zolpidem.
RRSBM and 95% CI greater than 1:

RRSBM and 95% CI less than 1:

RRSBM and 95% CI spanning 1:

Pharmacokinetic prediction
The pharmacokinetic parameter values essential for the prediction were ascertained for 156 precipitants. An area under concentration–time curve was predicted for each drug pair consisting of a study secretagogue and one of the 156 precipitants, resulting in 780 predicted areas under the curve collectively. Consistent with the FDA’s guideline for drug–drug interaction studies,13 25 drug pairs that had 1.25 ≤ AUCR <2 were considered as weak interactions, and 9 drug pairs that had 2 ≤ AUCR <5 were considered as moderate interactions (Table 2). The areas under the curve of the remaining 746 drug pairs were considered negligible (eTable 3). Results from the sensitivity analyses using alternative pharmacokinetic parameter values were similar to the findings from the original prediction (eFigure 2).
Table 2.
Predicted area under concentration–time curve ratios (AUCRs) of secretagogue–precipitant pairs considered as weak and moderate drug–drug interactions.
| Precipitant | Glipizide | Glyburide | Glimepiride | Repaglinide | Nateglinide |
|---|---|---|---|---|---|
| Atazanavir | 1.28 | 1.29 | |||
| Cefuroxime | 1.47 | ||||
| Chlorzoxazone | 1.37 | 1.39 | 1.27 | ||
| Clonidine | 1.95 | 2 | 1.34 | ||
| Clotrimazole | 2.35 | 3.52 | 1.55 | ||
| Dapsone | 1.40 | 1.43 | |||
| Diflunisal | 3.01 | 3.32 | 1.74 | ||
| Fluconazole | 2.21 | 2.35 | 2.34 | 1.55 | 2.12 |
| Gemfibrozil | 1.44 | 1.47 | 1.25 | ||
| Ketoconazole | 1.28 | 1.30 | |||
| Phenytoin | 1.59 | 1.64 | 1.31 | ||
| Quinine | 1.40 | ||||
| Ritonavir | 1.70 | 1.95 | 1.34 |
Drug pairs with 2 ≤ AUCR < 5 (in bold) were considered as moderate drug–drug interactions, those with 1.25 ≤ AUCR <2 were considered as weak.
Correlation between area under concentration–time curve and RRSB
Areas under the concentration–time curve and overall RRSB were independently/estimated for only 352 and 322 out of 2000 secretagogue-precipitant pairs before and after adjustment for metformin, respectively. The areas under the curve and overall RRSB, both adjusting and not adjusting for metformin, were poorly correlated (eTable 5, eTable 6). In addition, the correlation between AUCR and overall RRSB did not decline over time as expected from pharmacokinetic drug–drug interactions.
Discussion
In this study, we attempted to apply a translational approach in screening for clinically important drug–drug interactions with five most commonly used insulin secretagogues. The pharmacoepidemiologic component of this approach identified 140 and 61 secretagogue–precipitant pairs associated with increased overall rates of serious hypoglycemia before and after adjustment with metformin. The pharmacokinetic component predicted 34 drug–drug interactions with the secretagogues based on the existing pharmacologic knowledge. We found that the results from the two components were poorly correlated, such that the supplement of pharmacokinetic prediction did not appear to notably improve signal detection of drug–drug interactions in pharmacoepidemiologic screening in this example.
We were able to replicate the previous findings that the concomitant use of sulfonylureas and cotrimoxazole or gemfibrozil was associated with an increased risk of serious hypoglycemia24,27. The ability to identify known associations demonstrates the robustness of the self-controlled case series design in screening for drug–drug interactions. To our knowledge, this is the first study that adapts this design to screen for drug–drug interactions. Compared to the previous studies that identified interaction signals from spontaneous adverse drug event reports, our study avoids the biases stemming from the use of anecdotal case reports.14,15 The pharmacoepidemiologic screening of our study has a few advantages over the drug–drug interaction screening performed by Han et al.17 that used a cohort design and an electronic healthcare records (EHR) database. First, our screening was more computationally efficient as the self-controlled case series design includes only cases. Second, our study was more efficient in confounding control since the this design inherently adjusts for factors that remain constant within individuals. Lastly, we used an administrative claims database that usually contains more complete recording of patients’ healthcare and enables more accurate exposure measurement as compared to EHR databases.
An important strength of our pharmacoepidemiologic screening was the adjustment using metformin as an explicit negative control object drug. Before the adjustment, macrolides, and quinolones, such as clarithromycin, azithromycin, ciprofloxacin, levofloxacin, and ofloxacin, showed consistently increased rates of serious hypoglycemia across all the object drugs including metformin. It is very unlikely that these precipitants interact with all the secretagogues, since the secretagogues differ in their hepatic metabolism profiles. The associations seem more likely due to infection, confounding by indication, and/or the inherent hypoglycemic effects of the precipitants. In fact, quinolones are known to cause dysglycemia.37,38 The adjustment using the metformin results largely removed these seemingly spurious associations, suggesting that it is an effective means to reduce false positive signals. Of note, the adjustment also had unintended effects. Because it could only be applied to precipitants for which an RRSB was estimated both with the secretagogues and metformin, the total number of RRSB estimates was reduced after the metformin adjustment. In addition, in few cases, the adjustment inflated the RRSB for secretagogue–precipitant pairs when the corresponding metformin–precipitant pair was associated with a decreased risk of serious hypoglycemia. An example was levothyroxine and sulfonylureas that changed from having no association to being positively associated with serious hypoglycemia with the metformin adjustment.
A limitation of the self-controlled case series design is that it is potentially subject to reverse causality bias39, especially for previous known drug–drug interactions. If a precipitant is known to interact with a secretagogue, it may be used less frequently or discontinued after a hypoglycemic event. The RR would then bias away from the null and overestimate the true rate of hypoglycemia of the precipitant. However, considering drug–drug interactions are often overlooked in clinical practice, we doubt that a large proportion of prescribers would attribute an episode of serious hypoglycemia to an interaction and as a result discontinue the precipitant to reduce risk in the future. Reverse causality bias therefore seems to us unlikely to be largely responsible for associations with known drug–drug interactions.
We were surprised to find that the predicted areas under concentration–time curves were poorly correlated with the overall RRSB estimates, considering that inhibition of cytochrome P450s is thought to be the most common mechanism underlying known, clinically important drug–drug interactions11. There are at least five potential explanations for the poor correlation. First, a pharmacokinetic drug–drug interaction can result from multiple mechanisms. The model used in the pharmacokinetic prediction was oversimplified as it ignored factors other than competitive inhibition of P450-mediated hepatic metabolism. Compared to sophisticated physiological-based pharmacokinetic models that require customization for each drug pair, the model used in our study is more readily applied to a large number of drug pairs, but is known to be less accurate40. In fact, this compromise represents a major methodologic challenge in our study, which is maximizing the throughput by simplifying analyses while maintaining validity.
Second, we did not adjust for time-varying factors that could affect hypoglycemia risk in the analysis of the self-controlled case series design, which was a similar trade-off between accuracy and efficiency. Such adjustment was not feasible since we were analyzing thousands of drug pairs at once. Drugs that are often used together with a precipitant may bias the RRs away from or toward the null if they cause hypoglycemia or hyperglycemia, respectively. Other time-varying factors potentially of concern include dose changes, age, disease progression, renal and hepatic function. Although the use of metformin as a control mitigated the effects of these sources of potential bias, the estimation of RRSB may have been affected.
Third, the model for area under the concentration–time curve prediction ignores concentration–time relationship and only predicts the average magnitude of change in the systemic exposure to a secretagogue. It is therefore unable to predict the highest concentration of a secretagogue in the liver resulting from a drug interaction, which may be more relevant to inducing hypoglycemia.
Fourth, drug–drug interactions may also occur at pharmacodynamic level that potentially can be identified through pharmacoepidemiologic screening but cannot be predicted using area under the concentration–time curve.
Fifth, area under the concentration–time curve and RRSB were both estimated only for a subset of precipitants that may not fully represent the correlation between the two metrics. Many precipitants associated with an increased risk of hypoglycemia lacked in vitro data on their potential for inhibiting the relevant cytochrome P450 enzymes, which precludes area under the concentratin–time curve prediction. Atazanavir, ritonavir and ketoconazole were predicted to interact with the secretagogues. These drugs, however, did not have enough number of events for estimating RRSB, presumably because they were not used, or only used for a short period of time, concomitantly with the secretagogues.
There are several other limitations in our study. They include small numbers of cases and events that hampered our ability to examine drug–drug interactions with meglitinides, lack of pharmacy claims data for over-the-counter drugs, lack of analysis on dose-response relationship, lack of data on adherence to prescribed secretagogues and precipitants, and residual confounding inherent to observational studies. Such limitations are likely to affect other applications of these methods to healthcare databases.
Although in this application pharmacokinetic prediction did not corroborate pharmacoepidemiologic screening, it is important to note that we cannot tell from this single example whether or not the approach of coupling the two methods would work in general. In addition, since we do not know the true interaction status for very many, if any, secretagogue-precipitant pairs, we cannot quantitatively evaluate the performance of either component, or use one to evaluate against the other. Further studies are warranted to improve both components thus to improve the overall performance of the approach. For pharmacoepidemiologic screening, future studies are needed to explore adjusting for time-varying factors in the self-controlled case series analysis for a large number of drug pairs. For pharmacokinetic prediction, a framework that allows for high-throughput drug–drug interaction prediction with improved accuracy will be highly desirable.
Pharmacokinetic prediction can be applied to any drug pairs whose relevant pharmacological information is available. The self-controlled case series design is well-suited to study acute effects of drug exposures.39 We believe that the design is widely applicable to screen for drug–drug interactions associated with any acute adverse health outcomes identifiable in longitudinal healthcare databases. In theory, the combination of two methods can enable a systematic identification of drug–drug interactions, both pharmacokinetic and pharmacodynamic, that lead to acute adverse health outcomes. Although EHRs have been increasingly used for data mining, we believe that they are less desirable in screening for drug–drug interactions as compared to healthcare claims databases. One reason is that EHRs may not be complete for the data from other physicians or sites of care. Also, EHRs record only prescription orders, which may lead to less accurate ascertainment of drug exposure than claims databases that record prescription dispensations.
Hypoglycemia induced by antidiabetic agents is a major clinical and public health concern. Drug–drug interactions causing hypoglycemia are among the main limiting factors in the glycemic management of diabetes. The ultimate goal of research on these interactions is to prevent them from harming patients. Our study helps to achieve this goal by identifying a number of drugs that appear to be associated with increased risk of serious hypoglycemia during concomitant use with the secretagogues. Future studies are needed to confirm or refute these potential associations, to identify high-risk subgroups, and to elucidate the mechanisms underlying true drug–drug interactions involving the secretagogues. Although combining pharmacoepidemiologic screening with pharmacokinetic prediction did not notably improve screening for drug–drug interactions in this study, we believe that upon improvement this translational approach could be useful in systematical identification of drug–drug interactions with both mechanistic understanding and clinical effects.
Supplementary Material
Acknowledgments
The authors wish to thank Ms. Min Du (University of Pennsylvania), and Ms. Liu Qing (University of Pennsylvania) for their statistical programming support; Dr. Timothy L. Lash (Emory University) for his suggestion to use semi-Bayes adjustment; Dr. David A. Flockhart (Indiana University), Dr. Darrell R. Abernethy (the US FDA), Dr. Malcolm Maclure (University of British Columbia), and Dr. James Flory (Cornell University) for their clinical and methodologic input.
Sources of financial support: This project was supported by R01AG025152 from the National Institute on Aging, R01DK102694 from the National Institute of Diabetes and Digestive and Kidney Diseases, GM10448301 from the National Institute of General Medical Science, and LM011945 from the U.S. National Library of Science.
Footnotes
Conflicts of interest: The authors declare that they have no competing interests.
Availability of data and programming code: The programming code can be found in eAppendix. No additional data are available because sharing the databases is prohibited according to the agreements with the data distributors.
References
- 1.Hampp C, Borders-Hemphill V, Moeny DG, Wysowski DK. Use of antidiabetic drugs in the U.S., 2003–2012. Diabetes care. 2014;37(5):1367–1374. doi: 10.2337/dc13-2289. [DOI] [PubMed] [Google Scholar]
- 2.Bonds DE, Miller ME, Bergenstal RM, et al. The association between symptomatic, severe hypoglycaemia and mortality in type 2 diabetes: retrospective epidemiological analysis of the ACCORD study. BMJ. 2010;340:b4909. doi: 10.1136/bmj.b4909. [DOI] [PMC free article] [PubMed] [Google Scholar]
- 3.Cryer PE. Mechanisms of hypoglycemia-associated autonomic failure in diabetes. The New England journal of medicine. 2013;369(4):362–372. doi: 10.1056/NEJMra1215228. [DOI] [PubMed] [Google Scholar]
- 4.Desouza C, Salazar H, Cheong B, Murgo J, Fonseca V. Association of hypoglycemia and cardiac ischemia: a study based on continuous monitoring. Diabetes care. 2003;26(5):1485–1489. doi: 10.2337/diacare.26.5.1485. [DOI] [PubMed] [Google Scholar]
- 5.Miller CD, Phillips LS, Ziemer DC, Gallina DL, Cook CB, El-Kebbi IM. Hypoglycemia in patients with type 2 diabetes mellitus. Archives of internal medicine. 2001;161(13):1653–1659. doi: 10.1001/archinte.161.13.1653. [DOI] [PubMed] [Google Scholar]
- 6.van Staa T, Abenhaim L, Monette J. Rates of hypoglycemia in users of sulfonylureas. Journal of clinical epidemiology. 1997;50(6):735–741. doi: 10.1016/s0895-4356(97)00024-3. [DOI] [PubMed] [Google Scholar]
- 7.Leonard CE, Bilker WB, Brensinger CM, et al. Severe hypoglycemia in users of sulfonylurea antidiabetic agents and antihyperlipidemics. Clin Pharmacol Ther. 2015 doi: 10.1002/cpt.297. [DOI] [PMC free article] [PubMed] [Google Scholar]
- 8.Bennett WL, Wilson LM, Bolen S, et al. Oral Diabetes Medications for Adults With Type 2 Diabetes: An Update. Rockville (MD): 2011. Oral Diabetes Medications for Adults With Type 2 Diabetes: An Update. [Google Scholar]
- 9.Optum I. Cinformatics Data Mart. 2014 https://www.optum.com/content/dam/optum/resources/productSheets/Clinformatics_for_Data_Mart.pdf.
- 10.Juurlink DN, Mamdani M, Kopp A, Laupacis A, Redelmeier DA. Drug-drug interactions among elderly patients hospitalized for drug toxicity. JAMA : the journal of the American Medical Association. 2003;289(13):1652–1658. doi: 10.1001/jama.289.13.1652. [DOI] [PubMed] [Google Scholar]
- 11.Strandell J, Wahlin S. Pharmacodynamic and pharmacokinetic drug interactions reported to VigiBase, the WHO global individual case safety report database. European journal of clinical pharmacology. 2011;67(6):633–641. doi: 10.1007/s00228-010-0979-y. [DOI] [PubMed] [Google Scholar]
- 12.Hennessy S, Flockhart DA. The need for translational research on drug-drug interactions. Clin Pharmacol Ther. 2012;91(5):771–773. doi: 10.1038/clpt.2012.39. [DOI] [PMC free article] [PubMed] [Google Scholar]
- 13.FDA. Guidance for Industry: Drug Interaction Studies —Study Design, Data Analysis, Implications for Dosing, and Labeling Recommendations. 2012 [Google Scholar]
- 14.Noren GN, Sundberg R, Bate A, Edwards IR. A statistical methodology for drug-drug interaction surveillance. Statistics in medicine. 2008;27(16):3057–3070. doi: 10.1002/sim.3247. [DOI] [PubMed] [Google Scholar]
- 15.Tatonetti NP, Ye PP, Daneshjou R, Altman RB. Data-driven prediction of drug effects and interactions. Science translational medicine. 2012;4(125):125ra131. doi: 10.1126/scitranslmed.3003377. [DOI] [PMC free article] [PubMed] [Google Scholar]
- 16.Bate A, Evans SJ. Quantitative signal detection using spontaneous ADE reporting. Pharmacoepidemiology and drug safety. 2009;18(6):427–436. doi: 10.1002/pds.1742. [DOI] [PubMed] [Google Scholar]
- 17.Han X, Quinney SK, Wang Z, et al. Identification and Mechanistic Investigation of Drug-Drug Interactions Associated With Myopathy: A Translational Approach. Clin Pharmacol Ther. 2015;98(3):321–327. doi: 10.1002/cpt.150. [DOI] [PMC free article] [PubMed] [Google Scholar]
- 18.Ryan PB, Madigan D, Stang PE, Overhage JM, Racoosin JA, Hartzema AG. Empirical assessment of methods for risk identification in healthcare data: results from the experiments of the Observational Medical Outcomes Partnership. Statistics in medicine. 2012;31(30):4401–4415. doi: 10.1002/sim.5620. [DOI] [PubMed] [Google Scholar]
- 19.Whitaker HJ, Farrington CP, Spiessens B, Musonda P. Tutorial in biostatistics: the self-controlled case series method. Statistics in medicine. 2006;25(10):1768–1797. doi: 10.1002/sim.2302. [DOI] [PubMed] [Google Scholar]
- 20.Hennessy S, Leonard CE, Gagne JJ, et al. Pharmacoepidemiologic Methods for Studying the Health Effects of Drug-Drug Interactions (DDIs) Clin Pharmacol Ther. 2015 doi: 10.1002/cpt.277. [DOI] [PMC free article] [PubMed] [Google Scholar]
- 21.United Kingdom Prospective Diabetes Study (UKPDS) 13: Relative efficacy of randomly allocated diet, sulphonylurea, insulin, or metformin in patients with newly diagnosed non-insulin dependent diabetes followed for three years. BMJ. 1995;310(6972):83–88. [PMC free article] [PubMed] [Google Scholar]
- 22.Scheen AJ. Clinical pharmacokinetics of metformin. Clinical pharmacokinetics. 1996;30(5):359–371. doi: 10.2165/00003088-199630050-00003. [DOI] [PubMed] [Google Scholar]
- 23.Leonard CE, Bilker WB, Brensinger CM, et al. Severe hypoglycemia in users of sulfonylurea antidiabetic agents and antihyperlipidemics. Clin Pharmacol Ther. 2016;99(5):538–547. doi: 10.1002/cpt.297. [DOI] [PMC free article] [PubMed] [Google Scholar]
- 24.Schelleman H, Han X, Brensinger CM, et al. Pharmacoepidemiologic and in vitro evaluation of potential drug-drug interactions of sulfonylureas with fibrates and statins. British journal of clinical pharmacology. 2014;78(3):639–648. doi: 10.1111/bcp.12353. [DOI] [PMC free article] [PubMed] [Google Scholar]
- 25.Leonard C, Han X, Bilker WB, et al. Concomitant thiazolidinedione and fibrate use increased the risk of severe hypoglycemia: a propensity score-adjusted cohort study. Journal of clinical epidemiology. 2015 (In press) [Google Scholar]
- 26.Ginde AA, Blanc PG, Lieberman RM, Camargo CA., Jr Validation of ICD-9-CM coding algorithm for improved identification of hypoglycemia visits. BMC Endocr Disord. 2008;8:4. doi: 10.1186/1472-6823-8-4. [DOI] [PMC free article] [PubMed] [Google Scholar]
- 27.Schelleman H, Bilker WB, Brensinger CM, Wan F, Hennessy S. Anti-infectives and the risk of severe hypoglycemia in users of glipizide or glyburide. Clin Pharmacol Ther. 2010;88(2):214–222. doi: 10.1038/clpt.2010.74. [DOI] [PMC free article] [PubMed] [Google Scholar]
- 28.Douketis JD, Melo M, Bell CM, Mamdani MM. Does statin therapy decrease the risk for bleeding in patients who are receiving warfarin? Am J Med. 2007;120(4):369 e369–369 e314. doi: 10.1016/j.amjmed.2006.06.008. [DOI] [PubMed] [Google Scholar]
- 29.Bart Spiessens HW. Using SAS for the self-controlled case series method. http://statistics.open.ac.uk/sccs/sas.htm.
- 30.Greenland S, Poole C. Empirical-Bayes and semi-Bayes approaches to occupational and environmental hazard surveillance. Arch Environ Health. 1994;49(1):9–16. doi: 10.1080/00039896.1994.9934409. [DOI] [PubMed] [Google Scholar]
- 31.Steenland K, Bray I, Greenland S, Boffetta P. Empirical Bayes adjustments for multiple results in hypothesis-generating or surveillance studies. Cancer epidemiology, biomarkers & prevention : a publication of the American Association for Cancer Research, cosponsored by the American Society of Preventive Oncology. 2000;9(9):895–903. [PubMed] [Google Scholar]
- 32.Bieler GS, Williams RL. Ratio Estimates, the Delta Method, and Quantal Response Tests for Increased Carcinogenicity. Biometrics. 1993;49(3):793–801. [PubMed] [Google Scholar]
- 33.Lu C, Miwa GT, Prakash SR, Gan LS, Balani SK. A novel model for the prediction of drug-drug interactions in humans based on in vitro cytochrome p450 phenotypic data. Drug Metab Dispos. 2007;35(1):79–85. doi: 10.1124/dmd.106.011346. [DOI] [PubMed] [Google Scholar]
- 34.Guest EJ, Rowland-Yeo K, Rostami-Hodjegan A, Tucker GT, Houston JB, Galetin A. Assessment of algorithms for predicting drug-drug interactions via inhibition mechanisms: comparison of dynamic and static models. British journal of clinical pharmacology. 2011;71(1):72–87. doi: 10.1111/j.1365-2125.2010.03799.x. [DOI] [PMC free article] [PubMed] [Google Scholar]
- 35.Law V, Knox C, Djoumbou Y, et al. DrugBank 4.0: shedding new light on drug metabolism. Nucleic acids research. 2014;42:D1091–1097. doi: 10.1093/nar/gkt1068. (Database issue) [DOI] [PMC free article] [PubMed] [Google Scholar]
- 36.Ginde AA, Espinola JA, Camargo CA., Jr Trends and disparities in U.S. emergency department visits for hypoglycemia, 1993–2005. Diabetes care. 2008;31(3):511–513. doi: 10.2337/dc07-1790. [DOI] [PubMed] [Google Scholar]
- 37.Aspinall SL, Good CB, Jiang R, McCarren M, Dong D, Cunningham FE. Severe dysglycemia with the fluoroquinolones: a class effect? Clin Infect Dis. 2009;49(3):402–408. doi: 10.1086/600294. [DOI] [PubMed] [Google Scholar]
- 38.Mohr JF, McKinnon PS, Peymann PJ, Kenton I, Septimus E, Okhuysen PC. A retrospective, comparative evaluation of dysglycemias in hospitalized patients receiving gatifloxacin, levofloxacin, ciprofloxacin, or ceftriaxone. Pharmacotherapy. 2005;25(10):1303–1309. doi: 10.1592/phco.2005.25.10.1303. [DOI] [PubMed] [Google Scholar]
- 39.Maclure M, Fireman B, Nelson JC, et al. When should case-only designs be used for safety monitoring of medical products? Pharmacoepidemiology and drug safety. 2012;21(Suppl 1):50–61. doi: 10.1002/pds.2330. [DOI] [PubMed] [Google Scholar]
- 40.Einolf HJ. Comparison of different approaches to predict metabolic drug-drug interactions. Xenobiotica; the fate of foreign compounds in biological systems. 2007;37(10–11):1257–1294. doi: 10.1080/00498250701620700. [DOI] [PubMed] [Google Scholar]
Associated Data
This section collects any data citations, data availability statements, or supplementary materials included in this article.