

Abstract
Cicer reticulatum L. is the wild progenitor of the fourth most important legume crop chickpea (C. arietinum L.). We assembled short-read sequences into 416 Mb draft genome of C. reticulatum and anchored 78% (327 Mb) of this assembly to eight linkage groups. Genome annotation predicted 25,680 protein-coding genes covering more than 90% of predicted gene space. The genome assembly shared a substantial synteny and conservation of gene orders with the genome of the model legume Medicago truncatula. Resistance gene homologs of wild and domesticated chickpeas showed high sequence homology and conserved synteny. Comparison of gene sequences and nucleotide diversity using 66 wild and domesticated chickpea accessions suggested that the desi type chickpea was genetically closer to the wild species than the kabuli type. Comparative analyses predicted gene flow between the wild and the cultivated species during domestication. Molecular diversity and population genetic structure determination using 15,096 genome-wide single nucleotide polymorphisms revealed an admixed domestication pattern among cultivated (desi and kabuli) and wild chickpea accessions belonging to three population groups reflecting significant influence of parentage or geographical origin for their cultivar-specific population classification. The assembly and the polymorphic sequence resources presented here would facilitate the study of chickpea domestication and targeted use of wild Cicer germplasms for agronomic trait improvement in chickpea.
Keywords: Cicer reticulatum L. PI489777, wild chickpea, genome sequence, annotation, diversity
1. Introduction
Chickpea (Cicer arietinum L.) is the only cultivated species in the genus Cicer. This is the fourth important legume crop after soybean (Glycine max), common bean (Phaseolus vulgaris) and common pea (Pisum sativum). According to the seed morphology, chickpea is of two types; desi type with small dark brown seeds and kabuli with bold pale brown seeds. Recently, draft genome assemblies of both the chickpea types have been reported.1–3 Chickpea was domesticated with wheat, barley, peas and lentil as a member of West Asian Neolithic crops during the origin of agriculture around 10,000 years ago with the oldest archaeological evidence from 7500 B.C.4,5 The annual species C. reticulatum L. is considered to be the wild progenitor of the cultivated chickpea and both the species are interfertile, suggesting the wild as the primary gene pool of the cultigen. C. echinospermum D. is considered as the secondary gene pool and is crossable with both the wild progenitor and the cultivated chickpea, but shows a strong barrier to genic flux and the hybrids tend to be sterile. The other annual Cicer species may form the tertiary gene pool.6 In contrast to the wild progenitors of other Neolithic crops, C. reticulatum shows a narrow eco-geographic distribution indicating its limited adaptive variation, which caused the first bottleneck of genetic base of cultivated chickpea.4 Domestication of many crops occurred with a limited number of founding genotypes followed by subsequent selection. Selection of phenotypes included loss of dormancy, reduced pod dehiscence, larger plant and seed size with more erect habit (Fig. 1). However, the key feature of chickpea domestication was the change in the cropping season. While most of the crops with West Asian origin are autumn-sown, chickpea was transformed from an autumn-sown crop to a spring-sown crop to avoid Ascochyta blight caused by the fungus Ascochyta rabiei.7 This change in cropping season resulted in the separation of the reproductive phases of the cultivated species and the wild progenitor and caused another bottleneck in the genetic base. The major genetic difference that was selected for the change in cropping season was the loss of response to vernalization in the cultivated species.8
Figure 1.
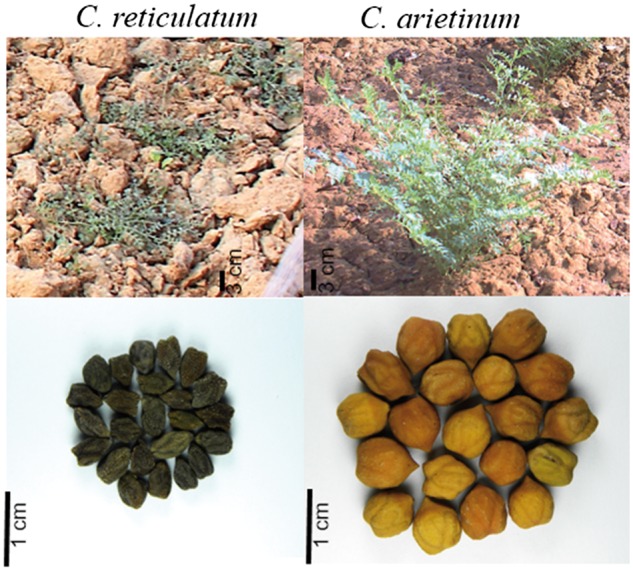
Images of field-grown wild (C. reticulatum L.) (left) and cultivated (C. arietinum L.) chickpea (right) plants and seeds. The colour version of the figure is available online.
Domestication process of most of the crops focused on improved yield, product size and organoleptic quality, however, tolerance to abiotic stresses and pathogen infection were compromised in this process. Naturally occurring resistant alleles in the wild relatives of the cultivated crops are an underexploited resource for plant breeding and can be introgressed into the elite cultivated genotypes to improve agricultural performance.9 Wild relatives are the vital source of higher natural allelic diversity, particularly for the improvement of cultivated crops with narrow genetic bases. They are also important for construction of high-density inter-specific genetic linkage maps and mapping of genes/QTLs (quantitative trait loci) governing agronomically important traits because of higher genomic polymorphism. Previously, genomes of the wild progenitors of some cultivated legume crops have been sequenced to decipher the genetic constitution of coding and non-coding components of their genomes and the process of domestication.10,11 An interspecies mapping population, generated by crossing a chickpea cultivar ICC4958 and its wild progenitor C. reticulatum PI489777, is being widely used as a reference to construct high-resolution genetic linkage maps for identification and mapping of genes/QTLs especially controlling important abiotic/biotic stress tolerance and domestication traits.12–15 Here, we report a draft genome assembly of the wild progenitor of cultivated chickpea C. reticulatum L. PI489777. Comparative analysis of wild and cultivated chickpea genome assemblies and the genomic resources would accelerate the understanding of molecular basis of selection during the domestication process and genetic enhancement of chickpea.
2. Materials and methods
2.1. Sequencing and assembly
Cicer reticulatum L. (accession PI489777) plants were grown in the plant growth chamber under controlled condition for 4 weeks before harvesting the fresh leaves for isolating genomic DNA using DNeasy Plant Maxi Kit (Qiagen, Cat no. 68163, Hilden, Germany) following manufacturer’s protocol. The sequence data was generated by Illumina HiSeq1000 platform (Illumina, San Diego, CA). Two individual whole genome shotgun (WGS) libraries with average insert size 180 base pair (bp), one WGS library with average insert size 500 bp and one mate-pair (MP) library each of 3,000 and 10,000 bp average insert sizes were prepared and sequenced in 100 baseX2 paired-end (PE) format following manufacturer’s protocol for the assembly. The raw sequence reads were filtered using NGS toolkit with default parameter for obtaining high-quality reads.16 Filtered reads were assembled by three tools namely, SOAPdenovo2, MaSuRCA and ALLPATHS-LG using a 512 GB RAM and 48 core server.17–19 Finally, the best assembly with ALLPATHS-LG version SL 2.0 with ploidy 2 and default parameters was used for analysis. The minimum scaffold size was kept as 1 kb. Scaffolds were ordered in the linkage groups following the marker sequences of a linkage map constructed using a bi-parental RIL (recombinant inbred line) mapping population (C. arietinum acc. ICC 4958 x C. reticulatum acc. PI 489777).20 The gaps of unknown sizes were joined with 100 N as per National Centre for Biotechnology Information (NCBI) guideline. Transcriptome coverage in the genome assembly was verified using BLAT.21 The assembly was submitted to NCBI under the Bioproject PRJNA263699. The sequence reads were submitted to the short read archive (SRA) of NCBI under the IDs SRR160365, SRR1640444, SRR1640451 and SRR1640455. Reference-based genome assemblies were generated by mapping the C. reticulatum WGS reads on ICC4958 (desi) and CDC Frontier (kabuli) genome assemblies using bwa mapping tool with default parameter and producing consensus sequence.1,3,22
2.2. Gene annotation
Gene annotation was performed following the pipeline described previously. Briefly, repeat sequences were identified and masked by the software packages REPEATMODELLER, PILER, REPEATSCOUT, LTR_FINDER REPEATMASKER (http://repeatmasker.org) and REPEATPROTEIN MASK.23–26 Repeat-masked assembly was used for annotating protein-coding genes by ab initio, homology-based and EST-based approaches. Augustus and GENESCAN tools trained with Arabidopsis data were used for ab initio prediction. EXONERATE (http://www.ebi.ac.uk/∼guy/exonerate/) and PASA27 tools were used for the homology-based and EST-based annotations, respectively, using predicted proteome sequences of desi and kabuli chickpeas1,2 and assembled transcriptome of C. reticulatum.28 Outputs from these three approaches were integrated by EVIDENCEMODELLER (EVM)29 to generate consensus gene sets and the EVM output was run through PASA for prediction of spliced variants and various elements like untranslated regions. Filtering parameters of minimum coding sequence (CDS) of 150 base pairs (bp) and low N-content (<10%) were applied to arrive at the final predicted gene set. To resolve annotation differences between the orthologous gene pairs of wild and cultivated chickpeas during comparative analysis, corresponding gene sequences of both the genotypes were re-annotated using Augustus only for a better comparison. Gene annotation of the reference-based assembly was done by following the annotation files of the corresponding assemblies.
For functional annotation, the predicted protein sequences were searched with various databases such as, ntdb of NCBI, TrEMBL, UniRef100, SwissProt, TAIR and KEGG with cut off E value 1e−5. Resistance gene homologues (RGH) were identified following a previously described method.3 Briefly, Hidden Markov Model (HMM) profiles were created for different R gene families using sequences present in the plant resistance gene database. These HMM profiles were used to identify the primary RGH set. These sequences were further screened for the presence of specific RGH-protein domains using InterPro scan and a search in the NCBI conserved domain database.
2.3. Mining of single nucleotide polymorphisms and insertion/deletions
Sequence reads were filtered with NGS tool kit.16 Filtered reads were mapped on the reference sequences using bwa mapping tool. Only uniquely mapped reads were considered for further analysis. The sam files were converted to bam files using samtools, and then to vcf format to identify single nucleotide polymorphisms (SNPs) and insertion/deletions (InDels). High quality SNPs were identified using only unique non-reference alleles supported by five or more reads (in case of C. reticulatum WGS reads) and/or three or more reads (in case of restriction-associated genotyping-by-sequencing reads). SNPs on pseudomolecules of eight linkage groups were plotted and visualized by Circos.30 Reference-based genome assemblies, reference-based gene annotation and the vcf files of the SNPs/InDels are curated at the website nipgr.res.in/WCGAP/.
2.4. Pair-wise comparison of genomes and genes
Gene cluster analysis was performed by all-against-all BLASTP search of the proteomes of all the concerned plants followed by orthoMCL.31 Pair-wise sequence comparison between the pseudomolecules of wild and cultivated chickpea was performed using default parameters of SyMap v4.0.32 The whole genome dot plot with eight linkage groups of wild and desi chickpeas was generated by selecting hits with >90% identity. Inter-species gene order colinearity was detected by MCScanX33 with default parameter considering BLASTP ≤1e−5. Orthologous genes between the wild and cultivated chickpea were identified by BLASTP. Links of collinear gene blocks between the pseudomolecules of two species were shown by dual synteny or circle plot. Protein sequences of orthologous gene-pairs were aligned by ClustalW34. The output file and CDS sequences of the corresponding genes were used to determine synonymous substitution rate (Ks) by PAL2NAL and CODEML in PAML4.5.35,36 Species divergence was calculated using the equation T = Ks/2r. The value of r was taken as 6.1 × 10 − 9 per year.37
2.5. Diversity analysis
Stacks pipeline was used to build loci for restriction site associated DNA (RAD) sequence reads.38 The SNP-based genetic diversity and phylogenetic relationships among cultivated and wild chickpea accessions were determined using cladogram interface of TASSEL5.0 (http://www.maizegenetics.net/#!tassel/c17q9). For assessment of population structure among chickpea accessions, the SNP genotyping data were analyzed in STRUCTURE following the methods of Kujur et al.39 For determining nucleotide diversity in the intergenic regions, 2 kb up- and downstream regions of gene sequences according to direction of their annotation in the genome were considered. Significance analysis was performed by Wilcoxon rank sum test and paired t-test using R stats package (https://stat.ethz.ch/R-manual/R-devel/library/stats/html/00Index.html).
3. Results
3.1. Genome sequencing and assembly
We prepared 3 paired-end libraries; 2 with 180 bp and 1 with 500 bp insert sizes, along with 2 mate-pair (MP) libraries with 3 kb and 10 kb insert sizes and sequenced using Illumina HiSeq1000 platform to generate 100 × 2 bp short sequence reads. The filtered high quality 1,198,234,588 reads (∼119 Gb) (Supplementary Table S1) were used for de novo assembly using ALLPATHS-LG, SOAPdenovo2 and MaSuRCA. ALLPATHS-LG produced a better output in comparison to other assembly tools in terms of number and lengths of the scaffolds, generating total scaffold length of 416,562,993 bp at 49X estimated genome coverage (Supplementary Table S2). ALLPATHS-LG predicted an estimated genome size of 817.64 Mb at k-mer 25 and 63% of the genome was estimated to be repetitive, while distribution frequency of k-mer 17 by Jellyfish predicted an estimated genome size of 802.003 Mb (Supplementary Fig. S1)40. The assembly tool generated total 7,383 scaffolds with N50 and average sizes of 216.8 and 56.534 kb, respectively, from 35,261 contigs with N50 and minimum sizes of 23.2 and 1 kb, respectively (Supplementary Table S3). Seventeen small scaffolds showing significant similarity with bacterial genome sequences were removed by us and NCBI. Approximately 1,651 scaffolds were anchored to eight linkage groups (LGs) using marker sequences of a linkage map constructed using a RIL mapping population of C. arietinum ICC4958 X C. reticulatum PI48977718 to generate eight pseudomolecules of total 327.07 Mb (Supplementary Table S4) within the total assembly of 416,658,930 bp distributed in 5,723 fragments. N50 length of the whole assembly was 39.84 Mb and the largest assembled pseudomolecule was LG6 with 58.23 Mb in length (Supplementary Table S5). Out of 1,651 anchored scaffolds, 1,081 scaffolds (∼65%) covering 283.74 Mb (86.77% of total pseudomolecule length) were oriented. Less than 1,000 fragments contributed to more than 90% of the assembly (Supplementary Fig. S2). Approximately 74.64 and 48.33% reads of WGS and MP libraries, respectively, were mapped back and covered the whole genome assembly (Supplementary Table S6). Paired reads of the 3 and 10 kb MP libraries were mapped to the average distances of 2662 ± 496 bp and 9002 ± 1226 bp, respectively, as a validation of the assembly. Mapping of an earlier reported transcriptome assembly of C. reticulatum28 showed alignment of 90.74% (33,815 of 37,265 tentative contigs) assembled transcript on the genome assembly with ≥90% identity with ≥80% coverage. About 97% (1,136,248 of 1,171,453 reads) of high-quality transcriptome sequence reads could be mapped on the genome assembly. Core eukaryotic genes mapping approach (CEGMA)41 analysis was able to map 319 (∼70%) of total 458 core eukaryotic genes with full coverage and 426 (∼93%) genes with more than 90% coverage and E-value 1e−10. Both these data suggested that more than 90% of C. reticulatum gene space has been covered in the present genome assembly. For a better comparative analysis with the available chickpea genome assemblies,1,3 sequence reads of C. reticulatum were mapped on both the chickpea genome assemblies and two reference-based consensus genome assemblies of C. reticulatum were produced. The chickpea var. ICC4958 (desi) reference-based assembly was of 440,184,772 bp and the same for chickpea var. CDC Frontier (kabuli) was of 421,850,125 bp in lengths (Supplementary Table S7). Polymorphic simple sequence repeats (SSR) between the wild and two domesticated chickpea draft assemblies and the flanking sequences were listed (Supplementary Table S8) as a resource for developing genetic markers. Salient features of the assembly are mentioned in Table 1.
Table 1.
Assembly and annotation statistics of C. reticulatum genome
| Total span | 416,658,930 bp |
| No. Scaffolds | 5,723 |
| Max. Scaffold length | 58,232,078 bp |
| Min. Scaffold length | 1,000 bp |
| N50 length | 39,846,785 bp |
| N50 index | 5 |
| Number of annotated gene | 25,680 |
| Average gene length (bp) | 3,340.89 |
| Average coding sequence length (bp) | 1,192.195 |
| Functionally annotated gene | 25,075 |
| Genome assembly | |
| Based on ICC4958 | 440,184,772 bp |
| Genome assembly | |
| Based on CDC Frontier | 421,850,125 bp |
| %GC | 27.55 |
3.2. Genome annotation and comparative analysis of protein-coding genes
Using repeat-masked assembly, the protein-coding genes were predicted by three approaches (ab initio, homology-based and EST-based), followed by generating a high confidence non-redundant set of consensus genes by merging their results. A total of 25,680 non-redundant consensus genes spanning 85.786 Mb with a gene density of 6.1 genes per 100 kb was predicted. A sum of 666 genes was predicted to have average 2.08 transcript isoforms resulting in total 26,404 protein coding DNA sequences (CDS). Average gene length was 3.34 kb with 5.76 exons per gene and the total CDS length was 30.622 Mb with an average length 1.192 kb. A total of 22,259 genes were located on the pseudomolecules (Supplementary Table S9). Annotation of the reference-based assemblies following the annotation coordinates of the reference assemblies resulted in identification of 27,722 and 23,656 genes for ICC4958- and CDC Frontier-based assemblies. The number of predicted genes by de novo annotation was less because of less availability of wild chickpea ESTs in the public databases. The ab initio and EST-based approaches predicted 27,151 and 25,946 gene models, respectively, resulting in annotation of 25,680 high confidence consensus gene models. A clustering analysis of the de novo protein sets showed that a total of 64,904 proteins belonging to 15,068 families were shared by wild, desi (ICC4958) and kabuli (CDC Frontier) chickpeas, while 17,314 and 15,695 protein families were shared by the wild and desi, and the wild and kabuli chickpeas, respectively. A sum of 131 proteins belonging to 59 families of the wild chickpea were not shared with either desi or kabuli chickpea (Supplementary Fig. S3). Notably, 97.64% (25,075) predicted proteins displayed significant sequence similarity (≤1e−5 by BLAST search) with at least one of the public protein databases analyzed (Supplementary Table S10). 15.70% (4033) of the total wild chickpea CDSs did not show any sequence variation with those of desi chickpea, while sequences of 12.02% (3209) wild chickpea CDSs were identical with those of kabuli chickpea. Approximately 83.62% (21,475) of wild chickpea CDSs showed significant sequence similarity (≥90% identity with ≥80% coverage) with the desi chickpea CDSs in contrast to 74.65% (19,170) with kabuli chickpea CDSs. In case of protein sequence, 73.50% (18,876) and 63.46% (16,296) of predicted proteins of C. reticulatum showed significant sequence similarity (≥95% identity with ≥80% coverage) with the predicted protein sets of desi and kabuli chickpea, respectively (Supplementary Table S11). All these observations emphasized that the desi type chickpea was closer to the wild progenitor C. reticulatum in evolution as compared to the kabuli type chickpea.
3.3. Genomic features
Putative pericentromeric region in each linkage group of C. reticulatum assembly was delineated by comparing genetic and physical distances and mapping the repeat and gene densities (Supplementary Fig. S4 and Table S12). Gene density in the pericentromeric region was 5.1 genes/100 kb, in contrast to 9.3 genes/100 kb in the euchromatic region. Average recombination rate in the pericentromeric region (1,921 kb/cM) was similar to that in the desi chickpea assembly (1,691 kb/cM).3 This high pericentromeric recombination rate (4,350 kb/cM in Phaseolus vulgaris) indicated less anchoring of sequence scaffolds in the pericentromeric region due to lack of markers and scarcity of longer scaffolds. Poor gene density (3.8 genes/100 kb) in the un-anchored scaffolds indicated that those mostly belonged to the pericentromeric region. C. reticulatum genome shared a substantial synteny and conservation of gene orders with the genome of the model legume Medicago truncatula (Medicago) (Fig. 2). Total 17,154 genes of Medicago and C. reticulatum existed in 849 colinear blocks of 5 or more genes. The highest synteny was observed between Medicago chromosome 1 (Mt1) and C. reticulatum LG 4 (Cr4) with 82 colinear blocks comprising of 2,037 genes, followed by the synteny between Mt3 and Cr5 with 52 blocks of 1,475 genes and between Mt2 and Cr1 with 41 blocks of 1,445 genes (Supplementary Table S13). C. reticulatum genome assembly was compared with that of the desi chickpea (ICC4958). The same genetic map was used for both the assemblies and, therefore, pseudomolecules in both the assemblies shared an overall synteny at the sequence level (Supplementary Fig. S5) and gene order level (Supplementary Fig. S6) for LGs 2, 6 and 7. The other pseudomolecules showed a few disagreements. Although, extensive local gene collinearity was observed in all the pseudomolecules, incongruity in the positions and orientations of a few gene blocks between the corresponding pseudomolecules of LG1, 3, 5 and 8 were observed. The most disagreement was observed in the upper arm of LG4. These disagreements might have resulted from relatively more dependence on the genetic map for anchoring a large number of scaffolds in case of ICC4958. Comparatively larger scaffolds were anchored in case of C. reticulatum using a fewer genetic markers and most of them are oriented.
Figure 2.

Syntenic relationship between C. reticulatum (Cr) and Medicago truncatula (Mt) pseudomolecules. Mt pseudomolecules are labelled as Mt1-8. C. reticulatum pseudomolecules are labelled as Cr1-8. Collinear blocks are shown according to the shades of the corresponding Cr pseudomolecules. The colour version of the figure is available online.
3.4. Comparison of resistance (R) genes
Attenuation of resistance against diseases is a common effect of domestication. Therefore, the resistance gene homologues (RGH) of C. reticulatum were analyzed in detail in comparison to those of the domesticated chickpea. Total 116 RGH were identified in the wild chickpea assembly following stringent criteria described previously.3 However, when the gene sequences of 133 RGH, identified in the advanced draft genome of chickpea ICC4958, were mapped on the wild chickpea genome, four more RGH were obtained (Supplementary Text S1), which were not annotated before. Three clusters of R genes were observed in the wild chickpea genome each in LG3, 5 and 6. Among all identified RGH, 22 belong to TIR-NBS-LRR and 28 belong to CC-NBS-LRR families (Supplementary Table S14). One hundred four RGH of wild chickpea were orthologous to those of ICC4958, of which coding sequences of 80 orthologous pairs were of same length including 24 identical pairs. The remaining 24 orthologous pairs showed length differences due to InDels in the exons. Experimental validation of most of their sequence was not possible due to lack of the corresponding transcript sequences in the databases. Only two of them were verified by comparing the transcript sequences (Supplementary Text S2). One of those (Cr_03218) belonged to CC-NBS family and is orthologous to Ca_03824 of ICC4958 and XM_004490520.2 of CDC Frontier and showed 69 base-deletion in the exon 3. Cr_03218 is orthologous to RGA4 known for resistance against Magnaporthe oryzae.42 The other (Cr_10687) belonged to NBS-LRR family and is orthologous to Ca_09490 of ICC4958 and XM_012715315.1 of CDC Frontier showed 9 base deletion in the exon1 of the gene. Cr_10687 is orthologous to RPM1 gene, well known for conferring resistance against bacterial leaf spot caused by Pseudomonus syringae pv. maculicola.43 Of the remaining 16 genes of total 120 RGHs, 3 genes were not found in the cultivated chickpea assemblies, 3 genes showed large deletions in the wild species as compared to the corresponding genes in the cultivated species and 10 genes showed deletion in the wild chickpea assembly due to the presence of ambiguous bases (N). Total 34 RGHs are present in 9 clusters (3 or more RGH within 2 Mb) in C. reticulatum genome assembly (Fig. 3a). LG6 showed the presence of total 9 RGHs in 2 clusters. Six RGHs were found present in LG1 in a cluster. Each of LG2, 3, 4, 5, 7 and 8 showed the presence of 1 RGH cluster. Seven of these clusters were collinear with the CDC Frontier genome assembly. Colinearity of other two clusters could not be confirmed due to the presence of the orthologous genes in unanchored scaffolds of the CDC Frontier assembly. A cluster analysis of the predicted RGHs in the wild and desi chickpea assemblies showed high sequence conservation without any outlier group (Supplementary Fig. S7). Total 54 RGH of Medicago showed colinearity with C. reticulatum RGHs (Supplementary Table S15). Orthologues of some well-known RGH, such as RGA4, TMV resistance gene N44 and powdery mildew resistance gene RPW845 can be traced comparing C. reticulatum and Medicago genomes through syntenic relationship (Supplementary Fig. S8).
Figure 3.

Genome-wide sequence diversity between wild and cultivated chickpea. (a) Genome-wide distribution of nucleotide diversity (θπ) within the wild, desi and kabuli chickpea genotypes. RAD sequence reads of 10 accessions of C. reticulatum, 28 accessions each of desi and kabuli chickpeas were mapped on the pseudomolecules of 8 LGs of C. reticulatum. Circular maps show (from periphery to centre) distribution of gene density (in 0.5 Mb) with R gene loci are shown by vertical lines, nucleotide diversities within C. reticulatum, desi and kabuli accessions. A 500 kb bin size with a 50 kb sliding window and the maximum value of 1 for the Y-axis was used to plot nucleotide diversity. (b) Density plot showing distribution of Ks values of the orthologous gene pairs between wild and cultivated (desi-light line, kabuli-dark line) chickpeas. The colour version of the figure is available online (desi-green line, kabuli-red line).
3.5. Sequence diversity between the wild and cultivated chickpea
Sequence reads of C. reticulatum PI489777 were mapped on pseudomolecules of eight assembled linkage groups of chickpea cultivars CDC Frontier and ICC4958 to analyze genome-wide distribution of SNPs and InDels (Supplementary Fig. S9 and Table S16). LG4 of both the assemblies showed the presence of the highest number of SNPs and InDels supporting the previous observation that LG4 is the most variable among all the linkage groups.1,3 The rate of synonymous substitutions (Ks) were calculated for 15,403 and 12,780 orthologous gene pairs between wild-desi and wild-kabuli, respectively, to ascertain diversification periods of the domesticated species from the wild species. The plot of Ks values against the number of gene pairs showed two peaks of diversification, one sharp peak at 0.0001 and another diffused peak around 0.006 (Fig. 3b). Similar pattern was observed when the transcriptome sequences of the domesticated and wild chickpeas were compared.46 The diffused peak around Ks 0.006 corresponds to speciation around 0.5 million years ago, while the peak at 0.0001 possibly suggests recent gene flow from the wild during the domestication process as both the wild and domesticated species are interfertile. To investigate that, SNP frequencies were compared between the intergenic regions of the orthologous gene pairs constituting these peaks. The SNP frequencies in the intergenic regions of the corresponding gene pairs of the younger peak (0.0055 bp−1) was significantly lower (P-value < 0.0001) than that of the older peak (0.0090 bp−1) suggesting gene flow from the wild to cultivated chickpea. Linkage groups of the present wild chickpea genome assembly was used as the reference for mapping restriction site associated DNA (RAD) sequence reads generated from 10 C. reticulatum, and 56 (28 each of desi and kabuli) cultivated chickpea accessions to assess sequence diversities. Total 15,096 SNPs discovered revealed high average pair-wise nucleotide diversity within the wild (θΠ = 0.338) as compared to that within the cultivated chickpeas (0.296). Nucleotide diversities were compared between the wild and domesticated accessions in the intergenic regions of the orthologous gene pairs representing two aforementioned younger and older peaks. The nucleotide diversity in the intergenic regions of the genes belonging to younger peak (θΠ = 0.33) was significantly lower (P-value < 0.0063) than that of the older peak (θΠ = 0.37) further implicating the occurrence of gene flow from the wild to the domesticated chickpea. Nucleotide diversities of the wild and domesticated chickpeas were plotted along the linkage groups (Fig. 3a and Supplementary Table S17). Expectedly, LG 4 showed the highest average nucleotide variation within the wild (θΠ = 0.389) and the domesticated chickpeas (θΠ = 0.320). Out of total 7,185 SNPs within the wild chickpea accessions, 3,615 SNPs were found to be present in all 10 C. reticulatum accessions, and 1,083 and 611 of these were shared with all the desi and kabuli accessions, respectively. Four hundred and thirty-nine SNPs were found common in all the wild and domesticated chickpeas used in this study. Flanking sequences of the unique SNPs present within the wild, desi and kabuli chickpeas were provided as marker resource (Supplementary Table S18).
Although, there are many contrasting phenotypic differences between wild and cultivated chickpeas and also between the desi and kabuli landraces such as, erectness, seed coat and flower colour, sizes of seed, leaf and whole plant, in contrast to other grain legumes, the major trait for chickpea domestication was the change in the cropping season and associated loss of vernalization response.47 In Arabidopsis, functional VRN1 and VRN2 genes are required to maintain vernalization response.48,49 VRN1 and VRN2 orthologues in the wild and domesticated chickpea genome assemblies did not show any sequence variation in the CDS. However, 5′-upstream activating sequences (5′-UAS) of VRN1 orthologues in the desi and kabuli genome assemblies showed a 35 base insertion at around 1.1 kb upstream of the translation start codon as compared to their orthologue in the wild chickpea. Ten accessions each of desi and kabuli chickpea and 4 accessions of C. reticulatum were used to verify this sequence variation by PCR amplification followed by sequencing. All the 20 chickpea cultivars used showed 35 base larger amplification products than the 4 accessions of wild chickpea (Supplementary Fig. S10). On the other hand, in case of VRN2 orthologue located at LG8, a conversion of a dinucleotide repeat (TC)15, present around 200 bp upstream to the translation start codon in the wild genotype, to (TC)49 and (TC)25 was observed in the desi and the kabuli genome assemblies, respectively. This sequence variation was verified in 10 accessions each of desi and kabuli chickpea and 4 accessions of C. reticulatum. The extent of this repeat varied in the domesticated and wild accessions when investigated by PCR amplification. However, all the used wild accessions displayed shorter repeat sequence than the cultivated accessions (Supplementary Fig. S11). Further investigations are required to associate these structural variations with the vernalization response in chickpea.
3.6 Molecular diversity, phylogeny and population genetic structure
The estimation of pair-wise genetic distance among 28 accessions each of desi and kabuli chickpea and 10 accessions of wild C. reticulatum (Supplementary Table S19) using 15,096 SNPs physically mapped over eight pseudomolecules of LGs of the present assembly depicted a wide range of distance coefficient from 0.13 to 0.56 with an average of 0.35. The genetic distance between the desi and kabuli cultivar groups (distance coefficient 0.35) was least as compared to that of desi versus wild (0.42) and kabuli versus wild (0.45). The genetic relationship among 56 cultivated and 10 wild chickpea accessions was depicted in an unrooted dendrogram (Fig. 4a). The SNPs clearly discriminated all the 66 accessions from each other resulting in a definite grouping among desi and kabuli and wild chickpeas. The accessions belonging to wild C. reticulatum were clustered together in a group distinctly from the desi and kabuli cultivars.
Figure 4.

Genome-wide SNP-based molecular diversity among 66 wild and domesticated chickpea accessions. (a) Unrooted phylogram depicting the genetic relationships (Nei’s genetic distance) among 66 wild (R1-10), desi (D1-28) and kabuli (K1-28) chickpea accessions based on genome-wide SNP mapped on C. reticulatum genome assembly. The phylogenetic tree differentiated 66 accessions into three diverse groups. (b) The population genetic structure of the wild and domesticated chickpea accessions. The mapped genetic markers assigned to three distinct desi, kabuli and wild population groups at population number (K = 3). The accessions represented by vertical bars along the horizontal axis were classified into K colour segments based on their estimated membership fraction in each K cluster. The colour version of the figure is available online.
The population genetic structure was determined among the 66 cultivated and wild accessions using the physically mapped SNPs. The optimization of population structure at varying levels of K (K = 2–10) with 20 replications revealed that at K value of 3, all the 66 cultivated and wild accessions were classified majorly into three distinct populations, wild, kabuli and desi as per expected pedigree relationships and parentage (Fig. 4b). This was agreed-well with the clustering pattern as observed among 66 chickpea accessions by the phylogenetic tree analysis using pair-wise genetic distances (Fig. 4a). Based on population structure analysis, the population group I consisting of 10 accessions of wild C. reticulatum, group II with 26 and 4 accessions of kabuli and desi, respectively and group III having 24 and 2 accessions of desi and kabuli, respectively. The molecular genetic variation among and within the three populations based on the SNPs exhibited a wider level of quantitative genetic differentiation (FST varied from 0.17 to 0.54 with an average of 0.38) among three population groups. Among the three population groups, the divergence was maximum between group II (kabuli) and group I (wild) (FST = 0.47) and minimum between group III (desi) and group II (kabuli) (FST = 0.15). The proportion of FST and thus diversity between the population groups was higher as compared to that estimated within populations. Higher genetic differentiation was observed in kabuli than that of desi. All the 6 cultivated chickpea and 10 wild accessions clearly belonged to a single population in which about 81.3% of their inferred ancestry was derived from one of the model-based population and remaining ∼18.7% contained admixed ancestry. Maximum admixture (∼12%) was observed between group II (kabuli) and group III (desi) populations followed by group III (desi) and group I (wild) (∼4%) and group II (kabuli) and wild (∼2%) populations (Fig. 4b).
DISCUSSION
Wild relatives of chickpea are underexploited resource for introducing genomic variation in the domesticated species, which is suffering from a narrow genetic base. The draft genome assembly of the inter-crossable wild progenitor C. reticulatum would provide an excellent resource for studying allelic variation and domestication of chickpea. The assembled pseudomolecules of eight linkage groups in the present draft assembly are equivalent in length to those in the published assemblies of the cultivated species1,3 and were constructed with larger sequence scaffolds. Almost the whole gene spaces of the respective species have been covered in the corresponding assemblies and, therefore, the analyses presented in this report including the resource of polymorphic SSRs and SNPs between the wild and the domesticated species would provide a significant resource for genome-wide large-scale genotyping applications. The reference-based assemblies produced by mapping C. reticulatum reads on two chickpea draft genome assemblies could be used for direct comparison between the wild and the domesticated species. Domestication process of chickpea followed a different course from the other crops domesticated in Fertile Crescent.4 Geographical distributions of two domesticated chickpea types are distinctly separate. While the kabuli type is restricted mostly in the Western Mediterranean, the desi type is mostly grown in the Central Asia and Indian subcontinent. It is possible that the domestication traits were fixed before the evolution of agriculture and subsequent selection based on local adaptation occurred during domestication. Comparative analysis showed desi type chickpea genome was relatively closer to the wild as compared to the kabuli type. However, at present, selection of kabuli type from desi type chickpea50 appears unlikely because of extent of genomic variations between this two types considering separation of only a few thousand years. Additionally, molecular diversity analysis clearly separates these two types. Therefore, an early separation predating agriculture followed by domestication-associated selection according to local adaptability may provide an alternative hypothesis of chickpea domestication process.
Detection of a wider molecular diversity and genetic base using genome-wide SNPs would be much relevant in establishing distinctness and selection of desirable plant types for varietal improvement in chickpea. As expected, the correspondence of clustering pattern obtained among the accessions belonging to desi, kabuli and wild chickpea groups with the pedigree relationship and parentage further suggests that the molecular diversity assessed by genome-wide SNPs is realistic and thus would be useful in chickpea genomics-assisted breeding. The admixed ancestry among three populations might be due to their complex breeding history involving inter-crossing and introgression among desi, kabuli and wild chickpea accessions along with strong selection pressure and evolutionary bottleneck during chickpea domestication.4,51 Higher admixture (∼5%) among 2 wild C. reticulatum accessions (ILWC 247 and ILWC 242) and 1 each of desi (ICC 16374) and kabuli (ICC 11847) accessions originated from Syria is expected due to involvement of C. reticulatum as one of the parents in cross-breeding program for their varietal improvement. This reflects more influence of parentage/geographical origination rather than cultivar-specific classification especially in higher admixed 6 desi and kabuli and 3 wild C. reticulatum accessions. Collectively, the genome assembly and annotation of the wild progenitor of chickpea, and the comparative analysis with the domesticated species would increase opportunities for more strategic use of the wild germplasms for improved crop management.
Supplementary Material
ACKNOWLEDGEMENTS
We acknowledge funding from the National Institute of Plant Genome Research, New Delhi, India. Technical suggestion from Dr. Saulo Aflitos is highly acknowledged.
Conflict of interest
None declared.
Accession numbers
Genome assembly is available at National Centre for Biotechnology Information (NCBI) as Bioproject ID PRJNA263699 (http://www.ncbi.nlm.nih.gov/bioproject?term=PRJNA263699). The sequence data are available in Sequence Read Archive under accession numbers SRR160365, SRR1640444, SRR1640451 and SRR1640455. Genome assembly, annotation data and all the supplementary figures, tables, data are available for viewing and downloading at nipgr.res.in/WCGAP.
Supplementary data
Supplementary data are available at www.dnaresearch.oxfordjournals.org.
Funding
This study was financially supported with a core grant from the National Institute of Plant Genome Research, New Delhi, India.
References
- 1.Varshney R. K., Song C., Saxena R. K., et al. 2013, Draft genome sequence of chickpea (Cicer arietinum) provides a resource for trait improvement, Nat. Biotechnol., 31, 240–246. [DOI] [PubMed] [Google Scholar]
- 2.Jain M., Misra G., Patel R. K., et al. 2013, A draft genome sequence of the pulse crop chickpea (Cicer arietinum L.), Plant J., 74, 715–729. [DOI] [PubMed] [Google Scholar]
- 3.Parween S., Nawaz K., Roy R., et al. 2015, An advanced draft genome assembly of a desi type chickpea (Cicer arietinum L.), Sci. Rep., 5, 12806. [DOI] [PMC free article] [PubMed] [Google Scholar]
- 4.Abbo S., Berger J., Turner N.C. 2003, Evolution of cultivated chickpea: four bottlenecks limit diversity and constrain adaptation, Funct. Plant Biol., 30, 1081–1087. [DOI] [PubMed] [Google Scholar]
- 5.Harlan J. R. 1971, Agricultural origins: centers and noncenters, Science, 174, 468–474. [DOI] [PubMed] [Google Scholar]
- 6.Ladinsky G., Adler A. 1976, The origin of chickpea Cicer arietinum L., Euphytica, 25, 211–217. [Google Scholar]
- 7.Abbo S., Shtienberg D., Lichtenzveig J., Lev-Yadun S., Gopher A. 2003, The chickpea, summer cropping, and a new model for pulse domestication in the ancient near East, Quant. Rev. Biol., 78, 435–448. [DOI] [PubMed] [Google Scholar]
- 8.Redden B., Berger J. 2007, History and origion of chickpea, In: Chickpea Breeding and Management (Yadav S. S., Redden B., Chen W., Sharma B., eds.). CAB International, Wallingford, 1–13. [Google Scholar]
- 9.Zamir D. 2001, Improving plant breeding with exotic genetic libraries, Nat. Rev. Genet., 2, 983–989. [DOI] [PubMed] [Google Scholar]
- 10.Kim J. F., Jeong H., Park S. Y., et al. 2010, Genome sequence of the polymyxin-producing plant-probiotic rhizobacterium Paenibacillus polymyxa E681, J. Bacteriol., 192, 6103–6104. [DOI] [PMC free article] [PubMed] [Google Scholar]
- 11.Bolger A., Scossa F., Bolger M. E., et al. 2014, The genome of the stress-tolerant wild tomato species Solanum pennellii, Nat. Genet., 46, 1034–1038. [DOI] [PMC free article] [PubMed] [Google Scholar]
- 12.Winter P., Pfaff T., Udupa S. M., et al. 1999, Characterization and mapping of sequence-tagged microsatellite sites in the chickpea (Cicer arietinum L.) genome. Mol. Gen Genet., 262, 90–101. [DOI] [PubMed] [Google Scholar]
- 13.Sharma H. C., Sharma K.K., Crouch J.H. 2004, Genetic transformation of crops for insect resistance: potential and limitations, Crit. Rev. Plant Sci., 23, 47–72. [Google Scholar]
- 14.Gaur R., Azam S., Jeena G., et al. 2012, High-throughput SNP discovery and genotyping for constructing a saturated linkage map of chickpea (Cicer arietinum L.), DNA Res. 19, 357–373. [DOI] [PMC free article] [PubMed] [Google Scholar]
- 15.Khajuria Y. P., Saxena M. S., Gaur R., et al. 2015, Development and integration of genome-wide polymorphic microsatellite markers onto a reference linkage map for constructing a high-density genetic map of chickpea, PLoS One, 10, e0125583. [DOI] [PMC free article] [PubMed] [Google Scholar]
- 16.Patel R. K., Jain M. 2012, NGS QC Toolkit: a toolkit for quality control of next generation sequencing data, PLoS One, 7, e30619. [DOI] [PMC free article] [PubMed] [Google Scholar]
- 17.Luo R., Liu B., Xie Y., et al. 2012, SOAPdenovo2: an empirically improved memory-efficient short-read de novo assembler, GigaScience, 1:18. [DOI] [PMC free article] [PubMed] [Google Scholar]
- 18.Zimin A., Marçais G., Puiu D., Roberts M., Salzberg S., Yorke J. 2013, The MaSuRCA genome assembler, Bioinformatics, 29, 2669–2677. [DOI] [PMC free article] [PubMed] [Google Scholar]
- 19.Gnerre S., Maccallum I., Przybylski D., et al. 2011, High-quality draft assemblies of mammalian genomes from massively parallel sequence data, Proc. Natl. Acad. Sci. USA, 108, 1513–1518. [DOI] [PMC free article] [PubMed] [Google Scholar]
- 20.Gaur R., Jeena G., Shah N., et al. 2015, High density linkage mapping of genomic and transcriptomic SNPs for synteny analysis and anchoring the genome sequence of chickpea, Sci. Rep., 5, 13387. [DOI] [PMC free article] [PubMed] [Google Scholar]
- 21.Kent W. J. 2002, BLAT-the BLAST-like alignment tool, Genome Res., 12, 656–664. [DOI] [PMC free article] [PubMed] [Google Scholar]
- 22.Li H., Durbin R. 2009, Fast and accurate short read alignment with Burrows-Wheeler transform, Bioinformatics, 25, 1754–1760. [DOI] [PMC free article] [PubMed] [Google Scholar]
- 23.Chen N. 2004, Using RepeatMasker to identify repetitive elements in genomic sequences. Curr. Protoc. Bioinform., 25, 4.10.1–4.10.14. [DOI] [PubMed] [Google Scholar]
- 24.Edgar R. C., Myers E. W. 2005, PILER: identification and classification of genomic repeats, Bioinformatics, 21, 52–58. [DOI] [PubMed] [Google Scholar]
- 25.Price A. L., Jones N. C., Pevzner P. A. 2005, De novo identification of repeat families in large genomes, Bioinformatics, 21, 351–358. [DOI] [PubMed] [Google Scholar]
- 26.Xu Z., Wang H. 2007, LTR_FINDER: an efficient tool for the prediction of full-length LTR retrotransposons, Nucl. Acids Res., 35, 265–268. [DOI] [PMC free article] [PubMed] [Google Scholar]
- 27.Campbell M. A., Haas B. J., Hamilton J. P., Mount S. M., Buell C. R. 2006, Comprehensive analysis of alternative splicing in rice and comparative analyses with Arabidopsis, BMC Genomics, 7, 327. [DOI] [PMC free article] [PubMed] [Google Scholar]
- 28.Jhanwar S., Priya P., Garg R., Parida S. K., Tyagi A. K., Jain M. 2012, Transcriptome sequencing of wild chickpea as a rich resource for marker development, Plant Biotechnol. J., 10, 690–702. [DOI] [PubMed] [Google Scholar]
- 29.Haas B. J., Salzberg S. L., Zhu W., et al. 2008, Automated eukaryotic gene structure annotation using EVidenceModeler and the program to assemble spliced alignments, Genome Biol., 9, R7. [DOI] [PMC free article] [PubMed] [Google Scholar]
- 30.Krzywinski M., Schein J., Birol I., et al. 2009, Circos: an information aesthetic for comparative genomics, Genome Res., 19, 1639–1645. [DOI] [PMC free article] [PubMed] [Google Scholar]
- 31.Enright A. J., Van Dongen S., Ouzounis C. A. 2002, An efficient algorithm for large-scale detection of protein families, Nucl. Acids Res., 30, 1575–1584. [DOI] [PMC free article] [PubMed] [Google Scholar]
- 32.Soderlund C., Bomhoff M., Nelson W. M. 2011, SyMAP v3.4: a turnkey synteny system with application to plant genomes, Nucl. Acids Res., 39, e68. [DOI] [PMC free article] [PubMed] [Google Scholar]
- 33.Wang Y., Tang H., Debarry J. D., et al. 2012, MCScanX: a toolkit for detection and evolutionary analysis of gene synteny and collinearity, Nucl. Acids Res., 40, e49. [DOI] [PMC free article] [PubMed] [Google Scholar]
- 34.Chenna R., Sugawara H., Koike T., et al. 2003, Multiple sequence alignment with the Clustal series of programs, Nucl. Acids Res., 31, 3497–3500. [DOI] [PMC free article] [PubMed] [Google Scholar]
- 35.Suyama M., Torrents D., Bork P. 2006, PAL2NAL: robust conversion of protein sequence alignments into the corresponding codon alignments. Nucl. Acids Res., 34, W609–W612. [DOI] [PMC free article] [PubMed] [Google Scholar]
- 36.Yang Z. 2007, PAML 4: phylogenetic analysis by maximum likelihood, Mol. Biol. Evol., 24, 1586–1591. [DOI] [PubMed] [Google Scholar]
- 37.Lynch M., Conery J. S. 2000, The evolutionary fate and consequences of duplicate genes, Science, 290, 1151–1155. [DOI] [PubMed] [Google Scholar]
- 38.Catchen J., Amores A., Hohenlohe P., Cresko W., Postlethwait J. 2011, Stacks: building and genotyping loci de novo from short-read sequences, Genes Genomes Genet., 1, 171–182. [DOI] [PMC free article] [PubMed] [Google Scholar]
- 39.Kujur A., Bajaj D., Upadhyaya H. D., et al. 2015, Employing genome-wide SNP discovery and genotyping strategy to extrapolate the natural allelic diversity and domestication patterns in chickpea, Front. Plant Sci., 6, 162. [DOI] [PMC free article] [PubMed] [Google Scholar]
- 40.Marcais G., Kingsford C. 2011, A fast, lock-free approach for efficient parallel counting of occurrences of k-mers, Bioinformatics, 27, 764–770. [DOI] [PMC free article] [PubMed] [Google Scholar]
- 41.Parra G., Bradnam K., Korf I. 2007, CEGMA: a pipeline to accurately annotate core genes in eukaryotic genomes. Bioinformatics,23, 1061–1067. [DOI] [PubMed] [Google Scholar]
- 42.Cesari S., Kanzaki H., Fujiwara T., et al. 2014, The NB-LRR proteins RGA4 and RGA5 interact functionally and physically to confer disease resistance, EMBO J., 33, 1941–1959. [DOI] [PMC free article] [PubMed] [Google Scholar]
- 43.Peters B. J., Ash G. J., Cother E. J., Hailstones D. L., Noble D. H., Urwin N. A. R. 2004, Pseudomonas syringae pv. maculicola in Australia: pathogenic, phenotypic and genetic diversity, Plant Pathol., 53, 73–79. [Google Scholar]
- 44.Whitham S., Dinesh-Kumar S. P., Choi D., Hehl R., Corr C., Baker B. 1994, The product of the tobacco mosaic virus resistance gene N: similarity to toll and the interleukin-1 receptor, Cell, 78, 1101–1115. [DOI] [PubMed] [Google Scholar]
- 45.Kim H., O'Connell R., Maekawa-Yoshikawa M., Uemura T., Neumann U., Schulze-Lefert P. 2014, The powdery mildew resistance protein RPW8.2 is carried on VAMP721/722 vesicles to the extrahaustorial membrane of haustorial complexes, Plant J., 79, 835–847. [DOI] [PubMed] [Google Scholar]
- 46.Agarwal G., Jhanwar S., Priya P., et al. 2012, Comparative analysis of kabuli chickpea transcriptome with desi and wild chickpea provides a rich resource for development of functional markers, PLoS One, 7, e52443. [DOI] [PMC free article] [PubMed] [Google Scholar]
- 47.Abbo S., Lev-Yadun S., Galwey N. 2002, Vernalization response of wild chickpea, New Phytol., 154, 695–701. [DOI] [PubMed] [Google Scholar]
- 48.Sung S., Amasino R. M. 2004, Vernalization in Arabidopsis thaliana is mediated by the PHD finger protein VIN3, Nature, 427, 159–164. [DOI] [PubMed] [Google Scholar]
- 49.Gendall A. R., Levy Y. Y., Wilson A., Dean C. 2001, The VERNALIZATION 2 gene mediates the epigenetic regulation of vernalization in Arabidopsis, Cell, 107, 525–535. [DOI] [PubMed] [Google Scholar]
- 50.Moreno M. T., Cubero C. I. 1978, Variation in Cicer arietinum L., Euphytica, 27, 465–485. [Google Scholar]
- 51.Berger J., Abbo S., Turner N. C. 2003, Ecogeography of annual wild Cicer species: the parlous state of the world collection, Crop Sci., 43, 1076. [Google Scholar]
Associated Data
This section collects any data citations, data availability statements, or supplementary materials included in this article.