

Abstract
Lutein is a xanthophyll abundant in nature and most commonly present in the human diet through consumption of leafy green vegetables. With zeaxanthin and meso-zeaxanthin, lutein is a component of the macular pigment of the retina, where it protects against photooxidation and age-related macular degeneration. Recent studies have suggested that lutein may positively impact cognition throughout the lifespan, but outside of the retina, the deposition, metabolism, and function(s) of lutein are poorly understood. Using a novel botanical cell culture system (Daucus carota), the present study aimed to produce a stable isotope lutein tracer for use in future investigations of dietary lutein distribution and metabolism. Carrot cultivars were initiated into liquid solution culture, lutein production conditions optimized, and uniformly labeled 13C-glucose was provided as the sole media carbon source for four serial growth cycles. Lutein yield was 2.58 ± 0.24 µg/g, and mass spectrometry confirmed high enrichment of 13C: 64.9% of lutein was uniformly labeled and 100% of lutein was labeled on at least 37 of 40 possible carbons. Purification of carrot extracts yielded a lutein dose of 1.92 mg with 96.0 ± 0.60% purity. 13C-lutein signals were detectable in hepatic extracts of an adult rhesus macaque monkey (Macaca mulatta) dosed with 13C-lutein, but not in hepatic samples collected from control animals. This novel botanical biofactory approach can be used to produce sufficient quantities of highly enriched and pure 13C-lutein doses for use in tracer studies investigating lutein distribution, metabolism, and function.
Keywords: Lutein, phytochemicals, nutrition, isotopic tracer, mass spectrometry, non-human primate
Introduction
Lutein is a 40-carbon hydroxylated carotenoid (Figure 1), abundant throughout nature, which accounts for up to 50% of total carotenoid content of higher plants.1 In plants, it serves several important roles: light harvesting though transfer of excitation energy to chlorophyll, stabilization of proteins within the light harvesting complex, and free radical quenching.2 Lutein-rich green leafy vegetables are the major dietary source of this carotenoid for Americans,3,4 and results from the National Health and Examination Survey 2003–2004 indicate that average intake is highest in older adults (1008 ± 96 µg lutein/day) and those of non-Hispanic black ethnicity (1118 ± 111 µg lutein/day).4 After ingestion, lutein is absorbed and distributed to a number of tissues, most notably being the eye, where it comprises a major portion of the retinal macular pigment.5,6 In the retina, lutein, along with zeaxanthin and the lutein metabolite meso-zeaxanthin,7,8 are thought to protect against age-related macular degeneration, a major cause of blindness in the USA.9–11 Much work has been done on the role of lutein in the preservation of retinal health, but recent research also has suggested a role for this carotenoid in the brain. In a study by Vishwanathan et al., brain carotenoid concentrations in decedent infants reflected a preferential accumulation of lutein compared to other carotenoids, despite the fact that lutein was not the predominant carotenoid in the diets of pregnant mothers, breastfeeding mothers, or infants.12 This relationship holds true at the other extreme of the human lifespan: while the serum carotenoid profile of centenarians reflected a typical diet (high concentrations of β-carotene and lycopene, lower levels of lutein), brain carotenoids revealed a preferential accumulation of lutein.13 Moreover, post-mortem brain lutein levels in these centenarians correlated with pre-mortem cognitive performance,13 and a randomized, double blind, placebo-controlled trial found that four months of lutein supplementation improved cognition in elderly women.14 While hypotheses have been put forward, a mechanism of action for these effects has yet to be resolved. Work in our group,15 as well as by others, is currently proceeding towards this goal.
Figure 1.

Chemical structure of lutein [(3R,3′R,6′R)-β,ɛ-Carotene-3,3′-diol]
Elucidation of dietary bioactives’ mechanism(s) of action in vivo is aided greatly by the ability to follow ingested compounds through the various steps of absorption, tissue deposition, and metabolism in a human subject or an appropriate animal model. Isotopically labeled tracers have been of great utility in studies of retinol and β-carotene metabolism;16,17 indeed, we have already used this technique to investigate the tissue deposition and metabolism of lycopene and phytoene.18,19 Total chemical synthesis of lutein has been previously described,20 making isotopic labeling through this approach technically possible; however, the tracer masses required for typical feeding studies prevent this approach from being economically feasible for most investigators. Several investigators have used microbial21–23 or botanical24–27 biofactory approaches for the production of isotopically labeled lutein tracers. Similarly, we have experience in both microbial28 and botanical29–32 approaches for the production of isotopically labeled carotenoids, but have not previously applied these to lutein tracer production. Botanical biofactory methods are reviewed in greater detail elsewhere.15
Efficiency of molecular labeling with stable isotopes can be validated using mass spectrometry (MS).33 Labeling of molecules with stable isotopes results in changes in their molecular masses and isotopic signatures, thus making them amenable to unambiguous detection and characterization.33 Not surprisingly, the history of studies of stable isotope tracers and development of MS methods are closely linked.34 MS multiplexed analysis allows not only the detection of target labeled compounds, but also the determination of degree of isotopic labeling and ratios of completely and incompletely labeled molecules.35,36 Moreover, such analyses reveal isotopic patterns of both endogenously present and exogenous metabolites of targeted molecules.37 Therefore, the combination of targeted quantitative MS analysis and semi-quantitative MS profiling can be used for pharmacokinetics and pharmacodynamics of 13C-lutein and other carotenoids in biological specimens. MS has been widely used in detection of isotopically labeled carotenoids, including 13C-lutein in human plasma.22–24,26
This study sought to establish a novel botanical model for the stable isotopic labeling of lutein, optimize lutein production in vitro, and validate MS methods for the identification of labeled lutein in plant cell culture and hepatic tissue of a dosed animal. Future work, which is already underway, will harness the produced lutein tracer for studies of lutein distribution and metabolism in the non-human primate brain, with the goal of identifying mechanisms by which lutein may influence cognition in primates, including humans.
Materials and methods
Chemicals
HPLC-grade acetonitrile, diethyl ether, dioxane, ethyl acetate, methanol, triethylamine, chloroform, and water were purchased from Fisher Scientific (Fair Lawn, NJ, USA), as were potassium hydroxide and sodium chloride. Butylated hydroxytoluene, sodium chloride, and HPLC-grade 2-propanol were purchased from Sigma-Aldrich (St. Louis, MO, USA). Ethanol (200 proof) was purchased from Decon Labs (King of Prussia, PA, USA). 2,4-dichlorophenoxyacetic acid was purchased from Sigma-Aldrich and cell culture media (Murashige & Skoog, Gamborg B5) were purchased from PhytoTechnology Laboratories (Overland Park, KS, USA). Uniformly labeled 13C-glucose was purchased from Cambridge Isotope Laboratories (Tewksbury, MA, USA). Deuterated GABA (4-Aminobutyric-2,2-d2 acid, 98 atom % D, Cat. no. D-1731) was obtained from C/D/N Isotopes (Pointe-Claire, Canada).
Seed disinfestation, germination, cell culture, and harvest
Seeds of yellow, purple, and red Daucus carota (carrot) cultivars Amarillo, Jaune Obtuse du Doubs (Bakercreek Heirloom Seeds, Mansfield, MO), Yellowstone, Yellow Solaris (Irish Eyes Garden Seeds, Thorp, WA, USA), Purple Dragon, Purple Sun, and Atomic Red (John Scheepers Kitchen Garden Seeds, Bantam, CT, USA) were washed with deionized water for 20 min followed by a 1-min immersion in 70% ethanol, and then soaked in a solution of 1% sodium hypochlorite solution and dilute detergent for 15 min. Seeds were rinsed three times in sterilized deionized water, explanted onto 15 mL germination medium consisting of half-strength Gamborg B5 (B5) salts and vitamins, myoinositol (0.1 g/L), sucrose (30 g/L), and agar (6 g/L) in capped 25 × 150 mm culture tubes, and placed under approximately 30–40 µmol m−2 s−1 of continuous cool white fluorescent lighting at a temperature of 25 ± 2℃. After 13 to 17 days of germination, the resulting seedlings were divided into root, hypocotyl, cotyledon, or true leaf sections and transferred to tubes of callus induction medium similar to the seedling germination medium, with the exception of the use of full strength B5 salts and the addition of 1 mL/L 2,4-dichlorophenoxyacetic acid. A total of 66 callus lines were generated in this manner. Explants were transferred to fresh agar-solidified callus induction medium every 28 days and approximately 1 cm callus sections were excised from mother tissue when sufficient growth had occurred. As growth rate increased, cubes containing 40 mL medium were used as growth vessels containing 4 callus clumps per cube.
After several months, when sufficient friable callus was available, solution cultures were induced by transferring approximately 2 g of callus to 40 mL of liquid medium, composed of the same components as callus initiation medium, within a 125 mL Erlenmeyer flask. Flasks were placed in a rotary shaker at 150 r/min at a temperature of 25 ± 2℃ with approximately 40 µmol m−2 s−1 of continuous cool white fluorescent lighting. To maintain the cultures, 5 mL of suspended cells were transferred to fresh medium at 14-day intervals. Unless otherwise specified, these conditions were employed in all experiments.
Harvesting of callus and cells was conducted at the end of growth cycles of 28 days for solid callus and 14 days for solution cultures. Mass data for callus grown on solid media were not collected due to inaccuracy in separating callus tissue and gelled media. Cell mass data for solution cultures was collected by pouring into pre-weighed 50 mL centrifuge tubes, centrifuging for 5 min at 2500 r/min, pouring off excess liquid, reweighing, and calculating mass. All callus samples were frozen at −80℃ until extraction.
Culture optimization
Basal salt and carbon source
Previously, both B5 and Murashige and Skoog (M&S) media have been used to successfully grow carrot solution cultures. These media utilize sucrose as a carbon source, but due to the lack of economical sources of 13C-sucrose, it was necessary to determine the suitability of glucose as a carbon source for the subsequent labeling protocol. A 2 × 2 × 2 factorial experiment was arranged such that two replicates of established solution cultures of an Amarillo root cell line and a Jaune Obtuse du Doubs hypocotyl cell line were supplied with either glucose or sucrose as the sole carbon source in each of the B5 or M&S basal salt culture media conditions. Cells were allowed to grow for 14 days and then were harvested for lutein extraction and HPLC analysis.
Light and light intensity preference
To determine the effect of light exposure and intensity on the production of lutein, cells were grown in duplicate under 40 µmol • m−2 • s−1 or 80 µmol • m−2 • s−1 of cool white continuous light, or with light exclusion provided by foil covering. Cultures were harvested for lutein extraction and HPLC analysis after 14 days of treatment.
Flask size
The effect of flask size on lutein production was tested in 125 mL and 250 mL Erlenmeyer flasks. For both flask sizes, final culture volume was 36% of the total flask capacity, consisting of 32% fresh media and 4% cell inoculum (40 mL fresh media + 5 mL inoculum for 125 mL flasks; 80 mL fresh media + 10 mL inoculum for 250 mL flasks). All cultures were grown in duplicate under 80 µmol • m−2 • s−1 of cool white continuous light for 14 days, after which they were harvested for lutein extraction and high-performance liquid chromatography – photodiode array detection (HPLC-PDA) analysis.
Glucose utilization
A time course study was conducted to identify the lag, log, and stationary phases of cell growth, as well as to plot the time course of glucose utilization. The glucose concentration nadir and cell mass peak are used to determine timing of subcultures for serial labeling growth cycles, in order to maximize efficiency of incorporation of 13C from glucose into lutein. Four replicate cultures grown in 125 mL flasks under 80 µmol • m−2 • s−1 of light were harvested at two-day intervals from day 0 to day 10 and daily from day 11 to day 16. Samples were analyzed for cell mass, glucose content of the media via HPLC-refractive index detection (HPLC-RI), and lutein yield via HPLC-PDA.
Serial culturing and isotopic labeling
For 13C isotopic labeling, a serial subculturing method was employed with 13C glucose as the sole carbon source in the medium. Initially, three stock culture flasks of the selected lutein-producing cell line were pooled in order to reduce inoculum heterogeneity in the first 13C loading cycle culture. After a 14-day culture period, a second 13C loading cycle of eight flasks was inoculated with cultures from the first cycle flask. After another 14-day of cycle two growth, a third cycle of 64 flasks was inoculated using cells from the second 13C loading cycle. After 14 days of growth, 9 culture flasks from the third cycle were used to inoculate a fourth labeling cycle of 75 cultures. Remaining third cycle culture flasks (64 – 9 = 55 flasks) and all culture flasks from the fourth cycle (75 flasks) were harvested after 18 days of growth. Any remaining cells from the first and second cycles not used for inoculation of the second and third cycles, respectively, were not used for further labeling or lutein harvest.
Extraction and purification
Lutein was extracted from hepatic tissue as previously described.38 For analytical screening of carrot cell cultures, lutein was extracted using a method previously developed for carotenoid extraction from tomato cells.39 For preparatory carrot cell extractions, this method was adapted as follows: 30 g of wet, packed cells were homogenized in 50 mL of 0.1% butylated hydroxytoluene in ethanol for 6 min and transferred to a 250 mL bottle. Samples were saponified by the addition of 8.5 mL saturated aqueous KOH (100 g/100 mL) and incubation in a 60℃ water bath for 30 min, with vortexing every 10 min. To this, 20 mL of saturated aqueous NaCl (36 g/100 mL) is added, followed by 75 mL hexane and mixing by vortex for 1 min. After allowing phases to separate, the hexane supernatant is removed and set aside; this is repeated twice more, and the combined hexane pool is reduced in a centrifugal vacuum concentrator (Savant, Thermo Scientific, Waltham, MA USA), followed by evaporation to dryness under argon. The extracts were stored at −20℃ until purification by preparatory HPLC.
An HPLC system consisting of an Alliance e2695 separations module and 2998 photodiode array (PDA) detector (Waters, Milford, MA, USA), with column cooling set to 18℃ and sample cooling at 4℃ was used for all analysis and purification. The HPLC conditions for lutein and alpha-tocopherol analysis were modified from a previously published method.40 Briefly, lutein was separated with an isocratic method utilizing a mobile phase of acetonitrile:dioxane:200 mM ammonium acetate in 50%/50% (v/v) methanol/2-propanol:triethylamine (80:15:5:0.1) on a Waters Spherisorb® ODS2 150 mm × 4.6 mm × 3 µm C18 analytical column. For preparatory HPLC purification, the system was fitted with a 250 mm × 10 mm × 5 µm C30 preparatory column (YMC America, Allentown, PA, USA) and C30 guard column. The preparatory separation utilized the same mobile phase as the analytical method, but with omission of ammonium acetate. Flow rate was 4.73 mL/min. Samples were reconstituted in 27 µL of a 100:35 mixture of ethyl acetate:mobile phase, separated by preparatory HPLC, and eluted lutein peaks were collected. Lutein fractions from liver and carrot cell extracts were collected for mass spectrometry analysis (analytical HPLC) or lutein harvest (preparatory HPLC) by collecting PDA detector eluate before lutein peak takeoff and after baseline touchdown. Fractions were dried under argon gas. Fractions from preparatory HPLC for lutein harvest were dissolved in diethyl ether and pooled, ether was removed in a rotary evaporator (Buchi, New Castle, DE, USA) and with argon gas, and a single vial of purified, concentrated 13C-lutein was obtained. This was sampled and analyzed for total lutein content and purity via analytical HPLC-PDA.
In vivo dosing
The Institutional Animal Care and Use Committee of the Oregon National Primate Research Center (ONPRC), Oregon Health and Science University, approved all procedures. A female, 19-year-old rhesus macaque (Macaca mulatta) was fed a standard laboratory diet (Monkey Diet Jumbo, LabDiet, St. Louis, MO, USA), supplemented daily for the previous six months with 1 µmol/kg/day (570 µg/kg/day) of unlabeled lutein (FloraGloR beadlets, 5% lutein, DSM, Herleen, the Netherlands). The animal was anesthetized with ketamine (10 mg/kg intramuscular injection), intubated with an orogastric catheter (Rusch, Teleflex, Morrisville, NC, USA), and dosed with 13C-labeled lutein solubilized in mixed monoglyceride/diglyceride (MDG) oil (Abbott Nutrition, Columbus, OH, USA). Purified lutein was dissolved in 4 mL of chloroform and thoroughly mixed into 2.09 mL of MDG oil. The chloroform was removed from the lutein–oil mixture via evaporation under argon and the resulting mixture was sampled in duplicate for determination of final lutein concentration. In order to prepare the orogastric catheter (size 28 Fr) for gastric lutein dosing, using a 10 mL polypropylene syringe, unlabeled MDG oil was drawn through the catheter and into the syringe, followed by full expulsion back into the oil reservoir; this was performed for eight cycles to ensure full laminar coating of the catheter walls, thus minimizing lutein loss on the interior of the catheter. Next, 4 mL of unlabeled MDG oil was drawn into the catheter, followed by the lutein-MDG oil dose, and finally followed by an additional 2 mL of unlabeled MDG oil. After dose administration to the monkey, approximately 3 mL nonfat milk was placed into the vial previously containing the lutein–oil dose mixture, and the tube was agitated vigorously. Additional nonfat milk was added to this mixture to bring the total volume to 15 mL, it was drawn into the syringe, and this volume was used to chase the lutein dose and rinse remaining contents of the orogastric catheter into the monkey’s stomach. All equipment used to prepare and administer the lutein dose (e.g., pipette tips, Pasteur pipettes, syringe, orogastric catheter, etc.) was retained and washed thoroughly with diethyl ether to recover remnant lutein. This diethyl ether wash was extracted, saponified, and analyzed via HPLC to determine dosing efficiency.
Three days after oral 13C-lutein dosing, the animal was euthanized under deep sodium pentobarbital anesthesia. Tissues were collected and snap-frozen in liquid nitrogen, and samples were shipped on dry ice from the ONPRC to the University of Illinois at Urbana-Champaign for analysis.
Two rhesus macaques (male, 161 days old; female, 220 days old) were fed unlabeled lutein-supplemented diets for four months, but were not dosed with 13C-lutein. Tissues were collected in the same manner as for the 13C lutein-dosed animal and liver tissue was used as negative control for detection of 13C lutein in liver.
Mass spectrometry
Multiple analytical approaches were used in the study of 13C-lutein in carrot and monkey liver extracts. For initial carrot culture extract measurements, laser desorption ionization-mass spectrometry (LDI-MS) in reflectron positive polarity mode was used. In these experiments, dried carrot extracts were reconstituted in 10 µl of 200-proof ethanol. The resulting solutions had visible yellow color. 0.3 µL of the solution was spotted on a metal sample plate and analyzed with a UltrafleXtreme MALDI-TOF/TOF mass spectrometer (Bruker Daltonics, Billerica, MA, USA) equipped with solid-state UV Smartbeam II laser. The laser operated at 1 kHz repetition firing. The mass spectra each averaged 1000 laser shots. Mass resolving power and mass accuracy was 27,000 and 30 ppm, respectively.
For the analyses of lutein in HPLC-purified monkey liver and carrot culture fractions, ultrahigh performance liquid chromatography-triple quadrupole-electrospray ionization-mass spectrometry (UHPLC-TQ-ESI-MS) was used to evaluate 13C-lutein content. An EVOQ Elite™ TQ-ESI-mass spectrometer (Bruker Daltonics), equipped with VIP heated electrospray and APCI ion source, was tuned using polytyrosine calibration and tuning mixture (Bruker Daltonics, cat no. 394127601). The instrument operated in polarity switching mode with the following settings: (+) spray current 15.0 µA; (−) spray current 15.0 µA; cone temperature 250℃; cone gas flow 10 arbitrary units (AU); heated probe temperature 450℃; probe gas flow 15 AU; nebulizing gas flow 60 AU; collision gas pressure 1.5 mTorr. 0.7 unit resolution was set for both Q1 and Q3 quadrupoles.
Dried monkey liver fractions were reconstituted in 25 µL of ethanol and 25 µL of acetonitrile was added to the sample. Ten microliters of this solution was injected onto a C18 column (50 mm, 1.7 µm particle size, Fortis Technologies Ltd, UK) using a CTC Autosampler with mitigated carryover. C18 columns have demonstrated good performance in separation of lutein (reviewed by Rivera and Canela-Garayoa41). Analytes were separated using an isocratic UHPLC method consisting of 100% acetonitrile running at 300 µL/min for 8 min.
Deuterated GABA was spiked into all samples as an internal standard to monitor system performance. Determination of instrument response linearity, as well as quantification of analytes, was accomplished with calibration curves of external analyte standards. Multiple reactions monitoring (MRM) provided information on analyte identity. Three different transitions for each analyte parent ion were monitored during the entire MRM run. Previously reported 12C-lutein MRM transitions were monitored (reviewed by Rivera and Christou42), as well as those suggested by METLIN (metlin.scripps.edu) and MASSBANK (http://www.massbank.jp/) metabolomics databases. The following transitions found during product scan analysis of 13C-lutein-related ions, generated from LC fractions of carrot culture extracts, were also used in subsequent experiments: [M + H]+ 13C-lutein m/z 609.6 → 105.9, 609.6 → 243.5, 609.6 → 430.0; [M + H-H2O]+ 13C-lutein m/z 591.6 → 143.6, 591.6 → 503.2, 591.6 → 487.0; [M+].+ 13C-lutein m/z 608.6 → 176.7, 608.6 → 389.1, 608.6 → 123.3. Data acquisition and processing was managed by Bruker MS Workstation software (Version 8.1.2, Bruker Daltonics). Limits of detection are in range of high parts per trillion (ppt) to low parts per billion (ppb).
Statistical analysis
Two-way analysis of variance (ANOVA) was used for all analyses of lutein production in cell culture, with the exception of analysis of lutein and alpha-tocopherol concentrations over four serial growth cycles, in which case repeated measures ANOVA was used. Post hoc Tukey’s Studentized range test was used to identify group differences. All analysis was done in SAS version 9.3 (SAS Institute, Cary, NC, USA). Mass spectrometry data were summarized and analyzed using Excel to determine average and standard deviation. Correlation coefficients were calculated using the correlation function incorporated into Excel’s Analysis ToolPak.
Results and discussion
Callus and solution culture screening
From the four tissue types sampled (true leaf, root, hypocotyl, cotyledon) from the seven carrot varietals studied (Atomic Red, Amarillo, Jaune Obtuse du Doubs, Yellow Solaris, Yellowstone, Purple Dragon, Purple Sun), 66 total callus cell lines were generated. These were grouped by the combination of varietal and tissue source, resulting in 17 unique callus tissues types (Table 1S, Supplementary material). Replication – the number of cell lines generated from a callus tissue type within a given varietal – ranged from 1 to 6. Callus tissues were sampled for lutein content to determine promising cell lines from which to establish solution cultures. As can be seen in Table 1S (Supplementary material), high variability was evident across the 17 different tissues sampled (%CV = 59%). There were no overall patterns in callus tissue lutein accumulation, as tissue source did not predict lutein yield across carrot varietals (e.g. root tissues ranged from 0.00 µg/g in Atomic Red to 3.59 µg/g in Yellowstone) and tissue sources from the same varietal at times differed by a considerable amount (e.g. 6.83 µg/g in Jaune Obtuse hypocotyl tissue vs. 1.91 µg/g in root tissue). However, trends emerged in carrot varietals, as Atomic Red was a very poor lutein producer in both callus tissues generated, while, in general, the yellow varietals (Amarillo, Yellow Solaris, and Yellowstone) tended to have higher yields; this was especially true in lines derived from hypocotyl tissues. Notably, the yellow carrot varietal Jaune Obtuse du Doubs showed highly dimorphic lutein tissue accumulation, as the hypocotyl-derived callus had the highest concentrations of all tissues tested (6.83 µg/g), while root tissue was below the average for all tissues (1.91 µg/g; mean = 2.62 µg/g). The overall difference between yellow and red carrot varietals agrees with genetic studies of carotenoid biosynthetic genes during carrot development, as yellow carrots, such as the Yellowstone varietal, demonstrate upregulation of lycopene e-cyclase (Lcye), which drives carotenoid accumulation towards lutein, while red varietals demonstrate increased expression of zeta-carotene desaturases 1 and 2 (Zds1, Zds2) and relatively low expression of Lcye, promoting lycopene accumulation.43 The anthocyanin-rich purple varietals Purple Dragon and Purple Sun exhibited moderate lutein production in all tissues tested.
Five callus tissue types were selected for initiation into solution culture – Amarillo root, Jaune Obtuse du Doubs hypocotyl, Yellow Solaris root, and hypocotyl and root from the Yellowstone varietal (Table 1S, Supplementary material). Selection of callus tissues to initiate into solution culture was based on several factors, most obvious among them being lutein accumulation. In that regard, Jaune Obtuse hypocotyl, Yellowstone hypocotyl, and Yellowstone root tissues ranked in the top four of all callus tissues in lutein accumulation (6.83 µg/g, 3.63 µg/g, and 3.59 µg/g, respectively), and on this basis, were selected for initiation into solution culture. While the mean level of lutein accumulation in the Yellow Solaris root callus tissue was only near the median in lutein content (2.55 µg/g, ranked 7/17), two of the four replicates within that callus tissue type had levels of lutein that were not quantifiable, while the other two replicates accumulated greater than 5.0 µg/g lutein. Therefore, those two lutein-accumulating Yellow Solaris root callus lines were initiated into solution culture on the basis of their individual lutein production, despite the group heterogeneity. Finally, while the Amarillo root callus tissue was a poor lutein producer (0.96 µg/g, ranked 15/17), it accumulated α-tocopherol more than any other callus tissue that had not already been selected for its lutein production (Jaune Obtuse hypocotyl and Yellowstone root also accumulated high levels of α-tocopherol). Production of a uniformly labeled α-tocopherol tracer was of separate interest to our research team and so the Amarillo root callus tissue was the final tissue selected for initiation into solution culture.
Solution culture optimization
Solution cultures generated from tissue callus underwent two screening cycles before cell culture optimization, to verify that lutein production in solution culture stably reflected solid callus levels. While Yellowstone hypocotyl and Yellowstone root callus tissues were the second- and third-highest lutein-accumulating callus tissues, they did not maintain their level of production (on a µg/g basis) in solution culture (Table 1S, Supplementary material). Yellowstone hypocotyl decreased by 31%, from 3.63 µg/g to 2.50 µg/g, while the Yellowstone root line decreased even further, by 74% (3.59 µg/g to 0.93 µg/g). The two highest lutein producers in solution culture, on the basis of µg/g accumulation, were Jaune Obtuse hypocotyl tissue and, surprisingly, Amarillo root tissue. Amarillo root lutein production dramatically increased when transferred from callus to solution culture (0.96 µg/g callus to 4.14 µg/g in solution, 431% increase) and, although Jaune Obtuse hypocotyl did decrease slightly when transferred to solution culture, (6.83 µg/g callus to 5.17 µg/g in solution, 24% decrease), it was still the highest lutein producer of the solution cultures tested. Yellow Solaris root experienced a slight increase in lutein production during the transition (2.55 µg/g callus to 2.85 µg/g in solution, 12% increase). Therefore, Jaune Obtuse hypocotyl and Amarillo root solution cultures were used for further optimization of lutein production. These data demonstrate the heterogeneous metabolic adaptation of plant cells to novel culture conditions and underscore the need to screen many lines at once in order to increase the probability of selecting an ideal high-yield biofactory.
Culture media and carbon source
Standard plant cell growth media formulations utilize sucrose as the carbon source.44,45 However, the only commercially available, economically priced, and uniformly labeled ([U]) 13C carbohydrate is glucose. Therefore, determination of suitability of glucose as a sole carbon source for lutein production needed to be determined in our system. Additionally, various combinations of vitamins, minerals, and nitrogenous salts may be used for plant solution culture46 and may affect cell growth and lutein yield. To these ends, a 2 × 2 × 2 factorial experiment was conducted to determine the production of lutein in solution culture in vitro in the Amarillo root and Jaune Obtuse hypocotyl cell lines, providing either glucose or sucrose as the sole carbon source, in either B544,45 or M&S47 culture media. As seen in Figure 2, while there were no statistically significant three-way interactions, we did observe a two-way interaction between cell line and culture media. While B5 media supported lutein production in either the Amarillo or Jaune Obtuse cell lines, Amarillo cultures in M&S media experienced a significant decrease in production of approximately 51%. Previous work has shown that carrot cells grown in liquid culture preferentially take up glucose from the culture medium and do not assimilate media sucrose directly into cellular metabolites.48 Despite this preference for glucose, cell growth was not inhibited by sucrose as a sole supply of carbon in the media, likely due to hydrolysis of extracellular sucrose to its constituent fructose and glucose monomers by secreted invertase enzyme, allowing the uptake of glucose for growth and metabolism.48 In agreement with this previous work, we did not observe an impact of carbon source (glucose vs. sucrose) on lutein production.
Figure 2.
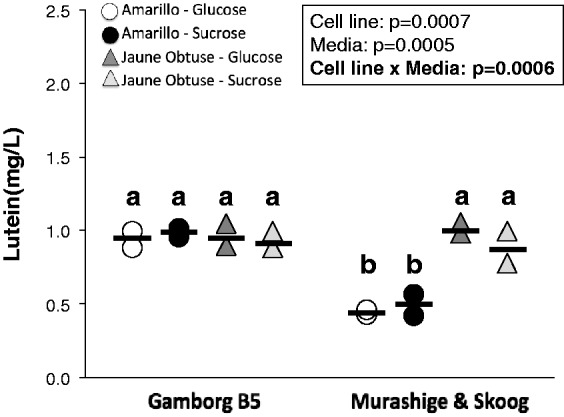
Lutein yield (mg/L solution) in Amarillo or Jaune Obtuse du Doubs carrot cell lines cultured with glucose or sucrose as the sole carbon source and in B5 or M&S plant cell culture media. Data points are duplicates for each treatment combination. Significant interactions and main effects (p < 0.05) calculated by two-way ANOVA are noted. Different letters above groups indicate statistical significance (Tukey’s adjusted p < 0.05)
Light/dark preference and light intensity
Lutein, like other carotenoids in photosynthetic plants, serves not only as a photoprotective antioxidant, but also it plays a key role in photosynthetic light-harvesting.49,50 In fact, lutein is the predominant carotenoid present in photosynthetic leaves, accounting for 40% of total carotenoids.51 Thus, we tested whether light presence or intensity affected lutein production in selected carrot cell cultures in vitro. Glucose and B5 media were used for culture, per results from the previous experiment. Light treatment (40 µmol • m−2 • s−1), compared to light exclusion by covering flasks in aluminum foil, resulted in greater lutein accumulation in several carrot cell lines tested (data not shown). Next, we tested whether a higher-intensity light treatment would further boost lutein yields in the Amarillo and Jaune Obtuse carrot cell lines. Lutein yields in the Amarillo line, but not the Jaune Obtuse line, doubled (p < 0.05) when exposed to an 80 µmol • m−2 • s−1 light treatment compared to 40 µmol • m−2 • s−1 (Figure 3). In agreement with our findings, previous work in kale52 has also shown that increased light irradiance results in increased lutein content.
Figure 3.
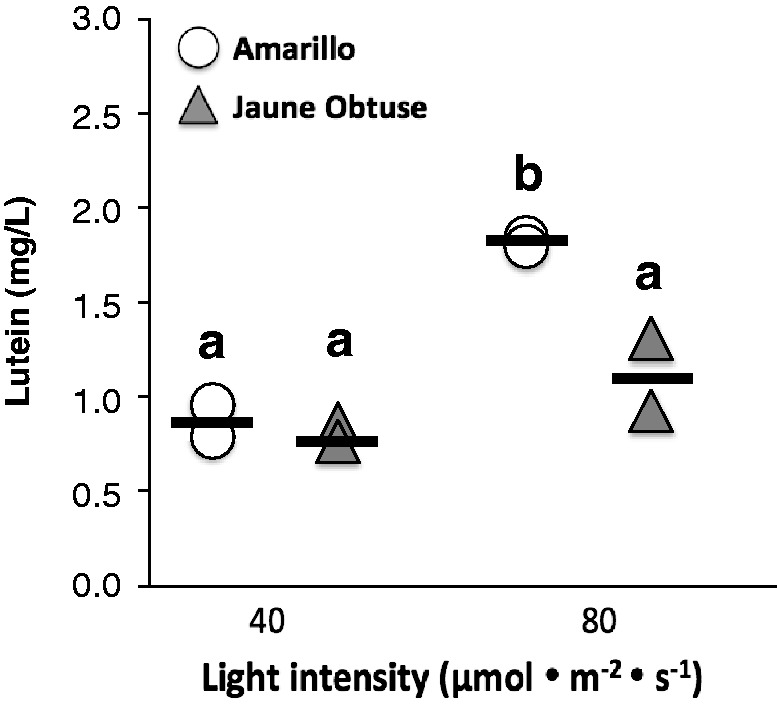
Lutein yield (mg/L solution) in Amarillo or Jaune Obtuse du Doubs carrot cell lines, cultured in 125 mL flasks under 40 µmol • m−2 • s−1 or 80 µmol • m−2 • s−1 light treatment. Data points are duplicates for each treatment combination. Different letters above groups indicate that statistical significance calculated by post hoc means separation following two-way ANOVA (Tukey’s adjusted p < 0.05)
Flask size
Culture flask size impacts culture media surface area, evaporation, gas exchange, and oxygenation; these factors may impact cell growth and metabolite production.53,54 Therefore, we tested the effects on lutein production of doubling flask capacity from 125 mL (containing 40 mL media) to 250 mL (containing 80 mL media). Doubling flask size (and concomitantly doubling media volume) did not significantly affect lutein yield in either the Amarillo or Jaune Obtuse cell lines (data not shown). However, equivalent lutein production in 125 mL flasks compared to 250 mL flasks is preferable, as it limits microbial contamination risk; a contaminated 125 mL flask represents a smaller fraction of the overall cell mass being cultured.
After testing of the above variables, an Amarillo root tissue cell line grown in 125 mL flasks in B5 media under 80 µmol • m−2 • s−1 light with glucose as the sole carbon source achieved peak lutein production; thus, these were the final conditions chosen for further work.
Glucose utilization timecourse
In order to identify the optimal harvest day to allow maximal 13C uptake by carrot cultures, a glucose utilization timecourse study was performed. Total cell mass was weighed and glucose concentrations in the media were assayed via HPLC-RI at 11 timepoints over 16 days. Media glucose was depleted by 14 days, while cell mass reached a maximum at 14 days (Figure 4). Cell mass remained at maximum at day 16, despite a depletion of glucose in the media at 16 days.
Figure 4.
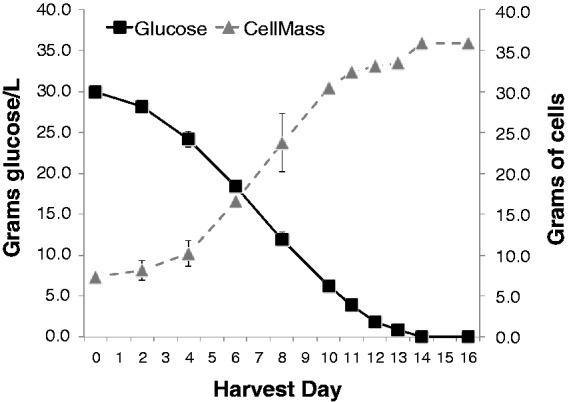
Cell mass (in grams) and glucose concentration (in g/L solution) in Amarillo cell line cultures over 16 days. Error bars (some not visible) represent SEM of 3–4 total replicates for each data point over the course of two independent experiments
In vitro isotopomeric labeling
Lutein yield decreased slightly during 13C labeling. While yields in cycles 1 and 2 were equivalent (3.83 ± 0.02 µg/g and 3.73 ± 0.07 µg/g, respectively), lutein production dropped by 15% in cycle 3 compared to cycle 1 (to 3.26 ± 0.10 µg/g) and 33% in cycle 4 compared to cycle 1 (to 2.58 ± 0.24 µg/g) (Figure 5), both statistically significant deviations. This is consistent with previous work in our laboratory on tomato cells, where lycopene and total carotenoid production decreased with progressive 13C culture enrichment.32 In the same study, time to media glucose depletion shifted three days – from day 9 to day 12 of culture – between the 13C loading phase (cycle 1) and 13C labeling/harvest phase (cycles 2 and 3),32 potentially attributable to a longer lag in cell growth with further enrichment of cellular 13C pools. Due to the precious nature of the labeled cells in the present study, cell mass was not assessed in the 13C-lutein labeling experiment, preventing definitive conclusions about the cause of the observed decreased lutein yield. However, it is known that C3 plants, such as tomatoes and carrots, discriminate against 13C in carbon fixation (in favor of 12C), impacting photosynthetic efficiency.37 While photosynthesis is bypassed by provision of glucose in the media of our cultures, enrichment of 13C may impact still other metabolic processes to retard cell mass accumulation, synthesis of secondary metabolic products, or both. It is interesting to note, however, that α-tocopherol levels in the present study significantly increased in cycle 4, compared to cycle 1 (Figure 5), suggesting that the effect of 13C loading on metabolite synthesis may be pathway-specific.
Figure 5.
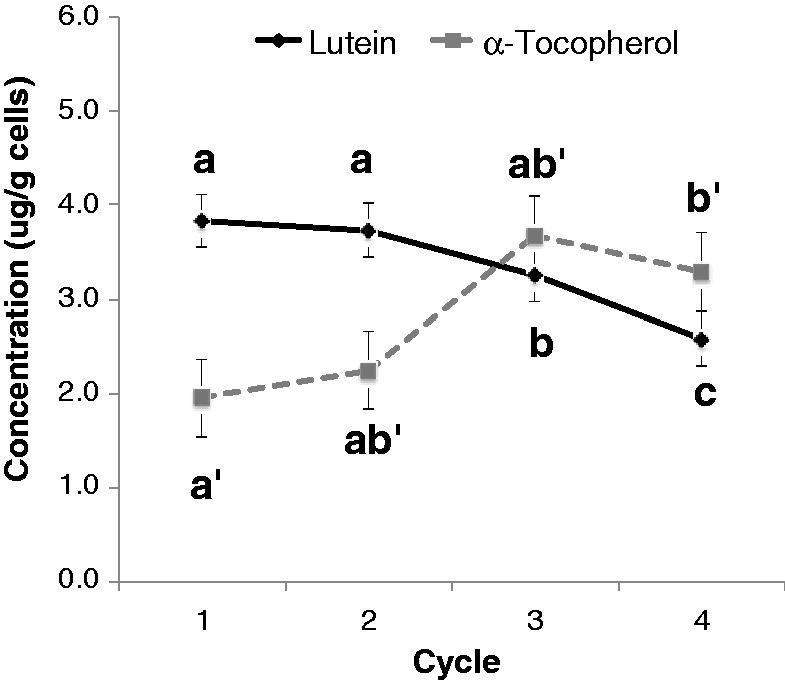
Lutein and alpha-tocopherol concentrations (µg/g cells) in Amarillo carrot cells, cultured under optimized conditions, across two 13C loading cycles (cycles 1 & 2) and two 13C loading/harvest cycles (cycles 3 and 4). Error bars represent SEM of 2–3 replicates for each data point. One-way repeated measures ANOVA with post hoc Tukey’s test analysis was used to calculate statistical significance. Statistically, lutein and alpha-tocopherol were analyzed separately, as indicated by absence or presence of primes (e.g. a vs. a′). Different letters denote statistically different data points (Tukey’s adjusted p < 0.05)
Samples of solution cultures were taken during cycles 1 and 2 (13C loading cycles) and cycles 3 and 4 (13C labeling/harvest cycles) for measurement of 13C lutein isotopomer profile by LDI-MS. Representative mass spectra acquired from cycle 3 extracts are shown in Figure 6(Aii) and (Aiii). For comparison, a mass spectrum of an unlabeled, lutein standard (xanthophyll from marigold, X6250, Sigma) is shown in Figure 6(Ai); unlabeled lutein has a monoisotopic molecular mass of 568.42, while lutein fully labeled at all 40 carbons has a monoisotopic molecular mass of 608.56 (calculated using www.chemcalc.org55). As anticipated, 13C enrichment increased with culture cycles, from observed monoisotopic patterns of 55.6% uniformly labeled (40/40 possible carbons) in cycle 1 to 64.9% uniformly labeled in cycle 4 (Table 1). An inverse pattern was observed in the percent of isotopomers labeled at 38/40 carbons, which decreased from 16.4% in cycle 1 to 9.6% in cycle 4. Additionally, the data suggest an enhancement in isotopic enrichment of lutein between the loading phase (cycles 1 and 2) and the harvest phase (cycles 3 and 4). Not only does this support our use of lutein harvested from both cycles 3 and 4 in subsequent dosing, but it also lends credence to the hypothesis that a metabolic threshold of 13C cellular loading exists between the loading and harvest phases, and that the co-occurrence with decreased lutein accumulation at this phase interface may be a sign of altered cellular metabolism.
Figure 6.

13C-lutein is successfully biosynthesized and purified from carrot cell solution culture, and can be detected in monkey liver four days after oral gavage. (A) Representative mass spectra and chromatogram of carrot extracts and purified lutein dose. (i) LDI-MS mass spectrum of unlabeled xanthophyll standard; (ii) LDI-MS mass spectrum of extract from 13C lutein harvest cycle 3 (m/z range of 13C-lutein is indicated by box outline); (iii) magnification of 13C-lutein m/z range from (ii); (iv) 13C-lutein m/z range from LDI-MS mass spectrum of purified lutein dose [no isotopomers of m/z lower than 606 were detected]; (v) HPLC-PDA chromatogram demonstrating purity of prepared 13C-lutein dose, sampled immediately prior to oral gavage in a rhesus macaque monkey. (B) Representative UHPLC-TQ-ESI-MS mass chromatograms of MRM transitions characteristic of 13C-lutein ions. (i) [M + H-H2O] 13C-lutein ions were detected in carrot cell extracts and (ii) the liver of a monkey dosed with 13C-lutein. (iii) [M]+. 13C-lutein ions were detected in carrot cell extracts and (iv) the liver of a monkey dosed with 13C-lutein
Table 1.
Isotopomer profiles in carrot cell extracts and purified 13C-lutein dose.
| 13C40H56O2 | 12C13C39H56O2 | 12C213C38H56O2 | 12C313C37H56O2 | ||
|---|---|---|---|---|---|
| In vitroa | Cycle 1* | 55.6% | 28.0% | 16.4% | n.d. |
| Cycle 2 | 63.8% ± 1.4% | 28.2% ± 1.2% | 8.0% ± 0.2% | n.d. | |
| Cycle 3 | 66.8% ± 1.8% | 26.6% ± 1.9% | 6.6% ± 0.6% | n.d. | |
| Cycle 4* | 64.9% | 25.5% | 9.6% | n.d. | |
| Purified doseb | 64.7 ± 0.9% | 27.0 ± 0.4% | 8.3 ± 0.9% | n.d. | |
Isotopomer profiles in each of the carrot cell culture 13C loading cycles (1 and 2) and 13C harvest cycles (3 and 4), as well as in the purified lutein dose prepared for treatment of the animal. aFor the in vitro carrot samples, carrot cells were extracted, lutein purified by HPLC, collected, and samples were dried and analyzed by LDI-MS. Data represent means ± SEM of four measurements (two technical replicates for each of two LC fractions), except for Cycles 1 and 4 (marked with an asterisk [*]); in these cases, there was not enough material for replication and samples were analyzed once. bFor the purified lutein dose, lutein was extracted, dried, and analyzed by LDI-MS. Data represent mean ± SEM of four technical replicates. Unlabeled lutein and lutein labeled with 13C at 37 or fewer possible carbons was not detected in any sample (n.d., not detected).
In vivo dosing
Carrot cells from cycles 3 and 4 were extracted, and 13C-labeled lutein was purified with reverse-phase HPLC, pooled, and sampled for analysis prior to in vivo dosing in rhesus macaque. The lutein dose was sampled both before and after shipment on dry ice to the Oregon National Primate Research Center for dosing. Lutein in the dose was not affected during shipment, as lutein purity was 96.0 ± 0.02% and 96.0 ± 0.60% before and after shipment, respectively. A representative chromatograph of the lutein dose is shown in Figure 6(Aiv). The isotopomeric profile of the dose reflected a high degree of 13C labeling, with 64.7 ± 0.9% uniformly labeled (40/40 carbons), 27.0 ± 0.4% labeled at 39/40 carbons, and 8.3 ± 0.9% labeled at 38/40 carbons (Table 1). A representative mass spectrum of the lutein dose is shown in Figure 6(Av). As in the labeled carrot cell extracts, no lutein with 13C labeling at 37 or fewer of the 40 possible positions was detected in the purified lutein dose (Table 1).
HPLC-PDA analysis of samples of the lutein dose taken prior to administration indicated that dose to be delivered was 1.98 mg of total 13C-labeled lutein. All equipment used to handle lutein during the dose preparation and delivery protocol (e.g., pipette tips, centrifuge tubes, Pasteur pipettes, Rusch catheter, syringe, etc.) were saved and stored at−80℃ until analysis for remnant lutein. HPLC-PDA analysis of remnant lutein revealed that only 57 µg of 1.98 mg lutein was not delivered to the animal, for an effective dosing efficiency of 97.2%; thus, it was calculated that 1.92 mg of 13C-labeled lutein was delivered into the stomach of the animal subject.
Hepatic 13C-lutein detection
Our next goal was to measure hepatic 13C-lutein in the dosed animal using several MS-based approaches to demonstrate, in a qualitative manner, that the 13C-lutein was absorbed from the gut and accumulated to detectable levels in the liver. A number of molecular ions characteristic for 13C-lutein were detected in extracts of carrot cells (Figure 6(Bi, iii)) and monkey liver (Figure 6(Bii, iv)) using an MRM approach with UHPLC-TQ-ESI-MS. UHPLC-TQ-ESI-MS analysis of two LC fractions of hepatic extract of the 13C-lutein-fed monkey confirmed the presence of unlabeled (Table 2S, Supplementary material) and 13C-labeled (Table 3S, Supplementary material) lutein. This conclusion is based on the detection of multiple characteristic parent and fragment ions. Additionally, relative areas of the MRM signals acquired from the unlabeled lutein standard (xanthophyll) were similar to signals indicative of unlabeled lutein detected in livers of three animals with correlation coefficients raging between 0.89 and 0.99 (Tables 2S and 4S, Supplementary material). Similar comparison of MRM 13C-lutein-related signals in carrot extract fraction and extract of liver of the monkey fed with 13C-lutein produced a correlation coefficient of 0.85 (Table 3S, Supplementary material). The results corroborate the HPLC-PDA measurements of the fractions. Additionally, UHPLC-TQ-ESI-MS measurements of two LC fractions of extracts from livers of two reference monkeys fed unlabeled lutein (i.e. not dosed with 13C-lutein) unambiguously identified unlabeled lutein (Table 4S, Supplementary material) but not 13C-labeled lutein (Table 5S, Supplementary material).
Unlike with the MRM approach, characteristic 13C-lutein signals were not observed in hepatic extracts using LDI-MS, likely due to relatively low abundance of the related ions and chemical complexity of the samples.
In summary, we have demonstrated a method for the efficient production, extraction, and purification of highly enriched 13C-lutein from carrot (Daucus carota) solution culture in vitro, which represents a novel biofactory for lutein tracer production. Additionally, subsequent to oral dosing of an adult rhesus monkey (Macaca mulatta) with ∼1.9 mg 13C-lutein, we were able to detect 13C-lutein in hepatic tissue using UHPLC-TQ-ESI-MS via MRM. Future work will characterize the deposition and metabolism of 13C-lutein metabolites in primate tissues.
Supplementary Material
Acknowledgement
The authors wish to thank Molly Black, Kathryn Austin, and Connor Buchweitz for assistance in lutein extraction and purification.
Authors’ contribution
All authors participated in the design, interpretation of the studies, analysis of the data, and review of the manuscript. JWS, RBR, SJ, SSR, LW, and MN conducted the experiments; JWS, RBR, SJ, SSR, LW, JVS, MN, MJK, and JWE wrote and edited the manuscript. JWS current affiliation: Department of Environmental Health and Engineering, Bloomberg School of Public Health, Johns Hopkins University, Baltimore, MD 21205, USA.
Declaration of Conflicting Interests
MJK is an employee of Abbott Nutrition, which, through the Center for Nutrition, Learning, and Memory at the University of Illinois at Urbana-Champaign, funded this work. MJK’s employment with Abbott Nutrition did not impact the authors’ decision to publish this work, nor did it influence the composition of the manuscript. No other authors have conflicts of interest to declare.
Funding
Funding was provided by Abbott Nutrition through the Center for Nutrition, Learning and Memory, University of Illinois, Urbana – Champaign; US Department of Agriculture grant no. 1950-51000-073-01 and NIH grant no. P51OD011092 (MN).
References
- 1.Pogson B, McDonald KA, Truong M, Britton G, DellaPenna D. Arabidopsis carotenoid mutants demonstrate that lutein is not essential for photosynthesis in higher plants. Plant Cell 1996; 8: 1627–39. [DOI] [PMC free article] [PubMed] [Google Scholar]
- 2.Jahns P, Holzwarth AR. The role of the xanthophyll cycle and of lutein in photoprotection of photosystem II. Biochim Biophys Acta 2012; 1817: 182–93. [DOI] [PubMed] [Google Scholar]
- 3.Perry A, Rasmussen H, Johnson EJ. Xanthophyll (lutein, zeaxanthin) content in fruits, vegetables and corn and egg products. J Food Compos Anal 2009; 22: 9–15. [Google Scholar]
- 4.Johnson EJ, Maras JE, Rasmussen HM, Tucker KL. Intake of Lutein and Zeaxanthin Differ with Age, Sex, and Ethnicity. J Am Diet Assoc 2010; 110: 1357–62. [DOI] [PubMed] [Google Scholar]
- 5.Bone RA, Landrum JT, Tarsis SL. Preliminary identification of the human macular pigment. Vision Res 1985; 25: 1531–5. [DOI] [PubMed] [Google Scholar]
- 6.Bernstein PS, Khachik F, Carvalho LS, Muir GJ, Zhao D-Y, Katz NB. Identification and quantitation of carotenoids and their metabolites in the tissues of the human eye. Exp Eye Res 2001; 72: 215–23. [DOI] [PubMed] [Google Scholar]
- 7.Johnson EJ, Neuringer M, Russell RM, Schalch W, Snodderly DM. Nutritional manipulation of primate retinas, III: Effects of lutein or zeaxanthin supplementation on adipose tissue and retina of xanthophyll-free monkeys. Invest Ophthalmol Vis Sci 2005; 46: 692–702. [DOI] [PubMed] [Google Scholar]
- 8.Bernstein PS, Johnson EJ, Neuringer M, Schalch W, Schierle J. Comment on: What is meso-zeaxanthin, and where does it come from? Eye 2014; 28: 240–2. [DOI] [PMC free article] [PubMed] [Google Scholar]
- 9.Chew EY, Clemons TE, Sangiovanni JP, Danis RP, Ferris FL III, Elman MJ, Antoszyk AN, Ruby AJ, Orth D, Bressler SB, Fish GE, Hubbard GB, Klein ML, Chandra SR, Blodi BA, Domalpally A, Friberg T, Wong WT, Rosenfeld PJ, Agrón E, Toth CA, Bernstein PS, Sperduto RD. Age-Related Eye Disease Study 2 (AREDS2) Research Group. Secondary analyses of the effects of lutein/zeaxanthin on age-related macular degeneration progression: AREDS2 report No. 3. JAMA Ophthalmol 2014; 132: 142–9. [DOI] [PMC free article] [PubMed] [Google Scholar]
- 10.Barker FM, Snodderly DM, Johnson EJ, Schalch W, Koepcke W, Gerss J, Neuringer M. Nutritional manipulation of primate retinas, V: Effects of lutein, zeaxanthin, and n-3 fatty acids on retinal sensitivity to blue-light-induced damage. Invest Ophthalmol Vis Sci 2011; 52: 3934–42. [DOI] [PMC free article] [PubMed] [Google Scholar]
- 11.SanGiovanni JP, Neuringer M. The putative role of lutein and zeaxanthin as protective agents against age-related macular degeneration: promise of molecular genetics for guiding mechanistic and translational research in the field. Am J Clin Nutr 2012; 96: 1223S–33S. [DOI] [PMC free article] [PubMed] [Google Scholar]
- 12.Vishwanathan R, Kuchan MJ, Sen S, Johnson EJ. Lutein and Preterm Infants With Decreased Concentrations of Brain Carotenoids. J Pediatr Gastroenterol Nutr 2014; 59: 659–65. [DOI] [PubMed] [Google Scholar]
- 13.Johnson EJ, Vishwanathan R, Johnson MA, Hausman DB, Davey A, Scott TM, Green RC, Miller LS, Gearing M, Woodard J, Nelson PT, Chung H-Y, Schalch W, Wittwer J, Poon LW. Relationship between serum and brain carotenoids, α-tocopherol, and retinol concentrations and cognitive performance in the oldest old from the Georgia Centenarian Study. J Aging Res 2013; 2013: 951786–951786. [DOI] [PMC free article] [PubMed] [Google Scholar]
- 14.Johnson EJ, McDonald K, Caldarella SM, Chung H-Y, Troen AM, Snodderly DM. Cognitive findings of an exploratory trial of docosahexaenoic acid and lutein supplementation in older women. Nutr Neurosci 2008; 11: 75–83. [DOI] [PubMed] [Google Scholar]
- 15.Erdman JW, Smith JW, Kuchan MJ, Mohn ES, Johnson EJ, Rubakhin SS, Wang L, Sweedler JV, Neuringer M. Lutein and brain function. Foods 2015; 4: 547–64.. [DOI] [PMC free article] [PubMed] [Google Scholar]
- 16.van Lieshout M, West CE, van Breemen RB. Isotopic tracer techniques for studying the bioavailability and bioefficacy of dietary carotenoids, particularly β-carotene, in humans: a review. Am J Clin Nutr 2003; 77: 12–28. [DOI] [PubMed] [Google Scholar]
- 17.Burri BJ, Clifford AJ. Carotenoid and retinoid metabolism: insights from isotope studies. Arch Biochem Biophys 2004; 430: 110–9. [DOI] [PubMed] [Google Scholar]
- 18.Moran NE, Clinton SK, Erdman JW., Jr. Differential bioavailability, clearance, and tissue distribution of the acyclic tomato carotenoids lycopene and phytoene in Mongolian gerbils. J Nutr 2013; 143: 1920–6. [DOI] [PMC free article] [PubMed] [Google Scholar]
- 19.Moran NE, Cichon MJ, Riedl KM, Grainger EM, Schwartz SJ, Novotny JA, Erdman JW, Jr., Clinton SK. Compartmental and noncompartmental modeling of 13C-lycopene absorption, isomerization, and distribution kinetics in healthy adults. Am J Clin Nutr 2015; 102: 1436–49. [DOI] [PMC free article] [PubMed] [Google Scholar]
- 20.Khachik F, Chang A-N. Total synthesis of (3R,3’R,6’R)-lutein and its stereoisomers. J Org Chem 2009; 74: 3875–85. [DOI] [PubMed] [Google Scholar]
- 21.Bhosale P, Serban B, Bernstein PS. Production of deuterated lutein by Chlorella protothecoides and its detection by mass spectrometric methods. Biotechnol Lett 2006; 28: 1371–5. [DOI] [PubMed] [Google Scholar]
- 22.Yao L, Liang Y, Trahanovsky WS, Serfass RE, White WS. Use of a 13C tracer to quantify the plasma appearance of a physiological dose of lutein in humans. Lipids 2000; 35: 339–48. [DOI] [PubMed] [Google Scholar]
- 23.Chen L, Collins XH, Tabatabai LB, White WS. Use of a 13C tracer to investigate lutein as a ligand for plasma transthyretin in humans. Lipids 2005; 40: 1013–22. [DOI] [PubMed] [Google Scholar]
- 24.Kelm MA, Flanagan VP, Pawlosky RJ, Novotny JA, Clevidence BA, Britz SJ. Quantitative determination of 13C-labeled and endogenous β-carotene, lutein, and vitamin A in human plasma. Lipids 2001; 36: 1277–82. [DOI] [PubMed] [Google Scholar]
- 25.Kurilich AC, Britz SJ, Clevidence BA, Novotny JA. Isotopic labeling and LC-APCI-MS quantification for investigating absorption of carotenoids and phylloquinone from kale (Brassica oleracea). J Agric Food Chem 2003; 51: 4877–83. [DOI] [PubMed] [Google Scholar]
- 26.Novotny JA, Kurilich AC, Britz SJ, Clevidence BA. Plasma appearance of labeled β-carotene, lutein, and retinol in humans after consumption of isotopically labeled kale. J Lipid Res 2005; 46: 1896–903. [DOI] [PubMed] [Google Scholar]
- 27.de Moura FF, Ho CC, Getachew G, Hickenbottom S, Clifford AJ. Kinetics of 14C distribution after tracer dose of 14C-lutein in an adult woman. Lipids 2005; 40: 1069–73. [DOI] [PubMed] [Google Scholar]
- 28.Lu C-H, Choi J-H, Engelmann Moran N, Jin Y-S, Erdman JW., Jr Laboratory-scale production of 13C-labeled lycopene and phytoene by bioengineered Escherichia coli. J Agric Food Chem 2011; 59: 9996–10005. [DOI] [PMC free article] [PubMed] [Google Scholar]
- 29.Campbell JK, Rogers RB, Lila MA, Erdman JW., Jr Biosynthesis of 14C-phytoene from tomato cell suspension cultures (Lycopersicon esculentum) for utilization in prostate cancer cell culture studies. J Agric Food Chem 2006; 54: 747–55. [DOI] [PubMed] [Google Scholar]
- 30.Engelmann NJ, Rogers RB, Lila MA, Erdman JW., Jr Herbicide treatments alter carotenoid profiles for 14C tracer production from tomato (Solanum lycopersicum cv. VFNT cherry) cell cultures. J Agric Food Chem 2009; 57: 4614–9. [DOI] [PMC free article] [PubMed] [Google Scholar]
- 31.Engelmann NJ, Campbell JK, Rogers RB, Rupassara SI, Garlick PJ, Lila MA, Erdman JW., Jr. Screening and selection of high carotenoid producing in vitro tomato cell culture lines for [13C]-carotenoid production. J Agric Food Chem 2010; 58: 9979–87. [DOI] [PMC free article] [PubMed] [Google Scholar]
- 32.Moran NE, Rogers RB, Lu C-H, Conlon LE, Lila MA, Clinton SK, Erdman JW., Jr Biosynthesis of highly enriched 13C-lycopene for human metabolic studies using repeated batch tomato cell culturing with 13C-glucose. Food Chem 2013; 139: 631–9. [DOI] [PMC free article] [PubMed] [Google Scholar]
- 33.de Hoffman E, Stroobant V. Mass Spectrometry – principles and applications, 3rd ed Chicester: John Wiley & Sons, Ltd, 2007. [Google Scholar]
- 34.Thomson JJ. Rays of positive electricity and their applicaton to chemical analyses, London: Longmans, Green and Co, 1913. [Google Scholar]
- 35.Cho K, Mahieu N, Ivanisevic J, Uritboonthai W, Chen Y-J, Siudzak G, Patti GJ. isoMETLIN: a database for isotope-based metabolomics. Anal Chem 2014; 86: 9358–61. [DOI] [PMC free article] [PubMed] [Google Scholar]
- 36.Fetzer I, Jehmlich N, Vogt C, Richnow H-H, Seifert J, Harms H, von Bergen M, Schmidt F. Calculation of partial isotope incorporation into peptides measured by mass spectrometry. BMC Res Notes 2010; 3: 178–178. [DOI] [PMC free article] [PubMed] [Google Scholar]
- 37.Liang Y, White WS, Yao L, Serfass RE. Use of high-precision gas isotope ratio mass spectrometry to determine natural abundance 13C in lutein isolated from C3 and C4 plant sources. J Chromatogr A 1998; 800: 51–8. [DOI] [PubMed] [Google Scholar]
- 38.Conlon LE, King RD, Moran NE, Erdman JW., Jr Coconut oil enhances tomato carotenoid tissue accumulation compared to safflower oil in the Mongolian gerbil (Meriones unguiculatus). J Agric Food Chem 2012; 60: 8386–94. [DOI] [PubMed] [Google Scholar]
- 39.Lu C-H, Engelmann NJ, Lila MA, Erdman JW., Jr Optimization of lycopene extraction from tomato cell suspension culture by response surface methodology. J Agric Food Chem 2008; 56: 7710–4. [DOI] [PMC free article] [PubMed] [Google Scholar]
- 40.Craft NE, Furr HC. Improved HPLC analysis of retinol and retinyl esters, tocopherols, and carotenoids in human serum samples for the NHANES. FASEB J 2004;18:A534.
- 41.Rivera SM, Canela-Garayoa R. Analytical tools for the analysis of carotenoids in diverse materials. J Chromatogr A 2012; 1224: 1–10. [DOI] [PubMed] [Google Scholar]
- 42.Rivera SM, Christou P, Canela-Garayoa R. Identification of carotenoids using mass spectrometry. Mass Spectrom Rev 2014; 33: 353–72. [DOI] [PubMed] [Google Scholar]
- 43.Clotault J, Peltier D, Berruyer R, Thomas M, Briard M, Geoffriau E. Expression of carotenoid biosynthesis genes during carrot root development. J Exp Bot 2008; 59: 3563–73. [DOI] [PubMed] [Google Scholar]
- 44.Gamborg OL, Murashige T, Thorpe TA, Vasil IK. Plant tissue culture media. In Vitro 1976; 12: 473–8. [DOI] [PubMed] [Google Scholar]
- 45.Gamborg OL. The effects of amino acids and ammonium on the growth of plant cells in suspension culture. Plant Physiol 1970; 45: 372–5. [DOI] [PMC free article] [PubMed] [Google Scholar]
- 46.Gamborg OL, Shyluk JP. The culture of plant cells with ammonium salts as the sole nitrogen source. Plant Physiol 1970; 45: 598–600. [DOI] [PMC free article] [PubMed] [Google Scholar]
- 47.Murashige T, Skoog FK. A revised medium for rapid growth and bioassays with tobacco tissue cultures. Physiol Plant 1962; 18: 100–27. [Google Scholar]
- 48.Kanabus J, Bressan RA, Carpita NC. Carbon assimilation in carrot cells in liquid culture. Plant Physiol 1986; 82: 363–8. [DOI] [PMC free article] [PubMed] [Google Scholar]
- 49.Demmig-Adams B, Adams WW. The role of xanthophyll cycle carotenoids in the protection of photosynthesis. Trends Plant Sci 1996; 1: 21–6. [Google Scholar]
- 50.Demmig-Adams B, Adams WW. Antioxidants in photosynthesis and human nutrition. Science 2002; 298: 2149–53. [DOI] [PubMed] [Google Scholar]
- 51.Dall’Osto L, Lico C, Alric J, Giuliano G, Havaux M, Bassi R. Lutein is needed for efficient chlorophyll triplet quenching in the major LHCII antenna complex of higher plants and effective photoprotection in vivo under strong light. BMC Plant Biol 2006; 6: 32–32. [DOI] [PMC free article] [PubMed] [Google Scholar]
- 52.Lefsrud MG, Kopsell DA, Kopsell DE, Curran-Celentano J. Irradiance levels affect growth parameters and carotenoid pigments in kale and spinach grown in a controlled environment. Physiol Plant 2006; 127: 624–31. [Google Scholar]
- 53.Lee CWT, Shuler ML. Different shake flask closures alter gas phase composition and ajmalicine production in Catharanthus roseus cell suspensions. Biotechnol Tech 1991; 5: 173–8. [Google Scholar]
- 54.Dalton CC, Street HE. The role of the gas phase in the greening and growth of illuminated cell suspension cultures of spinach (Spinacia oleracea, L.). In Vitro 1976; 12: 485–94. [DOI] [PubMed] [Google Scholar]
- 55.Patiny L, Borel A. ChemCalc: a building block for tomorrow’s chemical infrastructure. J Chem Inf Model 2013; 53: 1223–8. [DOI] [PubMed] [Google Scholar]
Associated Data
This section collects any data citations, data availability statements, or supplementary materials included in this article.