Significance
The prion protein aggregates and causes neurodegenerative diseases in many mammalian species. The aggregated protein is transmissible to other organisms and species. Aggregation is believed to originate in cellular endosomes at low pH. We have measured reconfiguration of unfolded prion of two species under a variety of conditions and found a wide range of rates. At low pH the reconfiguration rate for hamster prion is in the middle of the measured range, but increases when an aggregation inhibitor is added. These results agree with a model in which aggregation is fastest when reconfiguration is about the same rate as bimolecular association, and suggest a new approach to finding drugs for prion diseases in which reconfiguration is altered to prevent aggregation.
Keywords: protein folding, protein aggregation, intramolecular diffusion, prion disease, astemizole
Abstract
Prion diseases, like Alzheimer’s disease and Parkinson disease, are rapidly progressive neurodegenerative disorders caused by misfolding followed by aggregation and accumulation of protein deposits in neuronal cells. Here we measure intramolecular polypeptide backbone reconfiguration as a way to understand the molecular basis of prion aggregation. Our hypothesis is that when reconfiguration is either much faster or much slower than bimolecular diffusion, biomolecular association is not stable, but as the reconfiguration rate becomes similar to the rate of biomolecular diffusion, the association is more stable and subsequent aggregation is faster. Using the technique of Trp–Cys contact quenching, we investigate the effects of various conditions on reconfiguration dynamics of the Syrian hamster and rabbit prion proteins. This protein exhibits behavior in all three reconfiguration regimes. We conclude that the hamster prion is prone to aggregation at pH 4.4 because its reconfiguration rate is slow enough to expose hydrophobic residues on the same time scale that bimolecular association occurs, whereas the rabbit sequence avoids aggregation by reconfiguring 10 times faster than the hamster sequence.
Prion disease, also known as transmissible spongiform encephalopathy (TSE) is attributed to misfolding followed by ordered aggregation and accumulation of protein deposits in neuronal cells (1–3). According to the “protein-only” hypothesis, the central event in prion (PrP) pathogenesis is the conformational conversion of the cellular α-helical rich isoform, PrPC, into misfolded β-sheet rich isoform, PrPSc (3–6). The infectious form PrPSc is believed to catalyze the conversion of PrPC, thereby permitting transmission between individuals and species (3, 7–10). However, there is very little known about PrPC before ordered aggregation. No putative aggregation precursor structure has been definitively identified; the protein may even be completely unstructured. It is believed that PrPC repeatedly cycles between the cell surface (∼pH 7.0) and endocytic compartment that has a pH as low as 4.4 (11, 12). Aggregated prion has been isolated from this compartment so it has been suggested that aggregation initiates in late endosomes (13, 14). Also, the reduction of the disulfide bridge has been reported to augment misfolding in vitro and may play a significant role in prion pathogenesis (15–20). However, the physical basis for aggregation of prion, particularly under certain solvent conditions, is still poorly understood.
Protein folding is a diffusive search of the unfolded polypeptide chain over the energy landscape in conformational space for a minimum energy state (21). Intramolecular diffusion (diffusion of one part of the chain relative to another) plays a critical role by determining the rate at which an unfolded polypeptide chain finds its native state (22–25). It has been measured for various peptides and proteins by monitoring the contact formation between two probes attached to two distinct sites of the polypeptide chain using quenching or FRET-based methods (26–33). Unstructured peptides, intrinsically disordered proteins and foldable proteins in high denaturant were observed to diffuse rapidly (D ∼10−6 cm2 s−1) (34–38). In contrast, the unfolded polypeptide chains of Protein L and AcBP have been observed to diffuse very slowly, D ∼10−10 and 10−9 cm2 s−1 (39, 40), respectively. These proteins do not readily aggregate. The diffusion coefficient of high aggregation-prone proteins have been observed to be in the middle regime between the two extremes. For example, polyglutamine peptides, the N-terminal domain of HypF and α-synuclein have diffusion coefficients in the range of 10−7–10−8 cm2 s−1 (26, 37, 41). We have hypothesized that the aggregation propensity of a protein is kinetically controlled by intramolecular diffusion of the monomeric protein chain (42). When a disordered protein chain diffuses very rapidly, the probability of stable bimolecular association and subsequent aggregation is limited by the ability of each monomer in a complex to reconfigure to a new, less sticky, conformation. However, aggregation is more likely when reconfiguration is about the same rate as bimolecular diffusion. We recently tested this model of aggregation by correlating intramolecular diffusion with aggregation propensity of α-synuclein under a variety solvent conditions, with mutation and with the use of small molecule inhibitors (26, 43–45).
In the present study, we have investigated intramolecular diffusion of the Syrian hamster and rabbit prion proteins, two sequences with very different propensities to aggregate (46–50). Our results show that both prion sequences diffuse rapidly at high denaturants (6 M GdnHCl) and drops dramatically at low denaturant, accompanied by a slight collapse of the polypeptide chain. Thus, under folding conditions, intramolecular diffusion is as slow as observed for other folding proteins. At pH 4.4, such as found in the endosome, the hamster diffuses in the intermediate regime that has been observed for other aggregation-prone sequences, but rabbit diffuses in the fast regime observed for non-aggregation-prone disordered sequences. Furthermore, the addition of astemizole, an antihistamine drug which was previously reported as an anti-prion candidate (51), to the hamster sequence appears to speed up diffusion of the protein chain out of aggregation prone regime. Therefore, the prion protein is observed to occupy all diffusive regimes under different conditions and with sequences from different species. Our results suggest how this protein, by sampling different conditions in the cell, may proceed from monomer to pathogenic oligomers and how oligomerization may be halted by inhibitors.
Results
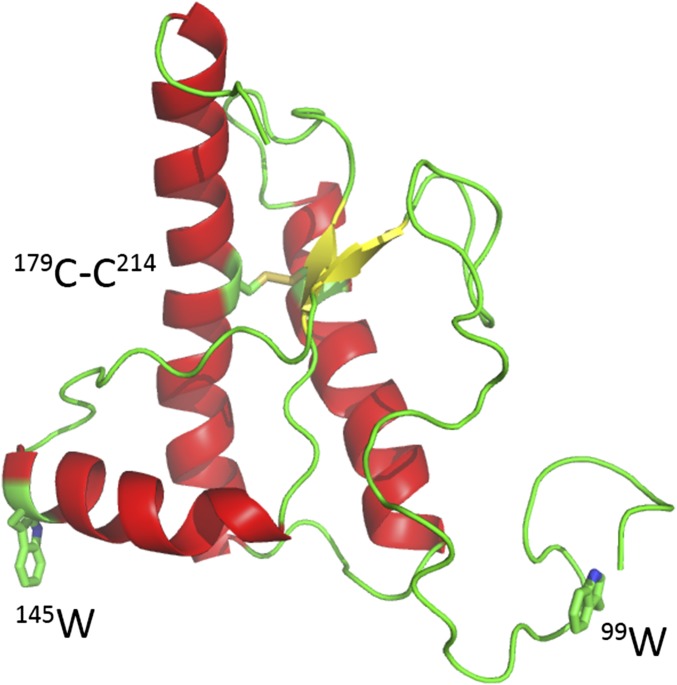
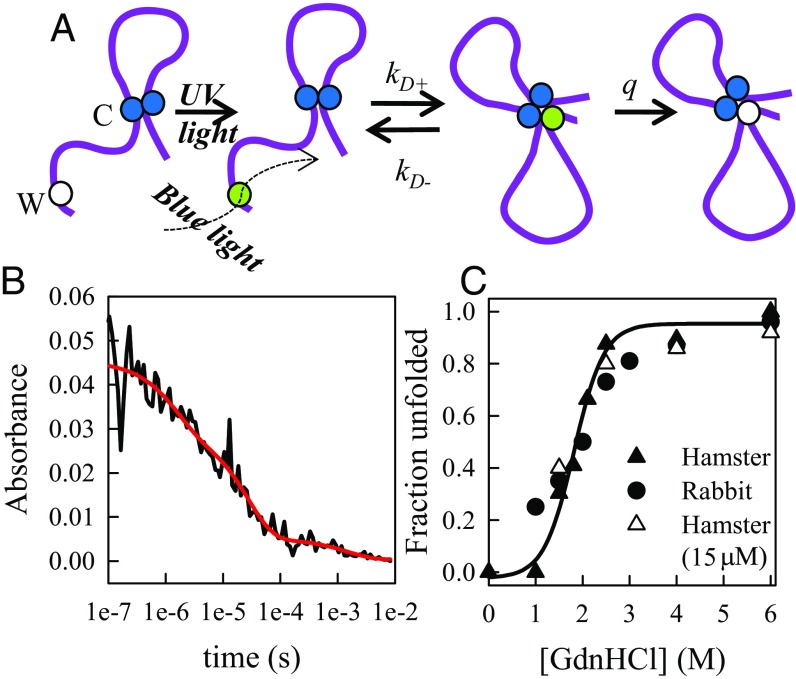
We have investigated intramolecular diffusion of recombinant prion (90–231) by measuring the rate of contact quenching of a probe, the long-lived tryptophan triplet state, by a quencher, cysteine. The tryptophan triplet state lives for 40 μs in water but the lifetime can be shortened to <100 ns in close proximity to cysteine (25). Fig. 1 illustrates the positions of the Trp and Cys in the folded structure; each pair is at least 26 Å apart. Measurement of the Trp triplet quenching, by a close proximity of Cys, measures the intramolecular diffusion of the unfolded polypeptide chain, as illustrated in Fig. 2A. The data, an example of which is shown in Fig. 2B, were fitted to up to three exponential decays, where the fast, microsecond, decay originates from rapid quenching of Trp triplet by Cys and the slow, millisecond, decay is due to photophysical and optical artifacts. Under conditions in which the folded state is stable (<3 M GdnHCl at pH 7.0), a third, middle decay is present at the natural lifetime of Trp in water, which represents the Trp decaying without making contact with a Cys because the folded structure keeps them apart (>6 Å). The ratio of the fast and medium decay amplitudes serves as a measure of the folded state stability and is shown in Fig. 2C. The denaturation midpoint agrees well with that measured by Jenkins et al. using Trp fluorescence (52). In this work, we focus on the fast phase which represents the rate of intramolecular diffusion between Trp and Cys.
Fig. 1.
Cartoon representation of hamster prion protein structure (Protein Data Bank ID 2PRP).
Fig. 2.
Measurement of intramolecular diffusion. (A) Schematic of Trp–Cys quenching in the prion. The white ball (Trp) is excited to a long-lived triplet state (green) by a pulse of UV light and probed by transient absorption of blue light. The protein undergoes intramolecular diffusion between the Trp and Cys–Cys disulfide bond (blue balls) until the Cys–Cys quenches the Trp upon close contact and it returns to the ground state (white ball). (B) Typical kinetics of the Trp triplet state at pH 7, 1.5 M GdnHCl, 10 °C as probed by absorption of light at 450 nm. The red line is the fit to three exponentials. The fastest decay represents the Trp triplet lifetime due to quenching in the unfolded state, the medium rate represents the Trp triplet lifetime in the absence of quenching in the folded state, and the slowest decay is due to photophysical effects. (C) The fractional unfolded population vs. [GdnHCl]. The fraction is calculated as AFast/(AFast + Amed), where AFast and Amed are the amplitudes of the fast and medium decays, as shown in B. The black symbols were measured at 30 μM, and the white symbols were measured at 15 μM.
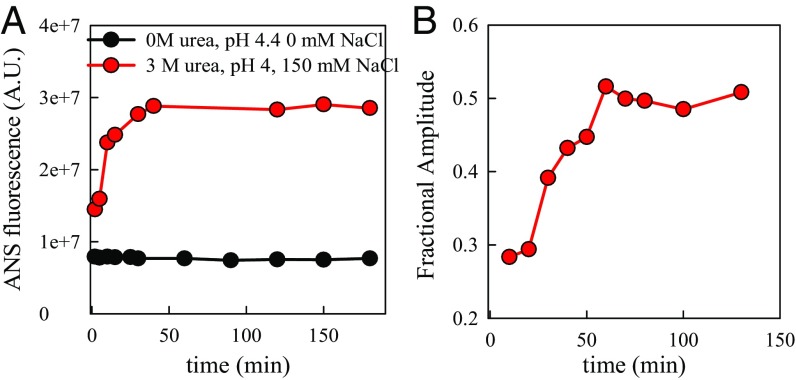
We attempted to observe if any aggregated species were present during these measurements. The data were acquired within 20 min after preparation, well within the aggregation lag time, so significant oligomer formation is unlikely during data acquisition. Oligomers of the hamster protein are observed under strongly aggregating conditions (3 M urea, pH 4, 150 mM NaCl) by an increase in fluorescence of 8-anilinonaphthalene-1-sulfonic acid (ANS), as shown in Fig. S1A. Such an increase is not observed under the most likely aggregation conditions (0 M urea, pH 4.4, 0 mM NaCl), used in the Trp–Cys quenching measurements. If stable, structured oligomers were present during the Trp–Cys measurement, they would also contribute to the medium decay phase under aggregating conditions because intramolecular diffusion would be suppressed. Trp–Cys quenching in pH 7 with various concentrations of denaturant but at half the protein concentration normally used shows the same relative amplitudes of the fast and medium phases observed at full concentration (Fig. 2C), indicating that under these conditions the medium phase is due to folded structure. Fig. S1B shows the growth of such a phase over time under the same strongly aggregating conditions used for ANS fluorescence. However, no medium phase is observed for pH 4.4, 0 mM NaCl, at any time. Altogether, the data strongly suggest that structured oligomers are not a significant population during the Trp–Cys measurement. In any case, the observations reported below are for protein chains undergoing rapid intramolecular diffusion.
Fig. S1.
(A)Total ANS fluorescence vs. time of prion at two different solution conditions as marked. (B) Fractional amplitude of medium phase compared with the total amplitude of the Trp triplet state vs. time in 3 M urea, pH 4, 150 mM NaCl, and T = 30 °C.
The observed Trp triplet rate can be modeled as a two-step process, based on the scheme in Fig. 2A, and the decay rate can be expressed by
| [1] |
The equation can be further rearranged:
| [2] |
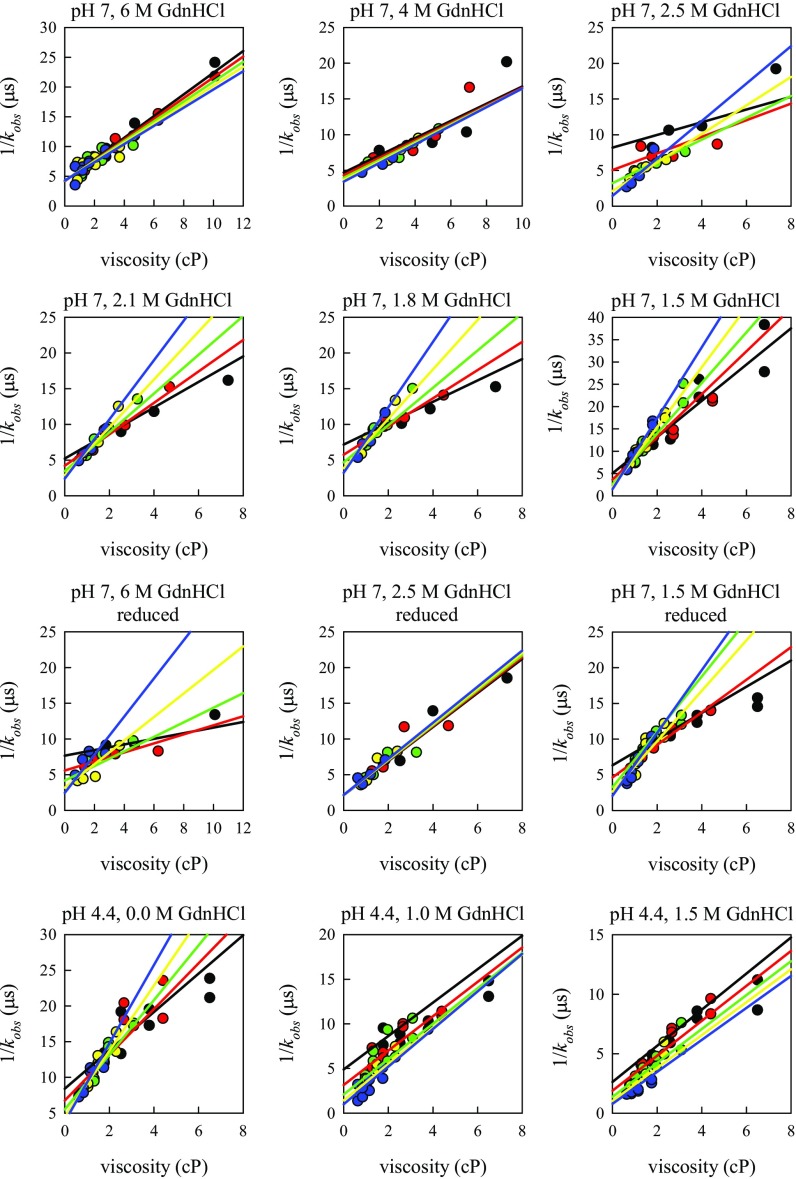
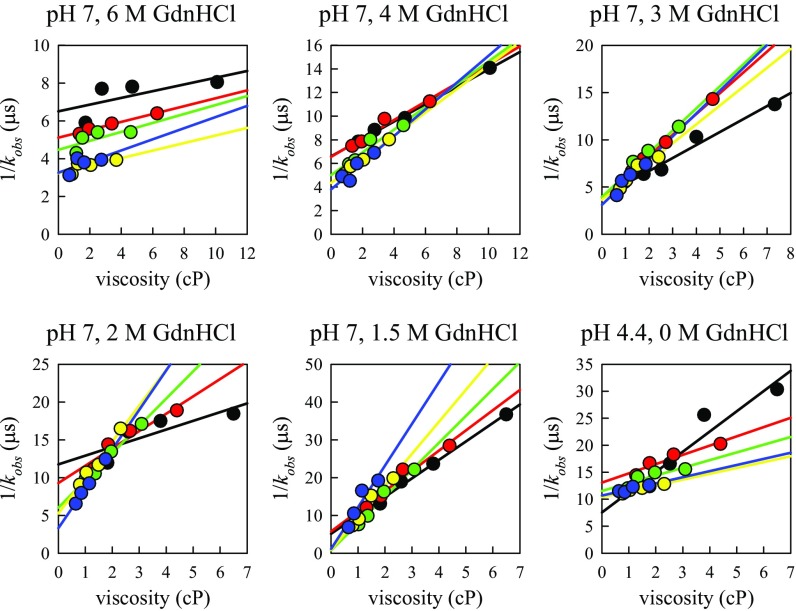
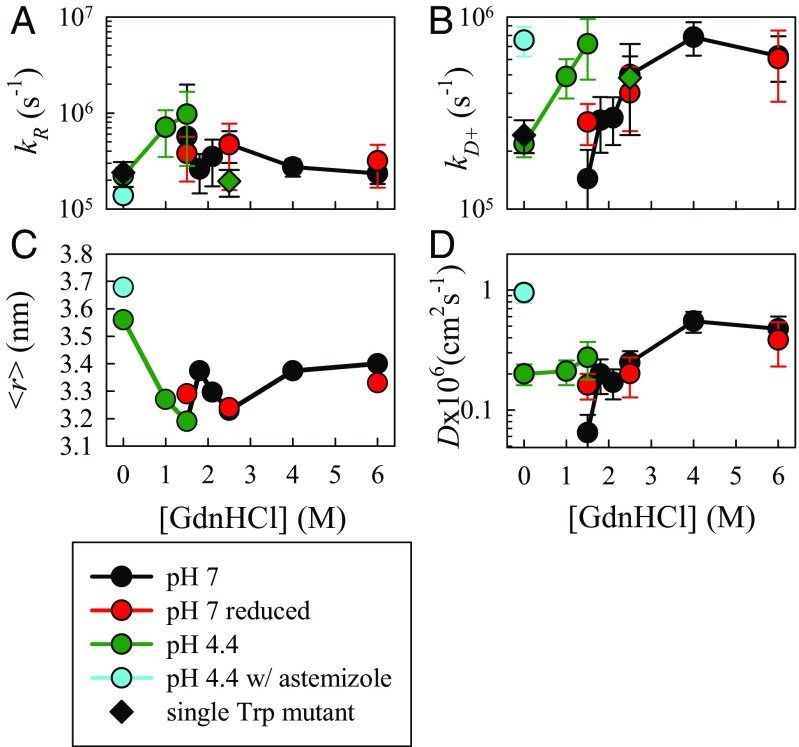
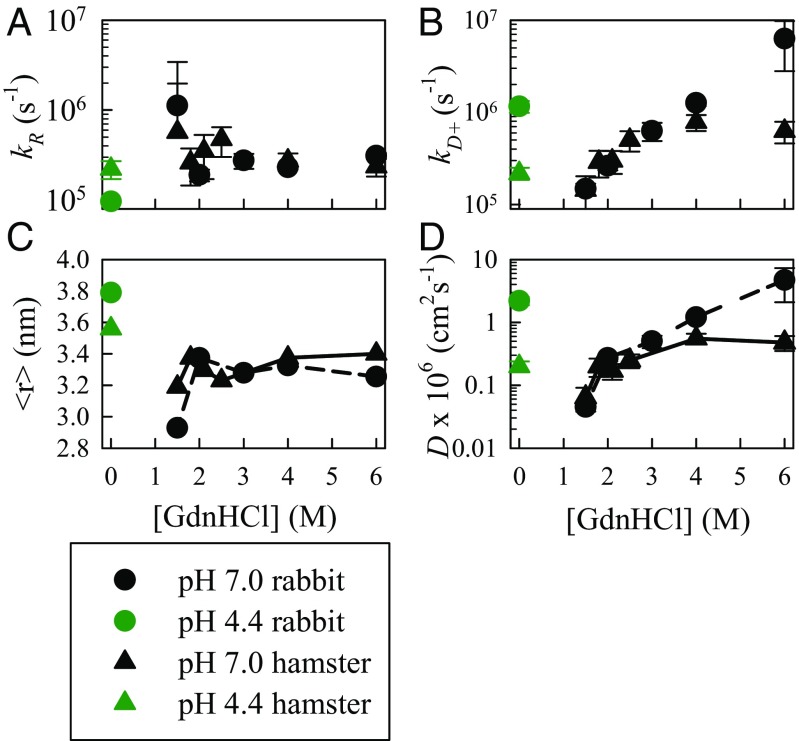
where the reaction-limited (kR) rate depends only on temperature, and the diffusion-limited (kD+) rate depends on both temperature and viscosity (η) of the solution. Measurements at various viscosities at the same temperature can be fitted to a line in which the intercept is 1/kR and the slope is 1/ηkD+. Measurements of kobs were carried out at five different temperatures and at different viscosities by adding sucrose to the buffer. For the hamster sequence, all of the data for each buffer condition are globally fit to a model described in SI Text and are plotted in Figs. S2 and S3. For the rabbit sequence, data at each temperature was fit to a line and plotted in Fig. S4. Experiments were performed at pH 7 and pH 4.4 with various concentrations of denaturant and sometimes in the presence of a reducing agent. The values of kR and kD+ at 30 °C and in different solvent conditions are plotted in Fig. 3 A and B for hamster, and Fig. 4 A and B for rabbit prion protein.
Fig. S2.
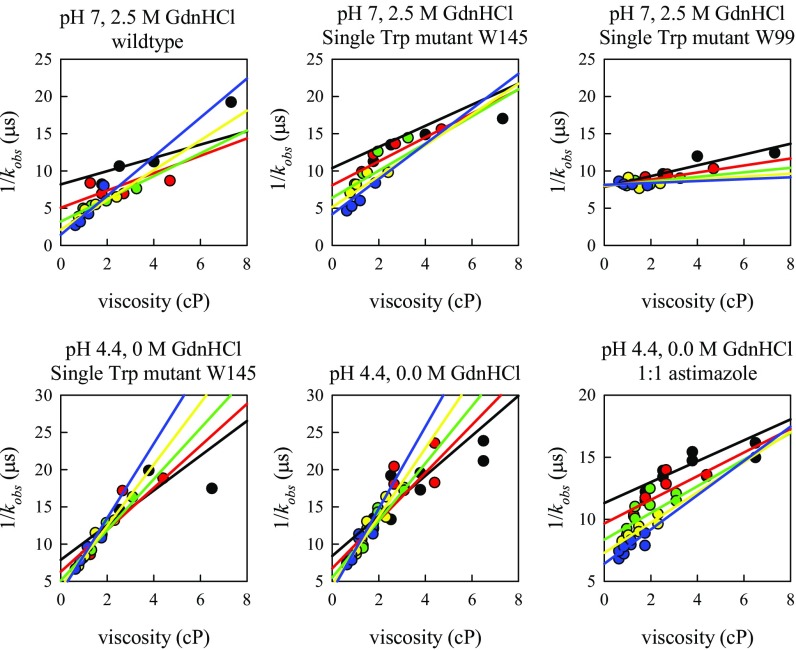
Plots of observed decay times of hamster prion versus viscosity at different temperatures for all of the conditions shown in Fig. 3. The lines are the fits to the model in Eqs. S1 and S2. Black circles, T = 0° C; red circles, T = 10° C; green circles, T = 20° C; yellow circles, T = 30° C; blue circles, T = 40° C.
Fig. S3.
Comparison of Trp–Cys measurements of the hamster wt and single Trp mutants. Black circles, T = 0° C; red circles, T = 10° C; green circles, T = 20° C; yellow circles, T = 30° C; blue circles, T = 40° C.
Fig. S4.
Plots of observed decay times of rabbit prion versus viscosity at different temperatures for all of the conditions shown in Fig. 3. The lines are the fits to independent linear fits at each temperature. Black circles, T = 0° C; red circles, T =10° C; green circles, T = 20° C; yellow circles, T = 30° C; blue circles, T = 40° C.
Fig. 3.
Trp–Cys quenching rates of hamster prion measured under various solvent conditions at 30 °C. (A) Measured reaction-limited rates. (B) Measured diffusion-limited rates. The error bars in A and B were determined as discussed in SI Text. Circles represent the wild-type sequence and diamonds represent the Trp145 mutant. (C) Average Trp–Cys distance, , calculated from the energy reweighted WLC model for various conditions that best fit the measured reaction-limited rates using Eq. S7. (D) Effective intramolecular diffusion coefficients determined from Eq. S8.
Fig. 4.
Trp–Cys quenching rates of rabbit (circles) and hamster (triangles) prions measured under various solvent conditions at 30 °C. (A) Measured reaction-limited rates. (B) Measured diffusion-limited rates. (C) Average Trp–Cys distance calculated from the energy reweighted WLC model for various conditions that best fit the measured reaction-limited rates using Eq. S7. (D) Effective intramolecular diffusion coefficients determined from Eq. S8.
To understand the meaning of kR and kD+, we use Szabo, Schulten, and Schulten (SSS) theory (53), which models the motion of an unfolded protein as diffusion on a one dimensional potential determined by the probability distribution, P(r) of Trp–Cys distances. SI Text describes how these rates are calculated from the theory and the energy reweighted wormlike chain model used to calculate the P(r), the average Trp–Cys distance, <r>, plotted in Figs. 3C and 4 C and D, plotted in Figs. 3D and 4D for hamster and rabbit prion protein, respectively.
Hamster Prion.
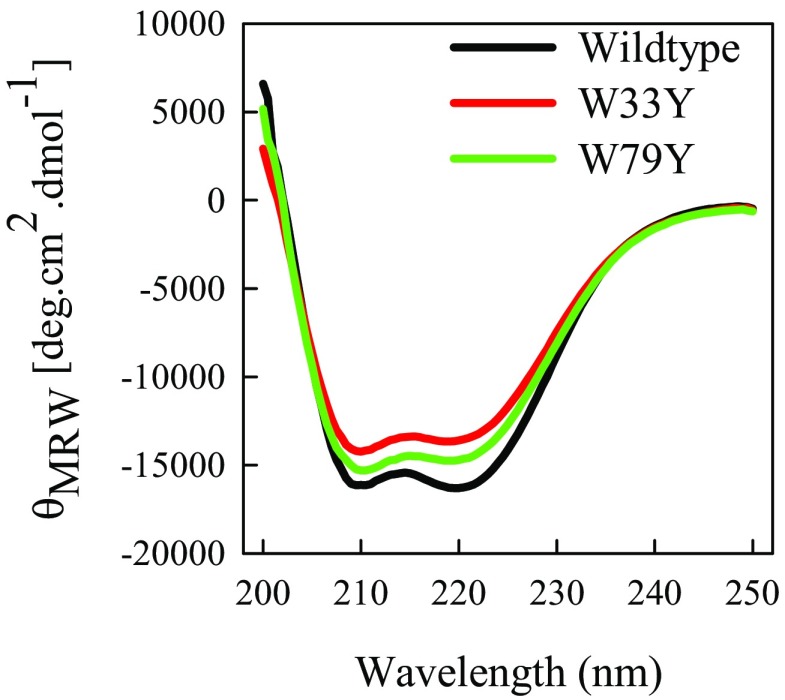
Ideally, this type of experiment should only have one Trp and one Cys in the sequence, but the hamster prion contains two tryptophans, at positions 99 and 145, and two cysteines, at positions 179 and 214. Thus, the possible Trp–Cys loops that may be observed are 34, 69, 80 and 115 residues. The 69 and 115 loops are irrelevant when the two cysteines are disulfide bonded (cystine is as potent a quencher as cysteine) (25). To identify the contributions of the two tryptophans, we prepared two mutants having a single tryptophan in each position, by mutating the other tryptophan with tyrosine. Both of these mutations have a minimal loss of structure, as measured by CD in Fig. S5. Trp–Cys quenching experiments were carried out with both mutants at 2.5 M GdnHCl and the results are summarized in Fig. S3. The 99W mutant shows a very different temperature dependence from the wild-type (wt), with kR holding constant and kD+ increasing significantly with temperature, similar to that observed for unstructured peptides, whereas 145W has a similar temperature dependence to the wt with kR increasing and kD+ decreasing with temperature. At 30 °C, kD+ = 5.1 × 10⁶ s−1 for 99W, 10× higher than that measured for the wt and 145W. This rate suggests that 99W acts as if it is in a completely unstructured peptide, as might be expected because it is in the region of the chain that does not fold. In contrast, the reaction-limited and diffusion-limited rates for 145W are in agreement with the wt, as shown in Fig. 3 A and B. Altogether, the results indicate that 145W is the only probe sensitive to protein folding and is mainly contributing in the observed Trp–Cys quenching rates for wild type hamster prion protein.
Fig. S5.
CD spectra of the wt, W33Y, and W79Y sequences at pH 7, 25 °C.
The observed fastest diffusion coefficients, in high denaturant, are similar to those measured for unstructured peptides and proteins (34–37, 54). The slowest diffusion coefficient, observed for pH 7, 1.5 M GdnHCl, the lowest possible denaturant concentration in which the measurement of unfolded state dynamics could be achieved, is an order of magnitude slower and similar to other foldable proteins near their denaturation midpoint (33). To elucidate the role of the disulfide bridge in prion misfolding and aggregation, we performed measurements on the reduced protein at pH 7.0 and various denaturant concentrations. At 6 M and 2.5 M GdnHCl, diffusion for both reduced and oxidized proteins are the same, but at 1.5 M, the diffusion for the reduced protein does not decrease as dramatically as the nonreduced protein. This suggests that the formation of the loop between the cysteines facilitates transient contacts that may be necessary for folding.
There is growing evidence that low pH has a role in prion pathogenesis, particularly at about pH 4, the condition of late endosomes, so we measured Trp–Cys quenching at pH 4.4 at several denaturant concentrations. Previous studies had suggested the protein formed a molten globule at low pH (55–58). Surprisingly, at pH 4.4, the Trp triplet decays remain single-exponential even at 0 M GdnHCl, suggesting the protein is freely diffusing and there is no stable structure. The diffusion coefficients at pH 4.4 in the presence of 0–1.5 M GdnHCl are similar to that of the reduced protein at the same denaturant concentration, but the average Trp–Cys distance at pH 4.4 increases as denaturant is reduced. We used the condition at pH 4.4, 0 M GdnHCl to investigate the effect of astemizole, an antihistamine drug, recently found to exhibit anti-prion activity and prolong the survival of prion-infected mice (51). The physical basis of the mechanism of this drug is unknown as is the binding site. At a 1:1 ratio of astemizole to protein, we find the size of the protein chain significantly expanded and the diffusion coefficient is significantly higher than without the astemizole. Astemizole is a multiring molecule with a fluorine atom. One possible mechanism of astemizole is that this molecule binds to either aromatic residues or hydrogen donors (i.e., asparagine, glutamine and tyrosine) within the unfolded chain preventing nonlocal residues from making contact. This lack of nonlocal interactions would tend to open up the chain and make it more diffusive.
Rabbit Prion.
The rabbit sequence contains only one tryptophan, 99W. As with the hamster sequence, this position is not sensitive to protein folding and exhibits rapid kobs even at 0 M GdnHCl. Therefore, we made a double mutation to the rabbit sequence, W99Y Y145W to place the Trp in the same position as the hamster sequence. Based on the relative amplitudes of the fast phase at various GdnHCl concentrations, the denaturation midpoint for hamster and rabbit are very similar (Fig. 2C). Thus, we expect the reaction-limited and diffusion-limited rates, average Trp–Cys distance and diffusion coefficients for both sequences to be similar at pH 7. Indeed that is what we observe with the curious exception of very high denaturant in which kD+, and consequently D, for hamster is not as high as for rabbit. In contrast, at pH 4.4, the rabbit sequence is significantly different from the hamster, with <r> ∼10% higher and D ∼10× higher, even higher than hamster with astemizole. This higher diffusion coefficient puts in within the fast, safe regime.
SI Text
ANS Fluorescence.
ANS was purchased from Sigma Aldrich. Fluorescence measurements were made in 1-cm path-length quartz cuvette on a PTI spectrofluorimeter (Photon Technology International) at 25 °C, and with excitation wavelength of 385 nm, and emission at 440–600 nm. To monitor the kinetics of oligomer formation, 25 µM prion protein were incubated at 30 °C in either 3.5 M Urea, 150 mM NaCl, 20 mM sodium acetate, pH 4.0 or in 20 mM sodium acetate, pH 4.4. During the time course of oligomer formation, aliquots of incubated samples were 20 times diluted into acetate buffer, pH 4.0, and further incubated with 20 µM ANS for 5 min, before monitoring the fluorescence. The total fluorescence at each time point is plotted in Fig. S1.
Extraction of Reaction-Limited and Diffusion-Limited Rates (Hamster Prion).
Data were collected at five different temperatures and four different sucrose concentrations. Observed decay times (1/kobs), at pH 7.0 or pH 4.4 in presence or absence of denaturants and reducing agent, are plotted vs. viscosity (η) in Figs. S2 and S3. Based on Eq. 2, we assume the data at each temperature (T) can be fit to a line y = 1/kR+η/kD+, where the intercept and slope are given by
| [S1] |
| [S2] |
where T0 = 293 K and R is the gas constant. E1, E2, kR0, and kD+0 are fitting parameters. The data in Fig. 3 A and B are calculated from Eqs. S1 and S2 for T = 303 K (30 °C) and the error bars are calculated from the SEs of linear fits
| [S3] |
| [S4] |
| [S5] |
| [S6] |
where N is the number of data points per line, y is the calculated lifetime and 1/kobs is the measured lifetime.
Calculation of Diffusion Coefficients.
SSS theory gives the reaction-limited and diffusion-limited rates as
| [S7] |
| [S8] |
where D is the intramolecular diffusion coefficient, r is the distance between 145W and 179C, dα is the distance of closest approach (4 Å) and lc is the contour length of the protein between 145W and 179C. q(r) is the distance-dependent quenching rate and has been experimentally measured to be very short range (63). Generally, kR and kD+ are both inversely proportional to the average volume of the chain and kD+ is proportional to D.
To calculate D, we require the probability distribution P(r), which can be determined from a variety of polymer models. Here we use an energy reweighted wormlike chain model (54). The energy reweighted wormlike chain model starts with 20 million chains constructed by a Monte Carlo method with a persistence length of 4 Å and an excluded volume diameter of 4 Å. These chains are 90 residues long to simulate the dynamics between residues 90 and 180. This model does not simulate the disulfide loop well so it is left out here. This probability distribution produces a set of expanded chains, yielding a low reaction-limited rate using Eq. S7, so we reweight the distribution toward more compact conformations by assigning an energy for each chain based on favorable close-range interactions between residues of similar hydrophobicity
| [S9] |
where the hydropathy, h, for each residue in the sequence is given using the Miyazawa-Jernigan scale. We assume that two residues with h values within 30% of each other contribute to hydrophobic or hydrophilic interactions, reducing the free energy of the system and therefore making conformations containing such interactions favorable. We also apply a distance cutoff to EH such that EH = 0 for |ri − rj| > 6.5 Å.
To account for charge interactions, we find the charge, q, on each residue at the appropriate pH using the Henderson–Hasselbach equation and calculate the Coulombic energy:
| [S10] |
γ and σ are adjustable parameters for the Coulombic and hydrophobic interactions, respectively. Using the total interaction energy ETOT = EH + Ee, we can reweight the probability distribution P(r) to yield a new distribution Z(r),
| [S11] |
The reaction-limited rate is calculated using Eq. S7 and substituting Z(r) for P(r). This model has two free parameters, σ and γ, but only one kR at each condition to constrain them. However, we know that the charge energies, Ee, at pH 7 and pH 4.4 will be different due to protonation of histidine, glutamic acid and aspartic acid. We assume that the hydrophobic energies, EH, do not change with pH. Therefore, we use the ratio of kR at 1.5 M GdnHCl for pH 7 and pH 4.4 to find the appropriate value of γ, keep this value the same for all conditions, and vary σ to exactly match each measured kR. Table 1 shows the appropriate values of σ and γ for each solvent condition, Fig. 3C shows the average distance, , and Fig. 3D shows the resulting D.
Table 1.
Parameters of energy-reweighted WLC model
| Solution condition | σ | γ | K |
| Hamster | |||
| pH 7, 6 M GdnHCl | 1.4 | 5 | 0.32 |
| pH 6, 4 M GdnHCl | 1.5 | 5 | 0.30 |
| pH 7, 2.5 M GdnHCl | 2.0 | 5 | 0.14 |
| pH 7, 2.1 M GdnHCl | 1.8 | 5 | 0.24 |
| pH 7, 1.8 M GdnHCl | 1.5 | 5 | 0.30 |
| pH 7, 1.5 M GdnHCl | 2.2 | 5 | 0.11 |
| pH 7, 6 M GdnHCl, reduced | 1.7 | 5 | 0.23 |
| pH 7, 2.5 M GdnHCl, reduced | 2.0 | 5 | 0.14 |
| pH 7, 1.5 M GdnHCl, reduced | 1.8 | 5 | 0.19 |
| pH 4.4, 1.5 M GdnHCl | 2.2 | 5 | 0.046 |
| pH 4.4, 1.0 M GdnHCl | 1.9 | 5 | 0.070 |
| pH 4.4, 0 M GdnHCl | 0.80 | 5 | 0.31 |
| pH 4.4, 0 M GdnHCl, astemizole | 0.35 | 5 | 0.53 |
| Rabbit | |||
| pH 7, 6 M GdnHCl | 1.9 | 5 | 0.11 |
| pH 7, 4 M GdnHCl | 1.6 | 5 | 0.17 |
| pH 7, 3 M GdnHCl | 1.8 | 5 | 0.13 |
| pH 7, 2 M GdnHCl | 1.4 | 5 | 0.21 |
| pH 7, 1.5 M GdnHCl | 3.4 | 5 | 0.017 |
| pH 4.4, 0 M GdnHCl | −0.2 | 5 | 1.03 |
CD.
Far-UV CD measurements were carried out with an AppliedPhotophysics Chirascan spectropolarimeter equipped with a thermostated cell holder. The spectra were acquired at the protein concentration of 15 μM, 25 °C, using a 1-mm path-length cell, and 1-nm bandwidth. For each sample, base lines were subtracted and three scans were averaged. The results are plotted in Fig. S5.
Discussion
In this work we have investigated the dynamics of unfolded hamster and rabbit prions under a variety of conditions, ranging from those that do not exhibit aggregation (high denaturant or with an inhibitor) to those that do, (reducing conditions and low pH for the hamster sequence). As seen if Figs. 3D and 4D, the diffusion coefficients extracted from the measurements of Trp–Cys quenching cover more than an order of magnitude. Because the protein folds at low denaturant concentrations at pH 7, we could not observe intramolecular diffusion in equilibrium under folding conditions. However, if we were to extrapolate the trend line in Fig. 3D or 4D for the oxidized protein at pH 7.0 M GdnHCl, we would expect diffusion to be about 10-fold lower than measured at 1.5 M GdnHCl, D ∼10−8 cm2 s−1. This estimate is in agreement with the diffusion coefficients measured in a mixer for ACBP and protein L(33). Thus, these results illuminate three distinct regimes of diffusion coefficients for the hamster sequence: (i) D ≥ 3 × 10⁻⁷ cm2 s−1 in which the protein is not prone to aggregation (6 M GdnHCl and with astemizole). (ii) D ∼1–3 × 10⁻⁷ cm2 s−1, in which the hamster sequence is prone to aggregation (pH 4.4 and pH 7, 1.5 M GdnHCl under reducing conditions). In contrast, the rabbit sequence at pH 4.4 exists in the fast regime, D ≥ 3 × 10⁻⁷ cm2 s−1. (iii) D < 10−7 cm2 s−1 in which the protein is also not prone to aggregation (pH 7, <1.5 M GdnHCl, nonreducing conditions).
A simple model can explain these three regimes. Imagine that the ensemble of monomeric unfolded prion conformations can be divided into two populations connected by intramolecular diffusion, M, which is not aggregation prone, and M*, which is aggregation prone, likely because one or more hydrophobic residues are solvent exposed. If two M* come into contact through bimolecular diffusion, the encounter complex may come apart if one monomer can reconfigure to M through intramolecular diffusion. Otherwise, the encounter complex can convert to the first oligomer, O. The following kinetic model can express this scenario:
| [3] |
A full description of this model with all possible encounter complexes is described in ref. 45. If the stability of these other complexes is sufficiently low, the full model reduces to Scheme 3. Solving this model produces three regimes. For k−1 >> kbi formation of O is slow because the monomers can escape from the encounter complex by reconfiguration. For k−1 << kbi and a low equilibrium K = [M*]/[M], formation O is slow because few [M*M*] will be formed. However, when k−1 ∼ kbi, then formation of O is rapid. The fast and medium diffusion coefficient regimes have been investigated previously in α-synuclein (26, 43, 44), but the prion protein exhibits dynamics in all three regimes. After formation of the oligomer, reconfiguration has less impact on subsequent aggregation steps. Any number of nucleation and elongation models may be included with Scheme 3, but because all require the formation of a dimer as the first step, reconfiguration will kinetically control all of them.
To solve this model we must assign values for all of the rates and find the equilibrium constant under all conditions. The equilibrium constant is difficult to assess experimentally but we can estimate it from the energy-reweighted WLC model as . Fig. 5B shows that the average energy increases monotonically with distance, producing a greater weight for shorter distances than longer distances and shifting the probability to shorter Trp–Cys distances as illustrated in Fig. 5A. Thus, by simply taking the difference of the energy of the shortest to the longest distance, we can estimate the equilibrium constants for each solution condition, shown in Table 1. We assume the reconfiguration rate, k1 + k−1 = D/Ro2 where Ro ∼30 Å, a reasonable distance that two parts of the backbone may diffuse across, and kbi = 5 × 10⁵ s−1, a reasonable value for bimolecular diffusion of two protein chains at a concentration of 100 μM. We assume kO = 100 s−1 for computational speed. This rate will only affect the overall oligomerization rates for all solution conditions, not the differences between them. As long as this rate is much slower than the diffusion rates, it does not qualitatively change the results.
Fig. 5.
Modeling of the unfolded ensemble and resulting aggregation. (A) Probability distributions calculated from the energy reweighted wormlike chain model for two solvent conditions. (B) Reweighted energies for various values of γ and σ as marked. The change in energy ΔETOT is calculated as the difference between the energies at 7 and 1 nm. (C) Calculated oligomer (O) formation rates using Scheme 3 for rates representing pH 7, 1.5 M GdnHCl (green); pH 4.4, 0 M GdnHCl (red); pH 4.4, 0 M GdnHCl, 1:1 astemizole (blue); and pH 4.4, 1.5 M GdnHCl (cyan). The starting conditions were determined by the equilibrium K = [M*]/[M] and all other species had zero concentration.
For the hamster sequence at pH 4.4 with astemizole, K = 0.53 and k1 + k−1 = 12 × 106 s−1, whereas without astemizole, K = 0.31, k1 + k−1 = 2.8 × 10⁶ s−1. For pH 7, 1.5 M GdnHCl, the conditions closest to native that we could measure, K = 0.11, k1 + k−1 = 1.1 × 10⁶ s−1 for hamster.. The calculated concentrations of the oligomeric species, O, vs. time are plotted for all three of these conditions in Fig. 5C. Although it was impossible to measure D for pH 7, 0 M GdnHCl, we can estimate by extrapolating from 1.5 M GdnHCl that D = 10−8 cm2/s and k1 + k−1 = 4 × 10⁴ s−1. This diffusion coefficient is very close to the measurements of intramolecular diffusion using single molecule force spectroscopy and assuming a Kramers model of diffusion over a barrier (59, 60). Assuming K = 1.4 × 10⁻⁴ (σ = 2.2; γ = 0), the oligomerization rate and fibrillization lag time will be immeasurably slow.
One curious exception to the general regimes laid out above is the dynamics exhibited for hamster at pH 4.4, 1.5 M GdnHCl. As at pH 4.4, 0 M GdnHCl for hamster, the diffusion is in the middle regime, k1 + k−1 = 3.3 × 10⁶ s−1, but the chain is surprisingly compact, yielding K = 0.046. Solving for this condition gives oligomerization that is much slower than pH 7, 1.5 M GdnHCl, as shown in Fig. 5C. This is consistent with ThT kinetics measured by Baskakov et al. which measured about a 10-fold longer lag time for pH 4.1 than for pH 6–7 (61) and suggests that formation of fibrils is ultimately controlled by intramolecular diffusion under a variety of conditions, despite other possible differences in nucleation and elongation rates. However, there is no consistent model of the unfolded ensembles that can predict the conformational changes we observe with pH and denaturant.
In summary, the prion protein is the first protein measured to exhibit reconfiguration kinetics of the protein chain in all three dynamic regimes. We conclude that the source of aggregation in the cell is likely the low pH endosomes due to the reconfiguration rate of the hamster sequence in the middle regime at pH 4.4. The difference between the hamster and rabbit prion aggregation propensity results from the differences in reconfiguration rates for these two sequences. Although the average Trp–Cys distance between these two sequences is fairly small, the equilibrium constants are very different, K ∼0.31 and K ∼1.0, respectively. These differences imply that the rabbit sequence has less transient intermolecular interactions than hamster, which may explain the 10-fold higher diffusion coefficient. We observe no evidence for any structured conformation at this pH, which suggests that treatment strategies that stabilize the folded state may not be useful in the endosome. On the other hand, if diffusion can be raised by use of a drug such as astemizole, then initiation and perhaps transmission of TSE may be avoided. However, based on the measurements at pH 4.4, 1.5 M GdnHCl, an even more effective strategy may be to find a molecule, such as an osmolyte, that shifts the equilibrium to less aggregation-prone states.
Materials and Methods
Prion Protein Expression and Purification.
The plasmid encoding hamster prion (90–231), with an N-terminal linker including His-6 tail and a thrombin cleavage site, was a kind gift from Michael T. Woodside, University of Alberta, Canada. Mutants were constructed by site-directed mutagenesis using appropriate primers and QuikChange kit (Quiagen). The hamster prion (90–231) protein were expressed in BL21(DE3) Escherichia coli cells grown in LB medium. The plasmid encoding rabbit prion both wt and double mutants W99Y Y145W were synthesized by GenScript. The rabbit prion protein were expressed in BL21(DE3) pLysS Ecoli cells grown in terrific broth medium. Harvested cell pellets were then sonicated, subsequently loaded and refolded over Ni-NTA column using FPLC (GE Healthcare) machine. The refolded prion proteins were then treated with thrombin to remove the His-6 tag and the resulting protein were further purified using cation exchange column, according to previously described protocol (62). Purity and identity of protein were checked by MALDI and SDS PAGE and folding into native structure was verified by far UV CD spectroscopy.
Measurement of Intramolecular Diffusion by Trp–Cys Quenching.
To extract the rates, experiments were carried out in a particular buffer varying in viscosity [0, 10, 20, or 30% sucrose (wt/wt)] and the data were acquired at five different temperature (0–40 °C) for each viscosity. Initially, the solution without the protein was bubbled with N2O for 1 h, to eliminate oxygen and scavenge solvated electrons created in the UV laser pulse. The samples were prepared by 10-fold dilution from 300 μM purified protein stock into the degassed buffer solution and then degassed for 10 min over ice. The buffer solution used in the study was either 20 mM sodium acetate (pH 4.4) or sodium phosphate (pH 7.0) buffer, prepared at different concentrations of GdnHCl. TCEP (Tris(2-carboxyethyl)phosphine hydrochloride), a reducing agent which breaks the disulfide bond, was added for a 1 mM final concentration, to examine the dynamics of reduced prion monomer. For some experiments, astemizole in 1:1 equivalent to protein concentration was added, along with the protein in the buffer, to investigate the effect of its binding over prion intramolecular dynamics.
Kinetics of Trp triplet lifetime decay, due to quenching Cys in close proximity, was measured using an in-house instrument described previously (38). Briefly, the Trp triplet was excited at 289 nm by a 10-ns laser pulse created from the fourth harmonic of an Nd:YAG laser (Continuum) and a 1-m Raman cell filled with 450 psi of 2H gas. The population of triplet state was probed at 441 nm by a HeCd laser (Kimmon). Silicon detectors were used to measure the probe and the reference beams and then combined in a differential amplifier (DA 1853A; LeCroy) with an additional stage of a 350-MHz preamplifier (SR445A; Stanford Research Systems). The total gain was 50-fold. The temperature was controlled using a Peltier controller. Solvent viscosities at individual temperatures were measured with a viscometer (Brookfield Engineering).
Acknowledgments
We thank Michael Woodside for the kind gift of the prion plasmid, Terry Ball for assistance in expression and purification, and Ahmed Yousif for assistance with wormlike chain modeling. This work is supported by NIH Grant R01 GM100908.
Footnotes
The authors declare no conflict of interest.
This article is a PNAS Direct Submission.
This article contains supporting information online at www.pnas.org/lookup/suppl/doi:10.1073/pnas.1620400114/-/DCSupplemental.
References
- 1.Liemann S, Glockshuber R. Transmissible spongiform encephalopathies. Biochem Biophys Res Commun. 1998;250(2):187–193. doi: 10.1006/bbrc.1998.9169. [DOI] [PubMed] [Google Scholar]
- 2.Prusiner SB. Novel proteinaceous infectious particles cause scrapie. Science. 1982;216(4542):136–144. doi: 10.1126/science.6801762. [DOI] [PubMed] [Google Scholar]
- 3.Prusiner SB. Prions. Proc Natl Acad Sci USA. 1998;95(23):13363–13383. doi: 10.1073/pnas.95.23.13363. [DOI] [PMC free article] [PubMed] [Google Scholar]
- 4.Cohen FE, et al. Structural clues to prion replication. Science. 1994;264(5158):530–531. doi: 10.1126/science.7909169. [DOI] [PubMed] [Google Scholar]
- 5.Horwich AL, Weissman JS. Deadly conformations--protein misfolding in prion disease. Cell. 1997;89(4):499–510. doi: 10.1016/s0092-8674(00)80232-9. [DOI] [PubMed] [Google Scholar]
- 6.Pan KM, et al. Conversion of alpha-helices into beta-sheets features in the formation of the scrapie prion proteins. Proc Natl Acad Sci USA. 1993;90(23):10962–10966. doi: 10.1073/pnas.90.23.10962. [DOI] [PMC free article] [PubMed] [Google Scholar]
- 7.Gajdusek DC, Gibbs CJ, Alpers M. Experimental transmission of a Kuru-like syndrome to chimpanzees. Nature. 1966;209(5025):794–796. doi: 10.1038/209794a0. [DOI] [PubMed] [Google Scholar]
- 8.Griffith JS. Self-replication and scrapie. Nature. 1967;215(5105):1043–1044. doi: 10.1038/2151043a0. [DOI] [PubMed] [Google Scholar]
- 9.Priola SA, Caughey B, Race RE, Chesebro B. Heterologous PrP molecules interfere with accumulation of protease-resistant PrP in scrapie-infected murine neuroblastoma cells. J Virol. 1994;68(8):4873–4878. doi: 10.1128/jvi.68.8.4873-4878.1994. [DOI] [PMC free article] [PubMed] [Google Scholar]
- 10.Telling GC, et al. Evidence for the conformation of the pathologic isoform of the prion protein enciphering and propagating prion diversity. Science. 1996;274(5295):2079–2082. doi: 10.1126/science.274.5295.2079. [DOI] [PubMed] [Google Scholar]
- 11.Lee RJ, Wang S, Low PS. Measurement of endosome pH following folate receptor-mediated endocytosis. Biochim Biophys Acta. 1996;1312(3):237–242. doi: 10.1016/0167-4889(96)00041-9. [DOI] [PubMed] [Google Scholar]
- 12.Shyng SL, Huber MT, Harris DA. A prion protein cycles between the cell surface and an endocytic compartment in cultured neuroblastoma cells. J Biol Chem. 1993;268(21):15922–15928. [PubMed] [Google Scholar]
- 13.Arnold JE, et al. The abnormal isoform of the prion protein accumulates in late-endosome-like organelles in scrapie-infected mouse brain. J Pathol. 1995;176(4):403–411. doi: 10.1002/path.1711760412. [DOI] [PubMed] [Google Scholar]
- 14.Borchelt DR, Taraboulos A, Prusiner SB. Evidence for synthesis of scrapie prion proteins in the endocytic pathway. J Biol Chem. 1992;267(23):16188–16199. [PubMed] [Google Scholar]
- 15.Benetti F, et al. Structural determinants in prion protein folding and stability. J Mol Biol. 2014;426(22):3796–3810. doi: 10.1016/j.jmb.2014.09.017. [DOI] [PubMed] [Google Scholar]
- 16.Gerum C, Silvers R, Wirmer-Bartoschek J, Schwalbe H. Unfolded-state structure and dynamics influence the fibril formation of human prion protein. Angew Chem Int Ed Engl. 2009;48(50):9452–9456. doi: 10.1002/anie.200903771. [DOI] [PubMed] [Google Scholar]
- 17.Kyriakis JM, Avruch J. Mammalian mitogen-activated protein kinase signal transduction pathways activated by stress and inflammation. Physiol Rev. 2001;81(2):807–869. doi: 10.1152/physrev.2001.81.2.807. [DOI] [PubMed] [Google Scholar]
- 18.Maiti NR, Surewicz WK. The role of disulfide bridge in the folding and stability of the recombinant human prion protein. J Biol Chem. 2001;276(4):2427–2431. doi: 10.1074/jbc.M007862200. [DOI] [PubMed] [Google Scholar]
- 19.Ning L, Guo J, Jin N, Liu H, Yao X. The role of Cys179-Cys214 disulfide bond in the stability and folding of prion protein: Insights from molecular dynamics simulations. J Mol Model. 2014;20(2):2106. doi: 10.1007/s00894-014-2106-y. [DOI] [PubMed] [Google Scholar]
- 20.Tompa P, Tusnády GE, Friedrich P, Simon I. The role of dimerization in prion replication. Biophys J. 2002;82(4):1711–1718. doi: 10.1016/S0006-3495(02)75523-9. [DOI] [PMC free article] [PubMed] [Google Scholar]
- 21.Dill KA, MacCallum JL. The protein-folding problem, 50 years on. Science. 2012;338(6110):1042–1046. doi: 10.1126/science.1219021. [DOI] [PubMed] [Google Scholar]
- 22.Krieger F, Fierz B, Bieri O, Drewello M, Kiefhaber T. Dynamics of unfolded polypeptide chains as model for the earliest steps in protein folding. J Mol Biol. 2003;332(1):265–274. doi: 10.1016/s0022-2836(03)00892-1. [DOI] [PubMed] [Google Scholar]
- 23.Kubelka J, Hofrichter J, Eaton WA. The protein folding ‘speed limit’. Curr Opin Struct Biol. 2004;14(1):76–88. doi: 10.1016/j.sbi.2004.01.013. [DOI] [PubMed] [Google Scholar]
- 24.Lapidus LJ. Exploring the top of the protein folding funnel by experiment. Curr Opin Struct Biol. 2013;23(1):30–35. doi: 10.1016/j.sbi.2012.10.003. [DOI] [PubMed] [Google Scholar]
- 25.Lapidus LJ, Eaton WA, Hofrichter J. Measuring the rate of intramolecular contact formation in polypeptides. Proc Natl Acad Sci USA. 2000;97(13):7220–7225. doi: 10.1073/pnas.97.13.7220. [DOI] [PMC free article] [PubMed] [Google Scholar]
- 26.Ahmad B, Chen Y, Lapidus LJ. Aggregation of α-synuclein is kinetically controlled by intramolecular diffusion. Proc Natl Acad Sci USA. 2012;109(7):2336–2341. doi: 10.1073/pnas.1109526109. [DOI] [PMC free article] [PubMed] [Google Scholar]
- 27.Borgia A, et al. Localizing internal friction along the reaction coordinate of protein folding by combining ensemble and single-molecule fluorescence spectroscopy. Nat Commun. 2012;3:1195. doi: 10.1038/ncomms2204. [DOI] [PMC free article] [PubMed] [Google Scholar]
- 28.Chung HS, Eaton WA. Single-molecule fluorescence probes dynamics of barrier crossing. Nature. 2013;502(7473):685–688. doi: 10.1038/nature12649. [DOI] [PMC free article] [PubMed] [Google Scholar]
- 29.Fierz B, et al. Loop formation in unfolded polypeptide chains on the picoseconds to microseconds time scale. Proc Natl Acad Sci USA. 2007;104(7):2163–2168. doi: 10.1073/pnas.0611087104. [DOI] [PMC free article] [PubMed] [Google Scholar]
- 30.Hagen SJ, Hofrichter J, Szabo A, Eaton WA. Diffusion-limited contact formation in unfolded cytochrome c: Estimating the maximum rate of protein folding. Proc Natl Acad Sci USA. 1996;93(21):11615–11617. doi: 10.1073/pnas.93.21.11615. [DOI] [PMC free article] [PubMed] [Google Scholar]
- 31.Möglich A, Joder K, Kiefhaber T. End-to-end distance distributions and intrachain diffusion constants in unfolded polypeptide chains indicate intramolecular hydrogen bond formation. Proc Natl Acad Sci USA. 2006;103(33):12394–12399. doi: 10.1073/pnas.0604748103. [DOI] [PMC free article] [PubMed] [Google Scholar]
- 32.Soranno A, et al. Quantifying internal friction in unfolded and intrinsically disordered proteins with single-molecule spectroscopy. Proc Natl Acad Sci USA. 2012;109(44):17800–17806. doi: 10.1073/pnas.1117368109. [DOI] [PMC free article] [PubMed] [Google Scholar]
- 33.Waldauer SA, Bakajin O, Lapidus LJ. Extremely slow intramolecular diffusion in unfolded protein L. Proc Natl Acad Sci USA. 2010;107(31):13713–13717. doi: 10.1073/pnas.1005415107. [DOI] [PMC free article] [PubMed] [Google Scholar]
- 34.Grupi A, Haas E. Segmental conformational disorder and dynamics in the intrinsically disordered protein α-synuclein and its chain length dependence. J Mol Biol. 2011;405(5):1267–1283. doi: 10.1016/j.jmb.2010.11.011. [DOI] [PubMed] [Google Scholar]
- 35.Lee JC, Langen R, Hummel PA, Gray HB, Winkler JR. Alpha-synuclein structures from fluorescence energy-transfer kinetics: Implications for the role of the protein in Parkinson’s disease. Proc Natl Acad Sci USA. 2004;101(47):16466–16471. doi: 10.1073/pnas.0407307101. [DOI] [PMC free article] [PubMed] [Google Scholar]
- 36.Neuweiler H, Schulz A, Böhmer M, Enderlein J, Sauer M. Measurement of submicrosecond intramolecular contact formation in peptides at the single-molecule level. J Am Chem Soc. 2003;125(18):5324–5330. doi: 10.1021/ja034040p. [DOI] [PubMed] [Google Scholar]
- 37.Chen Y, Parrini C, Taddei N, Lapidus LJ. Conformational properties of unfolded HypF-N. J Phys Chem B. 2009;113(50):16209–16213. doi: 10.1021/jp904189b. [DOI] [PubMed] [Google Scholar]
- 38.Singh VR, Kopka M, Chen Y, Wedemeyer WJ, Lapidus LJ. Dynamic similarity of the unfolded states of proteins L and G. Biochemistry. 2007;46(35):10046–10054. doi: 10.1021/bi700270j. [DOI] [PubMed] [Google Scholar]
- 39.Voelz VA, et al. Slow unfolded-state structuring in Acyl-CoA binding protein folding revealed by simulation and experiment. J Am Chem Soc. 2012;134(30):12565–12577. doi: 10.1021/ja302528z. [DOI] [PMC free article] [PubMed] [Google Scholar]
- 40.Voelz VA, Singh VR, Wedemeyer WJ, Lapidus LJ, Pande VS. Unfolded-state dynamics and structure of protein L characterized by simulation and experiment. J Am Chem Soc. 2010;132(13):4702–4709. doi: 10.1021/ja908369h. [DOI] [PMC free article] [PubMed] [Google Scholar]
- 41.Singh VR, Lapidus LJ. The intrinsic stiffness of polyglutamine peptides. J Phys Chem B. 2008;112(42):13172–13176. doi: 10.1021/jp805636p. [DOI] [PubMed] [Google Scholar]
- 42.Lapidus LJ. Understanding protein aggregation from the view of monomer dynamics. Mol Biosyst. 2013;9(1):29–35. doi: 10.1039/c2mb25334h. [DOI] [PMC free article] [PubMed] [Google Scholar]
- 43.Acharya S, et al. Molecular basis for preventing α-synuclein aggregation by a molecular tweezer. J Biol Chem. 2014;289(15):10727–10737. doi: 10.1074/jbc.M113.524520. [DOI] [PMC free article] [PubMed] [Google Scholar]
- 44.Ahmad B, Lapidus LJ. Curcumin prevents aggregation in α-synuclein by increasing reconfiguration rate. J Biol Chem. 2012;287(12):9193–9199. doi: 10.1074/jbc.M111.325548. [DOI] [PMC free article] [PubMed] [Google Scholar]
- 45.Acharya S, Saha S, Ahmad B, Lapidus LJ. Effects of Mutations on the Reconfiguration Rate of α-Synuclein. J Phys Chem B. 2015;119(50):15443–15450. doi: 10.1021/acs.jpcb.5b10136. [DOI] [PMC free article] [PubMed] [Google Scholar]
- 46.Khan MQ, et al. Prion disease susceptibility is affected by beta-structure folding propensity and local side-chain interactions in PrP. Proc Natl Acad Sci USA. 2010;107(46):19808–19813. doi: 10.1073/pnas.1005267107. [DOI] [PMC free article] [PubMed] [Google Scholar]
- 47.Gibbs CJ, Jr, Gajdusek DC. Experimental subacute spongiform virus encephalopathies in primates and other laboratory animals. Science. 1973;182(4107):67–68. doi: 10.1126/science.182.4107.67. [DOI] [PubMed] [Google Scholar]
- 48.Barlow RM, Rennie JC. The fate of ME7 scrapie infection in rats, guinea-pigs and rabbits. Res Vet Sci. 1976;21(1):110–111. [PubMed] [Google Scholar]
- 49.Zhou Z, et al. Fibril formation of the rabbit/human/bovine prion proteins. Biophys J. 2011;101(6):1483–1492. doi: 10.1016/j.bpj.2011.08.018. [DOI] [PMC free article] [PubMed] [Google Scholar]
- 50.Vorberg I, Groschup MH, Pfaff E, Priola SA. Multiple amino acid residues within the rabbit prion protein inhibit formation of its abnormal isoform. J Virol. 2003;77(3):2003–2009. doi: 10.1128/JVI.77.3.2003-2009.2003. [DOI] [PMC free article] [PubMed] [Google Scholar]
- 51.Karapetyan YE, et al. Unique drug screening approach for prion diseases identifies tacrolimus and astemizole as antiprion agents. Proc Natl Acad Sci USA. 2013;110(17):7044–7049. doi: 10.1073/pnas.1303510110. [DOI] [PMC free article] [PubMed] [Google Scholar]
- 52.Jenkins DC, et al. Rapid folding of the prion protein captured by pressure-jump. Eur Biophys J. 2009;38(5):625–635. doi: 10.1007/s00249-009-0420-6. [DOI] [PMC free article] [PubMed] [Google Scholar]
- 53.Szabo A, Schulten K, Schulten Z. First passage time approach to diffusion controlled reactions. J Chem Phys. 1980;72:4350–4357. [Google Scholar]
- 54.Chen Y, Wedemeyer WJ, Lapidus LJ. A general polymer model of unfolded proteins under folding conditions. J Phys Chem B. 2010;114(48):15969–15975. doi: 10.1021/jp104746g. [DOI] [PubMed] [Google Scholar]
- 55.Apetri AC, Maki K, Roder H, Surewicz WK. Early intermediate in human prion protein folding as evidenced by ultrarapid mixing experiments. J Am Chem Soc. 2006;128(35):11673–11678. doi: 10.1021/ja063880b. [DOI] [PMC free article] [PubMed] [Google Scholar]
- 56.Honda RP, Yamaguchi K, Kuwata K. Acid-induced molten globule state of a prion protein: Crucial role of Strand 1-Helix 1-Strand 2 segment. J Biol Chem. 2014;289(44):30355–30363. doi: 10.1074/jbc.M114.559450. [DOI] [PMC free article] [PubMed] [Google Scholar]
- 57.Hosszu LL, et al. Conformational properties of beta-PrP. J Biol Chem. 2009;284(33):21981–21990. doi: 10.1074/jbc.M809173200. [DOI] [PMC free article] [PubMed] [Google Scholar]
- 58.O’Sullivan DB, et al. NMR characterization of the pH 4 beta-intermediate of the prion protein: The N-terminal half of the protein remains unstructured and retains a high degree of flexibility. Biochem J. 2007;401(2):533–540. doi: 10.1042/BJ20060668. [DOI] [PMC free article] [PubMed] [Google Scholar]
- 59.Yu H, et al. Protein misfolding occurs by slow diffusion across multiple barriers in a rough energy landscape. Proc Natl Acad Sci USA. 2015;112(27):8308–8313. doi: 10.1073/pnas.1419197112. [DOI] [PMC free article] [PubMed] [Google Scholar]
- 60.Yu H, et al. Energy landscape analysis of native folding of the prion protein yields the diffusion constant, transition path time, and rates. Proc Natl Acad Sci USA. 2012;109(36):14452–14457. doi: 10.1073/pnas.1206190109. [DOI] [PMC free article] [PubMed] [Google Scholar]
- 61.Baskakov IV, Legname G, Prusiner SB, Cohen FE. Folding of prion protein to its native alpha-helical conformation is under kinetic control. J Biol Chem. 2001;276(23):19687–19690. doi: 10.1074/jbc.C100180200. [DOI] [PubMed] [Google Scholar]
- 62.Zahn R, von Schroetter C, Wüthrich K. Human prion proteins expressed in Escherichia coli and purified by high-affinity column refolding. FEBS Lett. 1997;417(3):400–404. doi: 10.1016/s0014-5793(97)01330-6. [DOI] [PubMed] [Google Scholar]
- 63.Lapidus LJ, Eaton WA, Hofrichter J. Dynamics of intramolecular contact formation in polypeptides: Distance dependence of quenching rates in a room-temperature glass. Phys Rev Lett. 2001;87(25):258101. doi: 10.1103/PhysRevLett.87.258101. [DOI] [PubMed] [Google Scholar]


